Pay vs Performance Disclosure - USD ($)
|
12 Months Ended |
Dec. 31, 2025 |
Dec. 31, 2024 |
Dec. 31, 2023 |
| Pay vs Performance Disclosure |
|
|
|
| Pay vs Performance Disclosure, Table |
| | | | | | | | | | | | | | | | | | | | | | | | | | | Fiscal Year | Summary Compensation Table Total for PEO(1) ($) | Compensation Actually Paid to PEO(2) ($) | Average Summary Compensation Table Total for non-PEO NEOs(1) ($) | Average Compensation Actually Paid to non-PEO NEOs(2) ($) | Value of Initial Fixed $100 Investment Based On: | Net Income (Loss) Attributable to Pagaya Technologies Ltd.(4) (millions) ($) | Adjusted EBITDA(5) (millions) ($) | Pagaya TSR(3) ($) | Peer Group TSR(3) ($) | | 2025 | 6,019,560 | | 16,649,537 | | 3,058,528 | 12,260,459 | | 140.45 | 140.92 | 81.39 | | 370.99 | | 2024 | 4,704,773 | | (2,073,913) | | 4,586,649 | (101,707) | | 62.43 | 126.62 | (401.41) | | 210.38 | | | 2023 | 3,650,000 | 5,485,351 | | 2,376,500 | 3,367,065 | | 111.29 | 115.09 | (128.44) | | 82.02 | |
|
|
|
| Company Selected Measure Name |
Adjusted EBITDA
|
|
|
| Named Executive Officers, Footnote |
Compensation for our PEO, Mr. Krubiner, reflects the amounts reported in the “Summary Compensation Table” for the respective years. Average compensation for non-PEO named executive officers includes the following individuals: (i) in 2025, Evangelos Perros, Sanjiv Das, Tami Rosen and Avital Pardo, (ii) in 2024, Avital Pardo, Sanjiv Das, Evangelos Perros and Tami Rosen; and (iii) in 2023, Ashok Vaswani, Tami Rosen, Michael Kurlander and Amol Naik.
|
|
|
| Peer Group Issuers, Footnote |
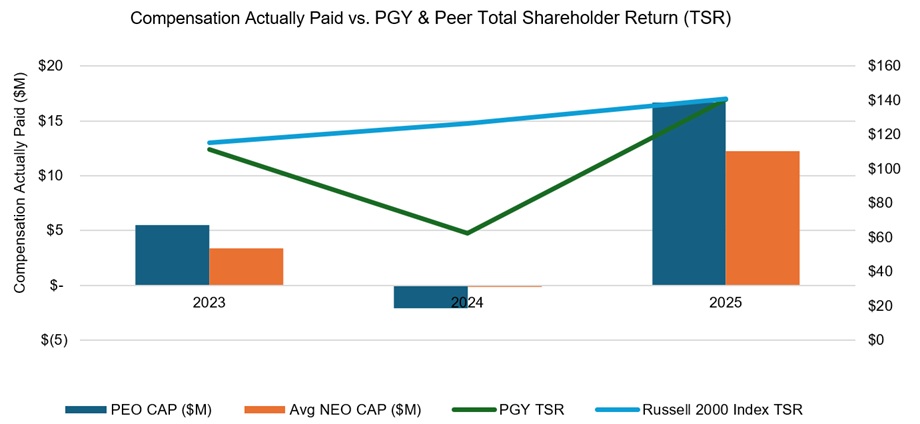
Represents the cumulative TSR on our Class A Ordinary Shares and the cumulative TSR on the Russell 2000 Index (the “Peer Group TSR”), which is the same peer group used for the Stock Performance Graph included in the Company’s Annual Report on Form 10-K filed with the Securities and Exchange Commission on March 2, 2026, through December 31, 2023, 2024 and 2025. TSR is cumulative for the measurement periods beginning on December 31, 2022 and ending on December 31 of each of 2025, 2024 and 2023, calculated in accordance with Item 201(e) of Regulation S-K. The peer group for purposes of this table is Russel 2000 Index.
|
|
|
| PEO Total Compensation Amount |
$ 6,019,560
|
$ 4,704,773
|
$ 3,650,000
|
| PEO Actually Paid Compensation Amount |
$ 16,649,537
|
(2,073,913)
|
5,485,351
|
| Adjustment To PEO Compensation, Footnote |
In 2025, the Compensation Actually Paid for the PEO and average Compensation Actually Paid for our non-PEO named executive officers reflects the respective amounts set forth in columns (b) and (d), adjusted in accordance with SEC rules as set forth in the table below. These dollar amounts do not reflect the actual amount of compensation earned by or paid to the PEO and our non-PEO named executive officers during the applicable year. For information regarding the decisions made by our Compensation Committee with respect to our named executive officers’ compensation for fiscal year 2025, see the “Compensation Discussion and Analysis” included in Company’s Annual Report on Form 10-K/A filed with the Securities and Exchange Commission on April 30, 2026. Fair values set forth in the table below are computed in accordance with ASC 718 as of the end of the respective fiscal year, other than fair values of awards that vest in the covered year, which are valued as of the applicable vesting year. | | | | | | | | | | PEO | Non-PEO NEOs | | Summary Compensation Table Total | 6,019,560 | | 3,058,528 | | | - Grant Date Fair Value of Option Awards and Stock Awards Granted in FY | — | | (1,229,000) | | | + Fair Value at FYE of Outstanding and Unvested Option Awards and Stock Awards Granted in FY | — | | 1,567,500 | | | + Change in Fair Value of Outstanding and Unvested Option Awards and Stock Awards Granted in Prior FYs (from prior FYE to current FYE) | 10,629,977 | | 5,929,230 | | | + Fair Value at Vesting of Option Awards and Stock Awards Granted in FY That Vested During FY | — | | 1,212,300 | | | + Change in Fair Value as of Vesting Date of Option Awards and Stock Awards Granted in Prior FYs For Which Applicable Vesting Conditions Were Satisfied During FY | — | | 1,721,901 | | | - Fair Value as of Prior FYE of Option Awards and Stock Awards Granted in Prior FYs That Failed to Meet Applicable Vesting Conditions During FY | — | | — | | | Compensation Actually Paid | 16,649,537 | | 12,260,459 | |
|
|
|
| Non-PEO NEO Average Total Compensation Amount |
$ 3,058,528
|
4,586,649
|
2,376,500
|
| Non-PEO NEO Average Compensation Actually Paid Amount |
$ 12,260,459
|
(101,707)
|
3,367,065
|
| Adjustment to Non-PEO NEO Compensation Footnote |
In 2025, the Compensation Actually Paid for the PEO and average Compensation Actually Paid for our non-PEO named executive officers reflects the respective amounts set forth in columns (b) and (d), adjusted in accordance with SEC rules as set forth in the table below. These dollar amounts do not reflect the actual amount of compensation earned by or paid to the PEO and our non-PEO named executive officers during the applicable year. For information regarding the decisions made by our Compensation Committee with respect to our named executive officers’ compensation for fiscal year 2025, see the “Compensation Discussion and Analysis” included in Company’s Annual Report on Form 10-K/A filed with the Securities and Exchange Commission on April 30, 2026. Fair values set forth in the table below are computed in accordance with ASC 718 as of the end of the respective fiscal year, other than fair values of awards that vest in the covered year, which are valued as of the applicable vesting year. | | | | | | | | | | PEO | Non-PEO NEOs | | Summary Compensation Table Total | 6,019,560 | | 3,058,528 | | | - Grant Date Fair Value of Option Awards and Stock Awards Granted in FY | — | | (1,229,000) | | | + Fair Value at FYE of Outstanding and Unvested Option Awards and Stock Awards Granted in FY | — | | 1,567,500 | | | + Change in Fair Value of Outstanding and Unvested Option Awards and Stock Awards Granted in Prior FYs (from prior FYE to current FYE) | 10,629,977 | | 5,929,230 | | | + Fair Value at Vesting of Option Awards and Stock Awards Granted in FY That Vested During FY | — | | 1,212,300 | | | + Change in Fair Value as of Vesting Date of Option Awards and Stock Awards Granted in Prior FYs For Which Applicable Vesting Conditions Were Satisfied During FY | — | | 1,721,901 | | | - Fair Value as of Prior FYE of Option Awards and Stock Awards Granted in Prior FYs That Failed to Meet Applicable Vesting Conditions During FY | — | | — | | | Compensation Actually Paid | 16,649,537 | | 12,260,459 | |
|
|
|
| Compensation Actually Paid vs. Total Shareholder Return |
Relationship Between PEO and Other NEO Compensation Actually Paid and Company and Peer Group TSR
|
|
|
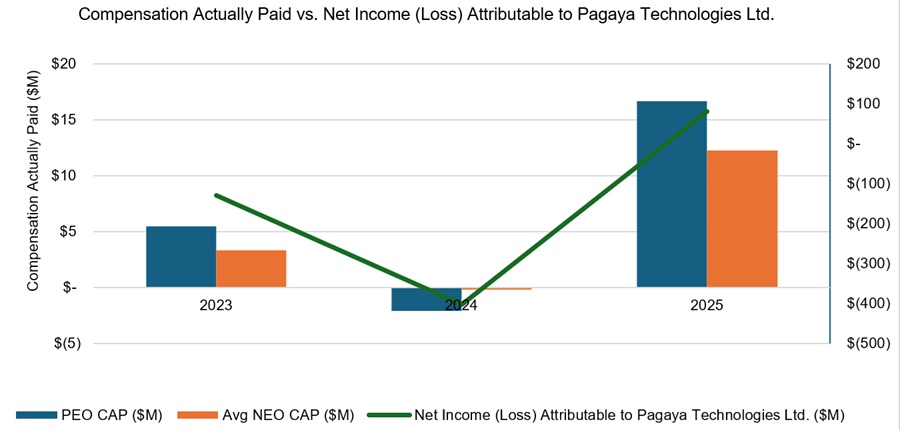
| Compensation Actually Paid vs. Net Income |
Relationship Between PEO and Other NEO Compensation Actually Paid and Net Income (Loss) Attributable to Pagaya Technologies Ltd.
|
|
|
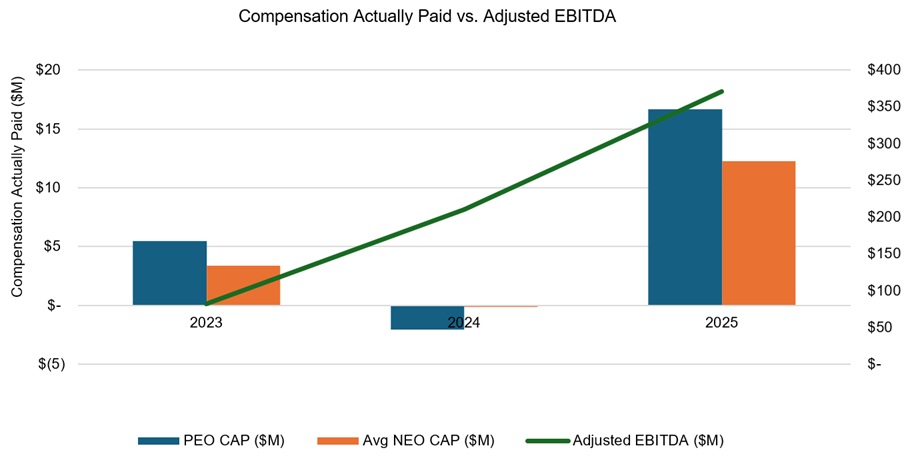
| Compensation Actually Paid vs. Company Selected Measure |
Relationship Between PEO and Other NEO Compensation Actually Paid and Adjusted EBITDA
|
|
|
| Total Shareholder Return Vs Peer Group |
Relationship Between PEO and Other NEO Compensation Actually Paid and Company and Peer Group TSR
|
|
|
| Tabular List, Table |
| | | | Performance Measures | Adjusted EBITDA(1) | | Total Revenue and Other Income | | GAAP Net Income |
|
|
|
| Total Shareholder Return Amount |
$ 140.45
|
62.43
|
111.29
|
| Peer Group Total Shareholder Return Amount |
140.92
|
126.62
|
115.09
|
| Net Income (Loss) |
$ 81,390,000
|
$ (401,410,000)
|
$ (128,440,000)
|
| Company Selected Measure Amount |
370,990,000
|
210,380,000
|
82,020,000.00
|
| PEO Name |
Mr. Krubiner
|
|
|
| Additional 402(v) Disclosure |
The following table sets forth the compensation for our principal executive officer (“PEO”) and the average compensation for our non-PEO named executive officers, both as reported in the Summary Compensation Table and with certain adjustments to reflect the “Compensation Actually Paid” or “CAP” to such individuals, as defined under Item 402(v) of Regulation S-K, for each of 2025, 2024 and 2023. The table also provides information on our cumulative total shareholder return (“TSR”), the cumulative TSR of our peer group, our Net Income (Loss) Attributable to Pagaya Technologies Ltd. and our Adjusted EBITDA. We selected Adjusted EBITDA as our most important performance measure used to link CAP to our Chief Executive Officer and other named executive officers. Reflects “Net Income (Loss) Attributable to Pagaya Technologies Ltd.” in the Company’s Consolidated Statements of Operations included in the Company’s Annual Report on Form 10-K filed with the Securities and Exchange Commission on March 2, 2026, for each of the years ended December 31, 2025, 2024 and 2023.The following table sets forth an unranked list of the performance measures which we view as the “most important” measures for linking our named executive officers’ compensation to performance, as specifically listed below: (1) Adjusted EBITDA is not a financial measure prepared in accordance with GAAP. For a reconciliation of Adjusted EBITDA to Net Income (Loss) Attributable to Pagaya Technologies Ltd., its most directly comparable GAAP financial measure, please refer to “Appendix A—Reconciliation of Non-GAAP Financial Measures” in this Proxy Statement. The following charts set forth the relationship between Compensation Actually Paid to our PEO and the average Compensation Actually Paid to our other named executive officers with (i) the Company’s cumulative TSR and the Company’s peer group TSR, (ii) Net Income (Loss) Attributable to Pagaya Technologies Ltd. and (iii) Adjusted EBITDA, for the three most recently completed fiscal years. Further information about the factors used to determine compensation levels can be found in the “Compensation Discussion and Analysis” included in Company’s Annual Report on Form 10-K/A filed with the Securities and Exchange Commission on April 30, 2026.
|
|
|
| Measure:: 1 |
|
|
|
| Pay vs Performance Disclosure |
|
|
|
| Name |
Adjusted EBITDA
|
|
|
| Non-GAAP Measure Description |
Adjusted EBITDA is not a financial measure prepared in accordance with GAAP. For a reconciliation of Adjusted EBITDA to Net Income (Loss) Attributable to Pagaya Technologies Ltd., its most directly comparable GAAP financial measure, please refer to “Appendix A—Reconciliation of Non-GAAP Financial Measures” in this Proxy Statement.
|
|
|
| Measure:: 2 |
|
|
|
| Pay vs Performance Disclosure |
|
|
|
| Name |
Total Revenue and Other Income
|
|
|
| Measure:: 3 |
|
|
|
| Pay vs Performance Disclosure |
|
|
|
| Name |
GAAP Net Income
|
|
|
| PEO | Aggregate Grant Date Fair Value of Equity Award Amounts Reported in Summary Compensation Table |
|
|
|
| Pay vs Performance Disclosure |
|
|
|
| Adjustment to Compensation, Amount |
$ 0
|
|
|
| PEO | Year-end Fair Value of Equity Awards Granted in Covered Year that are Outstanding and Unvested |
|
|
|
| Pay vs Performance Disclosure |
|
|
|
| Adjustment to Compensation, Amount |
0
|
|
|
| PEO | Year-over-Year Change in Fair Value of Equity Awards Granted in Prior Years That are Outstanding and Unvested |
|
|
|
| Pay vs Performance Disclosure |
|
|
|
| Adjustment to Compensation, Amount |
10,629,977
|
|
|
| PEO | Vesting Date Fair Value of Equity Awards Granted and Vested in Covered Year |
|
|
|
| Pay vs Performance Disclosure |
|
|
|
| Adjustment to Compensation, Amount |
0
|
|
|
| PEO | Change in Fair Value as of Vesting Date of Prior Year Equity Awards Vested in Covered Year |
|
|
|
| Pay vs Performance Disclosure |
|
|
|
| Adjustment to Compensation, Amount |
0
|
|
|
| PEO | Prior Year End Fair Value of Equity Awards Granted in Any Prior Year that Fail to Meet Applicable Vesting Conditions During Covered Year |
|
|
|
| Pay vs Performance Disclosure |
|
|
|
| Adjustment to Compensation, Amount |
0
|
|
|
| Non-PEO NEO | Aggregate Grant Date Fair Value of Equity Award Amounts Reported in Summary Compensation Table |
|
|
|
| Pay vs Performance Disclosure |
|
|
|
| Adjustment to Compensation, Amount |
(1,229,000)
|
|
|
| Non-PEO NEO | Year-end Fair Value of Equity Awards Granted in Covered Year that are Outstanding and Unvested |
|
|
|
| Pay vs Performance Disclosure |
|
|
|
| Adjustment to Compensation, Amount |
1,567,500
|
|
|
| Non-PEO NEO | Year-over-Year Change in Fair Value of Equity Awards Granted in Prior Years That are Outstanding and Unvested |
|
|
|
| Pay vs Performance Disclosure |
|
|
|
| Adjustment to Compensation, Amount |
5,929,230
|
|
|
| Non-PEO NEO | Vesting Date Fair Value of Equity Awards Granted and Vested in Covered Year |
|
|
|
| Pay vs Performance Disclosure |
|
|
|
| Adjustment to Compensation, Amount |
1,212,300
|
|
|
| Non-PEO NEO | Change in Fair Value as of Vesting Date of Prior Year Equity Awards Vested in Covered Year |
|
|
|
| Pay vs Performance Disclosure |
|
|
|
| Adjustment to Compensation, Amount |
1,721,901
|
|
|
| Non-PEO NEO | Prior Year End Fair Value of Equity Awards Granted in Any Prior Year that Fail to Meet Applicable Vesting Conditions During Covered Year |
|
|
|
| Pay vs Performance Disclosure |
|
|
|
| Adjustment to Compensation, Amount |
$ 0
|
|
|