Pay vs Performance Disclosure - USD ($)
Mar. 31, 2026
Mar. 31, 2025
Mar. 31, 2024
Pay Versus Performance
Fiscal Year(1) (a) | Summary Compensation Table Total for PEO(2) (b) | Compensation Actually Paid to PEO(2)(3)(4) (c) | Average Summary Compensation Table Total for Non-PEO NEOs(5) (d) | Average Compensation Actually Paid to Non-PEO NEOs(3)(4)(5) (e) | Value of Initial Fixed $100 Investment in Pyxus International, Inc.(6) (f) | Net Income(7) (in millions) (h) | ||||||||||||||
| 2026 | $1,824,891 | $1,434,291 | $926,302 | $802,948 | $228.33 | $15.7 | ||||||||||||||
| 2025 | $3,639,225 | $3,794,225 | $1,418,815 | $1,467,765 | $333.33 | $15.2 | ||||||||||||||
| 2024 | $2,346,256 | $2,432,656 | $1,174,407 | $1,212,507 | $250.00 | $2.7 | ||||||||||||||
| 2026 | ||||||||
| PEO ($) | Average Non-PEO NEOs ($) | |||||||
| Total Compensation from Summary Compensation Table | 1,824,891 | 926,302 | ||||||
| Adjustments | ||||||||
| Adjustment for grant date values in the Summary Compensation Table | — | — | ||||||
| Year-end fair value of unvested awards granted in the current year | — | — | ||||||
| Year-over-year difference of year-end fair values for unvested awards granted in prior years | (390,600) | (123,354) | ||||||
| Fair values at vest date for awards granted and vested in current year | — | — | ||||||
| Difference in fair values between prior year-end fair values and vest date fair values for awards granted in prior years that vested in current year | — | — | ||||||
| Forfeitures during current year equal to prior year-end fair value | — | — | ||||||
| Dividends or dividend equivalents not otherwise included in the total compensation | — | — | ||||||
| Total Adjustments | (390,600) | (123,354) | ||||||
| Compensation Actually Paid (as calculated) | 1,434,291 | 802,948 | ||||||
(4) Equity valuations assumptions for calculating Compensation Actually Paid are not materially different from grant date valuation assumptions.
(5) The Non-PEO NEOs for fiscal years 2026 and 2025 were Dustin L. Styons and Scott A. Burmeister; and for fiscal year 2024 were Flavia B. Landsberg and Scott A. Burmeister.
(6) Such amount represents Pyxus’ cumulative total shareholder return (“TSR”) for the period beginning on the last trading day of the year preceding the earliest year presented in the table and ending the last trading day of the fiscal year presented in the table. For the three fiscal years presented, the TSR calculation assumes an investment of $100 in Pyxus common stock made on March 31, 2023 and reports the value of that investment as of March 31, 2024, 2025, and 2026, respectively.
(7) Such amount is the net income attributable to Pyxus International, Inc.
| 2026 | ||||||||
| PEO ($) | Average Non-PEO NEOs ($) | |||||||
| Total Compensation from Summary Compensation Table | 1,824,891 | 926,302 | ||||||
| Adjustments | ||||||||
| Adjustment for grant date values in the Summary Compensation Table | — | — | ||||||
| Year-end fair value of unvested awards granted in the current year | — | — | ||||||
| Year-over-year difference of year-end fair values for unvested awards granted in prior years | (390,600) | (123,354) | ||||||
| Fair values at vest date for awards granted and vested in current year | — | — | ||||||
| Difference in fair values between prior year-end fair values and vest date fair values for awards granted in prior years that vested in current year | — | — | ||||||
| Forfeitures during current year equal to prior year-end fair value | — | — | ||||||
| Dividends or dividend equivalents not otherwise included in the total compensation | — | — | ||||||
| Total Adjustments | (390,600) | (123,354) | ||||||
| Compensation Actually Paid (as calculated) | 1,434,291 | 802,948 | ||||||
(4) Equity valuations assumptions for calculating Compensation Actually Paid are not materially different from grant date valuation assumptions.
(5) The Non-PEO NEOs for fiscal years 2026 and 2025 were Dustin L. Styons and Scott A. Burmeister; and for fiscal year 2024 were Flavia B. Landsberg and Scott A. Burmeister.
(6) Such amount represents Pyxus’ cumulative total shareholder return (“TSR”) for the period beginning on the last trading day of the year preceding the earliest year presented in the table and ending the last trading day of the fiscal year presented in the table. For the three fiscal years presented, the TSR calculation assumes an investment of $100 in Pyxus common stock made on March 31, 2023 and reports the value of that investment as of March 31, 2024, 2025, and 2026, respectively.
(7) Such amount is the net income attributable to Pyxus International, Inc.
The following charts present the relationship for the periods presented in the foregoing table between the Compensation Actually Paid for the PEO and the average Compensation Actually Paid for the Non-PEO NEOs and each of the Company’s TSR and net income attributable to Pyxus International, Inc.
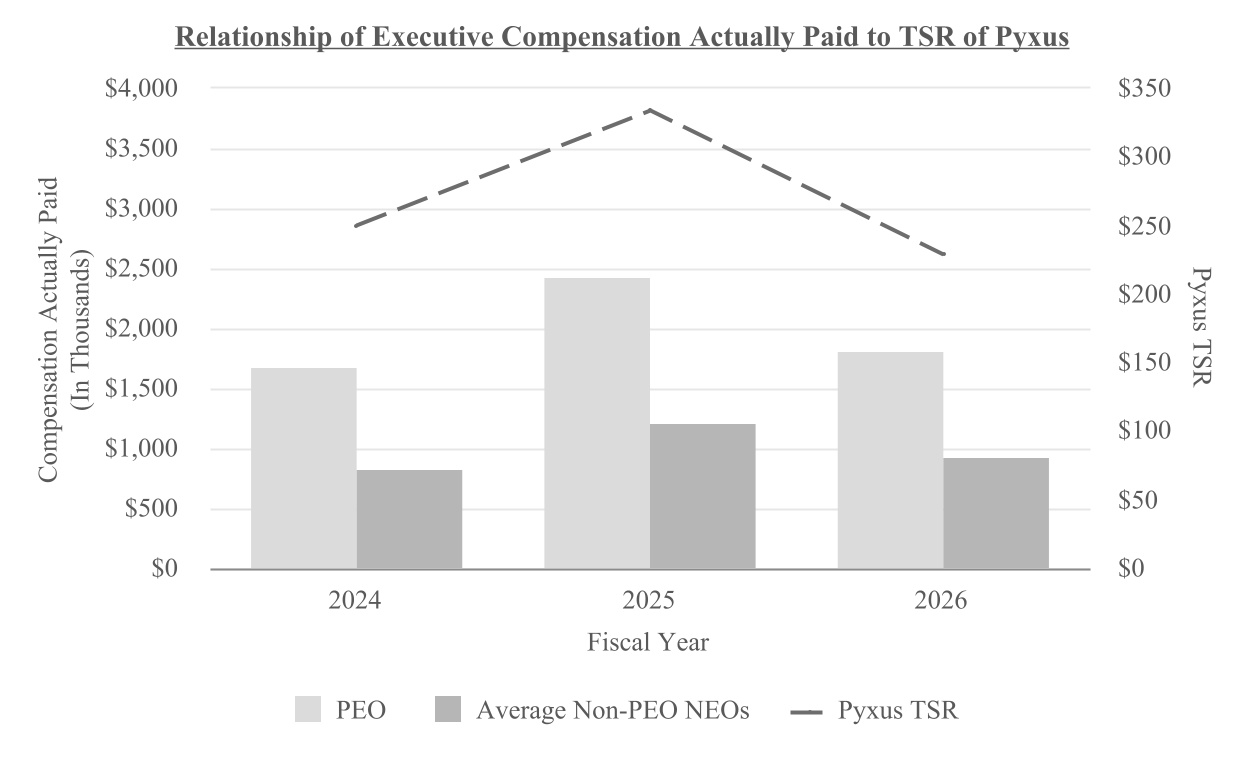
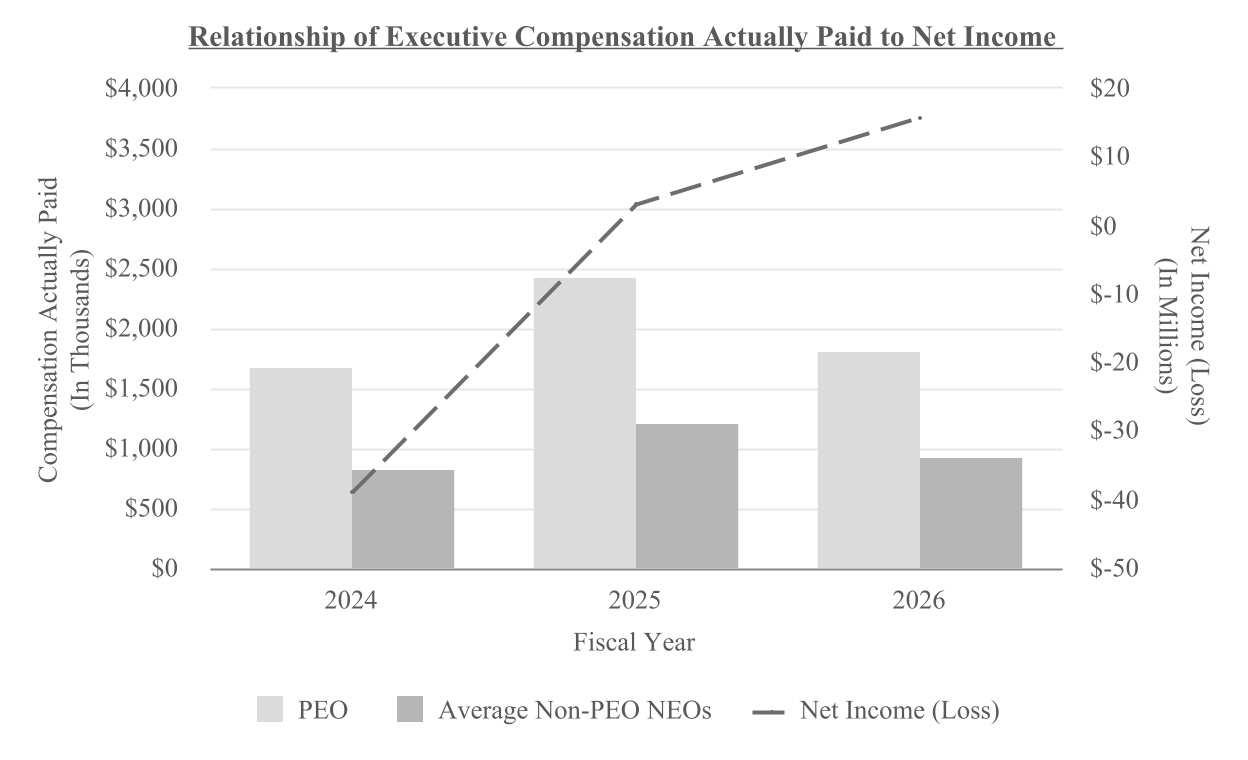
The following charts present the relationship for the periods presented in the foregoing table between the Compensation Actually Paid for the PEO and the average Compensation Actually Paid for the Non-PEO NEOs and each of the Company’s TSR and net income attributable to Pyxus International, Inc.