Shareholder Report
Apr. 30, 2026
USD ($)
Holding
This report describes changes to the Fund that occurred during the reporting period.
Fund Expenses for the Last Year
(Based on a hypothetical $10,000 investment)
| Fund | Cost of a $10,000 Investment | Cost Paid as a Percentage of a $10,000 Investment1 | |||
| Morningstar U.S. Equity Fund | $93 | 0.84% |
|
1
|
Reflects Fee Waivers and/or Expense Assumptions, without which expenses would have been higher.
|
Management’s Discussion of Fund Performance
SUMMARY OF RESULTS
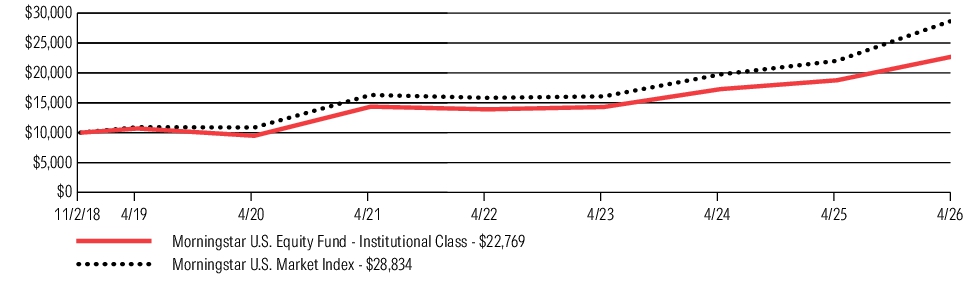
Morningstar U.S. Equity Fund (Institutional/MSTQX) returned 21.34% for the 12 months ended April 30, 2026. The Fund underperformed its benchmark, the Morningstar U.S. Market Index, which returned 30.96%.
TOP PERFORMANCE CONTRIBUTORS
An underweight to the Consumer Discretionary sector, and favorable selection within that sector, positively impacted relative returns in the period.
TOP PERFORMANCE DETRACTORS
Information Technology was the largest detractor. The Fund was underweight this sector, which performed strongly. Selection within the sector further detracted from returns.
Selection within the Industrials sector detracted from performance. Underweights to Caterpillar and GE Vernova, and an overweight to Casella Waste Systems, were the largest single-stock detractors within Industrials.
Within Communication Services, an underweight to Alphabet and an overweight to Meta led to that sector detracting for the period.
Fund Performance
The following graph and chart compare the initial and subsequent account values at the end of each of the completed fiscal years of the Fund since its inception on November 2, 2018. Fund performance figures may reflect fee waivers and/or expense reimbursements, without which the performance would have been lower.
GROWTH OF $10,000
| AVERAGE ANNUAL TOTAL RETURNS | 1 Year | 5 Year | Since Inception |
| Morningstar U.S. Equity Fund | 21.34% | 9.67% | 11.61% |
| Morningstar U.S. Market Index | 30.96% | 12.08% | 15.19% |
Key Fund Statistics as of April 30, 2026
The following table outlines key fund statistics that you should pay attention to.
| Fund net assets | $1,869,062,458 |
| Total number of portfolio holdings | 394 |
| Total advisory fees paid (after waiver/reimbursement) | $11,747,621 |
| Portfolio turnover rate | 71% |
Graphical Representation of Holdings as of April 30, 2026
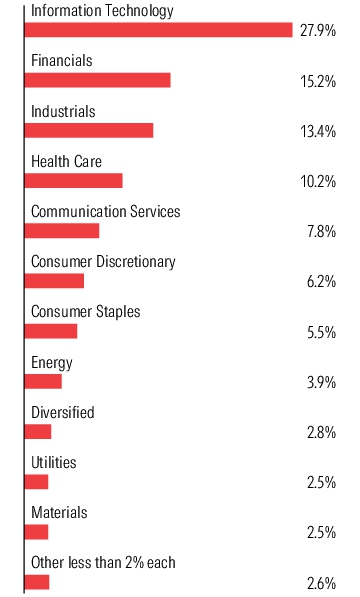
The tables below show the investment makeup of the Fund, representing a percentage of the total net assets of the Fund.
Asset Type Allocation
| Common Stocks | 96.6% |
| Investment Companies | 2.8% |
| Short-Term Investments | 1.1% |
Sector Allocation
Material Fund Changes
Effective September 15, 2025 Diamond Hill Capital Management, Inc. and Westwood Management Corp. were terminated as subadvisers to the Fund.
The above is a summary of material changes to the Fund since April 30, 2025. For more complete information, you may review the Fund's next prospectus, which we expect to be available by August 31, 2026 at https://connect.rightprospectus.com/Morningstar, or upon request at 877-626-3224.
The above is a summary of material changes to the Fund since April 30, 2025. For more complete information, you may review the Fund's next prospectus, which we expect to be available by August 31, 2026 at https://connect.rightprospectus.com/Morningstar, or upon request at 877-626-3224.
Fund Expenses for the Last Year
(Based on a hypothetical $10,000 investment)
| Fund | Cost of a $10,000 Investment | Cost Paid as a Percentage of a $10,000 Investment1 | |||
| Morningstar International Equity Fund | $113 | 0.99% |
|
1
|
Reflects Fee Waivers and/or Expense Assumptions, without which expenses would have been higher.
|
Management’s Discussion of Fund Performance
SUMMARY OF RESULTS
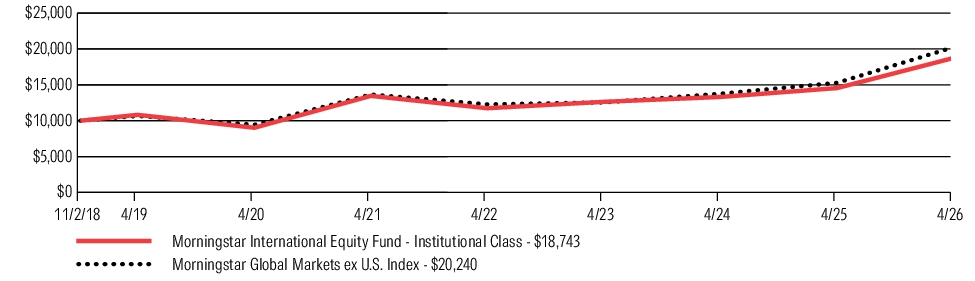
Morningstar International Equity Fund (Institutional/MSTFX) returned 28.82% for the 12 months ended April 30, 2026. The Fund underperformed its benchmark, the Morningstar Global Market ex U.S., which returned 32.46%.
TOP PERFORMANCE CONTRIBUTORS
The Information Technology sector contributed to relative performance for the period. The Fund was overweight a strongly performing sector and selection within the sector was favorable.
An underweight to India helped relative performance as that country’s returns trailed that of the benchmark.
The Energy sector was a meaningful contributor to returns. Selection within the sector was the main reason for the contribution. A small overweight to Energy provided additional benefits.
TOP PERFORMANCE DETRACTORS
Stock selection within Japan was a salient detractor for the period. Among overweight positions that hurt relative performance were Chugai Pharmaceuticals, Sysmex and Sony.
The Health Care sector negatively affected results for the period. Both an overweight allocation to an underperforming sector and selection within the sector were unfavorable.
An overweight allocation to Consumer Staples, which trailed the Fund’s benchmark, detracted from relative returns during the period.
Fund Performance
The following graph and chart compare the initial and subsequent account values at the end of each of the completed fiscal years of the Fund since its inception on November 2, 2018. Fund performance figures may reflect fee waivers and/or expense reimbursements, without which the performance would have been lower.
GROWTH OF $10,000
| AVERAGE ANNUAL TOTAL RETURNS | 1 Year | 5 Year | Since Inception |
| Morningstar International Equity Fund | 28.82% | 6.85% | 8.75% |
| Morningstar Global Markets ex U.S. Index | 32.46% | 8.20% | 9.87% |
Key Fund Statistics as of April 30, 2026
The following table outlines key fund statistics that you should pay attention to.
| Fund net assets | $1,015,444,606 |
| Total number of portfolio holdings | 411 |
| Total advisory fees paid (after waiver/reimbursement) | $7,376,182 |
| Portfolio turnover rate | 96% |
Graphical Representation of Holdings as of April 30, 2026
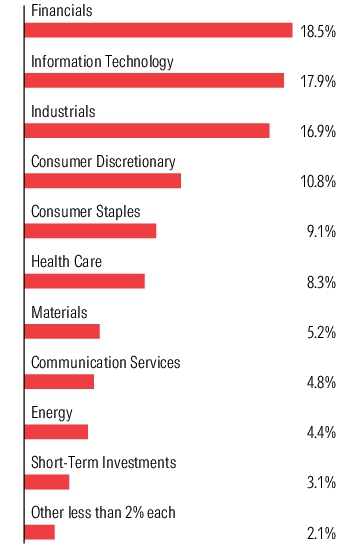
The tables below show the investment makeup of the Fund, representing a percentage of the total net assets of the Fund.
Asset Type Allocation
| Common Stocks | 97.2% |
| Short-Term Investments | 3.1% |
| Other less than 2% each | 0.8% |
Sector Allocation
Region Diversification
Fund Expenses for the Last Year
(Based on a hypothetical $10,000 investment)
| Fund | Cost of a $10,000 Investment | Cost Paid as a Percentage of a $10,000 Investment1 | |||
| Morningstar Global Income Fund | $79 | 0.73% |
|
1
|
Reflects Fee Waivers and/or Expense Assumptions, without which expenses would have been higher.
|
Management’s Discussion of Fund Performance
SUMMARY OF RESULTS
Morningstar Global Income Fund (Institutional/MSTGX) returned 15.13% for the 12 months ended April 30, 2026. The Fund underperformed its benchmark, the Morningstar Global Income Blended Index, which returned 16.45%.
TOP PERFORMANCE CONTRIBUTORS
International Dividend Equity: An overweight position to International equities was a tailwind.
U.S. Dividend Equity: The Fund’s exposure to U.S. dividend equities contributed to relative results.
U.S. High Yield Bonds: The Fund’s overweight to below investment grade credit benefited results.
TOP PERFORMANCE DETRACTORS
Intermediate-term Treasury: The Fund’s position in U.S. Intermediate-term Treasury hurt benchmark relative results.
Long-term Treasury: The Fund’s allocation to U.S. Long-term Treasury detracted from portfolio returns.
REITs: An overweight position in U.S. REITs detracted from portfolio returns.
Fund Performance
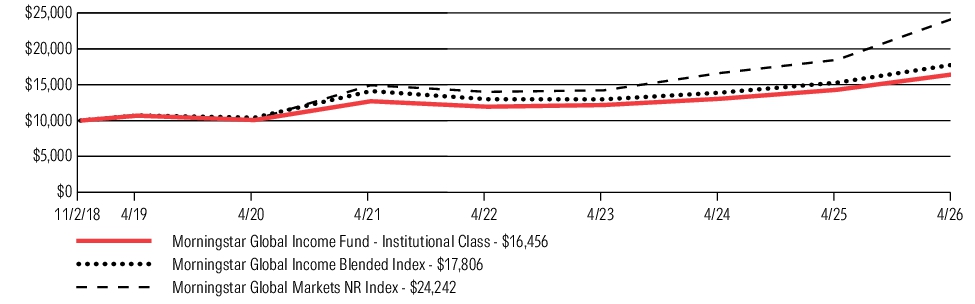
The following graph and chart compare the initial and subsequent account values at the end of each of the completed fiscal years of the Fund since its inception on November 2, 2018. Fund performance figures may reflect fee waivers and/or expense reimbursements, without which the performance would have been lower.
GROWTH OF $10,000
| AVERAGE ANNUAL TOTAL RETURNS | 1 Year | 5 Year | Since Inception |
| Morningstar Global Income Fund | 15.13% | 5.33% | 6.88% |
| Morningstar Global Income Blended Index | 16.45% | 4.76% | 8.01% |
| Morningstar Global Markets NR Index | 31.26% | 10.18% | 12.55% |
Key Fund Statistics as of April 30, 2026
The following table outlines key fund statistics that you should pay attention to.
| Fund net assets | $145,927,235 |
| Total number of portfolio holdings | 564 |
| Total advisory fees paid (after waiver/reimbursement) | $386,116 |
| Portfolio turnover rate | 67% |
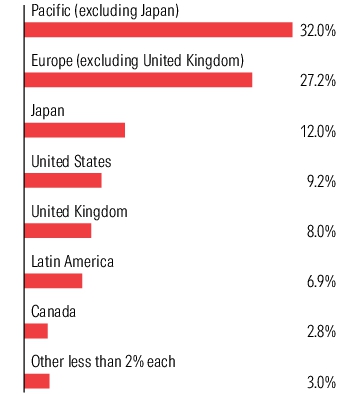
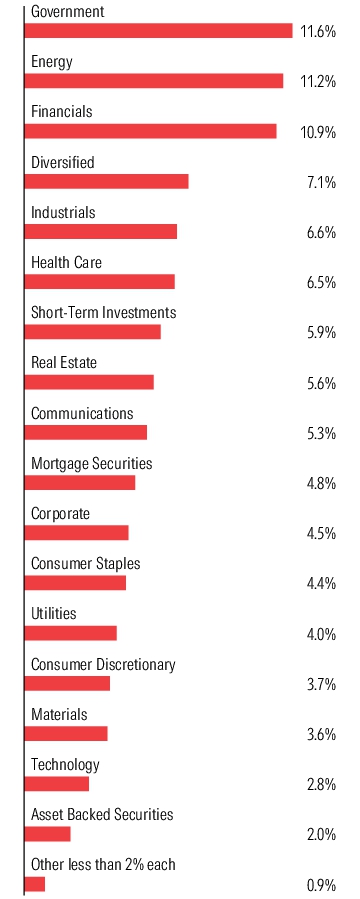
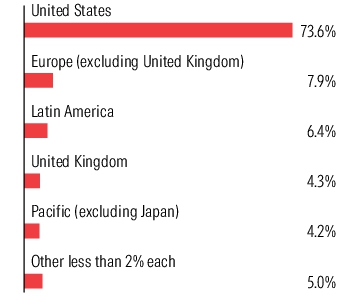
Graphical Representation of Holdings as of April 30, 2026
The tables below show the investment makeup of the Fund, representing a percentage of the total net assets of the Fund. With respect to the Fund's portfolio holdings in investment companies, the geographic region disclosed in the below Region Diversification table is based on where each underlying investment company is domiciled.
Asset Type Allocation
| Common Stocks | 43.8% |
| Investment Companies | 19.4% |
| Corporate Bonds | 11.7% |
| Short-Term Investments | 6.1% |
| Mortgage-Backed Securities | 5.6% |
| Foreign Issuer Bonds | 4.7% |
| Term Loans | 4.5% |
| Master Limited Partnerships | 3.1% |
| Asset-Backed Securities | 2.6% |
| Other less than 2% each | (0.1)% |
Sector Allocation
Region Diversification
Fund Expenses for the Last Year
(Based on a hypothetical $10,000 investment)
| Fund | Cost of a $10,000 Investment | Cost Paid as a Percentage of a $10,000 Investment1 | |||
| Morningstar Total Return Bond Fund | $54 | 0.53% |
|
1
|
Reflects Fee Waivers and/or Expense Assumptions, without which expenses would have been higher.
|
Management’s Discussion of Fund Performance
SUMMARY OF RESULTS
Morningstar Total Return Bond Fund (Institutional/MSTRX) returned 3.71% for the 12 months ended April 30, 2026. The Fund underperformed its benchmark, the Bloomberg U.S. Aggregate Bond Index, which returned 4.06%.
TOP PERFORMANCE CONTRIBUTORS
Security Selection and Sector Allocation: Both of the subadviser mandates outperformed the benchmark.
TOP PERFORMANCE DETRACTORS
Government Bond ETF: The Fund’s allocation to a government bond ETF underperformed the Fund’s benchmark, as credit-sensitive bonds outperformed.
Fund Performance
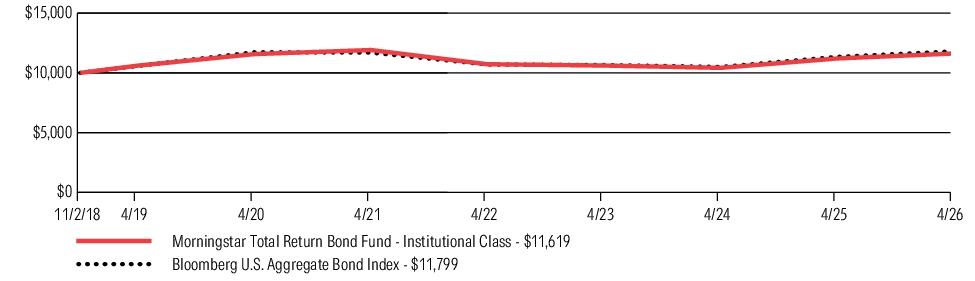
The following graph and chart compare the initial and subsequent account values at the end of each of the completed fiscal years of the Fund since its inception on November 2, 2018. Fund performance figures may reflect fee waivers and/or expense reimbursements, without which the performance would have been lower.
GROWTH OF $10,000
| AVERAGE ANNUAL TOTAL RETURNS | 1 Year | 5 Year | Since Inception |
| Morningstar Total Return Bond Fund | 3.71% | (0.50)% | 2.02% |
| Bloomberg U.S. Aggregate Bond Index | 4.06% | 0.18% | 2.23% |
Key Fund Statistics as of April 30, 2026
The following table outlines key fund statistics that you should pay attention to.
| Fund net assets | $953,872,748 |
| Total number of portfolio holdings | 2,697 |
| Total advisory fees paid (after waiver/reimbursement) | $2,741,492 |
| Portfolio turnover rate | 399% |
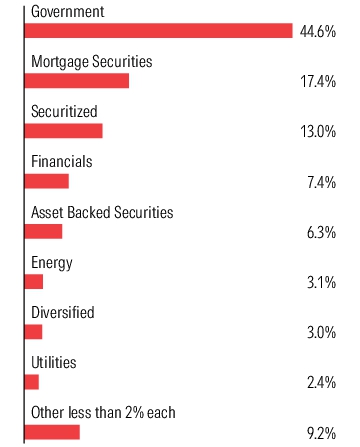
Graphical Representation of Holdings as of April 30, 2026
The tables below show the investment makeup of the Fund, representing a percentage of the total net assets of the Fund.
Asset Type Allocation
| Investment Companies | 34.0% |
| Mortgage-Backed Securities | 33.5% |
| Corporate Bonds | 14.7% |
| U.S. Government Obligations | 10.9% |
| Asset-Backed Securities | 10.3% |
| Foreign Issuer Bonds | 5.0% |
| Short-Term Investments | 3.6% |
| Other less than 2% each | (5.6)% |
Sector Allocation
Fund Expenses for the Last Year
(Based on a hypothetical $10,000 investment)
| Fund | Cost of a $10,000 Investment | Cost Paid as a Percentage of a $10,000 Investment1 | |||
| Morningstar Municipal Bond Fund | $60 | 0.58% |
|
1
|
Reflects Fee Waivers and/or Expense Assumptions, without which expenses would have been higher.
|
Management’s Discussion of Fund Performance
SUMMARY OF RESULTS
Morningstar Municipal Bond Fund (Institutional/MSTPX) returned 5.41% for the 12 months ended April 30, 2026. The Fund narrowly underperformed its benchmark, the Morningstar Municipal Bond Blended Index, which returned 5.53%.
TOP PERFORMANCE CONTRIBUTORS
Security Selection: All three of the subadviser mandates outperformed their style benchmarks, with strong security selection being a key driver.
TOP PERFORMANCE DETRACTORS
Credit-Sensitive Bonds: The fund underperformed in May and July of 2025, when the Fund’s lower-rated bonds underperformed the higher-quality bonds in the benchmark.
Fund Performance
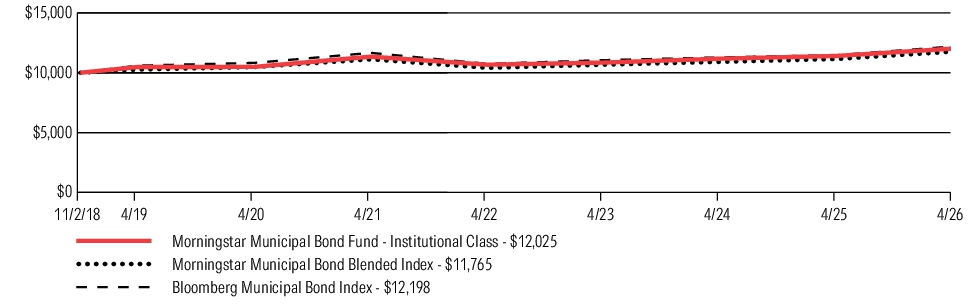
The following graph and chart compare the initial and subsequent account values at the end of each of the completed fiscal years of the Fund since its inception on November 2, 2018. Fund performance figures may reflect fee waivers and/or expense reimbursements, without which the performance would have been lower.
GROWTH OF $10,000
| AVERAGE ANNUAL TOTAL RETURNS | 1 Year | 5 Year | Since Inception |
| Morningstar Municipal Bond Fund | 5.41% | 1.17% | 2.49% |
| Morningstar Municipal Bond Blended Index | 5.53% | 1.14% | 2.24% |
| Bloomberg Municipal Bond Index | 6.34% | 0.90% | 2.69% |
Key Fund Statistics as of April 30, 2026
The following table outlines key fund statistics that you should pay attention to.
| Fund net assets | $336,760,019 |
| Total number of portfolio holdings | 774 |
| Total advisory fees paid (after waiver/reimbursement) | $1,169,598 |
| Portfolio turnover rate | 30% |
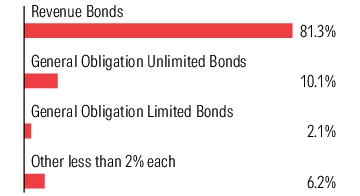
Graphical Representation of Holdings as of April 30, 2026
The tables below show the investment makeup of the Fund, representing a percentage of the total net assets of the Fund.
Asset Type Allocation
| Municipal Bonds | 90.9% |
| Short-Term Investments | 8.8% |
Municipal Issue Type Allocation
Fund Expenses for the Last Year
(Based on a hypothetical $10,000 investment)
| Fund | Cost of a $10,000 Investment | Cost Paid as a Percentage of a $10,000 Investment1 | |||
| Morningstar Defensive Bond Fund | $49 | 0.48% |
|
1
|
Reflects Fee Waivers and/or Expense Assumptions, without which expenses would have been higher.
|
Management’s Discussion of Fund Performance
SUMMARY OF RESULTS
Morningstar Defensive Bond Fund (Institutional/MSTBX) returned 3.99% for the 12 months ended April 30, 2026. The Fund outperformed its benchmark, the Bloomberg U.S. Aggregate 1-3 Year Index, which returned 3.51%.
TOP PERFORMANCE CONTRIBUTORS
Mortgage-Backed Securities: An overweight position to U.S. mortgage-backed securities was a tailwind.
Asset-Backed Securities (ABS): The Fund’s overweight to ABS contributed to the positive relative results.
Commercial Mortgage-Backed Securities (CMBS): An overweight position to CMBS added to portfolio relative performance.
TOP PERFORMANCE DETRACTORS
Short-term Treasury: The Fund’s position in U.S. Short-term Treasury hurt benchmark relative results.
Investment-grade Corporate: An underweight position in U.S. corporate bonds detracted from portfolio returns.
High-yield Corporate: An underweight position in U.S. high yield bonds detracted from portfolio returns.
Fund Performance
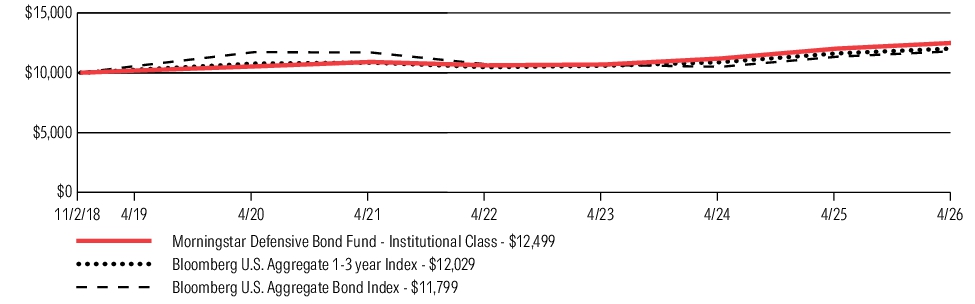
The following graph and chart compare the initial and subsequent account values at the end of each of the completed fiscal years of the Fund since its inception on November 2, 2018. Fund performance figures may reflect fee waivers and/or expense reimbursements, without which the performance would have been lower.
GROWTH OF $10,000
| AVERAGE ANNUAL TOTAL RETURNS | 1 Year | 5 Year | Since Inception |
| Morningstar Defensive Bond Fund | 3.99% | 2.77% | 3.02% |
| Bloomberg U.S. Aggregate 1-3 Year Index | 3.51% | 2.09% | 2.50% |
| Bloomberg U.S. Aggregate Bond Index | 4.06% | 0.18% | 2.23% |
Key Fund Statistics as of April 30, 2026
The following table outlines key fund statistics that you should pay attention to.
| Fund net assets | $102,656,270 |
| Total number of portfolio holdings | 184 |
| Total advisory fees paid (after waiver/reimbursement) | $148,054 |
| Portfolio turnover rate | 39% |
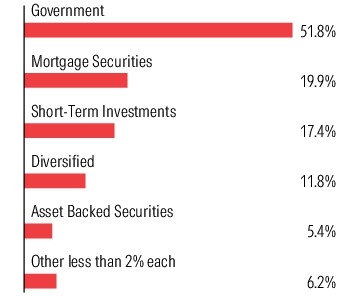
Graphical Representation of Holdings as of April 30, 2026
The tables below show the investment makeup of the Fund, representing a percentage of the total net assets of the Fund.
Asset Type Allocation
| Investment Companies | 53.4% |
| Mortgage-Backed Securities | 19.9% |
| Short-Term Investments | 18.2% |
| U.S. Government Obligations | 9.4% |
| Asset-Backed Securities | 6.4% |
| Corporate Bonds | 3.4% |
| Other less than 2% each | 1.8% |
Sector Allocation
Fund Expenses for the Last Year
(Based on a hypothetical $10,000 investment)
| Fund | Cost of a $10,000 Investment | Cost Paid as a Percentage of a $10,000 Investment1 | |||
| Morningstar Multisector Bond Fund | $83 | 0.79% |
|
1
|
Reflects Fee Waivers and/or Expense Assumptions, without which expenses would have been higher.
|
Management’s Discussion of Fund Performance
SUMMARY OF RESULTS
Morningstar Multisector Bond Fund (Institutional/MSTMX) returned 10.67% for the 12 months ended April 30, 2026. The Fund outperformed its blended benchmark, the Bloomberg Multisector Bond Blended Index (40% Bloomberg U.S. High Yield Corporate Index, 20% Bloomberg U.S. Corp Index, 20% JPMorgan EM USD Sovereign Index, and 20% Bloomberg EM Local Currency Global Dev Index), which returned 9.13%.
TOP PERFORMANCE CONTRIBUTORS
Local Currency Emerging Market Debt: The Fund’s exposure to Local Currency Emerging Market debt was the main contributor to performance over the period.
Non-U.S. Dollar: The Fund’s exposure to non-U.S. currencies, especially in emerging markets, benefited performance.
U.S. High Yield: The Fund’s selection within high yield bonds contributed to performance.
TOP PERFORMANCE DETRACTORS
Investment-grade Corporate Bonds: The Fund’s overweight to U.S. investment grade corporate bonds detracted from performance.
Fund Performance
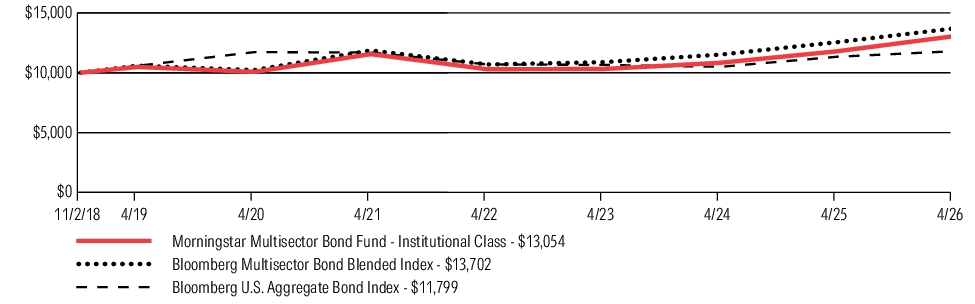
The following graph and chart compare the initial and subsequent account values at the end of each of the completed fiscal years of the Fund since its inception on November 2, 2018. Fund performance figures may reflect fee waivers and/or expense reimbursements, without which the performance would have been lower.
GROWTH OF $10,000
| AVERAGE ANNUAL TOTAL RETURNS | 1 Year | 5 Year | Since Inception |
| Morningstar Multisector Bond Fund | 10.67% | 2.46% | 3.62% |
| Bloomberg Multisector Bond Blended Index | 9.13% | 2.91% | 4.29% |
| Bloomberg U.S. Aggregate Bond Index | 4.06% | 0.18% | 2.23% |
Key Fund Statistics as of April 30, 2026
The following table outlines key fund statistics that you should pay attention to.
| Fund net assets | $188,232,686 |
| Total number of portfolio holdings | 1,236 |
| Total advisory fees paid (after waiver/reimbursement) | $733,077 |
| Portfolio turnover rate | 190% |
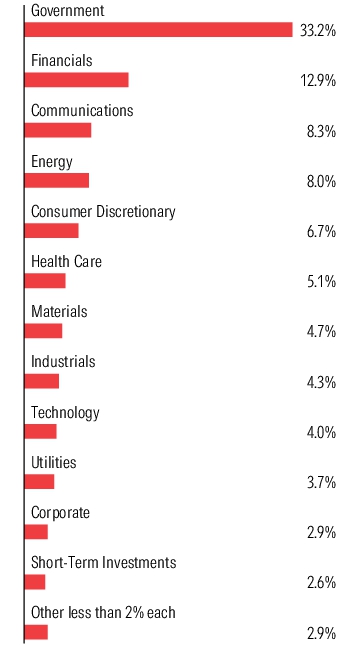
Graphical Representation of Holdings as of April 30, 2026
The tables below show the investment makeup of the Fund, representing a percentage of the total net assets of the Fund.
Asset Type Allocation
| Corporate Bonds | 43.9% |
| Foreign Issuer Bonds | 41.9% |
| Short-Term Investments | 6.8% |
| Term Loans | 2.6% |
| Other less than 2% each | 4.1% |
Sector Allocation
Region Diversification
Fund Expenses for the Last Year
(Based on a hypothetical $10,000 investment)
| Fund | Cost of a $10,000 Investment | Cost Paid as a Percentage of a $10,000 Investment | |||
| Morningstar Global Opportunistic Equity Fund | $80 | 0.72% |
Management’s Discussion of Fund Performance
SUMMARY OF RESULTS
Morningstar Global Opportunistic Equity Fund (Institutional/MSTSX) returned 20.83% for the 12 months ended April 30, 2026. The Fund underperformed its benchmark, the Morningstar Global Markets NR Index, which returned 31.26%.
TOP PERFORMANCE CONTRIBUTORS
A position in Korean equities, the home of SK Hynix and Samsung, boosted relative returns.
An overweight to Global Energy stocks, which benefited from the conflict in the Middle East, contributed positively to benchmark relative returns.
An overweight position to Brazilian stocks has been a tailwind as both the equity and currency exposure posted strong returns over the period.
TOP PERFORMANCE DETRACTORS
U.S. Information Technology was the largest detractor. The Fund was underweight this sector, which performed strongly. Selection within the sector further detracted from returns.
Overweight positioning in Consumer Staples and U.S. Healthcare were headwinds to benchmark relative returns.
Positions in Chinese internet stocks were also a drag on returns as those names struggled over this period.
Fund Performance
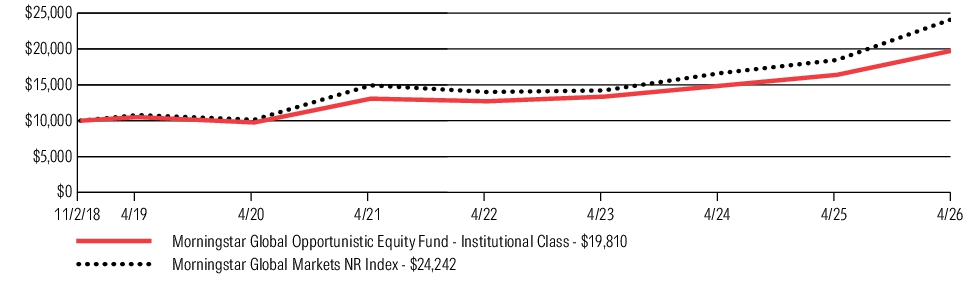
The following graph and chart compare the initial and subsequent account values at the end of each of the completed fiscal years of the Fund since its inception on November 2, 2018. Fund performance figures may reflect fee waivers and/or expense reimbursements, without which the performance would have been lower.
GROWTH OF $10,000
| AVERAGE ANNUAL TOTAL RETURNS | 1 Year | 5 Year | Since Inception |
| Morningstar Global Opportunistic Equity Fund | 20.83% | 8.67% | 9.56% |
| Morningstar Global Markets NR Index | 31.26% | 10.18% | 12.55% |
Key Fund Statistics as of April 30, 2026
The following table outlines key fund statistics that you should pay attention to.
| Fund net assets | $415,724,030 |
| Total number of portfolio holdings | 272 |
| Total advisory fees paid | $1,634,923 |
| Portfolio turnover rate | 85% |
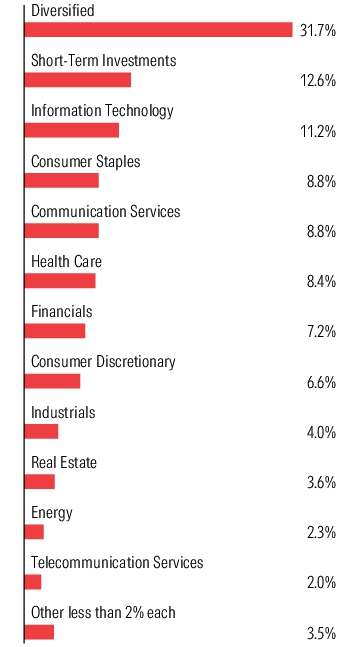
Graphical Representation of Holdings as of April 30, 2026
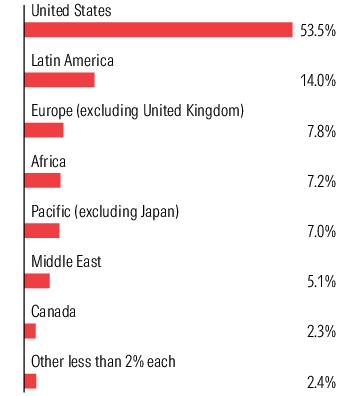
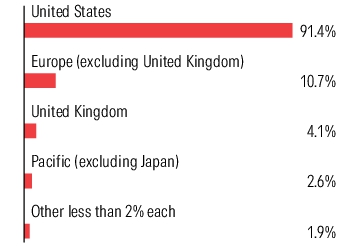
The tables below show the investment makeup of the Fund, representing a percentage of the total net assets of the Fund. With respect to the Fund's portfolio holdings in investment companies, the geographic region disclosed in the below Region Diversification table is based on where each underlying investment company is domiciled.
Asset Type Allocation
| Investment Companies | 59.9% |
| Common Stocks | 37.5% |
| Short-Term Investments | 12.6% |
| Preferred Stocks | 0.7% |
Sector Allocation
Region Diversification
Fund Expenses for the Last Year
(Based on a hypothetical $10,000 investment)
| Fund | Cost of a $10,000 Investment | Cost Paid as a Percentage of a $10,000 Investment1 | |||
| Morningstar Alternatives Fund | $138 | 1.35% |
|
1
|
Reflects Fee Waivers and/or Expense Assumptions, without which expenses would have been higher.
|
Management’s Discussion of Fund Performance
SUMMARY OF RESULTS
Morningstar Alternatives Fund (Institutional/MSTVX) returned 4.68% for the 12 months ended April 30, 2026. The Fund underperformed its benchmark, the Morningstar U.S. Cash T-Bill TR USD Index, which returned 4.12%.
TOP PERFORMANCE CONTRIBUTORS
Convertible Arbitrage: The Fund’s convertible arbitrage manager generated solid returns from income and volatility monetization.
Merger Arbitrage: The Fund’s merger arbitrage strategy delivered good returns amidst a turbulent M&A environment.
TOP PERFORMANCE DETRACTORS
Systematic Multi-Strategy: The Fund’s systematic multi-strategy manager underperformed the Fund’s benchmark as its long-short equity sub-strategy struggled.
Cash Exposure: The Fund holds a modest allocation to cash which can weigh on absolute performance during up markets.
Fund Performance
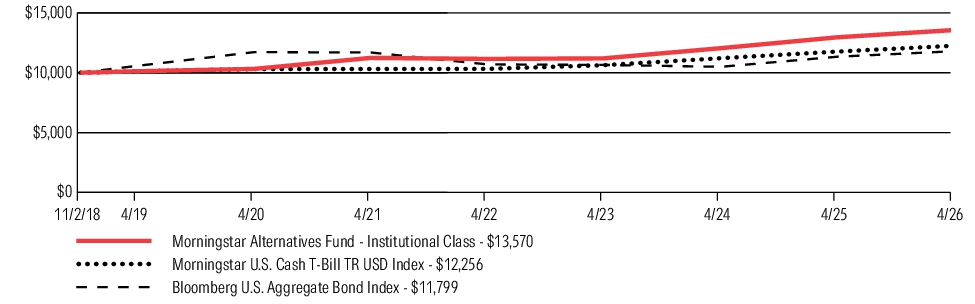
The following graph and chart compare the initial and subsequent account values at the end of each of the completed fiscal years of the Fund since its inception on November 2, 2018. Fund performance figures may reflect fee waivers and/or expense reimbursements, without which the performance would have been lower.
GROWTH OF $10,000
| AVERAGE ANNUAL TOTAL RETURNS | 1 Year | 5 Year | Since Inception |
| Morningstar Alternatives Fund | 4.68% | 3.83% | 4.16% |
| Morningstar U.S. Cash T-Bill TR USD Index | 4.12% | 3.51% | 2.75% |
| Bloomberg U.S. Aggregate Bond Index | 4.06% | 0.18% | 2.23% |
Key Fund Statistics as of April 30, 2026
The following table outlines key fund statistics that you should pay attention to.
| Fund net assets | $257,788,519 |
| Total number of portfolio holdings | 2,799 |
| Total advisory fees paid (after waiver/reimbursement) | $1,689,696 |
| Portfolio turnover rate | 208% |
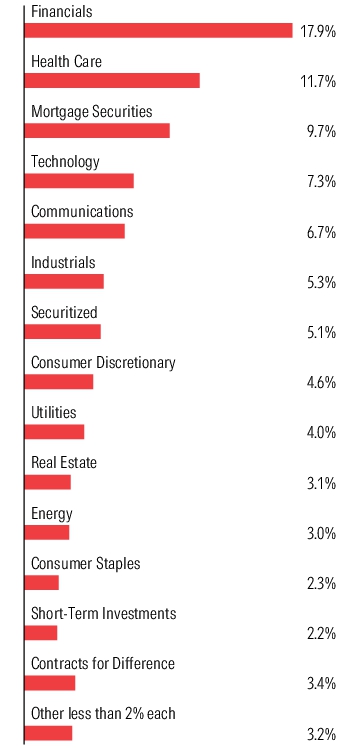
Graphical Representation of Holdings as of April 30, 2026
The tables below show the investment makeup of the Fund, representing a percentage of the total net assets of the Fund.
Asset Type Allocation
| Contracts for Difference - Long | 26.9% |
| Convertible Bonds | 26.0% |
| Common Stocks | 25.1% |
| Corporate Bonds | 21.0% |
| Mortgage-Backed Securities | 15.6% |
| Foreign Issuer Bonds | 4.9% |
| Short-Term Investments | 4.5% |
| Convertible Preferred Stocks | 3.5% |
| Other less than 2% each | 1.9% |
| Common Stocks Sold Short | (16.4)% |
| Contracts for Difference - Short | (23.5)% |
Sector Allocation
| [1] | Reflects Fee Waivers and/or Expense Assumptions, without which expenses would have been higher. |
| [2] | Reflects Fee Waivers and/or Expense Assumptions, without which expenses would have been higher. |
| [3] | Reflects Fee Waivers and/or Expense Assumptions, without which expenses would have been higher. |
| [4] | Reflects Fee Waivers and/or Expense Assumptions, without which expenses would have been higher. |
| [5] | Reflects Fee Waivers and/or Expense Assumptions, without which expenses would have been higher. |
| [6] | Reflects Fee Waivers and/or Expense Assumptions, without which expenses would have been higher. |
| [7] | Reflects Fee Waivers and/or Expense Assumptions, without which expenses would have been higher. |
| [8] | Reflects Fee Waivers and/or Expense Assumptions, without which expenses would have been higher. |