Shareholder Report
|
6 Months Ended |
|
Apr. 30, 2026
USD ($)
Holding
|
|---|
| Shareholder Report [Line Items] |
|
| Document Type |
N-CSRS
|
| Amendment Flag |
false
|
| Registrant Name |
Ultimus Managers Trust
|
| Entity Central Index Key |
0001545440
|
| Entity Investment Company Type |
N-1A
|
| Document Period End Date |
Apr. 30, 2026
|
| Shareholder Report Annual or Semi-Annual |
Semi-Annual Shareholder Report
|
| C000229483 |
|
| Shareholder Report [Line Items] |
|
| Fund Name |
Westwood Quality Value Fund
|
| Class Name |
Institutional Shares
|
| Trading Symbol |
WHGLX
|
| Annual or Semi-Annual Statement [Text Block] |
This semi-annual shareholder report contains important information about Westwood Quality Value Fund (the "Fund") for the period of November 1, 2025 to April 30, 2026.
|
| Additional Information [Text Block] |
You can find additional information about the Fund at https://westwoodgroup.com/product/quality-value-fund/. You can also request this information by contacting us at (877) 386-3944.
|
| Additional Information Phone Number |
(877) 386-3944
|
| Additional Information Website |
<span style="font-weight: 700; box-sizing: border-box; color: rgb(99, 102, 106); display: inline; flex-wrap: nowrap; font-size: 10.6667px; grid-area: auto; line-height: 16px; margin: 0px; overflow: visible; text-align: left; text-align-last: left; white-space-collapse: preserve-breaks;">https://westwoodgroup.com/product/quality-value-fund/</span>
|
| Expenses [Text Block] |
What were the Fund’s annualized costs for the last six months?(based on a hypothetical $10,000 investment) Table SummaryClass Name | Costs of a $10,000 investment | Costs paid as a percentage of a $10,000 investment |
|---|
Institutional Shares | $32 | 0.63% |
|---|
|
| Expenses Paid, Amount |
$ 32
|
| Expense Ratio, Percent |
0.63%
|
| Factors Affecting Performance [Text Block] |
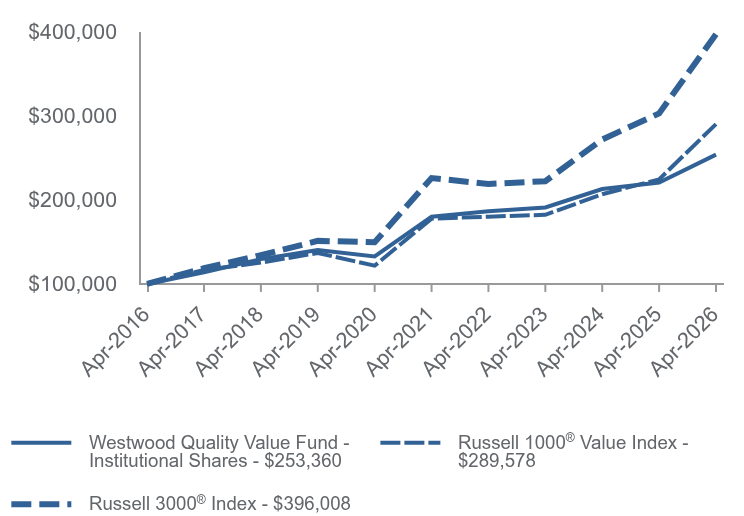
How did the Fund perform during the reporting period? The Westwood Quality Value Fund underperformed its representative benchmark, the Russell 1000® Value Index, in the reporting period. Equity markets experienced increased volatility from geopolitical risks and equity-market shocks, while earnings strength among artificial intelligence (AI)-linked mega-cap technology firms remained a key area of support for equities, especially in the U.S. market. An increase in market breadth that began in late 2025 continued throughout early 2026, as value stocks, small caps and non-U.S. equities experienced periodic leadership as investors sought broader participation and downside resilience. The top-performing sectors on a relative basis were Utilities and Health Care, driven by strong selection and an underweight allocation relative to the benchmark, respectively. Technology and Financials were the worst performers on a relative basis, primarily due to stock selection in each sector. Texas Instruments, Inc. (TXN) was the top contributor to performance for the trailing period, benefiting from AI/data center demand, industrial segment recovery and strong forward guidance above expectations. Shares of Qnity Electronics, Inc. (Q) gained as the company completed its spin-off into a standalone company positioned as a pure-play semiconductor materials and solutions provider. Alphabet, Inc. - Class A (GOOGL) advanced after reporting AI product breakthroughs relating to the company’s cross-product implementation of its Gemini platform and announcing a strategic partnership to power Apple’s AI features with Gemini. Salesforce, Inc. (CRM) was the largest detractor from performance for the period, falling after guidance disappointments and workforce reductions tied to restructuring and execution risk. Shares of LPL Financial Holdings, Inc. (LPLA) declined due to mixed earnings, AI-driven disruption concerns and regulatory penalties. Microsoft Corporation (MSFT) fell due to workforce reductions tied to restructuring, in addition to concerns about AI capital spending. |
| Line Graph [Table Text Block] |
Table Summary | Westwood Quality Value Fund - Institutional Shares | Russell 1000® Value Index | Russell 3000® Index |
|---|
Apr-2016 | $100,000 | $100,000 | $100,000 |
|---|
Apr-2017 | $113,858 | $116,551 | $118,583 |
|---|
Apr-2018 | $129,454 | $125,296 | $134,055 |
|---|
Apr-2019 | $140,148 | $136,651 | $151,056 |
|---|
Apr-2020 | $132,540 | $121,602 | $149,482 |
|---|
Apr-2021 | $179,809 | $177,447 | $225,597 |
|---|
Apr-2022 | $186,243 | $179,786 | $218,571 |
|---|
Apr-2023 | $190,720 | $181,967 | $221,856 |
|---|
Apr-2024 | $212,560 | $206,390 | $271,332 |
|---|
Apr-2025 | $220,317 | $224,037 | $302,268 |
|---|
Apr-2026 | $253,360 | $289,578 | $396,008 |
|---|
|
| Average Annual Return [Table Text Block] |
Table Summary | 1 Year | 5 Years | 10 Years |
|---|
Westwood Quality Value Fund - Institutional Shares | 15.00% | 7.10% | 9.74% |
|---|
Russell 1000® Value Index | 29.25% | 10.29% | 11.22% |
|---|
Russell 3000® Index | 31.01% | 11.91% | 14.75% |
|---|
|
| AssetsNet |
$ 178,247,585
|
| Holdings Count | Holding |
52
|
| Advisory Fees Paid, Amount |
$ 360,291
|
| InvestmentCompanyPortfolioTurnover |
32.00%
|
| Additional Fund Statistics [Text Block] |
- Net Assets$178,247,585
- Number of Portfolio Holdings52
- Advisory Fee (net of waivers)$360,291
- Portfolio Turnover32%
|
| Holdings [Text Block] |
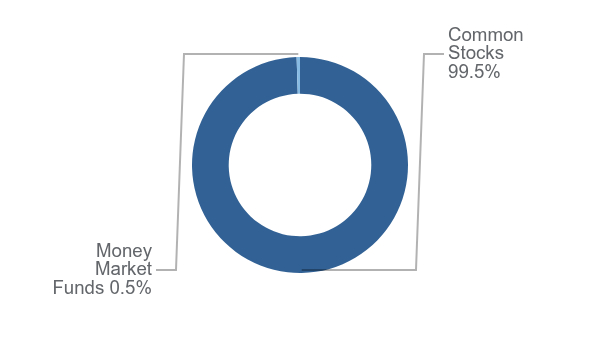
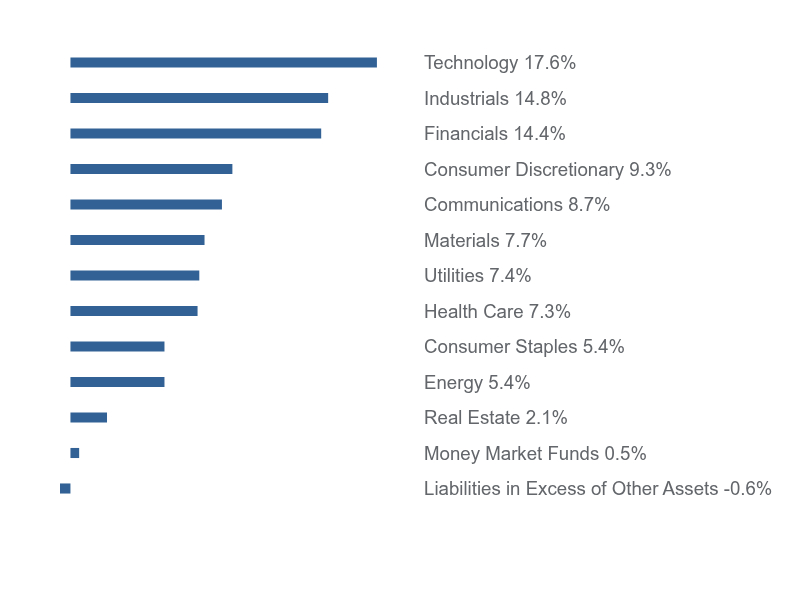
Asset Weighting (% of total investments)Table SummaryValue | Value |
|---|
Common Stocks | 99.5% | Money Market Funds | 0.5% | Sector Weighting (% of net assets)Table SummaryValue | Value |
|---|
Liabilities in Excess of Other Assets | -0.6% | Money Market Funds | 0.5% | Real Estate | 2.1% | Energy | 5.4% | Consumer Staples | 5.4% | Health Care | 7.3% | Utilities | 7.4% | Materials | 7.7% | Communications | 8.7% | Consumer Discretionary | 9.3% | Financials | 14.4% | Industrials | 14.8% | Technology | 17.6% | |
| Largest Holdings [Text Block] |
Top 10 Holdings (% of net assets)Table SummaryHolding Name | % of Net Assets |
|---|
Amazon.com, Inc. | 3.7% |
|---|
Texas Instruments, Inc. | 2.9% |
|---|
Alphabet, Inc. - Class A | 2.9% |
|---|
Qnity Electronics, Inc. | 2.9% |
|---|
NextEra Energy, Inc. | 2.7% |
|---|
CSX Corporation | 2.6% |
|---|
Entergy Corporation | 2.5% |
|---|
RB Global, Inc. | 2.5% |
|---|
Berkshire Hathaway, Inc. - Class B | 2.4% |
|---|
Thermo Fisher Scientific, Inc. | 2.3% |
|---|
|
| Material Fund Change [Text Block] |
No material changes occurred during the period ended April 30, 2026. |
| C000229481 |
|
| Shareholder Report [Line Items] |
|
| Fund Name |
Westwood Quality Value Fund
|
| Class Name |
A Class Shares
|
| Trading Symbol |
WWLAX
|
| Annual or Semi-Annual Statement [Text Block] |
This semi-annual shareholder report contains important information about Westwood Quality Value Fund (the "Fund") for the period of November 1, 2025 to April 30, 2026.
|
| Additional Information [Text Block] |
You can find additional information about the Fund at https://westwoodgroup.com/product/quality-value-fund/. You can also request this information by contacting us at (877) 386-3944.
|
| Additional Information Phone Number |
(877) 386-3944
|
| Additional Information Website |
<span style="font-weight: 700; box-sizing: border-box; color: rgb(99, 102, 106); display: inline; flex-wrap: nowrap; font-size: 10.6667px; grid-area: auto; line-height: 16px; margin: 0px; overflow: visible; text-align: left; text-align-last: left; white-space-collapse: preserve-breaks;">https://westwoodgroup.com/product/quality-value-fund/</span>
|
| Expenses [Text Block] |
What were the Fund’s annualized costs for the last six months?(based on a hypothetical $10,000 investment) Table SummaryClass Name | Costs of a $10,000 investment | Costs paid as a percentage of a $10,000 investment |
|---|
A Class Shares | $42 | 0.81% |
|---|
|
| Expenses Paid, Amount |
$ 42
|
| Expense Ratio, Percent |
0.81%
|
| Factors Affecting Performance [Text Block] |
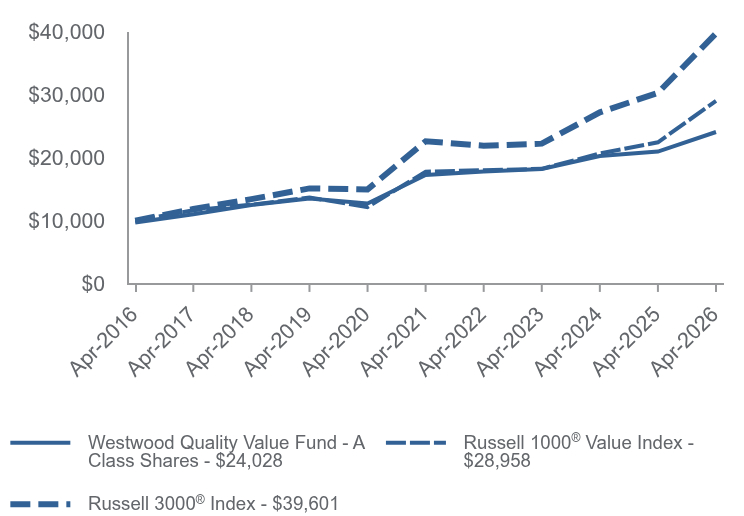
How did the Fund perform during the reporting period? The Westwood Quality Value Fund underperformed its representative benchmark, the Russell 1000® Value Index, in the reporting period. Equity markets experienced increased volatility from geopolitical risks and equity-market shocks, while earnings strength among artificial intelligence (AI)-linked mega-cap technology firms remained a key area of support for equities, especially in the U.S. market. An increase in market breadth that began in late 2025 continued throughout early 2026, as value stocks, small caps and non-U.S. equities experienced periodic leadership as investors sought broader participation and downside resilience. The top-performing sectors on a relative basis were Utilities and Health Care, driven by strong selection and an underweight allocation relative to the benchmark, respectively. Technology and Financials were the worst performers on a relative basis, primarily due to stock selection in each sector. Texas Instruments, Inc. (TXN) was the top contributor to performance for the trailing period, benefiting from AI/data center demand, industrial segment recovery and strong forward guidance above expectations. Shares of Qnity Electronics, Inc. (Q) gained as the company completed its spin-off into a standalone company positioned as a pure-play semiconductor materials and solutions provider. Alphabet, Inc. - Class A (GOOGL) advanced after reporting AI product breakthroughs relating to the company’s cross-product implementation of its Gemini platform and announcing a strategic partnership to power Apple’s AI features with Gemini. Salesforce, Inc. (CRM) was the largest detractor from performance for the period, falling after guidance disappointments and workforce reductions tied to restructuring and execution risk. Shares of LPL Financial Holdings, Inc. (LPLA) declined due to mixed earnings, AI-driven disruption concerns and regulatory penalties. Microsoft Corporation (MSFT) fell due to workforce reductions tied to restructuring, in addition to concerns about AI capital spending. |
| Line Graph [Table Text Block] |
Table Summary | Westwood Quality Value Fund - A Class Shares | Russell 1000® Value Index | Russell 3000® Index |
|---|
Apr-2016 | $9,699 | $10,000 | $10,000 |
|---|
Apr-2017 | $11,020 | $11,655 | $11,858 |
|---|
Apr-2018 | $12,492 | $12,530 | $13,406 |
|---|
Apr-2019 | $13,489 | $13,665 | $15,106 |
|---|
Apr-2020 | $12,718 | $12,160 | $14,948 |
|---|
Apr-2021 | $17,227 | $17,745 | $22,560 |
|---|
Apr-2022 | $17,788 | $17,979 | $21,857 |
|---|
Apr-2023 | $18,184 | $18,197 | $22,186 |
|---|
Apr-2024 | $20,223 | $20,639 | $27,133 |
|---|
Apr-2025 | $20,925 | $22,404 | $30,227 |
|---|
Apr-2026 | $24,028 | $28,958 | $39,601 |
|---|
|
| Average Annual Return [Table Text Block] |
Table Summary | 1 Year | 5 Years | 10 Years |
|---|
Westwood Quality Value Fund - A Class Shares | | | |
|---|
Without Load | 14.83% | 6.88% | 9.50% |
|---|
With LoadFootnote Reference* | 11.37% | 6.23% | 9.16% |
|---|
Russell 1000® Value Index | 29.25% | 10.29% | 11.22% |
|---|
Russell 3000® Index | 31.01% | 11.91% | 14.75% |
|---|
|
| AssetsNet |
$ 178,247,585
|
| Holdings Count | Holding |
52
|
| Advisory Fees Paid, Amount |
$ 360,291
|
| InvestmentCompanyPortfolioTurnover |
32.00%
|
| Additional Fund Statistics [Text Block] |
- Net Assets$178,247,585
- Number of Portfolio Holdings52
- Advisory Fee (net of waivers)$360,291
- Portfolio Turnover32%
|
| Holdings [Text Block] |
Asset Weighting (% of total investments)Table SummaryValue | Value |
|---|
Common Stocks | 99.5% | Money Market Funds | 0.5% | Sector Weighting (% of net assets)Table SummaryValue | Value |
|---|
Liabilities in Excess of Other Assets | -0.6% | Money Market Funds | 0.5% | Real Estate | 2.1% | Energy | 5.4% | Consumer Staples | 5.4% | Health Care | 7.3% | Utilities | 7.4% | Materials | 7.7% | Communications | 8.7% | Consumer Discretionary | 9.3% | Financials | 14.4% | Industrials | 14.8% | Technology | 17.6% | |
| Largest Holdings [Text Block] |
Top 10 Holdings (% of net assets)Table SummaryHolding Name | % of Net Assets |
|---|
Amazon.com, Inc. | 3.7% |
|---|
Texas Instruments, Inc. | 2.9% |
|---|
Alphabet, Inc. - Class A | 2.9% |
|---|
Qnity Electronics, Inc. | 2.9% |
|---|
NextEra Energy, Inc. | 2.7% |
|---|
CSX Corporation | 2.6% |
|---|
Entergy Corporation | 2.5% |
|---|
RB Global, Inc. | 2.5% |
|---|
Berkshire Hathaway, Inc. - Class B | 2.4% |
|---|
Thermo Fisher Scientific, Inc. | 2.3% |
|---|
|
| Material Fund Change [Text Block] |
No material changes occurred during the period ended April 30, 2026. |
| Updated Prospectus Phone Number |
(877) 386-3944
|
| Updated Prospectus Web Address |
https://westwoodgroup.com/product/quality-value-fund/
|
| C000240108 |
|
| Shareholder Report [Line Items] |
|
| Fund Name |
Westwood Quality Value Fund
|
| Class Name |
Ultra Shares
|
| Trading Symbol |
WHGQX
|
| Annual or Semi-Annual Statement [Text Block] |
This semi-annual shareholder report contains important information about Westwood Quality Value Fund (the "Fund") for the period of November 1, 2025 to April 30, 2026.
|
| Additional Information [Text Block] |
You can find additional information about the Fund at https://westwoodgroup.com/product/quality-value-fund/. You can also request this information by contacting us at (877) 386-3944.
|
| Additional Information Phone Number |
(877) 386-3944
|
| Additional Information Website |
<span style="font-weight: 700; box-sizing: border-box; color: rgb(99, 102, 106); display: inline; flex-wrap: nowrap; font-size: 10.6667px; grid-area: auto; line-height: 16px; margin: 0px; overflow: visible; text-align: left; text-align-last: left; white-space-collapse: preserve-breaks;">https://westwoodgroup.com/product/quality-value-fund/</span>
|
| Expenses [Text Block] |
What were the Fund’s annualized costs for the last six months?(based on a hypothetical $10,000 investment) Table SummaryClass Name | Costs of a $10,000 investment | Costs paid as a percentage of a $10,000 investment |
|---|
Ultra Shares | $29 | 0.56% |
|---|
|
| Expenses Paid, Amount |
$ 29
|
| Expense Ratio, Percent |
0.56%
|
| Factors Affecting Performance [Text Block] |
How did the Fund perform during the reporting period? The Westwood Quality Value Fund underperformed its representative benchmark, the Russell 1000® Value Index, in the reporting period. Equity markets experienced increased volatility from geopolitical risks and equity-market shocks, while earnings strength among artificial intelligence (AI)-linked mega-cap technology firms remained a key area of support for equities, especially in the U.S. market. An increase in market breadth that began in late 2025 continued throughout early 2026, as value stocks, small caps and non-U.S. equities experienced periodic leadership as investors sought broader participation and downside resilience. The top-performing sectors on a relative basis were Utilities and Health Care, driven by strong selection and an underweight allocation relative to the benchmark, respectively. Technology and Financials were the worst performers on a relative basis, primarily due to stock selection in each sector. Texas Instruments, Inc. (TXN) was the top contributor to performance for the trailing period, benefiting from AI/data center demand, industrial segment recovery and strong forward guidance above expectations. Shares of Qnity Electronics, Inc. (Q) gained as the company completed its spin-off into a standalone company positioned as a pure-play semiconductor materials and solutions provider. Alphabet, Inc. - Class A (GOOGL) advanced after reporting AI product breakthroughs relating to the company’s cross-product implementation of its Gemini platform and announcing a strategic partnership to power Apple’s AI features with Gemini. Salesforce, Inc. (CRM) was the largest detractor from performance for the period, falling after guidance disappointments and workforce reductions tied to restructuring and execution risk. Shares of LPL Financial Holdings, Inc. (LPLA) declined due to mixed earnings, AI-driven disruption concerns and regulatory penalties. Microsoft Corporation (MSFT) fell due to workforce reductions tied to restructuring, in addition to concerns about AI capital spending. |
| Line Graph [Table Text Block] |
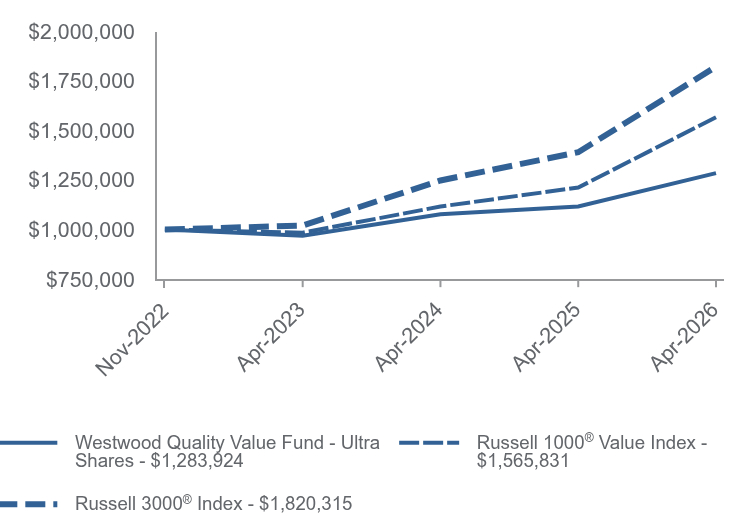
Table Summary | Westwood Quality Value Fund - Ultra Shares | Russell 1000® Value Index | Russell 3000® Index |
|---|
Nov-2022 | $1,000,000 | $1,000,000 | $1,000,000 |
|---|
Apr-2023 | $968,668 | $983,948 | $1,019,796 |
|---|
Apr-2024 | $1,077,318 | $1,116,013 | $1,247,221 |
|---|
Apr-2025 | $1,115,812 | $1,211,435 | $1,389,423 |
|---|
Apr-2026 | $1,283,924 | $1,565,831 | $1,820,315 |
|---|
|
| Average Annual Return [Table Text Block] |
Table Summary | 1 Year | Since Inception (November 30, 2022) |
|---|
Westwood Quality Value Fund - Ultra Shares | 15.07% | 7.60% |
|---|
Russell 1000® Value Index | 29.25% | 14.04% |
|---|
Russell 3000® Index | 31.01% | 19.18% |
|---|
|
| Performance Inception Date |
Nov. 30, 2022
|
| AssetsNet |
$ 178,247,585
|
| Holdings Count | Holding |
52
|
| Advisory Fees Paid, Amount |
$ 360,291
|
| InvestmentCompanyPortfolioTurnover |
32.00%
|
| Additional Fund Statistics [Text Block] |
- Net Assets$178,247,585
- Number of Portfolio Holdings52
- Advisory Fee (net of waivers)$360,291
- Portfolio Turnover32%
|
| Holdings [Text Block] |
Asset Weighting (% of total investments)Table SummaryValue | Value |
|---|
Common Stocks | 99.5% | Money Market Funds | 0.5% | Sector Weighting (% of net assets)Table SummaryValue | Value |
|---|
Liabilities in Excess of Other Assets | -0.6% | Money Market Funds | 0.5% | Real Estate | 2.1% | Energy | 5.4% | Consumer Staples | 5.4% | Health Care | 7.3% | Utilities | 7.4% | Materials | 7.7% | Communications | 8.7% | Consumer Discretionary | 9.3% | Financials | 14.4% | Industrials | 14.8% | Technology | 17.6% | |
| Largest Holdings [Text Block] |
Top 10 Holdings (% of net assets)Table SummaryHolding Name | % of Net Assets |
|---|
Amazon.com, Inc. | 3.7% |
|---|
Texas Instruments, Inc. | 2.9% |
|---|
Alphabet, Inc. - Class A | 2.9% |
|---|
Qnity Electronics, Inc. | 2.9% |
|---|
NextEra Energy, Inc. | 2.7% |
|---|
CSX Corporation | 2.6% |
|---|
Entergy Corporation | 2.5% |
|---|
RB Global, Inc. | 2.5% |
|---|
Berkshire Hathaway, Inc. - Class B | 2.4% |
|---|
Thermo Fisher Scientific, Inc. | 2.3% |
|---|
|
| Material Fund Change [Text Block] |
No material changes occurred during the period ended April 30, 2026. |
| C000229480 |
|
| Shareholder Report [Line Items] |
|
| Fund Name |
Westwood Quality SMidCap Fund
|
| Class Name |
Institutional Shares
|
| Trading Symbol |
WHGMX
|
| Annual or Semi-Annual Statement [Text Block] |
This semi-annual shareholder report contains important information about Westwood Quality SMidCap Fund (the "Fund") for the period of November 1, 2025 to April 30, 2026.
|
| Additional Information [Text Block] |
You can find additional information about the Fund at https://westwoodgroup.com/product/quality-smidcap-fund/. You can also request this information by contacting us at (877) 386-3944.
|
| Additional Information Phone Number |
(877) 386-3944
|
| Additional Information Website |
<span style="font-weight: 700; box-sizing: border-box; color: rgb(99, 102, 106); display: inline; flex-wrap: nowrap; font-size: 10.6667px; grid-area: auto; line-height: 16px; margin: 0px; overflow: visible; text-align: left; text-align-last: left; white-space-collapse: preserve-breaks;">https://westwoodgroup.com/product/quality-smidcap-fund/</span>
|
| Expenses [Text Block] |
What were the Fund’s annualized costs for the last six months?(based on a hypothetical $10,000 investment) Table SummaryClass Name | Costs of a $10,000 investment | Costs paid as a percentage of a $10,000 investment |
|---|
Institutional Shares | $47 | 0.88% |
|---|
|
| Expenses Paid, Amount |
$ 47
|
| Expense Ratio, Percent |
0.88%
|
| Factors Affecting Performance [Text Block] |
How did the Fund perform during the reporting period? The Westwood Quality SMidCap Fund underperformed its representative benchmark, the Russell 2500® Value Index, in the reporting period. Equity markets experienced increased volatility from geopolitical risks and equity-market shocks, while earnings strength among artificial intelligence-linked mega-cap technology firms remained a key area of support for equities, especially in the U.S. market. An increase in market breadth that began in late 2025 continued throughout early 2026, as value stocks, small caps and non-U.S. equities experienced periodic leadership as investors sought broader participation and downside resilience. On a relative basis, the top-performing sectors were Financials and Industrials, with outperformance in each sector primarily driven by strong selection. The Technology and Communications sectors were the largest detractors from relative performance, with underperformance driven by selection and partially mitigated by the interaction between allocation and selection decisions. Modine Manufacturing Company (MOD) was the top contributor to performance, gaining on data center demand, capacity expansion investments and a backlog with multi-year visibility. Shares of Permian Resources Corporation - Class A (PR) advanced after reporting record results, strong free cash flow generation and large-scale acquisitions. Marex Group plc (MRX) rose after high client activity and trading volumes across asset classes driven by elevated market volatility translated into higher trading revenue. Pegasystems, Inc. (PEGA) was the largest detractor from performance, falling due to ongoing Appian litigation and macro headwinds from the federal government shutdown and conflicts in Europe and the Middle East. Shares of Verra Mobility Corporation (VRRM) declined due to margin compression, declining free cash flow and rising capital intensity. Kratos Defense & Security Solutions, Inc. (KTOS) retreated as the government shutdown caused delays in contract funding and execution that persisted into 2026. |
| Line Graph [Table Text Block] |
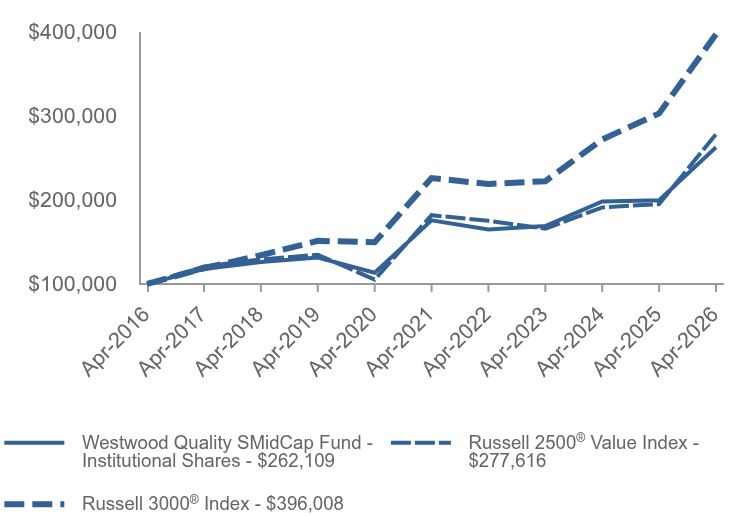
Table Summary | Westwood Quality SMidCap Fund - Institutional Shares | Russell 2500® Value Index | Russell 3000® Index |
|---|
Apr-2016 | $100,000 | $100,000 | $100,000 |
|---|
Apr-2017 | $117,598 | $120,663 | $118,583 |
|---|
Apr-2018 | $126,119 | $129,079 | $134,055 |
|---|
Apr-2019 | $131,403 | $134,600 | $151,056 |
|---|
Apr-2020 | $113,284 | $105,118 | $149,482 |
|---|
Apr-2021 | $175,434 | $181,521 | $225,597 |
|---|
Apr-2022 | $164,560 | $174,799 | $218,571 |
|---|
Apr-2023 | $168,717 | $165,530 | $221,856 |
|---|
Apr-2024 | $197,845 | $190,750 | $271,332 |
|---|
Apr-2025 | $199,159 | $194,752 | $302,268 |
|---|
Apr-2026 | $262,109 | $277,616 | $396,008 |
|---|
|
| Average Annual Return [Table Text Block] |
Table Summary | 1 Year | 5 Years | 10 Years |
|---|
Westwood Quality SMidCap Fund - Institutional Shares | 31.61% | 8.36% | 10.12% |
|---|
Russell 2500® Value Index | 42.55% | 8.87% | 10.75% |
|---|
Russell 3000® Index | 31.01% | 11.91% | 14.75% |
|---|
|
| AssetsNet |
$ 106,608,469
|
| Holdings Count | Holding |
61
|
| Advisory Fees Paid, Amount |
$ 263,897
|
| InvestmentCompanyPortfolioTurnover |
35.00%
|
| Additional Fund Statistics [Text Block] |
- Net Assets$106,608,469
- Number of Portfolio Holdings61
- Advisory Fee (net of waivers)$263,897
- Portfolio Turnover35%
|
| Holdings [Text Block] |
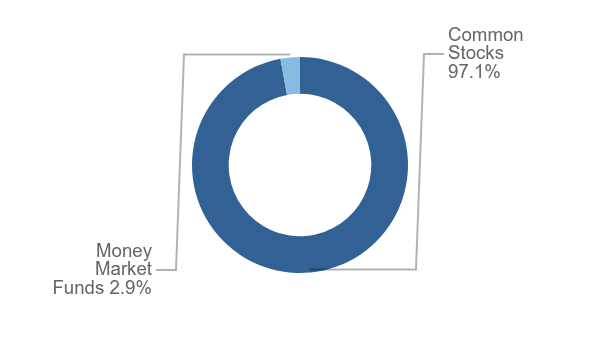
Asset Weighting (% of total investments)Table SummaryValue | Value |
|---|
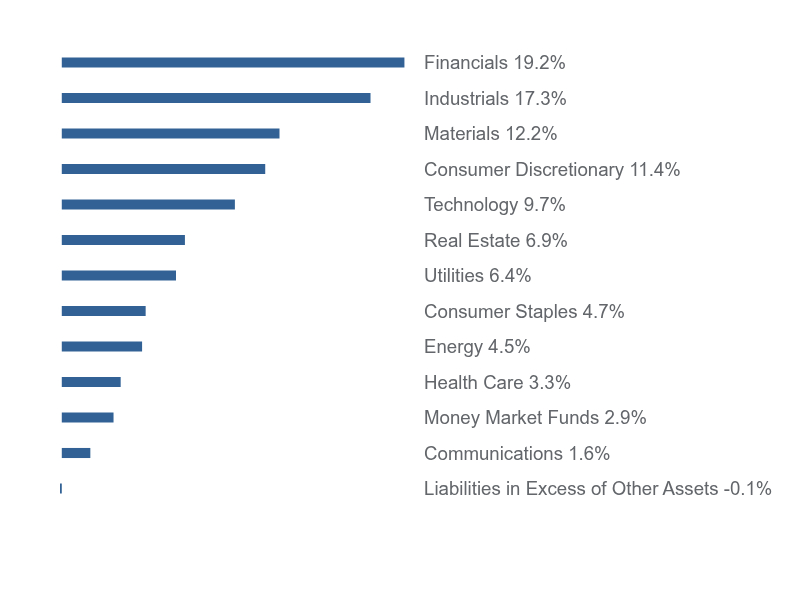
Common Stocks | 97.1% | Money Market Funds | 2.9% | Sector Weighting (% of net assets)Table SummaryValue | Value |
|---|
Liabilities in Excess of Other Assets | -0.1% | Communications | 1.6% | Money Market Funds | 2.9% | Health Care | 3.3% | Energy | 4.5% | Consumer Staples | 4.7% | Utilities | 6.4% | Real Estate | 6.9% | Technology | 9.7% | Consumer Discretionary | 11.4% | Materials | 12.2% | Industrials | 17.3% | Financials | 19.2% | |
| Largest Holdings [Text Block] |
Top 10 Holdings (% of net assets)Table SummaryHolding Name | % of Net Assets |
|---|
Cullen/Frost Bankers, Inc. | 2.6% |
|---|
SouthState Bank Corporation | 2.5% |
|---|
IDACORP, Inc. | 2.5% |
|---|
Sensient Technologies Corporation | 2.3% |
|---|
Marex Group plc | 2.2% |
|---|
Modine Manufacturing Company | 2.1% |
|---|
Glacier Bancorp, Inc. | 2.1% |
|---|
Lattice Semiconductor Corporation | 2.0% |
|---|
EastGroup Properties, Inc. | 2.0% |
|---|
BJ's Wholesale Club Holdings, Inc. | 2.0% |
|---|
|
| Material Fund Change [Text Block] |
No material changes occurred during the period ended April 30, 2026. |
| C000229479 |
|
| Shareholder Report [Line Items] |
|
| Fund Name |
Westwood Quality SMidCap Fund
|
| Class Name |
Ultra Shares
|
| Trading Symbol |
WWSMX
|
| Annual or Semi-Annual Statement [Text Block] |
This semi-annual shareholder report contains important information about Westwood Quality SMidCap Fund (the "Fund") for the period of November 1, 2025 to April 30, 2026.
|
| Additional Information [Text Block] |
You can find additional information about the Fund at https://westwoodgroup.com/product/quality-smidcap-fund/. You can also request this information by contacting us at (877) 386-3944.
|
| Additional Information Phone Number |
(877) 386-3944
|
| Additional Information Website |
<span style="font-weight: 700; box-sizing: border-box; color: rgb(99, 102, 106); display: inline; flex-wrap: nowrap; font-size: 10.6667px; grid-area: auto; line-height: 16px; margin: 0px; overflow: visible; text-align: left; text-align-last: left; white-space-collapse: preserve-breaks;">https://westwoodgroup.com/product/quality-smidcap-fund/</span>
|
| Expenses [Text Block] |
What were the Fund’s annualized costs for the last six months?(based on a hypothetical $10,000 investment) Table SummaryClass Name | Costs of a $10,000 investment | Costs paid as a percentage of a $10,000 investment |
|---|
Ultra Shares | $37 | 0.68% |
|---|
|
| Expenses Paid, Amount |
$ 37
|
| Expense Ratio, Percent |
0.68%
|
| Factors Affecting Performance [Text Block] |
How did the Fund perform during the reporting period? The Westwood Quality SMidCap Fund underperformed its representative benchmark, the Russell 2500® Value Index, in the reporting period. Equity markets experienced increased volatility from geopolitical risks and equity-market shocks, while earnings strength among artificial intelligence-linked mega-cap technology firms remained a key area of support for equities, especially in the U.S. market. An increase in market breadth that began in late 2025 continued throughout early 2026, as value stocks, small caps and non-U.S. equities experienced periodic leadership as investors sought broader participation and downside resilience. On a relative basis, the top-performing sectors were Financials and Industrials, with outperformance in each sector primarily driven by strong selection. The Technology and Communications sectors were the largest detractors from relative performance, with underperformance driven by selection and partially mitigated by the interaction between allocation and selection decisions. Modine Manufacturing Company (MOD) was the top contributor to performance, gaining on data center demand, capacity expansion investments and a backlog with multi-year visibility. Shares of Permian Resources Corporation - Class A (PR) advanced after reporting record results, strong free cash flow generation and large-scale acquisitions. Marex Group plc (MRX) rose after high client activity and trading volumes across asset classes driven by elevated market volatility translated into higher trading revenue. Pegasystems, Inc. (PEGA) was the largest detractor from performance, falling due to ongoing Appian litigation and macro headwinds from the federal government shutdown and conflicts in Europe and the Middle East. Shares of Verra Mobility Corporation (VRRM) declined due to margin compression, declining free cash flow and rising capital intensity. Kratos Defense & Security Solutions, Inc. (KTOS) retreated as the government shutdown caused delays in contract funding and execution that persisted into 2026. |
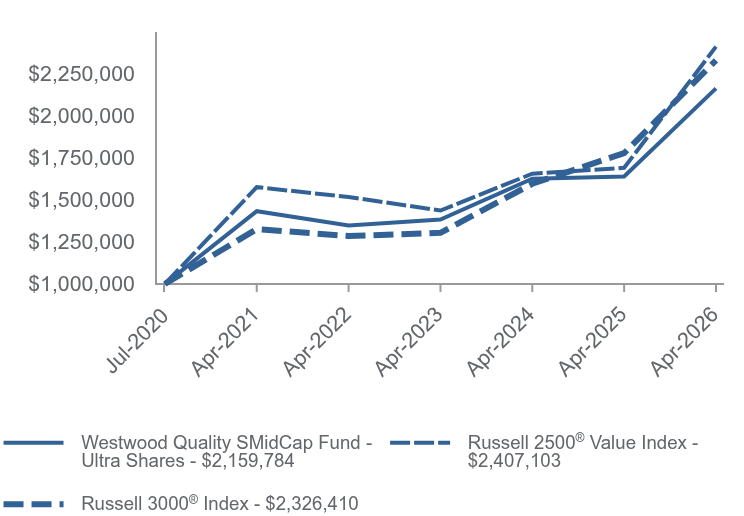
| Line Graph [Table Text Block] |
Table Summary | Westwood Quality SMidCap Fund - Ultra Shares | Russell 2500® Value Index | Russell 3000® Index |
|---|
Jul-2020 | $1,000,000 | $1,000,000 | $1,000,000 |
|---|
Apr-2021 | $1,431,258 | $1,573,894 | $1,325,302 |
|---|
Apr-2022 | $1,346,616 | $1,515,618 | $1,284,027 |
|---|
Apr-2023 | $1,382,270 | $1,435,244 | $1,303,326 |
|---|
Apr-2024 | $1,623,651 | $1,653,919 | $1,593,982 |
|---|
Apr-2025 | $1,637,635 | $1,688,615 | $1,775,719 |
|---|
Apr-2026 | $2,159,784 | $2,407,103 | $2,326,410 |
|---|
|
| Average Annual Return [Table Text Block] |
Table Summary | 1 Year | 5 Years | Since Inception (July 31, 2020) |
|---|
Westwood Quality SMidCap Fund - Ultra Shares | 31.88% | 8.58% | 14.33% |
|---|
Russell 2500® Value Index | 42.55% | 8.87% | 16.51% |
|---|
Russell 3000® Index | 31.01% | 11.91% | 15.82% |
|---|
|
| Performance Inception Date |
Jul. 31, 2020
|
| AssetsNet |
$ 106,608,469
|
| Holdings Count | Holding |
61
|
| Advisory Fees Paid, Amount |
$ 263,897
|
| InvestmentCompanyPortfolioTurnover |
35.00%
|
| Additional Fund Statistics [Text Block] |
- Net Assets$106,608,469
- Number of Portfolio Holdings61
- Advisory Fee (net of waivers)$263,897
- Portfolio Turnover35%
|
| Holdings [Text Block] |
Asset Weighting (% of total investments)Table SummaryValue | Value |
|---|
Common Stocks | 97.1% | Money Market Funds | 2.9% | Sector Weighting (% of net assets)Table SummaryValue | Value |
|---|
Liabilities in Excess of Other Assets | -0.1% | Communications | 1.6% | Money Market Funds | 2.9% | Health Care | 3.3% | Energy | 4.5% | Consumer Staples | 4.7% | Utilities | 6.4% | Real Estate | 6.9% | Technology | 9.7% | Consumer Discretionary | 11.4% | Materials | 12.2% | Industrials | 17.3% | Financials | 19.2% | |
| Largest Holdings [Text Block] |
Top 10 Holdings (% of net assets)Table SummaryHolding Name | % of Net Assets |
|---|
Cullen/Frost Bankers, Inc. | 2.6% |
|---|
SouthState Bank Corporation | 2.5% |
|---|
IDACORP, Inc. | 2.5% |
|---|
Sensient Technologies Corporation | 2.3% |
|---|
Marex Group plc | 2.2% |
|---|
Modine Manufacturing Company | 2.1% |
|---|
Glacier Bancorp, Inc. | 2.1% |
|---|
Lattice Semiconductor Corporation | 2.0% |
|---|
EastGroup Properties, Inc. | 2.0% |
|---|
BJ's Wholesale Club Holdings, Inc. | 2.0% |
|---|
|
| Material Fund Change [Text Block] |
No material changes occurred during the period ended April 30, 2026. |
| C000229476 |
|
| Shareholder Report [Line Items] |
|
| Fund Name |
Westwood Quality SmallCap Fund
|
| Class Name |
Institutional Shares
|
| Trading Symbol |
WHGSX
|
| Annual or Semi-Annual Statement [Text Block] |
This semi-annual shareholder report contains important information about Westwood Quality SmallCap Fund (the "Fund") for the period of November 1, 2025 to April 30, 2026.
|
| Additional Information [Text Block] |
You can find additional information about the Fund at https://westwoodgroup.com/product/quality-smallcap-fund/. You can also request this information by contacting us at (877) 386-3944.
|
| Additional Information Phone Number |
(877) 386-3944
|
| Additional Information Website |
<span style="font-weight: 700; box-sizing: border-box; color: rgb(99, 102, 106); display: inline; flex-wrap: nowrap; font-size: 10.6667px; grid-area: auto; line-height: 16px; margin: 0px; overflow: visible; text-align: left; text-align-last: left; white-space-collapse: preserve-breaks;">https://westwoodgroup.com/product/quality-smallcap-fund/</span>
|
| Expenses [Text Block] |
What were the Fund’s annualized costs for the last six months?(based on a hypothetical $10,000 investment) Table SummaryClass Name | Costs of a $10,000 investment | Costs paid as a percentage of a $10,000 investment |
|---|
Institutional Shares | $49 | 0.92% |
|---|
|
| Expenses Paid, Amount |
$ 49
|
| Expense Ratio, Percent |
0.92%
|
| Factors Affecting Performance [Text Block] |
How did the Fund perform during the reporting period? The Westwood Quality SmallCap Fund underperformed its representative benchmark, the Russell 2000® Value Index, in the reporting period. Equity markets experienced increased volatility from geopolitical risks and equity-market shocks, while earnings strength among artificial intelligence (AI)-linked mega-cap technology firms remained a key area of support for equities, especially in the U.S. market. An increase in market breadth that began in late 2025 continued throughout early 2026, as value stocks, small caps and non-U.S. equities experienced periodic leadership as investors sought broader participation and downside resilience. On a relative basis, the top sectors were Financials and Industrials, with stock selection as the primary driver of outperformance for each sector. The Technology and Communications sectors were the worst relative performers for the period, with underperformance in each sector primarily driven by stock selection and mitigated by the interaction between selection and allocation decisions. The top contributor to performance was Veeco Instruments, Inc. (VECO), which advanced due to rapid order growth and backlog expansion and accelerating AI-driven demand in photonics, packaging and optics. Shares of Everus Construction Group, Inc. (ECG) gained after record financial performance and a strategic acquisition of SE&M Constructors. MYR Group, Inc. (MYRG) rose during the period due to significant margin expansion and massive demand tailwinds from grid modernization and data centers. BlackLine, Inc. (BL) was the largest detractor from performance for the period, retreating due to margin compression, weak guidance and slowing revenue growth. Shares of Verra Mobility Corporation (VRRM) also fell due to margin compression, in addition to declining free cash flow and rising capital intensity. Merit Medical Systems, Inc. (MMSI) rounded out the largest detractors, declining due to tariff-driven margin pressure and an earnings miss late in the period. |
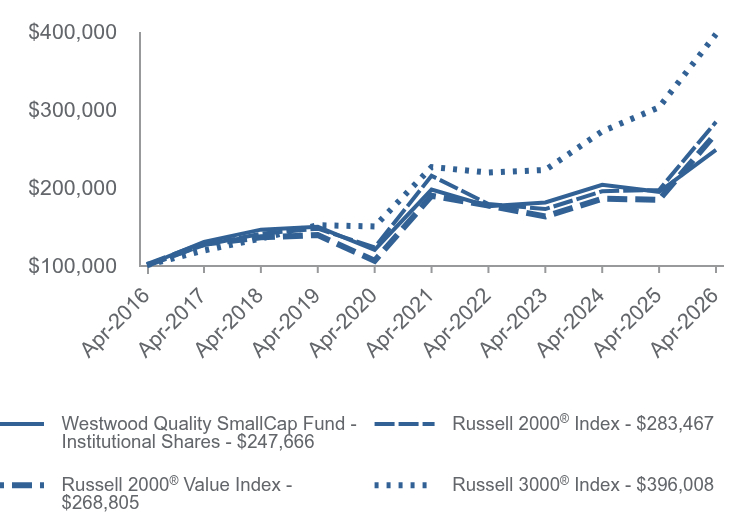
| Line Graph [Table Text Block] |
Table Summary | Westwood Quality SmallCap Fund - Institutional Shares | Russell 2000® Index | Russell 2000® Value Index | Russell 3000® Index |
|---|
Apr-2016 | $100,000 | $100,000 | $100,000 | $100,000 |
|---|
Apr-2017 | $129,710 | $125,628 | $127,182 | $118,583 |
|---|
Apr-2018 | $145,334 | $140,123 | $135,488 | $134,055 |
|---|
Apr-2019 | $148,983 | $146,585 | $138,455 | $151,056 |
|---|
Apr-2020 | $119,275 | $122,560 | $105,441 | $149,482 |
|---|
Apr-2021 | $196,727 | $214,374 | $188,700 | $225,597 |
|---|
Apr-2022 | $175,469 | $178,210 | $176,273 | $218,571 |
|---|
Apr-2023 | $180,271 | $171,714 | $162,194 | $221,856 |
|---|
Apr-2024 | $202,944 | $194,587 | $184,949 | $271,332 |
|---|
Apr-2025 | $193,829 | $196,290 | $183,684 | $302,268 |
|---|
Apr-2026 | $247,666 | $283,467 | $268,805 | $396,008 |
|---|
|
| Average Annual Return [Table Text Block] |
Table Summary | 1 Year | 5 Years | 10 Years |
|---|
Westwood Quality SmallCap Fund - Institutional Shares | 27.78% | 4.71% | 9.49% |
|---|
Russell 2000® Index | 44.41% | 5.75% | 10.98% |
|---|
Russell 2000® Value Index | 46.34% | 7.33% | 10.39% |
|---|
Russell 3000® Index | 31.01% | 11.91% | 14.75% |
|---|
|
| AssetsNet |
$ 909,270,383
|
| Holdings Count | Holding |
68
|
| Advisory Fees Paid, Amount |
$ 3,358,625
|
| InvestmentCompanyPortfolioTurnover |
32.00%
|
| Additional Fund Statistics [Text Block] |
- Net Assets$909,270,383
- Number of Portfolio Holdings68
- Advisory Fee (net of waivers)$3,358,625
- Portfolio Turnover32%
|
| Holdings [Text Block] |
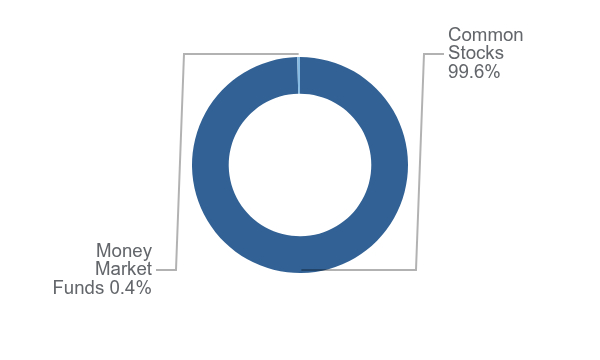
Asset Weighting (% of total investments)Table SummaryValue | Value |
|---|
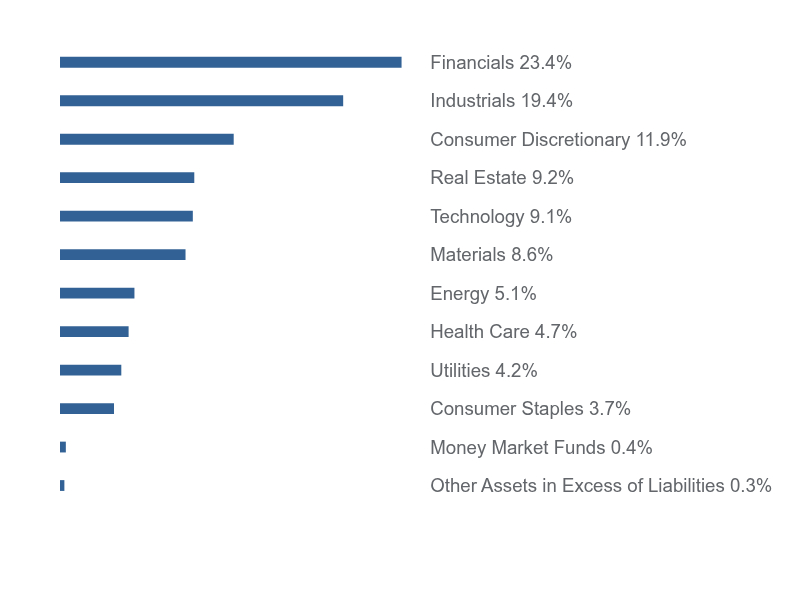
Common Stocks | 99.6% | Money Market Funds | 0.4% | Sector Weighting (% of net assets)Table SummaryValue | Value |
|---|
Other Assets in Excess of Liabilities | 0.3% | Money Market Funds | 0.4% | Consumer Staples | 3.7% | Utilities | 4.2% | Health Care | 4.7% | Energy | 5.1% | Materials | 8.6% | Technology | 9.1% | Real Estate | 9.2% | Consumer Discretionary | 11.9% | Industrials | 19.4% | Financials | 23.4% | |
| Largest Holdings [Text Block] |
Top 10 Holdings (% of net assets)Table SummaryHolding Name | % of Net Assets |
|---|
Veeco Instruments, Inc. | 2.2% |
|---|
Standex International Corporation | 2.2% |
|---|
Urban Edge Properties | 2.1% |
|---|
Sensient Technologies Corporation | 2.1% |
|---|
MYR Group, Inc. | 2.1% |
|---|
Knife River Corporation | 2.1% |
|---|
Hayward Holdings Inc. | 2.1% |
|---|
Nicolet Bankshares, Inc. | 2.1% |
|---|
Atmus Filtration Technologies, Inc. | 2.1% |
|---|
MDU Resources Group, Inc. | 2.1% |
|---|
|
| Material Fund Change [Text Block] |
No material changes occurred during the period ended April 30, 2026. |
| C000229475 |
|
| Shareholder Report [Line Items] |
|
| Fund Name |
Westwood Quality SmallCap Fund
|
| Class Name |
A Class Shares
|
| Trading Symbol |
WHGAX
|
| Annual or Semi-Annual Statement [Text Block] |
This semi-annual shareholder report contains important information about Westwood Quality SmallCap Fund (the "Fund") for the period of November 1, 2025 to April 30, 2026.
|
| Additional Information [Text Block] |
You can find additional information about the Fund at https://westwoodgroup.com/product/quality-smallcap-fund/. You can also request this information by contacting us at (877) 386-3944.
|
| Additional Information Phone Number |
(877) 386-3944
|
| Additional Information Website |
<span style="font-weight: 700; box-sizing: border-box; color: rgb(99, 102, 106); display: inline; flex-wrap: nowrap; font-size: 10.6667px; grid-area: auto; line-height: 16px; margin: 0px; overflow: visible; text-align: left; text-align-last: left; white-space-collapse: preserve-breaks;">https://westwoodgroup.com/product/quality-smallcap-fund/</span>
|
| Expenses [Text Block] |
What were the Fund’s annualized costs for the last six months?(based on a hypothetical $10,000 investment) Table SummaryClass Name | Costs of a $10,000 investment | Costs paid as a percentage of a $10,000 investment |
|---|
A Class Shares | $55 | 1.04% |
|---|
|
| Expenses Paid, Amount |
$ 55
|
| Expense Ratio, Percent |
1.04%
|
| Factors Affecting Performance [Text Block] |
How did the Fund perform during the reporting period? The Westwood Quality SmallCap Fund underperformed its representative benchmark, the Russell 2000® Value Index, in the reporting period. Equity markets experienced increased volatility from geopolitical risks and equity-market shocks, while earnings strength among artificial intelligence (AI)-linked mega-cap technology firms remained a key area of support for equities, especially in the U.S. market. An increase in market breadth that began in late 2025 continued throughout early 2026, as value stocks, small caps and non-U.S. equities experienced periodic leadership as investors sought broader participation and downside resilience. On a relative basis, the top sectors were Financials and Industrials, with stock selection as the primary driver of outperformance for each sector. The Technology and Communications sectors were the worst relative performers for the period, with underperformance in each sector primarily driven by stock selection and mitigated by the interaction between selection and allocation decisions. The top contributor to performance was Veeco Instruments, Inc. (VECO), which advanced due to rapid order growth and backlog expansion and accelerating AI-driven demand in photonics, packaging and optics. Shares of Everus Construction Group, Inc. (ECG) gained after record financial performance and a strategic acquisition of SE&M Constructors. MYR Group, Inc. (MYRG) rose during the period due to significant margin expansion and massive demand tailwinds from grid modernization and data centers. BlackLine, Inc. (BL) was the largest detractor from performance for the period, retreating due to margin compression, weak guidance and slowing revenue growth. Shares of Verra Mobility Corporation (VRRM) also fell due to margin compression, in addition to declining free cash flow and rising capital intensity. Merit Medical Systems, Inc. (MMSI) rounded out the largest detractors, declining due to tariff-driven margin pressure and an earnings miss late in the period. |
| Line Graph [Table Text Block] |
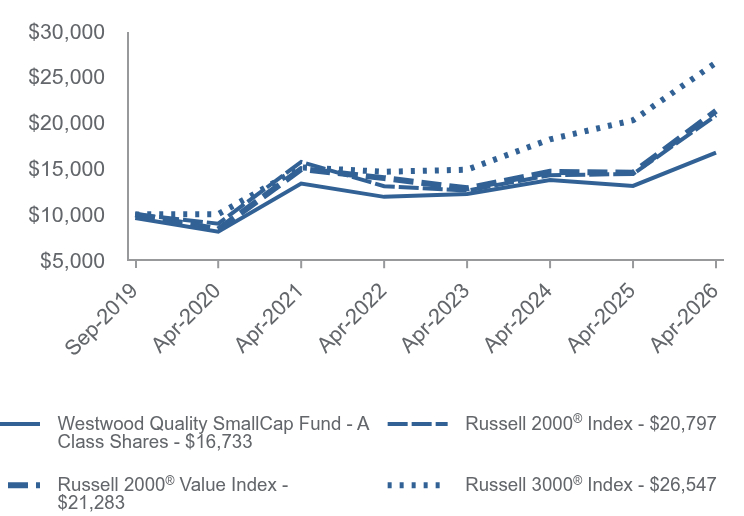
Table Summary | Westwood Quality SmallCap Fund - A Class Shares | Russell 2000® Index | Russell 2000® Value Index | Russell 3000® Index |
|---|
Sep-2019 | $9,599 | $10,000 | $10,000 | $10,000 |
|---|
Apr-2020 | $8,115 | $8,992 | $8,349 | $10,021 |
|---|
Apr-2021 | $13,373 | $15,728 | $14,941 | $15,123 |
|---|
Apr-2022 | $11,913 | $13,075 | $13,957 | $14,652 |
|---|
Apr-2023 | $12,226 | $12,598 | $12,842 | $14,873 |
|---|
Apr-2024 | $13,748 | $14,276 | $14,644 | $18,189 |
|---|
Apr-2025 | $13,108 | $14,401 | $14,544 | $20,263 |
|---|
Apr-2026 | $16,733 | $20,797 | $21,283 | $26,547 |
|---|
|
| Average Annual Return [Table Text Block] |
Table Summary | 1 Year | 5 Years | Since Inception (September 3, 2019) |
|---|
Westwood Quality SmallCap Fund - A Class Shares | | | |
|---|
Without Load | 27.65% | 4.58% | 8.71% |
|---|
With LoadFootnote Reference* | 22.53% | 3.73% | 8.04% |
|---|
Russell 2000® Index | 44.41% | 5.75% | 11.63% |
|---|
Russell 2000® Value Index | 46.34% | 7.33% | 12.01% |
|---|
Russell 3000® Index | 31.01% | 11.91% | 15.80% |
|---|
|
| Performance Inception Date |
Sep. 03, 2019
|
| AssetsNet |
$ 909,270,383
|
| Holdings Count | Holding |
68
|
| Advisory Fees Paid, Amount |
$ 3,358,625
|
| InvestmentCompanyPortfolioTurnover |
32.00%
|
| Additional Fund Statistics [Text Block] |
- Net Assets$909,270,383
- Number of Portfolio Holdings68
- Advisory Fee (net of waivers)$3,358,625
- Portfolio Turnover32%
|
| Holdings [Text Block] |
Asset Weighting (% of total investments)Table SummaryValue | Value |
|---|
Common Stocks | 99.6% | Money Market Funds | 0.4% | Sector Weighting (% of net assets)Table SummaryValue | Value |
|---|
Other Assets in Excess of Liabilities | 0.3% | Money Market Funds | 0.4% | Consumer Staples | 3.7% | Utilities | 4.2% | Health Care | 4.7% | Energy | 5.1% | Materials | 8.6% | Technology | 9.1% | Real Estate | 9.2% | Consumer Discretionary | 11.9% | Industrials | 19.4% | Financials | 23.4% | |
| Largest Holdings [Text Block] |
Top 10 Holdings (% of net assets)Table SummaryHolding Name | % of Net Assets |
|---|
Veeco Instruments, Inc. | 2.2% |
|---|
Standex International Corporation | 2.2% |
|---|
Urban Edge Properties | 2.1% |
|---|
Sensient Technologies Corporation | 2.1% |
|---|
MYR Group, Inc. | 2.1% |
|---|
Knife River Corporation | 2.1% |
|---|
Hayward Holdings Inc. | 2.1% |
|---|
Nicolet Bankshares, Inc. | 2.1% |
|---|
Atmus Filtration Technologies, Inc. | 2.1% |
|---|
MDU Resources Group, Inc. | 2.1% |
|---|
|
| Material Fund Change [Text Block] |
No material changes occurred during the period ended April 30, 2026. |
| Updated Prospectus Phone Number |
(877) 386-3944
|
| Updated Prospectus Web Address |
https://westwoodgroup.com/product/quality-smallcap-fund/
|
| C000229478 |
|
| Shareholder Report [Line Items] |
|
| Fund Name |
Westwood Quality SmallCap Fund
|
| Class Name |
C Class Shares
|
| Trading Symbol |
WHGCX
|
| Annual or Semi-Annual Statement [Text Block] |
This semi-annual shareholder report contains important information about Westwood Quality SmallCap Fund (the "Fund") for the period of November 1, 2025 to April 30, 2026.
|
| Additional Information [Text Block] |
You can find additional information about the Fund at https://westwoodgroup.com/product/quality-smallcap-fund/. You can also request this information by contacting us at (877) 386-3944.
|
| Additional Information Phone Number |
(877) 386-3944
|
| Additional Information Website |
<span style="font-weight: 700; box-sizing: border-box; color: rgb(99, 102, 106); display: inline; flex-wrap: nowrap; font-size: 10.6667px; grid-area: auto; line-height: 16px; margin: 0px; overflow: visible; text-align: left; text-align-last: left; white-space-collapse: preserve-breaks;">https://westwoodgroup.com/product/quality-smallcap-fund/</span>
|
| Expenses [Text Block] |
What were the Fund’s annualized costs for the last six months?(based on a hypothetical $10,000 investment) Table SummaryClass Name | Costs of a $10,000 investment | Costs paid as a percentage of a $10,000 investment |
|---|
C Class Shares | $95 | 1.79% |
|---|
|
| Expenses Paid, Amount |
$ 95
|
| Expense Ratio, Percent |
1.79%
|
| Factors Affecting Performance [Text Block] |
How did the Fund perform during the reporting period? The Westwood Quality SmallCap Fund underperformed its representative benchmark, the Russell 2000® Value Index, in the reporting period. Equity markets experienced increased volatility from geopolitical risks and equity-market shocks, while earnings strength among artificial intelligence (AI)-linked mega-cap technology firms remained a key area of support for equities, especially in the U.S. market. An increase in market breadth that began in late 2025 continued throughout early 2026, as value stocks, small caps and non-U.S. equities experienced periodic leadership as investors sought broader participation and downside resilience. On a relative basis, the top sectors were Financials and Industrials, with stock selection as the primary driver of outperformance for each sector. The Technology and Communications sectors were the worst relative performers for the period, with underperformance in each sector primarily driven by stock selection and mitigated by the interaction between selection and allocation decisions. The top contributor to performance was Veeco Instruments, Inc. (VECO), which advanced due to rapid order growth and backlog expansion and accelerating AI-driven demand in photonics, packaging and optics. Shares of Everus Construction Group, Inc. (ECG) gained after record financial performance and a strategic acquisition of SE&M Constructors. MYR Group, Inc. (MYRG) rose during the period due to significant margin expansion and massive demand tailwinds from grid modernization and data centers. BlackLine, Inc. (BL) was the largest detractor from performance for the period, retreating due to margin compression, weak guidance and slowing revenue growth. Shares of Verra Mobility Corporation (VRRM) also fell due to margin compression, in addition to declining free cash flow and rising capital intensity. Merit Medical Systems, Inc. (MMSI) rounded out the largest detractors, declining due to tariff-driven margin pressure and an earnings miss late in the period. |
| Line Graph [Table Text Block] |
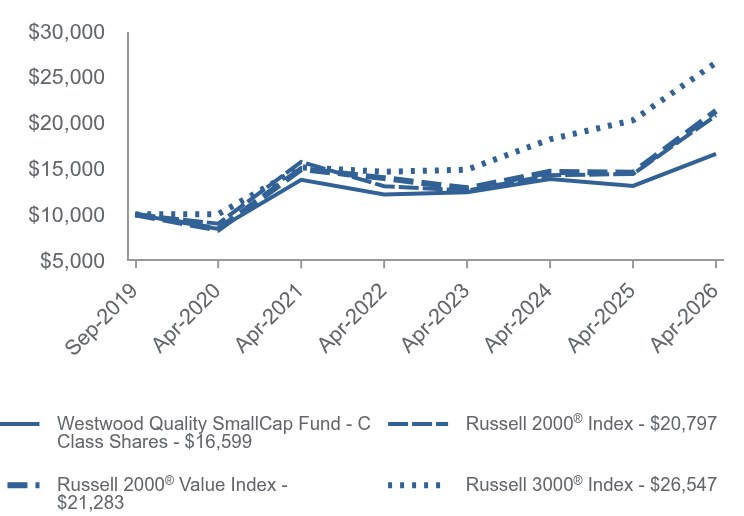
Table Summary | Westwood Quality SmallCap Fund - C Class Shares | Russell 2000® Index | Russell 2000® Value Index | Russell 3000® Index |
|---|
Sep-2019 | $10,000 | $10,000 | $10,000 | $10,000 |
|---|
Apr-2020 | $8,420 | $8,992 | $8,349 | $10,021 |
|---|
Apr-2021 | $13,773 | $15,728 | $14,941 | $15,123 |
|---|
Apr-2022 | $12,180 | $13,075 | $13,957 | $14,652 |
|---|
Apr-2023 | $12,405 | $12,598 | $12,842 | $14,873 |
|---|
Apr-2024 | $13,846 | $14,276 | $14,644 | $18,189 |
|---|
Apr-2025 | $13,106 | $14,401 | $14,544 | $20,263 |
|---|
Apr-2026 | $16,599 | $20,797 | $21,283 | $26,547 |
|---|
|
| Average Annual Return [Table Text Block] |
Table Summary | 1 Year | 5 Years | Since Inception (September 3, 2019) |
|---|
Westwood Quality SmallCap Fund - C Class Shares | | | |
|---|
Without CDSC | 26.65% | 3.80% | 7.91% |
|---|
With CDSC | 25.65% | 3.80% | 7.91% |
|---|
Russell 2000® Index | 44.41% | 5.75% | 11.63% |
|---|
Russell 2000® Value Index | 46.34% | 7.33% | 12.01% |
|---|
Russell 3000® Index | 31.01% | 11.91% | 15.80% |
|---|
|
| Performance Inception Date |
Sep. 03, 2019
|
| AssetsNet |
$ 909,270,383
|
| Holdings Count | Holding |
68
|
| Advisory Fees Paid, Amount |
$ 3,358,625
|
| InvestmentCompanyPortfolioTurnover |
32.00%
|
| Additional Fund Statistics [Text Block] |
- Net Assets$909,270,383
- Number of Portfolio Holdings68
- Advisory Fee (net of waivers)$3,358,625
- Portfolio Turnover32%
|
| Holdings [Text Block] |
Asset Weighting (% of total investments)Table SummaryValue | Value |
|---|
Common Stocks | 99.6% | Money Market Funds | 0.4% | Sector Weighting (% of net assets)Table SummaryValue | Value |
|---|
Other Assets in Excess of Liabilities | 0.3% | Money Market Funds | 0.4% | Consumer Staples | 3.7% | Utilities | 4.2% | Health Care | 4.7% | Energy | 5.1% | Materials | 8.6% | Technology | 9.1% | Real Estate | 9.2% | Consumer Discretionary | 11.9% | Industrials | 19.4% | Financials | 23.4% | |
| Largest Holdings [Text Block] |
Top 10 Holdings (% of net assets)Table SummaryHolding Name | % of Net Assets |
|---|
Veeco Instruments, Inc. | 2.2% |
|---|
Standex International Corporation | 2.2% |
|---|
Urban Edge Properties | 2.1% |
|---|
Sensient Technologies Corporation | 2.1% |
|---|
MYR Group, Inc. | 2.1% |
|---|
Knife River Corporation | 2.1% |
|---|
Hayward Holdings Inc. | 2.1% |
|---|
Nicolet Bankshares, Inc. | 2.1% |
|---|
Atmus Filtration Technologies, Inc. | 2.1% |
|---|
MDU Resources Group, Inc. | 2.1% |
|---|
|
| Material Fund Change [Text Block] |
No material changes occurred during the period ended April 30, 2026. |
| C000229477 |
|
| Shareholder Report [Line Items] |
|
| Fund Name |
Westwood Quality SmallCap Fund
|
| Class Name |
Ultra Shares
|
| Trading Symbol |
WWSYX
|
| Annual or Semi-Annual Statement [Text Block] |
This semi-annual shareholder report contains important information about Westwood Quality SmallCap Fund (the "Fund") for the period of November 1, 2025 to April 30, 2026.
|
| Additional Information [Text Block] |
You can find additional information about the Fund at https://westwoodgroup.com/product/quality-smallcap-fund/. You can also request this information by contacting us at (877) 386-3944.
|
| Additional Information Phone Number |
(877) 386-3944
|
| Additional Information Website |
<span style="font-weight: 700; box-sizing: border-box; color: rgb(99, 102, 106); display: inline; flex-wrap: nowrap; font-size: 10.6667px; grid-area: auto; line-height: 16px; margin: 0px; overflow: visible; text-align: left; text-align-last: left; white-space-collapse: preserve-breaks;">https://westwoodgroup.com/product/quality-smallcap-fund/</span>
|
| Expenses [Text Block] |
What were the Fund’s annualized costs for the last six months?(based on a hypothetical $10,000 investment) Table SummaryClass Name | Costs of a $10,000 investment | Costs paid as a percentage of a $10,000 investment |
|---|
Ultra Shares | $42 | 0.79% |
|---|
|
| Expenses Paid, Amount |
$ 42
|
| Expense Ratio, Percent |
0.79%
|
| Factors Affecting Performance [Text Block] |
How did the Fund perform during the reporting period? The Westwood Quality SmallCap Fund underperformed its representative benchmark, the Russell 2000® Value Index, in the reporting period. Equity markets experienced increased volatility from geopolitical risks and equity-market shocks, while earnings strength among artificial intelligence (AI)-linked mega-cap technology firms remained a key area of support for equities, especially in the U.S. market. An increase in market breadth that began in late 2025 continued throughout early 2026, as value stocks, small caps and non-U.S. equities experienced periodic leadership as investors sought broader participation and downside resilience. On a relative basis, the top sectors were Financials and Industrials, with stock selection as the primary driver of outperformance for each sector. The Technology and Communications sectors were the worst relative performers for the period, with underperformance in each sector primarily driven by stock selection and mitigated by the interaction between selection and allocation decisions. The top contributor to performance was Veeco Instruments, Inc. (VECO), which advanced due to rapid order growth and backlog expansion and accelerating AI-driven demand in photonics, packaging and optics. Shares of Everus Construction Group, Inc. (ECG) gained after record financial
performance and a strategic acquisition of SE&M Constructors. MYR Group, Inc. (MYRG) rose during the period due to significant margin expansion and massive demand tailwinds from grid modernization and data centers. BlackLine, Inc. (BL) was the largest detractor from performance for the period, retreating due to margin compression, weak guidance and slowing revenue growth. Shares of Verra Mobility Corporation (VRRM) also fell due to margin compression, in addition to declining free cash flow and rising capital intensity. Merit Medical Systems, Inc. (MMSI) rounded out the largest detractors, declining due to tariff-driven margin pressure and an earnings miss late in the period. |
| Line Graph [Table Text Block] |
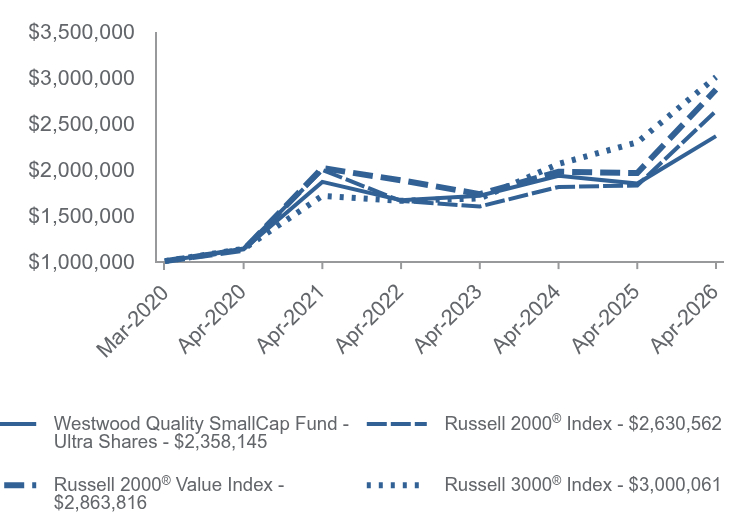
Table Summary | Westwood Quality SmallCap Fund - Ultra Shares | Russell 2000® Index | Russell 2000® Value Index | Russell 3000® Index |
|---|
Mar-2020 | $1,000,000 | $1,000,000 | $1,000,000 | $1,000,000 |
|---|
Apr-2020 | $1,126,280 | $1,137,354 | $1,123,356 | $1,132,439 |
|---|
Apr-2021 | $1,860,826 | $1,989,379 | $2,010,391 | $1,709,066 |
|---|
Apr-2022 | $1,661,728 | $1,653,783 | $1,877,988 | $1,655,839 |
|---|
Apr-2023 | $1,709,594 | $1,593,498 | $1,728,000 | $1,680,725 |
|---|
Apr-2024 | $1,927,694 | $1,805,760 | $1,970,423 | $2,055,546 |
|---|
Apr-2025 | $1,842,372 | $1,821,559 | $1,956,945 | $2,289,909 |
|---|
Apr-2026 | $2,358,145 | $2,630,562 | $2,863,816 | $3,000,061 |
|---|
|
| Average Annual Return [Table Text Block] |
Table Summary | 1 Year | 5 Years | Since Inception (March 31, 2020) |
|---|
Westwood Quality SmallCap Fund - Ultra Shares | 28.00% | 4.85% | 15.15% |
|---|
Russell 2000® Index | 44.41% | 5.75% | 17.24% |
|---|
Russell 2000® Value Index | 46.34% | 7.33% | 18.89% |
|---|
Russell 3000® Index | 31.01% | 11.91% | 19.80% |
|---|
|
| Performance Inception Date |
Mar. 31, 2020
|
| AssetsNet |
$ 909,270,383
|
| Holdings Count | Holding |
68
|
| Advisory Fees Paid, Amount |
$ 3,358,625
|
| InvestmentCompanyPortfolioTurnover |
32.00%
|
| Additional Fund Statistics [Text Block] |
- Net Assets$909,270,383
- Number of Portfolio Holdings68
- Advisory Fee (net of waivers)$3,358,625
- Portfolio Turnover32%
|
| Holdings [Text Block] |
Asset Weighting (% of total investments)Table SummaryValue | Value |
|---|
Common Stocks | 99.6% | Money Market Funds | 0.4% | Sector Weighting (% of net assets)Table SummaryValue | Value |
|---|
Other Assets in Excess of Liabilities | 0.3% | Money Market Funds | 0.4% | Consumer Staples | 3.7% | Utilities | 4.2% | Health Care | 4.7% | Energy | 5.1% | Materials | 8.6% | Technology | 9.1% | Real Estate | 9.2% | Consumer Discretionary | 11.9% | Industrials | 19.4% | Financials | 23.4% | |
| Largest Holdings [Text Block] |
Top 10 Holdings (% of net assets)Table SummaryHolding Name | % of Net Assets |
|---|
Veeco Instruments, Inc. | 2.2% |
|---|
Standex International Corporation | 2.2% |
|---|
Urban Edge Properties | 2.1% |
|---|
Sensient Technologies Corporation | 2.1% |
|---|
MYR Group, Inc. | 2.1% |
|---|
Knife River Corporation | 2.1% |
|---|
Hayward Holdings Inc. | 2.1% |
|---|
Nicolet Bankshares, Inc. | 2.1% |
|---|
Atmus Filtration Technologies, Inc. | 2.1% |
|---|
MDU Resources Group, Inc. | 2.1% |
|---|
|
| Material Fund Change [Text Block] |
No material changes occurred during the period ended April 30, 2026. |
| C000229473 |
|
| Shareholder Report [Line Items] |
|
| Fund Name |
Westwood Income Opportunity Fund
|
| Class Name |
Institutional Shares
|
| Trading Symbol |
WHGIX
|
| Annual or Semi-Annual Statement [Text Block] |
This semi-annual shareholder report contains important information about Westwood Income Opportunity Fund (the "Fund") for the period of November 1, 2025 to April 30, 2026.
|
| Additional Information [Text Block] |
You can find additional information about the Fund at https://westwoodgroup.com/product/income-opportunity-fund/. You can also request this information by contacting us at (877) 386-3944.
|
| Additional Information Phone Number |
(877) 386-3944
|
| Additional Information Website |
<span style="font-weight: 700; box-sizing: border-box; color: rgb(99, 102, 106); display: inline; flex-wrap: nowrap; font-size: 10.6667px; grid-area: auto; line-height: 12.8px; margin: 0px; overflow: visible; text-align: left; text-align-last: left; white-space-collapse: preserve-breaks;">https://westwoodgroup.com/product/income-opportunity-fund/</span>
|
| Expenses [Text Block] |
What were the Fund’s annualized costs for the last six months?(based on a hypothetical $10,000 investment) Table SummaryClass Name | Costs of a $10,000 investment | Costs paid as a percentage of a $10,000 investment |
|---|
Institutional Shares | $41 | 0.81% |
|---|
|
| Expenses Paid, Amount |
$ 41
|
| Expense Ratio, Percent |
0.81%
|
| Factors Affecting Performance [Text Block] |
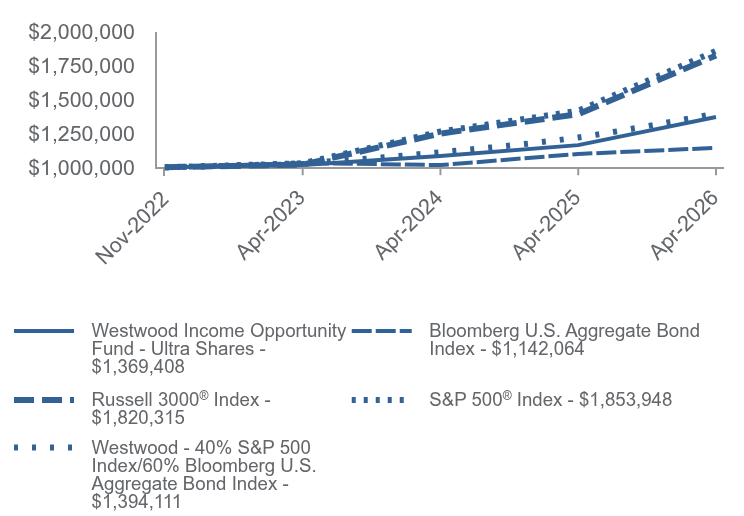
How did the Fund perform during the reporting period? For the trailing period, the Westwood Income Opportunity Fund outperformed its representative benchmark. Equity markets experienced increased volatility from geopolitical risks and equity-market shocks, while earnings strength among artificial intelligence-linked mega-cap technology firms remained a key area of support for equities, especially in the U.S. market. An increase in market breadth that began in late 2025 continued throughout early 2026, as value stocks, small caps and non-U.S. equities experienced periodic leadership as investors sought broader participation and downside resilience. In the fixed income market, returns were dominated by changing expectations for gradual monetary easing rather than aggressive rate cuts. Cooling headline inflation helped bond prices, but sticky core inflation limited gains and kept real yields elevated, reinforcing a “higher for longer” bond environment. Spikes in oil prices complicated inflation expectations, reducing the durability of safe-haven rallies in U.S. Treasuries and core sovereign bonds. Within the equity sleeve, stock selection was the largest contributor to relative outperformance, followed by strong allocation. Off-benchmark allocations to ADRs, MLPs and REITs all contributed positively to relative performance for the period, with the allocation to convertibles modestly detracting from performance. Within the fixed income sleeve, the portfolio benefited from both its relative underweight allocation to the asset class overall and positioning within the sleeve itself, with corporate bond spread exposure contributing positively to relative performance during the trailing period. Selection within the asset class mitigated a portion of the fixed income sleeve’s outperformance, with the allocation to Treasuries serving as the largest detractor from relative performance due to a combination of selection, changes in spreads and shifts in the yield curve during the period. |
| Line Graph [Table Text Block] |
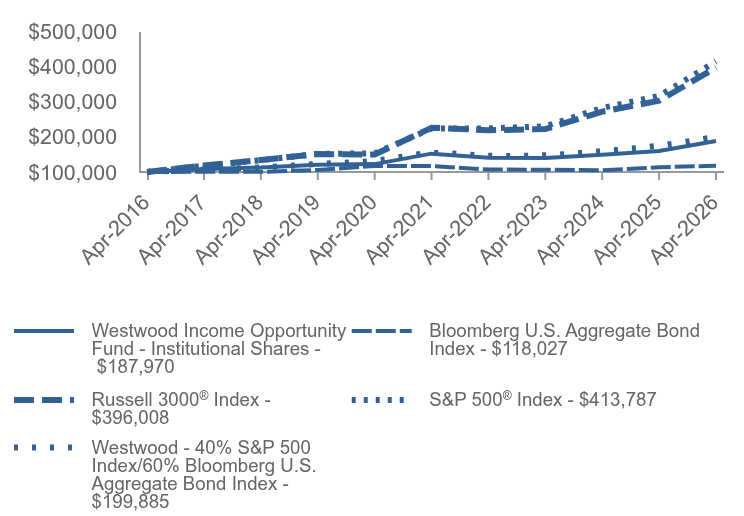
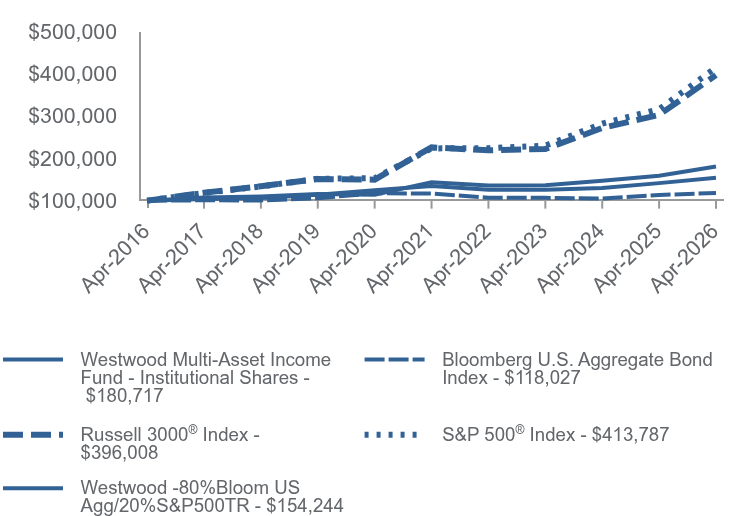
Table Summary | Westwood Income Opportunity Fund - Institutional Shares | Bloomberg U.S. Aggregate Bond Index | Russell 3000® Index | S&P 500® Index | Westwood - 40% S&P 500 Index/60% Bloomberg U.S. Aggregate Bond Index |
|---|
Apr-2016 | $100,000 | $100,000 | $100,000 | $100,000 | $100,000 |
|---|
Apr-2017 | $108,536 | $100,829 | $118,583 | $117,918 | $107,434 |
|---|
Apr-2018 | $112,621 | $100,507 | $134,055 | $133,562 | $112,827 |
|---|
Apr-2019 | $120,354 | $105,824 | $151,056 | $151,585 | $122,802 |
|---|
Apr-2020 | $122,443 | $117,297 | $149,482 | $152,893 | $131,904 |
|---|
Apr-2021 | $152,123 | $116,984 | $225,597 | $223,196 | $153,733 |
|---|
Apr-2022 | $140,442 | $107,026 | $218,571 | $223,672 | $146,185 |
|---|
Apr-2023 | $139,858 | $106,569 | $221,856 | $229,631 | $147,790 |
|---|
Apr-2024 | $148,896 | $105,004 | $271,332 | $281,669 | $159,221 |
|---|
Apr-2025 | $159,562 | $113,426 | $302,268 | $315,741 | $174,761 |
|---|
Apr-2026 | $187,970 | $118,027 | $396,008 | $413,787 | $199,885 |
|---|
|
| Average Annual Return [Table Text Block] |
Table Summary | 1 Year | 5 Years | 10 Years |
|---|
Westwood Income Opportunity Fund - Institutional Shares | 17.80% | 4.32% | 6.51% |
|---|
Bloomberg U.S. Aggregate Bond Index | 4.06% | 0.18% | 1.67% |
|---|
Russell 3000® Index | 31.01% | 11.91% | 14.75% |
|---|
S&P 500® Index | 31.05% | 13.14% | 15.26% |
|---|
Westwood - 40% S&P 500 Index/60% Bloomberg U.S. Aggregate Bond Index | 14.38% | 5.39% | 7.17% |
|---|
|
| AssetsNet |
$ 599,012,095
|
| Holdings Count | Holding |
156
|
| Advisory Fees Paid, Amount |
$ 1,827,165
|
| InvestmentCompanyPortfolioTurnover |
24.00%
|
| Additional Fund Statistics [Text Block] |
- Net Assets$599,012,095
- Number of Portfolio Holdings156
- Advisory Fee (net of waivers)$1,827,165
- Portfolio Turnover24%
|
| Holdings [Text Block] |
Asset Weighting (% of total investments)Table SummaryValue | Value |
|---|
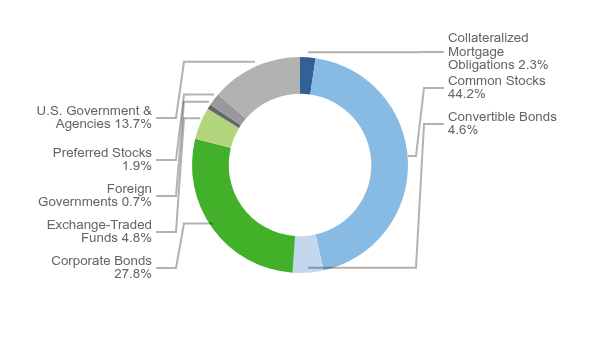
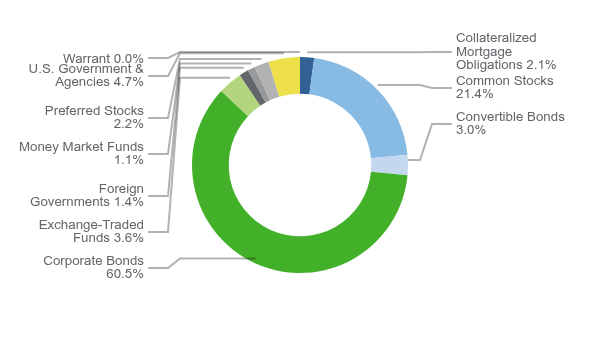
Collateralized Mortgage Obligations | 2.3% | Common Stocks | 44.2% | Convertible Bonds | 4.6% | Corporate Bonds | 27.8% | Exchange-Traded Funds | 4.8% | Foreign Governments | 0.7% | Preferred Stocks | 1.9% | U.S. Government & Agencies | 13.7% | Sector Weighting (% of net assets)Table SummaryValue | Value |
|---|
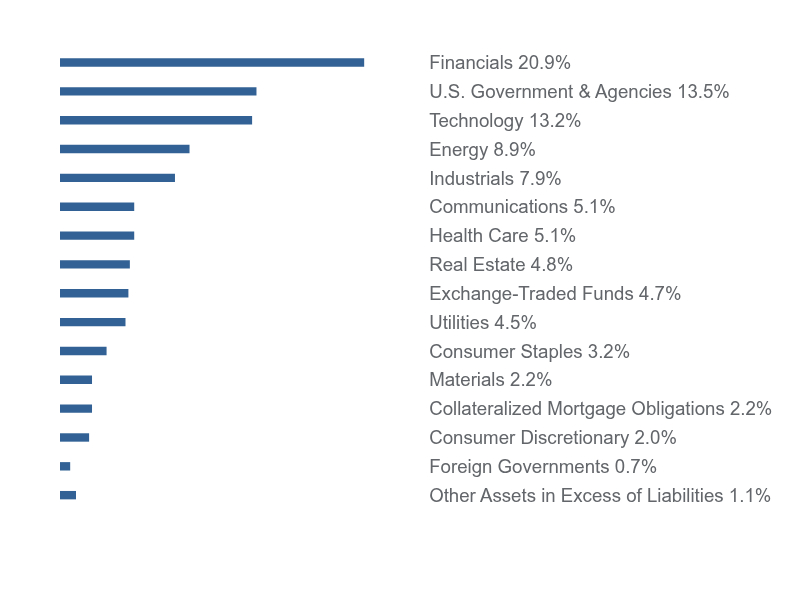
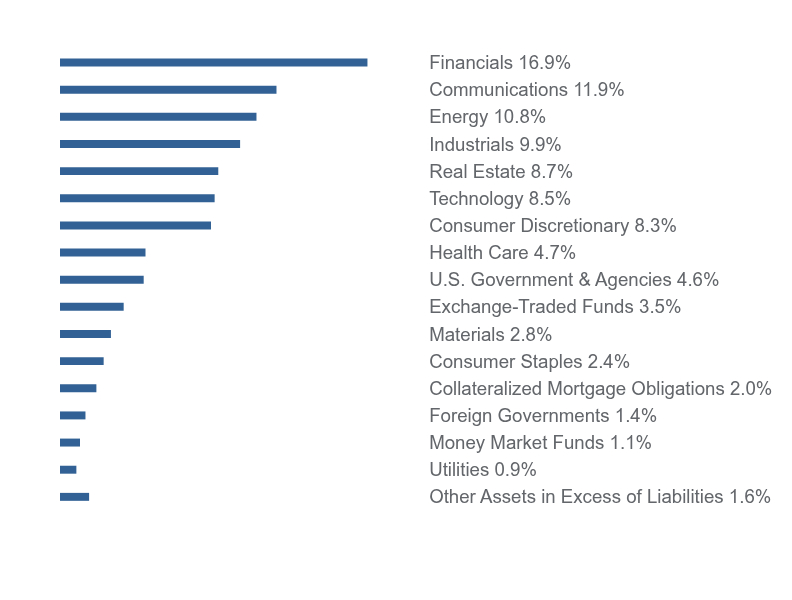
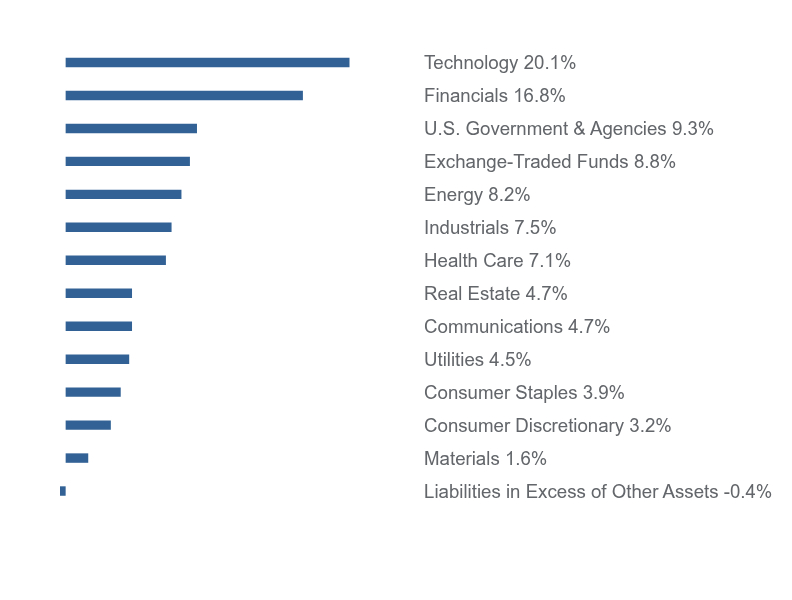
Other Assets in Excess of Liabilities | 1.1% | Foreign Governments | 0.7% | Consumer Discretionary | 2.0% | Collateralized Mortgage Obligations | 2.2% | Materials | 2.2% | Consumer Staples | 3.2% | Utilities | 4.5% | Exchange-Traded Funds | 4.7% | Real Estate | 4.8% | Health Care | 5.1% | Communications | 5.1% | Industrials | 7.9% | Energy | 8.9% | Technology | 13.2% | U.S. Government & Agencies | 13.5% | Financials | 20.9% | |
| Largest Holdings [Text Block] |
Top 10 Holdings (% of net assets)Table SummaryHolding Name | % of Net Assets |
|---|
Alphabet, Inc. - Class A | 2.5% |
|---|
NVIDIA Corporation | 2.0% |
|---|
Westwood Enhanced Income Opportunity ETF | 1.8% |
|---|
Gilead Sciences, Inc. | 1.8% |
|---|
Microsoft Corporation | 1.5% |
|---|
Wells Fargo & Company | 1.3% |
|---|
Barrick Mining Corporation | 1.3% |
|---|
Johnson & Johnson | 1.2% |
|---|
JPMorgan Nasdaq Equity Premium Income ETF | 1.2% |
|---|
JPMorgan Chase & Company | 1.2% |
|---|
|
| Material Fund Change [Text Block] |
No material changes occurred during the period ended April 30, 2026. |
| C000229474 |
|
| Shareholder Report [Line Items] |
|
| Fund Name |
Westwood Income Opportunity Fund
|
| Class Name |
A Class Shares
|
| Trading Symbol |
WWIAX
|
| Annual or Semi-Annual Statement [Text Block] |
This semi-annual shareholder report contains important information about Westwood Income Opportunity Fund (the "Fund") for the period of November 1, 2025 to April 30, 2026.
|
| Additional Information [Text Block] |
You can find additional information about the Fund at https://westwoodgroup.com/product/income-opportunity-fund/. You can also request this information by contacting us at (877) 386-3944.
|
| Additional Information Phone Number |
(877) 386-3944
|
| Additional Information Website |
<span style="font-weight: 700; box-sizing: border-box; color: rgb(99, 102, 106); display: inline; flex-wrap: nowrap; font-size: 10.6667px; grid-area: auto; line-height: 12.8px; margin: 0px; overflow: visible; text-align: left; text-align-last: left; white-space-collapse: preserve-breaks;">https://westwoodgroup.com/product/income-opportunity-fund/</span>
|
| Expenses [Text Block] |
What were the Fund’s annualized costs for the last six months?(based on a hypothetical $10,000 investment) Table SummaryClass Name | Costs of a $10,000 investment | Costs paid as a percentage of a $10,000 investment |
|---|
A Class Shares | $50 | 0.98% |
|---|
|
| Expenses Paid, Amount |
$ 50
|
| Expense Ratio, Percent |
0.98%
|
| Factors Affecting Performance [Text Block] |
How did the Fund perform during the reporting period? For the trailing period, the Westwood Income Opportunity Fund outperformed its representative benchmark. Equity markets experienced increased volatility from geopolitical risks and equity-market shocks, while earnings strength among artificial intelligence-linked mega-cap technology firms remained a key area of support for equities, especially in the U.S. market. An increase in market breadth that began in late 2025 continued throughout early 2026, as value stocks, small caps and non-U.S. equities experienced periodic leadership as investors sought broader participation and downside resilience. In the fixed income market, returns were dominated by changing expectations for gradual monetary easing rather than aggressive rate cuts. Cooling headline inflation helped bond prices, but sticky core inflation limited gains and kept real yields elevated, reinforcing a “higher for longer” bond environment. Spikes in oil prices complicated inflation expectations, reducing the durability of safe-haven rallies in U.S. Treasuries and core sovereign bonds. Within the equity sleeve, stock selection was the largest contributor to relative outperformance, followed by strong allocation. Off-benchmark allocations to ADRs, MLPs and REITs all contributed positively to relative performance for the period, with the allocation to convertibles modestly detracting from performance. Within the fixed income sleeve, the portfolio benefited from both its relative underweight allocation to the asset class overall and positioning within the sleeve itself, with corporate bond spread exposure contributing positively to relative performance during the trailing period. Selection within the asset class mitigated a portion of the fixed income sleeve’s outperformance, with the allocation to Treasuries serving as the largest detractor from relative performance due to a combination of selection, changes in spreads and shifts in the yield curve during the period. |
| Line Graph [Table Text Block] |
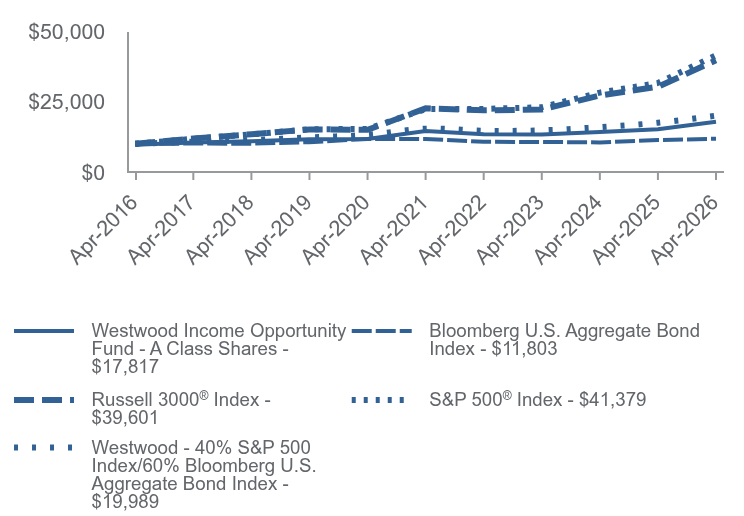
Table Summary | Westwood Income Opportunity Fund - A Class Shares | Bloomberg U.S. Aggregate Bond Index | Russell 3000® Index | S&P 500® Index | Westwood - 40% S&P 500 Index/60% Bloomberg U.S. Aggregate Bond Index |
|---|
Apr-2016 | $9,697 | $10,000 | $10,000 | $10,000 | $10,000 |
|---|
Apr-2017 | $10,499 | $10,083 | $11,858 | $11,792 | $10,743 |
|---|
Apr-2018 | $10,866 | $10,051 | $13,406 | $13,356 | $11,283 |
|---|
Apr-2019 | $11,583 | $10,582 | $15,106 | $15,158 | $12,280 |
|---|
Apr-2020 | $11,744 | $11,730 | $14,948 | $15,289 | $13,190 |
|---|
Apr-2021 | $14,560 | $11,698 | $22,560 | $22,320 | $15,373 |
|---|
Apr-2022 | $13,407 | $10,703 | $21,857 | $22,367 | $14,618 |
|---|
Apr-2023 | $13,320 | $10,657 | $22,186 | $22,963 | $14,779 |
|---|
Apr-2024 | $14,168 | $10,500 | $27,133 | $28,167 | $15,922 |
|---|
Apr-2025 | $15,163 | $11,343 | $30,227 | $31,574 | $17,476 |
|---|
Apr-2026 | $17,817 | $11,803 | $39,601 | $41,379 | $19,989 |
|---|
|
| Average Annual Return [Table Text Block] |
Table Summary | 1 Year | 5 Years | 10 Years |
|---|
Westwood Income Opportunity Fund - A Class Shares | | | |
|---|
Without Load | 17.51% | 4.12% | 6.27% |
|---|
With Load* | 13.99% | 3.49% | 5.95% |
|---|
Bloomberg U.S. Aggregate Bond Index | 4.06% | 0.18% | 1.67% |
|---|
Russell 3000® Index | 31.01% | 11.91% | 14.75% |
|---|
S&P 500® Index | 31.05% | 13.14% | 15.26% |
|---|
Westwood - 40% S&P 500 Index/60% Bloomberg U.S. Aggregate Bond Index | 14.38% | 5.39% | 7.17% |
|---|
|
| AssetsNet |
$ 599,012,095
|
| Holdings Count | Holding |
156
|
| Advisory Fees Paid, Amount |
$ 1,827,165
|
| InvestmentCompanyPortfolioTurnover |
24.00%
|
| Additional Fund Statistics [Text Block] |
- Net Assets$599,012,095
- Number of Portfolio Holdings156
- Advisory Fee (net of waivers)$1,827,165
- Portfolio Turnover24%
|
| Holdings [Text Block] |
Asset Weighting (% of total investments)Table SummaryValue | Value |
|---|
Collateralized Mortgage Obligations | 2.3% | Common Stocks | 44.2% | Convertible Bonds | 4.6% | Corporate Bonds | 27.8% | Exchange-Traded Funds | 4.8% | Foreign Governments | 0.7% | Preferred Stocks | 1.9% | U.S. Government & Agencies | 13.7% | Sector Weighting (% of net assets)Table SummaryValue | Value |
|---|
Other Assets in Excess of Liabilities | 1.1% | Foreign Governments | 0.7% | Consumer Discretionary | 2.0% | Collateralized Mortgage Obligations | 2.2% | Materials | 2.2% | Consumer Staples | 3.2% | Utilities | 4.5% | Exchange-Traded Funds | 4.7% | Real Estate | 4.8% | Health Care | 5.1% | Communications | 5.1% | Industrials | 7.9% | Energy | 8.9% | Technology | 13.2% | U.S. Government & Agencies | 13.5% | Financials | 20.9% | |
| Largest Holdings [Text Block] |
Top 10 Holdings (% of net assets)Table SummaryHolding Name | % of Net Assets |
|---|
Alphabet, Inc. - Class A | 2.5% |
|---|
NVIDIA Corporation | 2.0% |
|---|
Westwood Enhanced Income Opportunity ETF | 1.8% |
|---|
Gilead Sciences, Inc. | 1.8% |
|---|
Microsoft Corporation | 1.5% |
|---|
Wells Fargo & Company | 1.3% |
|---|
Barrick Mining Corporation | 1.3% |
|---|
Johnson & Johnson | 1.2% |
|---|
JPMorgan Nasdaq Equity Premium Income ETF | 1.2% |
|---|
JPMorgan Chase & Company | 1.2% |
|---|
|
| Material Fund Change [Text Block] |
No material changes occurred during the period ended April 30, 2026. |
| Updated Prospectus Phone Number |
(877) 386-3944
|
| Updated Prospectus Web Address |
https://westwoodgroup.com/product/income-opportunity-fund/
|
| C000229472 |
|
| Shareholder Report [Line Items] |
|
| Fund Name |
Westwood Income Opportunity Fund
|
| Class Name |
C Class Shares
|
| Trading Symbol |
WWICX
|
| Annual or Semi-Annual Statement [Text Block] |
This semi-annual shareholder report contains important information about Westwood Income Opportunity Fund (the "Fund") for the period of November 1, 2025 to April 30, 2026.
|
| Additional Information [Text Block] |
You can find additional information about the Fund at https://westwoodgroup.com/product/income-opportunity-fund/. You can also request this information by contacting us at (877) 386-3944.
|
| Additional Information Phone Number |
(877) 386-3944
|
| Additional Information Website |
<span style="font-weight: 700; box-sizing: border-box; color: rgb(99, 102, 106); display: inline; flex-wrap: nowrap; font-size: 10.6667px; grid-area: auto; line-height: 12.8px; margin: 0px; overflow: visible; text-align: left; text-align-last: left; white-space-collapse: preserve-breaks;">https://westwoodgroup.com/product/income-opportunity-fund/</span>
|
| Expenses [Text Block] |
What were the Fund’s annualized costs for the last six months?(based on a hypothetical $10,000 investment) Table SummaryClass Name | Costs of a $10,000 investment | Costs paid as a percentage of a $10,000 investment |
|---|
C Class Shares | $88 | 1.73% |
|---|
|
| Expenses Paid, Amount |
$ 88
|
| Expense Ratio, Percent |
1.73%
|
| Factors Affecting Performance [Text Block] |
How did the Fund perform during the reporting period? For the trailing period, the Westwood Income Opportunity Fund outperformed its representative benchmark. Equity markets experienced increased volatility from geopolitical risks and equity-market shocks, while earnings strength among artificial intelligence-linked mega-cap technology firms remained a key area of support for equities, especially in the U.S. market. An increase in market breadth that began in late 2025 continued throughout early 2026, as value stocks, small caps and non-U.S. equities experienced periodic leadership as investors sought broader participation and downside resilience. In the fixed income market, returns were dominated by changing expectations for gradual monetary easing rather than aggressive rate cuts. Cooling headline inflation helped bond prices, but sticky core inflation limited gains and kept real yields elevated, reinforcing a “higher for longer” bond environment. Spikes in oil prices complicated inflation expectations, reducing the durability of safe-haven rallies in U.S. Treasuries and core sovereign bonds. Within the equity sleeve, stock selection was the largest contributor to relative outperformance, followed by strong allocation. Off-benchmark allocations to ADRs, MLPs and REITs all contributed positively to relative performance for the period, with the allocation to convertibles modestly detracting from performance. Within the fixed income sleeve, the portfolio benefited from both its relative underweight allocation to the asset class overall and positioning within the sleeve itself, with corporate bond spread exposure contributing positively to relative performance during the trailing period. Selection within the asset class mitigated a portion of the fixed income sleeve’s outperformance, with the allocation to Treasuries serving as the largest detractor from relative performance due to a combination of selection, changes in spreads and shifts in the yield curve during the period. |
| Line Graph [Table Text Block] |
Table Summary | Westwood Income Opportunity Fund - C Class Shares | Bloomberg U.S. Aggregate Bond Index | Russell 3000® Index | S&P 500® Index | Westwood - 40% S&P 500 Index/60% Bloomberg U.S. Aggregate Bond Index |
|---|
Sep-2019 | $10,000 | $10,000 | $10,000 | $10,000 | $10,000 |
|---|
Apr-2020 | $9,812 | $10,442 | $10,021 | $10,148 | $10,374 |
|---|
Apr-2021 | $12,067 | $10,414 | $15,123 | $14,814 | $12,091 |
|---|
Apr-2022 | $11,033 | $9,528 | $14,652 | $14,846 | $11,498 |
|---|
Apr-2023 | $10,878 | $9,487 | $14,873 | $15,241 | $11,624 |
|---|
Apr-2024 | $11,477 | $9,348 | $18,189 | $18,695 | $12,523 |
|---|
Apr-2025 | $12,196 | $10,097 | $20,263 | $20,957 | $13,745 |
|---|
Apr-2026 | $14,217 | $10,507 | $26,547 | $27,464 | $15,721 |
|---|
|
| Average Annual Return [Table Text Block] |
Table Summary | 1 Year | 5 Years | Since Inception (September 3, 2019) |
|---|
Westwood Income Opportunity Fund - C Class Shares | | | |
|---|
Without CDSC | 16.57% | 3.33% | 5.43% |
|---|
With CDSC | 15.57% | 3.33% | 5.43% |
|---|
Bloomberg U.S. Aggregate Bond Index | 4.06% | 0.18% | 0.75% |
|---|
Russell 3000® Index | 31.01% | 11.91% | 15.80% |
|---|
S&P 500® Index | 31.05% | 13.14% | 16.39% |
|---|
Westwood - 40% S&P 500 Index/60% Bloomberg U.S. Aggregate Bond Index | 14.38% | 5.39% | 7.00% |
|---|
|
| Performance Inception Date |
Sep. 03, 2019
|
| AssetsNet |
$ 599,012,095
|
| Holdings Count | Holding |
156
|
| Advisory Fees Paid, Amount |
$ 1,827,165
|
| InvestmentCompanyPortfolioTurnover |
24.00%
|
| Additional Fund Statistics [Text Block] |
- Net Assets$599,012,095
- Number of Portfolio Holdings156
- Advisory Fee (net of waivers)$1,827,165
- Portfolio Turnover24%
|
| Holdings [Text Block] |
Asset Weighting (% of total investments)Table SummaryValue | Value |
|---|
Collateralized Mortgage Obligations | 2.3% | Common Stocks | 44.2% | Convertible Bonds | 4.6% | Corporate Bonds | 27.8% | Exchange-Traded Funds | 4.8% | Foreign Governments | 0.7% | Preferred Stocks | 1.9% | U.S. Government & Agencies | 13.7% | Sector Weighting (% of net assets)Table SummaryValue | Value |
|---|
Other Assets in Excess of Liabilities | 1.1% | Foreign Governments | 0.7% | Consumer Discretionary | 2.0% | Collateralized Mortgage Obligations | 2.2% | Materials | 2.2% | Consumer Staples | 3.2% | Utilities | 4.5% | Exchange-Traded Funds | 4.7% | Real Estate | 4.8% | Health Care | 5.1% | Communications | 5.1% | Industrials | 7.9% | Energy | 8.9% | Technology | 13.2% | U.S. Government & Agencies | 13.5% | Financials | 20.9% | |
| Largest Holdings [Text Block] |
Top 10 Holdings (% of net assets)Table SummaryHolding Name | % of Net Assets |
|---|
Alphabet, Inc. - Class A | 2.5% |
|---|
NVIDIA Corporation | 2.0% |
|---|
Westwood Enhanced Income Opportunity ETF | 1.8% |
|---|
Gilead Sciences, Inc. | 1.8% |
|---|
Microsoft Corporation | 1.5% |
|---|
Wells Fargo & Company | 1.3% |
|---|
Barrick Mining Corporation | 1.3% |
|---|
Johnson & Johnson | 1.2% |
|---|
JPMorgan Nasdaq Equity Premium Income ETF | 1.2% |
|---|
JPMorgan Chase & Company | 1.2% |
|---|
|
| Material Fund Change [Text Block] |
No material changes occurred during the period ended April 30, 2026. |
| C000240107 |
|
| Shareholder Report [Line Items] |
|
| Fund Name |
Westwood Income Opportunity Fund
|
| Class Name |
Ultra Shares
|
| Trading Symbol |
WHGOX
|
| Annual or Semi-Annual Statement [Text Block] |
This semi-annual shareholder report contains important information about Westwood Income Opportunity Fund (the "Fund") for the period of November 1, 2025 to April 30, 2026.
|
| Additional Information [Text Block] |
You can find additional information about the Fund at https://westwoodgroup.com/product/income-opportunity-fund/. You can also request this information by contacting us at (877) 386-3944.
|
| Additional Information Phone Number |
(877) 386-3944
|
| Additional Information Website |
<span style="font-weight: 700; box-sizing: border-box; color: rgb(99, 102, 106); display: inline; flex-wrap: nowrap; font-size: 10.6667px; grid-area: auto; line-height: 12.8px; margin: 0px; overflow: visible; text-align: left; text-align-last: left; white-space-collapse: preserve-breaks;">https://westwoodgroup.com/product/income-opportunity-fund/</span>
|
| Expenses [Text Block] |
What were the Fund’s annualized costs for the last six months?(based on a hypothetical $10,000 investment) Table SummaryClass Name | Costs of a $10,000 investment | Costs paid as a percentage of a $10,000 investment |
|---|
Ultra Shares | $37 | 0.73% |
|---|
|
| Expenses Paid, Amount |
$ 37
|
| Expense Ratio, Percent |
0.73%
|
| Factors Affecting Performance [Text Block] |
How did the Fund perform during the reporting period? For the trailing period, the Westwood Income Opportunity Fund outperformed its representative benchmark. Equity markets experienced increased volatility from geopolitical risks and equity-market shocks, while earnings strength among artificial intelligence-linked mega-cap technology firms remained a key area of support for equities, especially in the U.S. market. An increase in market breadth that began in late 2025 continued throughout early 2026, as value stocks, small caps and non-U.S. equities experienced periodic leadership as investors sought broader participation and downside resilience. In the fixed income market, returns were dominated by changing expectations for gradual monetary easing rather than aggressive rate cuts. Cooling headline inflation helped bond prices, but sticky core inflation limited gains and kept real yields elevated, reinforcing a “higher for longer” bond environment. Spikes in oil prices complicated inflation expectations, reducing the durability of safe-haven rallies in U.S. Treasuries and core sovereign bonds. Within the equity sleeve, stock selection was the
largest contributor to relative outperformance, followed by strong allocation. Off-benchmark allocations to ADRs, MLPs and REITs all contributed positively to relative performance for the period, with the allocation to convertibles modestly detracting from performance. Within the fixed income sleeve, the portfolio benefited from both its relative underweight allocation to the asset class overall and positioning within the sleeve itself, with corporate bond spread exposure contributing positively to relative performance during the trailing period. Selection within the asset class mitigated a portion of the fixed income sleeve’s outperformance, with the allocation to Treasuries serving as the largest detractor from relative performance due to a combination of selection, changes in spreads and shifts in the yield curve during the period. |
| Line Graph [Table Text Block] |
Table Summary | Westwood Income Opportunity Fund - Ultra Shares | Bloomberg U.S. Aggregate Bond Index | Russell 3000® Index | S&P 500® Index | Westwood - 40% S&P 500 Index/60% Bloomberg U.S. Aggregate Bond Index |
|---|
Nov-2022 | $1,000,000 | $1,000,000 | $1,000,000 | $1,000,000 | $1,000,000 |
|---|
Apr-2023 | $1,016,087 | $1,031,190 | $1,019,796 | $1,028,849 | $1,030,766 |
|---|
Apr-2024 | $1,083,408 | $1,016,049 | $1,247,221 | $1,262,003 | $1,110,498 |
|---|
Apr-2025 | $1,162,350 | $1,097,541 | $1,389,423 | $1,414,657 | $1,218,878 |
|---|
Apr-2026 | $1,369,408 | $1,142,064 | $1,820,315 | $1,853,948 | $1,394,111 |
|---|
|
| Average Annual Return [Table Text Block] |
Table Summary | 1 Year | Since Inception (November 30, 2022) |
|---|
Westwood Income Opportunity Fund - Ultra Shares | 17.81% | 9.65% |
|---|
Bloomberg U.S. Aggregate Bond Index | 4.06% | 3.97% |
|---|
Russell 3000® Index | 31.01% | 19.18% |
|---|
S&P 500® Index | 31.05% | 19.82% |
|---|
Westwood - 40% S&P 500 Index/60% Bloomberg U.S. Aggregate Bond Index | 14.38% | 10.74% |
|---|
|
| Performance Inception Date |
Nov. 30, 2022
|
| AssetsNet |
$ 599,012,095
|
| Holdings Count | Holding |
156
|
| Advisory Fees Paid, Amount |
$ 1,827,165
|
| InvestmentCompanyPortfolioTurnover |
24.00%
|
| Additional Fund Statistics [Text Block] |
- Net Assets$599,012,095
- Number of Portfolio Holdings156
- Advisory Fee (net of waivers)$1,827,165
- Portfolio Turnover24%
|
| Holdings [Text Block] |
Asset Weighting (% of total investments)Table SummaryValue | Value |
|---|
Collateralized Mortgage Obligations | 2.3% | Common Stocks | 44.2% | Convertible Bonds | 4.6% | Corporate Bonds | 27.8% | Exchange-Traded Funds | 4.8% | Foreign Governments | 0.7% | Preferred Stocks | 1.9% | U.S. Government & Agencies | 13.7% | Sector Weighting (% of net assets)Table SummaryValue | Value |
|---|
Other Assets in Excess of Liabilities | 1.1% | Foreign Governments | 0.7% | Consumer Discretionary | 2.0% | Collateralized Mortgage Obligations | 2.2% | Materials | 2.2% | Consumer Staples | 3.2% | Utilities | 4.5% | Exchange-Traded Funds | 4.7% | Real Estate | 4.8% | Health Care | 5.1% | Communications | 5.1% | Industrials | 7.9% | Energy | 8.9% | Technology | 13.2% | U.S. Government & Agencies | 13.5% | Financials | 20.9% | |
| Largest Holdings [Text Block] |
Top 10 Holdings (% of net assets)Table SummaryHolding Name | % of Net Assets |
|---|
Alphabet, Inc. - Class A | 2.5% |
|---|
NVIDIA Corporation | 2.0% |
|---|
Westwood Enhanced Income Opportunity ETF | 1.8% |
|---|
Gilead Sciences, Inc. | 1.8% |
|---|
Microsoft Corporation | 1.5% |
|---|
Wells Fargo & Company | 1.3% |
|---|
Barrick Mining Corporation | 1.3% |
|---|
Johnson & Johnson | 1.2% |
|---|
JPMorgan Nasdaq Equity Premium Income ETF | 1.2% |
|---|
JPMorgan Chase & Company | 1.2% |
|---|
|
| Material Fund Change [Text Block] |
No material changes occurred during the period ended April 30, 2026. |
| C000229469 |
|
| Shareholder Report [Line Items] |
|
| Fund Name |
Westwood Multi-Asset Income Fund
|
| Class Name |
Institutional Shares
|
| Trading Symbol |
WHGHX
|
| Annual or Semi-Annual Statement [Text Block] |
This semi-annual shareholder report contains important information about Westwood Multi-Asset Income Fund (the "Fund") for the period of November 1, 2025 to April 30, 2026.
|
| Additional Information [Text Block] |
You can find additional information about the Fund at https://westwoodgroup.com/product/multi-asset-income-fund/. You can also request this information by contacting us at (877) 386-3944.
|
| Additional Information Phone Number |
(877) 386-3944
|
| Additional Information Website |
<span style="font-weight: 700; box-sizing: border-box; color: rgb(99, 102, 106); display: inline; flex-wrap: nowrap; font-size: 10.6667px; grid-area: auto; line-height: 12.8px; margin: 0px; overflow: visible; text-align: left; text-align-last: left; white-space-collapse: preserve-breaks;">https://westwoodgroup.com/product/multi-asset-income-fund/</span>
|
| Expenses [Text Block] |
What were the Fund’s annualized costs for the last six months?(based on a hypothetical $10,000 investment) Table SummaryClass Name | Costs of a $10,000 investment | Costs paid as a percentage of a $10,000 investment |
|---|
Institutional Shares | $35 | 0.69% |
|---|
|
| Expenses Paid, Amount |
$ 35
|
| Expense Ratio, Percent |
0.69%
|
| Factors Affecting Performance [Text Block] |
How did the Fund perform during the reporting period? For the trailing period, the Westwood Multi-Asset Income Fund outperformed its representative benchmark. Equity markets experienced increased volatility from geopolitical risks and equity-market shocks, while earnings strength among artificial intelligence-linked mega-cap technology firms remained a key area of support for equities, especially in the U.S. market. An increase in market breadth that began in late 2025 continued throughout early 2026, as value stocks, small caps and non-U.S. equities experienced periodic leadership as investors sought broader participation and downside resilience. In the fixed income market, returns were dominated by changing expectations for gradual monetary easing rather than aggressive rate cuts. Cooling headline inflation helped bond prices, but sticky core inflation limited gains and kept real yields elevated, reinforcing a “higher for longer” bond environment. Spikes in oil prices complicated inflation expectations, reducing the durability of safe-haven rallies in U.S. Treasuries and core sovereign bonds. Within the equity sleeve, stock selection in common equity was the largest contributor to relative outperformance, followed by allocation to off-benchmark ADRs, REITs and MLPs. The Fund’s allocation to convertible securities mitigated a portion of the outperformance within the sleeve. The fixed income sleeve also contributed to the Fund’s relative outperformance, primarily driven by strong allocation within the asset class, aided by the effect of shifts in the yield curve on corporate bonds during the trailing period. The largest detractor from performance within the asset class was the effect that changes in spreads had on corporate bonds during the period, with high-yield corporate bonds serving as the largest detractor from relative performance. |
| Line Graph [Table Text Block] |
Table Summary | Westwood Multi-Asset Income Fund - Institutional Shares | Bloomberg U.S. Aggregate Bond Index | Russell 3000® Index | S&P 500® Index | Westwood -80%Bloom US Agg/20%S&P500TR |
|---|
Apr-2016 | $100,000 | $100,000 | $100,000 | $100,000 | $100,000 |
|---|
Apr-2017 | $107,186 | $100,829 | $118,583 | $117,918 | $104,093 |
|---|
Apr-2018 | $110,056 | $100,507 | $134,055 | $133,562 | $106,524 |
|---|
Apr-2019 | $115,638 | $105,824 | $151,056 | $151,585 | $114,094 |
|---|
Apr-2020 | $114,059 | $117,297 | $149,482 | $152,893 | $124,619 |
|---|
Apr-2021 | $143,572 | $116,984 | $225,597 | $223,196 | $134,436 |
|---|
Apr-2022 | $135,940 | $107,026 | $218,571 | $223,672 | $125,437 |
|---|
Apr-2023 | $136,277 | $106,569 | $221,856 | $229,631 | $125,916 |
|---|
Apr-2024 | $146,728 | $105,004 | $271,332 | $281,669 | $129,770 |
|---|
Apr-2025 | $158,648 | $113,426 | $302,268 | $315,741 | $141,329 |
|---|
Apr-2026 | $180,717 | $118,027 | $396,008 | $413,787 | $154,244 |
|---|
|
| Average Annual Return [Table Text Block] |
Table Summary | 1 Year | 5 Years | 10 Years |
|---|
Westwood Multi-Asset Income Fund - Institutional Shares | 13.91% | 4.71% | 6.10% |
|---|
Bloomberg U.S. Aggregate Bond Index | 4.06% | 0.18% | 1.67% |
|---|
Russell 3000® Index | 31.01% | 11.91% | 14.75% |
|---|
S&P 500® Index | 31.05% | 13.14% | 15.26% |
|---|
Westwood -80%Bloom US Agg/20%S&P500TR | 9.14% | 2.79% | 4.43% |
|---|
|
| AssetsNet |
$ 109,828,121
|
| Holdings Count | Holding |
154
|
| Advisory Fees Paid, Amount |
$ 239,986
|
| InvestmentCompanyPortfolioTurnover |
17.00%
|
| Additional Fund Statistics [Text Block] |
- Net Assets$109,828,121
- Number of Portfolio Holdings154
- Advisory Fee (net of waivers)$239,986
- Portfolio Turnover17%
|
| Holdings [Text Block] |
Asset Weighting (% of total investments)Table SummaryValue | Value |
|---|
Collateralized Mortgage Obligations | 2.1% | Common Stocks | 21.4% | Convertible Bonds | 3.0% | Corporate Bonds | 60.5% | Exchange-Traded Funds | 3.6% | Foreign Governments | 1.4% | Money Market Funds | 1.1% | Preferred Stocks | 2.2% | U.S. Government & Agencies | 4.7% | Warrant | 0.0% | Sector Weighting (% of net assets)Table SummaryValue | Value |
|---|
Other Assets in Excess of Liabilities | 1.6% | Utilities | 0.9% | Money Market Funds | 1.1% | Foreign Governments | 1.4% | Collateralized Mortgage Obligations | 2.0% | Consumer Staples | 2.4% | Materials | 2.8% | Exchange-Traded Funds | 3.5% | U.S. Government & Agencies | 4.6% | Health Care | 4.7% | Consumer Discretionary | 8.3% | Technology | 8.5% | Real Estate | 8.7% | Industrials | 9.9% | Energy | 10.8% | Communications | 11.9% | Financials | 16.9% | |
| Largest Holdings [Text Block] |
Top 10 Holdings (% of net assets)Table SummaryHolding Name | % of Net Assets |
|---|
CME Ultra Long-Term U.S. Treasury Bond Future | 6.6% |
|---|
10-Year U.S. Treasury Note Future | 3.8% |
|---|
CME Euro Foreign Exchange Currency Future | 2.0% |
|---|
U.S. Treasury Bill, 3.656%, due 05/21/26 | 1.8% |
|---|
Westwood Enhanced Income Opportunity ETF | 1.8% |
|---|
Alphabet, Inc. | 1.6% |
|---|
Northern Oil and Gas, Inc., 7.875%, due 10/15/33 | 1.3% |
|---|
NVIDIA Corporation | 1.2% |
|---|
Icahn Enterprises, L.P. / Icahn Enterprises Financial Corporation, 10.000%, due 11/15/29 | 1.1% |
|---|
Ford Motor Credit Company, LLC, 7.450%, due 07/16/31 | 1.0% |
|---|
|
| Material Fund Change [Text Block] |
No material changes occurred during the period ended April 30, 2026. |
| C000229470 |
|
| Shareholder Report [Line Items] |
|
| Fund Name |
Westwood Multi-Asset Income Fund
|
| Class Name |
A Class Shares
|
| Trading Symbol |
WSDAX
|
| Annual or Semi-Annual Statement [Text Block] |
This semi-annual shareholder report contains important information about Westwood Multi-Asset Income Fund (the "Fund") for the period of November 1, 2025 to April 30, 2026.
|
| Additional Information [Text Block] |
You can find additional information about the Fund at https://westwoodgroup.com/product/multi-asset-income-fund/. You can also request this information by contacting us at (877) 386-3944.
|
| Additional Information Phone Number |
(877) 386-3944
|
| Additional Information Website |
<span style="font-weight: 700; box-sizing: border-box; color: rgb(99, 102, 106); display: inline; flex-wrap: nowrap; font-size: 10.6667px; grid-area: auto; line-height: 12.8px; margin: 0px; overflow: visible; text-align: left; text-align-last: left; white-space-collapse: preserve-breaks;">https://westwoodgroup.com/product/multi-asset-income-fund/</span>
|
| Expenses [Text Block] |
What were the Fund’s annualized costs for the last six months?(based on a hypothetical $10,000 investment) Table SummaryClass Name | Costs of a $10,000 investment | Costs paid as a percentage of a $10,000 investment |
|---|
A Class Shares | $45 | 0.90% |
|---|
|
| Expenses Paid, Amount |
$ 45
|
| Expense Ratio, Percent |
0.90%
|
| Factors Affecting Performance [Text Block] |
How did the Fund perform during the reporting period? For the trailing period, the Westwood Multi-Asset Income Fund outperformed its representative benchmark. Equity markets experienced increased volatility from geopolitical risks and equity-market shocks, while earnings strength among artificial intelligence-linked mega-cap technology firms remained a key area of support for equities, especially in the U.S. market. An increase in market breadth that began in late 2025 continued throughout early 2026, as value stocks, small caps and non-U.S. equities experienced periodic leadership as investors sought broader participation and downside resilience. In the fixed income market, returns were dominated by changing expectations for gradual monetary easing rather than aggressive rate cuts. Cooling headline inflation helped bond prices, but sticky core inflation limited gains and kept real yields elevated, reinforcing a “higher for longer” bond environment. Spikes in oil prices complicated inflation expectations, reducing the durability of safe-haven rallies in U.S. Treasuries and core sovereign bonds. Within the equity sleeve, stock selection in common equity was the largest contributor to relative outperformance, followed by allocation to off-benchmark ADRs, REITs and MLPs. The Fund’s allocation to convertible securities mitigated a portion of the outperformance within the sleeve. The fixed income sleeve also contributed to the Fund’s relative outperformance, primarily driven by strong allocation within the asset class, aided by the effect of shifts in the yield curve on corporate bonds during the trailing period. The largest detractor from performance within the asset class was the effect that changes in spreads had on corporate bonds during the period, with high-yield corporate bonds serving as the largest detractor from relative performance. |
| Line Graph [Table Text Block] |
Table Summary | Westwood Multi-Asset Income Fund - A Class Shares | Bloomberg U.S. Aggregate Bond Index | Russell 3000® Index | S&P 500® Index | Westwood -80%Bloom US Agg/20%S&P500TR |
|---|
Apr-2016 | $9,704 | $10,000 | $10,000 | $10,000 | $10,000 |
|---|
Apr-2017 | $10,375 | $10,083 | $11,858 | $11,792 | $10,409 |
|---|
Apr-2018 | $10,633 | $10,051 | $13,406 | $13,356 | $10,652 |
|---|
Apr-2019 | $11,162 | $10,582 | $15,106 | $15,158 | $11,409 |
|---|
Apr-2020 | $10,995 | $11,730 | $14,948 | $15,289 | $12,462 |
|---|
Apr-2021 | $13,806 | $11,698 | $22,560 | $22,320 | $13,444 |
|---|
Apr-2022 | $13,032 | $10,703 | $21,857 | $22,367 | $12,544 |
|---|
Apr-2023 | $13,035 | $10,657 | $22,186 | $22,963 | $12,592 |
|---|
Apr-2024 | $13,997 | $10,500 | $27,133 | $28,167 | $12,977 |
|---|
Apr-2025 | $15,102 | $11,343 | $30,227 | $31,574 | $14,133 |
|---|
Apr-2026 | $17,168 | $11,803 | $39,601 | $41,379 | $15,424 |
|---|
|
| Average Annual Return [Table Text Block] |
Table Summary | 1 Year | 5 Years | 10 Years |
|---|
Westwood Multi-Asset Income Fund - A Class Shares | 13.68% | 4.46% | 5.87% |
|---|
With LoadFootnote Reference* | 10.25% | 3.82% | 5.55% |
|---|
Bloomberg U.S. Aggregate Bond Index | 4.06% | 0.18% | 1.67% |
|---|
Russell 3000® Index | 31.01% | 11.91% | 14.75% |
|---|
S&P 500® Index | 31.05% | 13.14% | 15.26% |
|---|
Westwood -80%Bloom US Agg/20%S&P500TR | 9.14% | 2.79% | 4.43% |
|---|
|
| AssetsNet |
$ 109,828,121
|
| Holdings Count | Holding |
154
|
| Advisory Fees Paid, Amount |
$ 239,986
|
| InvestmentCompanyPortfolioTurnover |
17.00%
|
| Additional Fund Statistics [Text Block] |
- Net Assets$109,828,121
- Number of Portfolio Holdings154
- Advisory Fee (net of waivers)$239,986
- Portfolio Turnover17%
|
| Holdings [Text Block] |
Asset Weighting (% of total investments)Table SummaryValue | Value |
|---|
Collateralized Mortgage Obligations | 2.1% | Common Stocks | 21.4% | Convertible Bonds | 3.0% | Corporate Bonds | 60.5% | Exchange-Traded Funds | 3.6% | Foreign Governments | 1.4% | Money Market Funds | 1.1% | Preferred Stocks | 2.2% | U.S. Government & Agencies | 4.7% | Warrant | 0.0% | Sector Weighting (% of net assets)Table SummaryValue | Value |
|---|
Other Assets in Excess of Liabilities | 1.6% | Utilities | 0.9% | Money Market Funds | 1.1% | Foreign Governments | 1.4% | Collateralized Mortgage Obligations | 2.0% | Consumer Staples | 2.4% | Materials | 2.8% | Exchange-Traded Funds | 3.5% | U.S. Government & Agencies | 4.6% | Health Care | 4.7% | Consumer Discretionary | 8.3% | Technology | 8.5% | Real Estate | 8.7% | Industrials | 9.9% | Energy | 10.8% | Communications | 11.9% | Financials | 16.9% | |
| Largest Holdings [Text Block] |
Top 10 Holdings (% of net assets)Table SummaryHolding Name | % of Net Assets |
|---|
CME Ultra Long-Term U.S. Treasury Bond Future | 6.6% |
|---|
10-Year U.S. Treasury Note Future | 3.8% |
|---|
CME Euro Foreign Exchange Currency Future | 2.0% |
|---|
U.S. Treasury Bill, 3.656%, due 05/21/26 | 1.8% |
|---|
Westwood Enhanced Income Opportunity ETF | 1.8% |
|---|
Alphabet, Inc. | 1.6% |
|---|
Northern Oil and Gas, Inc., 7.875%, due 10/15/33 | 1.3% |
|---|
NVIDIA Corporation | 1.2% |
|---|
Icahn Enterprises, L.P. / Icahn Enterprises Financial Corporation, 10.000%, due 11/15/29 | 1.1% |
|---|
Ford Motor Credit Company, LLC, 7.450%, due 07/16/31 | 1.0% |
|---|
|
| Material Fund Change [Text Block] |
No material changes occurred during the period ended April 30, 2026. |
| Updated Prospectus Phone Number |
(877) 386-3944
|
| Updated Prospectus Web Address |
https://westwoodgroup.com/product/multi-asset-income-fund/
|
| C000229466 |
|
| Shareholder Report [Line Items] |
|
| Fund Name |
Westwood Alternative Income Fund
|
| Class Name |
Institutional Shares
|
| Trading Symbol |
WMNIX
|
| Annual or Semi-Annual Statement [Text Block] |
This semi-annual shareholder report contains important information about Westwood Alternative Income Fund (the "Fund") for the period of November 1, 2025 to April 30, 2026.
|
| Additional Information [Text Block] |
You can find additional information about the Fund at https://westwoodgroup.com/product/alternative-income-fund/. You can also request this information by contacting us at (877) 386-3944.
|
| Material Fund Change Notice [Text Block] |
This report describes changes to the Fund that occurred during the reporting period.
|
| Additional Information Phone Number |
(877) 386-3944
|
| Additional Information Website |
<span style="font-weight: 700; box-sizing: border-box; color: rgb(99, 102, 106); display: inline; flex-wrap: nowrap; font-size: 10.6667px; grid-area: auto; line-height: 12.8px; margin: 0px; overflow: visible; text-align: left; text-align-last: left; white-space-collapse: preserve-breaks;">https://westwoodgroup.com/product/alternative-income-fund/</span>
|
| Expenses [Text Block] |
What were the Fund’s annualized costs for the last six months?(based on a hypothetical $10,000 investment) Table SummaryClass Name | Costs of a $10,000 investment | Costs paid as a percentage of a $10,000 investment |
|---|
Institutional Shares | $49 | 0.98% |
|---|
|
| Expenses Paid, Amount |
$ 49
|
| Expense Ratio, Percent |
0.98%
|
| Factors Affecting Performance [Text Block] |
How did the Fund perform during the reporting period? For the trailing period, the Westwood Alternative Income Fund outperformed its representative benchmark. The U.S. convertible bond market was supported by a constructive though more volatile equity environment, declining interest rate uncertainty and improving technicals, as the Federal Reserve shifted from late-2025 easing to holding rates steady through the end of the period. Equity markets entered 2026 at elevated valuation levels following strong 2025 gains, but experienced increased dispersion and drawdowns in the first quarter amid geopolitical tensions and sector-specific rotation, reinforcing the appeal of the convertible securities asymmetric return profile. Issuance activity in the convertible market remained robust, driven by refinancing needs, artificial intelligence-infrastructure related investment and issuers’ continued preference for flexible capital structures in an environment of still-elevated absolute yields. Credit conditions remained generally stable, with investment-grade and high-yield spreads holding near historically tight levels despite intermittent volatility, sustaining demand for higher-quality convertible issuers and limiting compensation in lower-quality credit segments. Against this backdrop, convertible securities generated attractive risk-adjusted returns, benefiting from equity participation during rallies while demonstrating resilience during periods of market stress and consolidation. The Fund’s outperformance was driven primarily by strong results from the convertible arbitrage sleeve. Performance also benefited from a net long equity exposure, rising convertible valuations and favorable credit spread positioning. Within the yield bucket, the Fund allowed bonds to roll off without replacement, as compressed credit spreads did not present attractive risk-reward opportunities relative to other allocations. |
| Line Graph [Table Text Block] |
Table Summary | Westwood Alternative Income Fund - Institutional Shares | Bloomberg U.S. Aggregate Bond Index | FTSE 1-Month Treasury Bill Index |
|---|
Apr-2016 | $100,000 | $100,000 | $100,000 |
|---|
Apr-2017 | $106,059 | $100,829 | $100,320 |
|---|
Apr-2018 | $105,578 | $100,507 | $101,439 |
|---|
Apr-2019 | $108,755 | $105,824 | $103,618 |
|---|
Apr-2020 | $113,120 | $117,297 | $105,455 |
|---|
Apr-2021 | $125,048 | $116,984 | $105,538 |
|---|
Apr-2022 | $124,134 | $107,026 | $105,596 |
|---|
Apr-2023 | $127,723 | $106,569 | $108,732 |
|---|
Apr-2024 | $134,589 | $105,004 | $114,662 |
|---|
Apr-2025 | $145,319 | $113,426 | $120,386 |
|---|
Apr-2026 | $156,797 | $118,027 | $125,358 |
|---|
|
| Average Annual Return [Table Text Block] |
Table Summary | 1 Year | 5 Years | 10 Years |
|---|
Westwood Alternative Income Fund - Institutional Shares | 7.90% | 4.63% | 4.60% |
|---|
Bloomberg U.S. Aggregate Bond Index | 4.06% | 0.18% | 1.67% |
|---|
FTSE 1-Month Treasury Bill Index | 4.13% | 3.50% | 2.29% |
|---|
|
| AssetsNet |
$ 158,834,530
|
| Holdings Count | Holding |
132
|
| Advisory Fees Paid, Amount |
$ 151,089
|
| InvestmentCompanyPortfolioTurnover |
27.00%
|
| Additional Fund Statistics [Text Block] |
- Net Assets$158,834,530
- Number of Portfolio Holdings132
- Advisory Fee (net of waivers)$151,089
- Portfolio Turnover27%
|
| Holdings [Text Block] |
Asset Weighting (% of total investments)Table SummaryValue | Value |
|---|
Common Stocks | 0.2% | Convertible Bonds | 88.9% | Corporate Bonds | 5.9% | Money Market Funds | 4.4% | Preferred Stocks | 0.6% | Sector Weighting (% of net assets)Table SummaryValue | Value |
|---|
Liabilities in Excess of Other Assets | -4.7% | Utilities | 2.3% | Consumer Staples | 2.8% | Financials | 3.0% | Materials | 3.4% | Real Estate | 3.6% | Money Market Funds | 4.5% | Communications | 5.2% | Energy | 5.9% | Consumer Discretionary | 10.0% | Health Care | 12.3% | Industrials | 20.1% | Technology | 31.6% | |
| Largest Holdings [Text Block] |
Top 10 Holdings (% of net assets)Table SummaryHolding Name | % of Net Assets |
|---|
Advanced Energy Industries, Inc., 2.500%, due 09/15/28 | 4.0% |
|---|
5-Year U.S. Treasury Note Future | 3.9% |
|---|
Seagate HDD Cayman, 3.500%, due 06/1/28 | 3.6% |
|---|
DigitalOcean Holdings, Inc., 0.000%, due 08/15/30 | 3.2% |
|---|
MKS Instruments, Inc., 1.250%, due 06/1/30 | 2.7% |
|---|
ON Semiconductor Corporation, 0.500%, due 03/1/29 | 2.7% |
|---|
OSI Systems, Inc., 2.250%, due 08/1/29 | 2.6% |
|---|
Microchip Technology, Inc., 0.000%, due 02/15/30 | 2.5% |
|---|
Akamai Technologies, Inc., 0.250%, due 05/15/33 | 2.5% |
|---|
Solaris Energy Infrastructure, Inc., 0.250%, due 10/1/31 | 2.4% |
|---|
|
| Material Fund Change [Text Block] |
Effective February 28, 2026, the 1.00% redemption fee applied to redemptions of Fund shares that had been held for 30 days or less has been eliminated. |
| C000229467 |
|
| Shareholder Report [Line Items] |
|
| Fund Name |
Westwood Alternative Income Fund
|
| Class Name |
A Class Shares
|
| Trading Symbol |
WMNAX
|
| Annual or Semi-Annual Statement [Text Block] |
This semi-annual shareholder report contains important information about Westwood Alternative Income Fund (the "Fund") for the period of November 1, 2025 to April 30, 2026.
|
| Additional Information [Text Block] |
You can find additional information about the Fund at https://westwoodgroup.com/product/alternative-income-fund/. You can also request this information by contacting us at (877) 386-3944.
|
| Material Fund Change Notice [Text Block] |
This report describes changes to the Fund that occurred during the reporting period.
|
| Additional Information Phone Number |
(877) 386-3944
|
| Additional Information Website |
<span style="font-weight: 700; box-sizing: border-box; color: rgb(99, 102, 106); display: inline; flex-wrap: nowrap; font-size: 10.6667px; grid-area: auto; line-height: 12.8px; margin: 0px; overflow: visible; text-align: left; text-align-last: left; white-space-collapse: preserve-breaks;">https://westwoodgroup.com/product/alternative-income-fund/</span>
|
| Expenses [Text Block] |
What were the Fund’s annualized costs for the last six months?(based on a hypothetical $10,000 investment) Table SummaryClass Name | Costs of a $10,000 investment | Costs paid as a percentage of a $10,000 investment |
|---|
A Class Shares | $56 | 1.11% |
|---|
|
| Expenses Paid, Amount |
$ 56
|
| Expense Ratio, Percent |
1.11%
|
| Factors Affecting Performance [Text Block] |
How did the Fund perform during the reporting period? For the trailing period, the Westwood Alternative Income Fund outperformed its representative benchmark. The U.S. convertible bond market was supported by a constructive though more volatile equity environment, declining interest rate uncertainty and improving technicals, as the Federal Reserve shifted from late-2025 easing to holding rates steady through the end of the period. Equity markets entered 2026 at elevated valuation levels following strong 2025 gains, but experienced increased dispersion and drawdowns in the first quarter amid geopolitical tensions and sector-specific rotation, reinforcing the appeal of the convertible securities asymmetric return profile. Issuance activity in the convertible market remained robust, driven by refinancing needs, artificial intelligence-infrastructure related investment and issuers’ continued preference for flexible capital structures in an environment of still-elevated absolute yields. Credit conditions remained generally stable, with investment-grade and high-yield spreads holding near historically tight levels despite intermittent volatility, sustaining demand for higher-quality convertible issuers and limiting compensation in lower-quality credit segments. Against this backdrop, convertible securities generated attractive risk-adjusted returns, benefiting from equity participation during rallies while demonstrating resilience during periods of market stress and consolidation. The Fund’s outperformance was driven primarily by strong results from the convertible arbitrage sleeve. Performance also benefited from a net long equity exposure, rising convertible valuations and favorable credit spread positioning. Within the yield bucket, the Fund allowed bonds to roll off without replacement, as compressed credit spreads did not present attractive risk-reward opportunities relative to other allocations. |
| Line Graph [Table Text Block] |
Table Summary | Westwood Alternative Income Fund - A Class Shares | Bloomberg U.S. Aggregate Bond Index | FTSE 1-Month Treasury Bill Index |
|---|
Mar-2020 | $9,702 | $10,000 | $10,000 |
|---|
Apr-2020 | $9,871 | $10,178 | $10,000 |
|---|
Apr-2021 | $10,888 | $10,151 | $10,008 |
|---|
Apr-2022 | $10,797 | $9,287 | $10,014 |
|---|
Apr-2023 | $11,092 | $9,247 | $10,311 |
|---|
Apr-2024 | $11,679 | $9,111 | $10,873 |
|---|
Apr-2025 | $12,591 | $9,842 | $11,416 |
|---|
Apr-2026 | $13,570 | $10,241 | $11,888 |
|---|
|
| Average Annual Return [Table Text Block] |
Table Summary | 1 Year | 5 Years | Since Inception (March 31, 2020) |
|---|
Westwood Alternative Income Fund - A Class Shares | | | |
|---|
Without Load | 7.77% | 4.50% | 5.67% |
|---|
With LoadFootnote Reference* | 4.58% | 3.86% | 5.15% |
|---|
Bloomberg U.S. Aggregate Bond Index | 4.06% | 0.18% | 0.39% |
|---|
FTSE 1-Month Treasury Bill Index | 4.13% | 3.50% | 2.88% |
|---|
|
| Performance Inception Date |
Mar. 31, 2020
|
| AssetsNet |
$ 158,834,530
|
| Holdings Count | Holding |
132
|
| Advisory Fees Paid, Amount |
$ 151,089
|
| InvestmentCompanyPortfolioTurnover |
27.00%
|
| Additional Fund Statistics [Text Block] |
- Net Assets$158,834,530
- Number of Portfolio Holdings132
- Advisory Fee (net of waivers)$151,089
- Portfolio Turnover27%
|
| Holdings [Text Block] |
Asset Weighting (% of total investments)Table SummaryValue | Value |
|---|
Common Stocks | 0.2% | Convertible Bonds | 88.9% | Corporate Bonds | 5.9% | Money Market Funds | 4.4% | Preferred Stocks | 0.6% | Sector Weighting (% of net assets)Table SummaryValue | Value |
|---|
Liabilities in Excess of Other Assets | -4.7% | Utilities | 2.3% | Consumer Staples | 2.8% | Financials | 3.0% | Materials | 3.4% | Real Estate | 3.6% | Money Market Funds | 4.5% | Communications | 5.2% | Energy | 5.9% | Consumer Discretionary | 10.0% | Health Care | 12.3% | Industrials | 20.1% | Technology | 31.6% | |
| Largest Holdings [Text Block] |
Top 10 Holdings (% of net assets)Table SummaryHolding Name | % of Net Assets |
|---|
Advanced Energy Industries, Inc., 2.500%, due 09/15/28 | 4.0% |
|---|
5-Year U.S. Treasury Note Future | 3.9% |
|---|
Seagate HDD Cayman, 3.500%, due 06/1/28 | 3.6% |
|---|
DigitalOcean Holdings, Inc., 0.000%, due
08/15/30 | 3.2% |
|---|
MKS Instruments, Inc., 1.250%, due 06/1/30 | 2.7% |
|---|
ON Semiconductor Corporation, 0.500%, due 03/1/29 | 2.7% |
|---|
OSI Systems, Inc., 2.250%, due 08/1/29 | 2.6% |
|---|
Microchip Technology, Inc., 0.000%, due 02/15/30 | 2.5% |
|---|
Akamai Technologies, Inc., 0.250%, due 05/15/33 | 2.5% |
|---|
Solaris Energy Infrastructure, Inc., 0.250%, due 10/1/31 | 2.4% |
|---|
|
| Material Fund Change [Text Block] |
Effective February 28, 2026, the 1.00% redemption fee applied to redemptions of Fund shares that had been held for 30 days or less has been eliminated. |
| Updated Prospectus Phone Number |
(877) 386-3944
|
| Updated Prospectus Web Address |
https://westwoodgroup.com/product/alternative-income-fund/
|
| C000229465 |
|
| Shareholder Report [Line Items] |
|
| Fund Name |
Westwood Alternative Income Fund
|
| Class Name |
Ultra Shares
|
| Trading Symbol |
WMNUX
|
| Annual or Semi-Annual Statement [Text Block] |
This semi-annual shareholder report contains important information about Westwood Alternative Income Fund (the "Fund") for the period of November 1, 2025 to April 30, 2026.
|
| Additional Information [Text Block] |
You can find additional information about the Fund at https://westwoodgroup.com/product/alternative-income-fund/. You can also request this information by contacting us at (877) 386-3944.
|
| Material Fund Change Notice [Text Block] |
This report describes changes to the Fund that occurred during the reporting period.
|
| Additional Information Phone Number |
(877) 386-3944
|
| Additional Information Website |
<span style="font-weight: 700; box-sizing: border-box; color: rgb(99, 102, 106); display: inline; flex-wrap: nowrap; font-size: 10.6667px; grid-area: auto; line-height: 12.8px; margin: 0px; overflow: visible; text-align: left; text-align-last: left; white-space-collapse: preserve-breaks;">https://westwoodgroup.com/product/alternative-income-fund/</span>
|
| Expenses [Text Block] |
What were the Fund’s annualized costs for the last six months?(based on a hypothetical $10,000 investment) Table SummaryClass Name | Costs of a $10,000 investment | Costs paid as a percentage of a $10,000 investment |
|---|
Ultra Shares | $43 | 0.86% |
|---|
|
| Expenses Paid, Amount |
$ 43
|
| Expense Ratio, Percent |
0.86%
|
| Factors Affecting Performance [Text Block] |
How did the Fund perform during the reporting period? For the trailing period, the Westwood Alternative Income Fund outperformed its representative benchmark. The U.S. convertible bond market was supported by a constructive though more volatile equity environment, declining interest rate uncertainty and improving technicals, as the Federal Reserve shifted from late-2025 easing to holding rates steady through the end of the period. Equity markets entered 2026 at elevated valuation levels following strong 2025 gains, but experienced increased dispersion and drawdowns in the first quarter amid geopolitical tensions and sector-specific rotation, reinforcing the appeal of the convertible securities asymmetric return profile. Issuance activity in the convertible market remained robust, driven by refinancing needs, artificial intelligence-infrastructure related investment and issuers’ continued preference for flexible capital structures in an environment of still-elevated absolute yields. Credit conditions remained generally stable, with investment-grade and high-yield spreads holding near historically tight levels despite intermittent volatility, sustaining demand for higher-quality convertible issuers and limiting compensation in lower-quality credit segments. Against this backdrop, convertible securities generated attractive risk-adjusted returns, benefiting from equity participation during rallies while demonstrating resilience during periods of market stress and consolidation. The Fund’s outperformance was driven primarily by strong results from the convertible arbitrage sleeve. Performance also benefited from a net long equity exposure, rising convertible valuations and favorable credit spread positioning. Within the yield bucket, the Fund allowed bonds to roll off
without replacement, as compressed credit spreads did not present attractive risk-reward opportunities relative to other allocations. |
| Line Graph [Table Text Block] |
Table Summary | Westwood Alternative Income Fund - Ultra Shares | Bloomberg U.S. Aggregate Bond Index | FTSE 1-Month Treasury Bill Index |
|---|
Apr-2016 | $1,000,000 | $1,000,000 | $1,000,000 |
|---|
Apr-2017 | $1,061,916 | $1,008,286 | $1,003,196 |
|---|
Apr-2018 | $1,058,475 | $1,005,067 | $1,014,392 |
|---|
Apr-2019 | $1,092,174 | $1,058,241 | $1,036,181 |
|---|
Apr-2020 | $1,135,938 | $1,172,975 | $1,054,554 |
|---|
Apr-2021 | $1,256,420 | $1,169,841 | $1,055,376 |
|---|
Apr-2022 | $1,248,431 | $1,070,262 | $1,055,960 |
|---|
Apr-2023 | $1,285,804 | $1,065,688 | $1,087,319 |
|---|
Apr-2024 | $1,356,643 | $1,050,040 | $1,146,622 |
|---|
Apr-2025 | $1,466,963 | $1,134,258 | $1,203,861 |
|---|
Apr-2026 | $1,583,587 | $1,180,271 | $1,253,575 |
|---|
|
| Average Annual Return [Table Text Block] |
Table Summary | 1 Year | 5 Years | 10 Years |
|---|
Westwood Alternative Income Fund - Ultra Shares | 7.95% | 4.74% | 4.70% |
|---|
Bloomberg U.S. Aggregate Bond Index | 4.06% | 0.18% | 1.67% |
|---|
FTSE 1-Month Treasury Bill Index | 4.13% | 3.50% | 2.29% |
|---|
|
| AssetsNet |
$ 158,834,530
|
| Holdings Count | Holding |
132
|
| Advisory Fees Paid, Amount |
$ 151,089
|
| InvestmentCompanyPortfolioTurnover |
27.00%
|
| Additional Fund Statistics [Text Block] |
- Net Assets$158,834,530
- Number of Portfolio Holdings132
- Advisory Fee (net of waivers)$151,089
- Portfolio Turnover27%
|
| Holdings [Text Block] |
Asset Weighting (% of total investments)Table SummaryValue | Value |
|---|
Common Stocks | 0.2% | Convertible Bonds | 88.9% | Corporate Bonds | 5.9% | Money Market Funds | 4.4% | Preferred Stocks | 0.6% | Sector Weighting (% of net assets)Table SummaryValue | Value |
|---|
Liabilities in Excess of Other Assets | -4.7% | Utilities | 2.3% | Consumer Staples | 2.8% | Financials | 3.0% | Materials | 3.4% | Real Estate | 3.6% | Money Market Funds | 4.5% | Communications | 5.2% | Energy | 5.9% | Consumer Discretionary | 10.0% | Health Care | 12.3% | Industrials | 20.1% | Technology | 31.6% | |
| Largest Holdings [Text Block] |
Top 10 Holdings (% of net assets)Table SummaryHolding Name | % of Net Assets |
|---|
Advanced Energy Industries, Inc., 2.500%, due 09/15/28 | 4.0% |
|---|
5-Year U.S. Treasury Note Future | 3.9% |
|---|
Seagate HDD Cayman, 3.500%, due 06/1/28 | 3.6% |
|---|
DigitalOcean Holdings, Inc., 0.000%, due 08/15/30 | 3.2% |
|---|
MKS Instruments, Inc., 1.250%, due 06/1/30 | 2.7% |
|---|
ON Semiconductor Corporation, 0.500%, due 03/1/29 | 2.7% |
|---|
OSI Systems, Inc., 2.250%, due 08/1/29 | 2.6% |
|---|
Microchip Technology, Inc., 0.000%, due 02/15/30 | 2.5% |
|---|
Akamai Technologies, Inc., 0.250%, due 05/15/33 | 2.5% |
|---|
Solaris Energy Infrastructure, Inc., 0.250%, due 10/1/31 | 2.4% |
|---|
|
| Material Fund Change [Text Block] |
Effective February 28, 2026, the 1.00% redemption fee applied to redemptions of Fund shares that had been held for 30 days or less has been eliminated. |
| C000237961 |
|
| Shareholder Report [Line Items] |
|
| Fund Name |
Westwood Salient MLP & Energy Infrastructure Fund
|
| Class Name |
Institutional Shares
|
| Trading Symbol |
SMLPX
|
| Annual or Semi-Annual Statement [Text Block] |
This semi-annual shareholder report contains important information about Westwood Salient MLP & Energy Infrastructure Fund (the "Fund") for the period of November 1, 2025 to April 30, 2026.
|
| Additional Information [Text Block] |
You can find additional information about the Fund at https://westwoodgroup.com/product/energy-infrastructure-fund/. You can also request this information by contacting us at (877) 386-3944.
|
| Additional Information Phone Number |
(877) 386-3944
|
| Additional Information Website |
<span style="font-weight: 700; box-sizing: border-box; color: rgb(99, 102, 106); display: inline; flex-wrap: nowrap; font-size: 10.6667px; grid-area: auto; line-height: 12.8px; margin: 0px; overflow: visible; text-align: left; text-align-last: left; white-space-collapse: preserve-breaks;">https://westwoodgroup.com/product/energy-infrastructure-fund/</span>
|
| Expenses [Text Block] |
What were the Fund’s annualized costs for the last six months?(based on a hypothetical $10,000 investment) Table SummaryClass Name | Costs of a $10,000 investment | Costs paid as a percentage of a $10,000 investment |
|---|
Institutional Shares | $59 | 1.05% |
|---|
|
| Expenses Paid, Amount |
$ 59
|
| Expense Ratio, Percent |
1.05%
|
| Factors Affecting Performance [Text Block] |
How did the Fund perform during the reporting period? For the trailing period, the Westwood Salient MLP and Energy Infrastructure Fund underperformed its representative benchmark, despite delivering a strong absolute return. The midstream energy sector provided strong performance in the trailing period, as oil and gas volatility increased due to geopolitical shocks in Venezuela and Iran, sending crude oil prices over $100. In this environment, midstream performance was anchored by long-term, fee-based contracts that insulated cash flows. Rising U.S. LNG exports and continued artificial intelligence/data-center electricity demand increased volumes across pipeline, gathering, processing and storage assets. Volumes remained resilient throughout geopolitically induced volatility in oil markets, as production declines were modest and pipelines remained highly contracted. Capital discipline, ongoing debt reduction and continued commitment to dividend growth and buybacks remained defining themes across the industry, helping to anchor investor confidence amid broader energy market fluctuations. Stock selection for the trailing period was the largest contributor to relative underperformance, with the interaction between allocation and selection decisions mitigating a portion of the underperformance. On an absolute basis, the Gathering and Processing and Natural Gas Pipelines subsectors were the largest contributors to performance, both generating strong returns during the period, though security selection within each subsector detracted from relative performance. The LNG and Utilities subsectors were the largest detractors from performance for the trailing period. An underweight allocation to the strong performing LNG subsector was the primary driver of relative performance, while allocation to Utilities, a subsector not represented in the benchmark, drove relative underperformance as the subsector provided the lowest absolute returns for the period. |
| Line Graph [Table Text Block] |
Table Summary | Westwood Salient MLP & Energy Infrastructure Fund - Institutional Shares | Alerian Midstream Energy Select Index | Alerian MLP Index Trust | S&P 500® Index |
|---|
Apr-2016 | $100,000 | $100,000 | $100,000 | $100,000 |
|---|
Apr-2017 | $126,757 | $123,161 | $114,081 | $117,918 |
|---|
Apr-2018 | $109,419 | $112,261 | $99,845 | $133,562 |
|---|
Apr-2019 | $115,543 | $122,294 | $104,913 | $151,585 |
|---|
Apr-2020 | $82,201 | $82,876 | $62,123 | $152,893 |
|---|
Apr-2021 | $110,775 | $121,245 | $90,373 | $223,196 |
|---|
Apr-2022 | $137,216 | $158,652 | $115,075 | $223,672 |
|---|
Apr-2023 | $139,064 | $163,208 | $134,382 | $229,631 |
|---|
Apr-2024 | $176,232 | $205,055 | $180,689 | $281,669 |
|---|
Apr-2025 | $213,091 | $265,284 | $205,087 | $315,741 |
|---|
Apr-2026 | $279,962 | $354,561 | $267,670 | $413,787 |
|---|
|
| Average Annual Return [Table Text Block] |
Table Summary | 1 Year | 5 Years | 10 Years |
|---|
Westwood Salient MLP & Energy Infrastructure Fund - Institutional Shares | 31.38% | 20.37% | 10.84% |
|---|
Alerian Midstream Energy Select Index | 33.65% | 23.94% | 13.49% |
|---|
Alerian MLP Index Trust | 30.52% | 24.25% | 10.35% |
|---|
S&P 500® Index | 31.05% | 13.14% | 15.26% |
|---|
|
| AssetsNet |
$ 1,442,177,080
|
| Holdings Count | Holding |
53
|
| Advisory Fees Paid, Amount |
$ 5,595,856
|
| InvestmentCompanyPortfolioTurnover |
15.00%
|
| Additional Fund Statistics [Text Block] |
- Net Assets$1,442,177,080
- Number of Portfolio Holdings53
- Advisory Fee (net of waivers)$5,595,856
- Portfolio Turnover15%
|
| Holdings [Text Block] |
Asset Weighting (% of total investments)Table SummaryValue | Value |
|---|
Affiliated Exchange-Traded Funds | 4.0% | Master Limited Partnerships | 24.4% | MLP Related Companies | 71.3% | Money Market Funds | 0.3% | Sector Weighting (% of net assets)Table SummaryValue | Value |
|---|
Money Market Funds | 0.3% | Renewable Energy Infrastructure | 0.9% | Independent Power Producers | 2.5% | Power Equipment | 2.7% | Affiliated Exchange-Traded Funds | 4.0% | Pipelines | 89.6% | |
| Largest Holdings [Text Block] |
Top 10 Holdings (% of net assets)Table SummaryHolding Name | % of Net Assets |
|---|
Energy Transfer, L.P. | 10.3% |
|---|
Williams Companies, Inc. (The) | 8.2% |
|---|
DT Midstream, Inc. | 7.7% |
|---|
Kinder Morgan, Inc. | 6.9% |
|---|
Enbridge, Inc. | 6.6% |
|---|
TC Energy Corporation | 4.9% |
|---|
Enterprise Products Partners, L.P. | 4.9% |
|---|
Cheniere Energy, Inc. | 4.8% |
|---|
Keyera Corporation | 4.5% |
|---|
MPLX, L.P. | 4.2% |
|---|
|
| Material Fund Change [Text Block] |
No material changes occurred during the period ended April 30, 2026. |
| C000237964 |
|
| Shareholder Report [Line Items] |
|
| Fund Name |
Westwood Salient MLP & Energy Infrastructure Fund
|
| Class Name |
A Class Shares
|
| Trading Symbol |
SMAPX
|
| Annual or Semi-Annual Statement [Text Block] |
This semi-annual shareholder report contains important information about Westwood Salient MLP & Energy Infrastructure Fund (the "Fund") for the period of November 1, 2025 to April 30, 2026.
|
| Additional Information [Text Block] |
You can find additional information about the Fund at https://westwoodgroup.com/product/energy-infrastructure-fund/. You can also request this information by contacting us at (877) 386-3944.
|
| Additional Information Phone Number |
(877) 386-3944
|
| Additional Information Website |
<span style="font-weight: 700; box-sizing: border-box; color: rgb(99, 102, 106); display: inline; flex-wrap: nowrap; font-size: 10.6667px; grid-area: auto; line-height: 12.8px; margin: 0px; overflow: visible; text-align: left; text-align-last: left; white-space-collapse: preserve-breaks;">https://westwoodgroup.com/product/energy-infrastructure-fund/</span>
|
| Expenses [Text Block] |
What were the Fund’s annualized costs for the last six months?(based on a hypothetical $10,000 investment) Table SummaryClass Name | Costs of a $10,000 investment | Costs paid as a percentage of a $10,000 investment |
|---|
A Class Shares | $73 | 1.30% |
|---|
|
| Expenses Paid, Amount |
$ 73
|
| Expense Ratio, Percent |
1.30%
|
| Factors Affecting Performance [Text Block] |
How did the Fund perform during the reporting period? For the trailing period, the Westwood Salient MLP and Energy Infrastructure Fund underperformed its representative benchmark, despite delivering a strong absolute return. The midstream energy sector provided strong performance in the trailing period, as oil and gas volatility increased due to geopolitical shocks in Venezuela and Iran, sending crude oil prices over $100. In this environment, midstream performance was anchored by long-term, fee-based contracts that insulated cash flows. Rising U.S. LNG exports and continued artificial intelligence/data-center electricity demand increased volumes across pipeline, gathering, processing and storage assets. Volumes remained resilient throughout geopolitically induced volatility in oil markets, as production declines were modest and pipelines remained highly contracted. Capital discipline, ongoing debt reduction and continued commitment to dividend growth and buybacks remained defining themes across the industry, helping to anchor investor confidence amid broader energy market fluctuations. Stock selection for the trailing period was the largest contributor to relative underperformance, with the interaction between allocation and selection decisions mitigating a portion of the underperformance. On an absolute basis, the Gathering and Processing and Natural Gas Pipelines subsectors were the largest contributors to performance, both generating strong returns during the period, though security selection within each subsector detracted from relative performance. The LNG and Utilities subsectors were the largest detractors from performance for the trailing period. An underweight allocation to the strong performing LNG subsector was the primary driver of relative performance, while allocation to Utilities, a subsector not represented in the benchmark, drove relative underperformance as the subsector provided the lowest absolute returns for the period. |
| Line Graph [Table Text Block] |
Table Summary | Westwood Salient MLP & Energy Infrastructure Fund - A Class Shares | Alerian Midstream Energy Select Index | Alerian MLP Index Trust | S&P 500® Index |
|---|
Apr-2016 | $9,454 | $10,000 | $10,000 | $10,000 |
|---|
Apr-2017 | $11,970 | $12,316 | $11,408 | $11,792 |
|---|
Apr-2018 | $10,315 | $11,226 | $9,985 | $13,356 |
|---|
Apr-2019 | $10,867 | $12,229 | $10,491 | $15,158 |
|---|
Apr-2020 | $7,709 | $8,288 | $6,212 | $15,289 |
|---|
Apr-2021 | $10,377 | $12,124 | $9,037 | $22,320 |
|---|
Apr-2022 | $12,815 | $15,865 | $11,508 | $22,367 |
|---|
Apr-2023 | $12,969 | $16,321 | $13,438 | $22,963 |
|---|
Apr-2024 | $16,392 | $20,505 | $18,069 | $28,167 |
|---|
Apr-2025 | $19,768 | $26,528 | $20,509 | $31,574 |
|---|
Apr-2026 | $25,913 | $35,456 | $26,767 | $41,379 |
|---|
|
| Average Annual Return [Table Text Block] |
Table Summary | 1 Year | 5 Years | 10 Years |
|---|
Westwood Salient MLP & Energy Infrastructure Fund - A Class Shares | | | |
|---|
Without Load | 31.09% | 20.09% | 10.61% |
|---|
With LoadFootnote Reference* | 25.83% | 18.74% | 9.99% |
|---|
Alerian Midstream Energy Select Index | 33.65% | 23.94% | 13.49% |
|---|
Alerian MLP Index Trust | 30.52% | 24.25% | 10.35% |
|---|
S&P 500® Index | 31.05% | 13.14% | 15.26% |
|---|
|
| AssetsNet |
$ 1,442,177,080
|
| Holdings Count | Holding |
53
|
| Advisory Fees Paid, Amount |
$ 5,595,856
|
| InvestmentCompanyPortfolioTurnover |
15.00%
|
| Additional Fund Statistics [Text Block] |
- Net Assets$1,442,177,080
- Number of Portfolio Holdings53
- Advisory Fee (net of waivers)$5,595,856
- Portfolio Turnover15%
|
| Holdings [Text Block] |
Asset Weighting (% of total investments)Table SummaryValue | Value |
|---|
Affiliated Exchange-Traded Funds | 4.0% | Master Limited Partnerships | 24.4% | MLP Related Companies | 71.3% | Money Market Funds | 0.3% | Sector Weighting (% of net assets)Table SummaryValue | Value |
|---|
Money Market Funds | 0.3% | Renewable Energy Infrastructure | 0.9% | Independent Power Producers | 2.5% | Power Equipment | 2.7% | Affiliated Exchange-Traded Funds | 4.0% | Pipelines | 89.6% | |
| Largest Holdings [Text Block] |
Top 10 Holdings (% of net assets)Table SummaryHolding Name | % of Net Assets |
|---|
Energy Transfer, L.P. | 10.3% |
|---|
Williams Companies, Inc. (The) | 8.2% |
|---|
DT Midstream, Inc. | 7.7% |
|---|
Kinder Morgan, Inc. | 6.9% |
|---|
Enbridge, Inc. | 6.6% |
|---|
TC Energy Corporation | 4.9% |
|---|
Enterprise Products Partners, L.P. | 4.9% |
|---|
Cheniere Energy, Inc. | 4.8% |
|---|
Keyera Corporation | 4.5% |
|---|
MPLX, L.P. | 4.2% |
|---|
|
| Material Fund Change [Text Block] |
No material changes occurred during the period ended April 30, 2026. |
| Updated Prospectus Phone Number |
(877) 386-3944
|
| Updated Prospectus Web Address |
https://westwoodgroup.com/product/energy-infrastructure-fund/
|
| C000237963 |
|
| Shareholder Report [Line Items] |
|
| Fund Name |
Westwood Salient MLP & Energy Infrastructure Fund
|
| Class Name |
C Class Shares
|
| Trading Symbol |
SMFPX
|
| Annual or Semi-Annual Statement [Text Block] |
This semi-annual shareholder report contains important information about Westwood Salient MLP & Energy Infrastructure Fund (the "Fund") for the period of November 1, 2025 to April 30, 2026.
|
| Additional Information [Text Block] |
You can find additional information about the Fund at https://westwoodgroup.com/product/energy-infrastructure-fund/. You can also request this information by contacting us at (877) 386-3944.
|
| Additional Information Phone Number |
(877) 386-3944
|
| Additional Information Website |
<span style="font-weight: 700; box-sizing: border-box; color: rgb(99, 102, 106); display: inline; flex-wrap: nowrap; font-size: 10.6667px; grid-area: auto; line-height: 12.8px; margin: 0px; overflow: visible; text-align: left; text-align-last: left; white-space-collapse: preserve-breaks;">https://westwoodgroup.com/product/energy-infrastructure-fund/</span>
|
| Expenses [Text Block] |
What were the Fund’s annualized costs for the last six months?(based on a hypothetical $10,000 investment) Table SummaryClass Name | Costs of a $10,000 investment | Costs paid as a percentage of a $10,000 investment |
|---|
C Class Shares | $115 | 2.05% |
|---|
|
| Expenses Paid, Amount |
$ 115
|
| Expense Ratio, Percent |
2.05%
|
| Factors Affecting Performance [Text Block] |
How did the Fund perform during the reporting period? For the trailing period, the Westwood Salient MLP and Energy Infrastructure Fund underperformed its representative benchmark, despite delivering a strong absolute return. The midstream energy sector provided strong performance in the trailing period, as oil and gas volatility increased due to geopolitical shocks in Venezuela and Iran, sending crude oil prices over $100. In this environment, midstream performance was anchored by long-term, fee-based contracts that insulated cash flows. Rising U.S. LNG exports and continued artificial intelligence/data-center electricity demand increased volumes across pipeline, gathering, processing and storage assets. Volumes remained resilient throughout geopolitically induced volatility in oil markets, as production declines were modest and pipelines remained highly contracted. Capital discipline, ongoing debt reduction and continued commitment to dividend growth and buybacks remained defining themes across the industry, helping to anchor investor confidence amid broader energy market fluctuations. Stock selection for the trailing period was the largest contributor to relative underperformance, with the interaction between allocation and selection decisions mitigating a portion of the underperformance. On an absolute basis, the Gathering and Processing and Natural Gas Pipelines subsectors were the largest contributors to performance, both generating strong returns during the period, though security selection within each subsector detracted from relative performance. The LNG and Utilities subsectors were the largest detractors from performance for the trailing period. An underweight allocation to the strong performing LNG subsector was the primary driver of relative performance, while allocation to Utilities, a subsector not represented in the benchmark, drove relative underperformance as the subsector provided the lowest absolute returns for the period. |
| Line Graph [Table Text Block] |
Table Summary | Westwood Salient MLP & Energy Infrastructure Fund - C Class Shares | Alerian Midstream Energy Select Index | Alerian MLP Index Trust | S&P 500® Index |
|---|
Apr-2016 | $10,000 | $10,000 | $10,000 | $10,000 |
|---|
Apr-2017 | $12,565 | $12,316 | $11,408 | $11,792 |
|---|
Apr-2018 | $10,743 | $11,226 | $9,985 | $13,356 |
|---|
Apr-2019 | $11,229 | $12,229 | $10,491 | $15,158 |
|---|
Apr-2020 | $7,911 | $8,288 | $6,212 | $15,289 |
|---|
Apr-2021 | $10,555 | $12,124 | $9,037 | $22,320 |
|---|
Apr-2022 | $12,933 | $15,865 | $11,508 | $22,367 |
|---|
Apr-2023 | $12,992 | $16,321 | $13,438 | $22,963 |
|---|
Apr-2024 | $16,296 | $20,505 | $18,069 | $28,167 |
|---|
Apr-2025 | $19,511 | $26,528 | $20,509 | $31,574 |
|---|
Apr-2026 | $25,375 | $35,456 | $26,767 | $41,379 |
|---|
|
| Average Annual Return [Table Text Block] |
Table Summary | 1 Year | 5 Years | 10 Years |
|---|
Westwood Salient MLP & Energy Infrastructure Fund - C Class Shares | | | |
|---|
Without CDSC | 30.05% | 19.17% | 9.76% |
|---|
With CDSC | 29.05% | 19.17% | 9.76% |
|---|
Alerian Midstream Energy Select Index | 33.65% | 23.94% | 13.49% |
|---|
Alerian MLP Index Trust | 30.52% | 24.25% | 10.35% |
|---|
S&P 500® Index | 31.05% | 13.14% | 15.26% |
|---|
|
| AssetsNet |
$ 1,442,177,080
|
| Holdings Count | Holding |
53
|
| Advisory Fees Paid, Amount |
$ 5,595,856
|
| InvestmentCompanyPortfolioTurnover |
15.00%
|
| Additional Fund Statistics [Text Block] |
- Net Assets$1,442,177,080
- Number of Portfolio Holdings53
- Advisory Fee (net of waivers)$5,595,856
- Portfolio Turnover15%
|
| Holdings [Text Block] |
Asset Weighting (% of total investments)Table SummaryValue | Value |
|---|
Affiliated Exchange-Traded Funds | 4.0% | Master Limited Partnerships | 24.4% | MLP Related Companies | 71.3% | Money Market Funds | 0.3% | Sector Weighting (% of net assets)Table SummaryValue | Value |
|---|
Money Market Funds | 0.3% | Renewable Energy Infrastructure | 0.9% | Independent Power Producers | 2.5% | Power Equipment | 2.7% | Affiliated Exchange-Traded Funds | 4.0% | Pipelines | 89.6% | |
| Largest Holdings [Text Block] |
Top 10 Holdings (% of net assets)Table SummaryHolding Name | % of Net Assets |
|---|
Energy Transfer, L.P. | 10.3% |
|---|
Williams Companies, Inc. (The) | 8.2% |
|---|
DT Midstream, Inc. | 7.7% |
|---|
Kinder Morgan, Inc. | 6.9% |
|---|
Enbridge, Inc. | 6.6% |
|---|
TC Energy Corporation | 4.9% |
|---|
Enterprise Products Partners, L.P. | 4.9% |
|---|
Cheniere Energy, Inc. | 4.8% |
|---|
Keyera Corporation | 4.5% |
|---|
MPLX, L.P. | 4.2% |
|---|
|
| Material Fund Change [Text Block] |
No material changes occurred during the period ended April 30, 2026. |
| C000237962 |
|
| Shareholder Report [Line Items] |
|
| Fund Name |
Westwood Salient MLP & Energy Infrastructure Fund
|
| Class Name |
Ultra Shares
|
| Trading Symbol |
SMRPX
|
| Annual or Semi-Annual Statement [Text Block] |
This semi-annual shareholder report contains important information about Westwood Salient MLP & Energy Infrastructure Fund (the "Fund") for the period of November 1, 2025 to April 30, 2026.
|
| Additional Information [Text Block] |
You can find additional information about the Fund at https://westwoodgroup.com/product/energy-infrastructure-fund/. You can also request this information by contacting us at (877) 386-3944.
|
| Additional Information Phone Number |
(877) 386-3944
|
| Additional Information Website |
<span style="font-weight: 700; box-sizing: border-box; color: rgb(99, 102, 106); display: inline; flex-wrap: nowrap; font-size: 10.6667px; grid-area: auto; line-height: 12.8px; margin: 0px; overflow: visible; text-align: left; text-align-last: left; white-space-collapse: preserve-breaks;">https://westwoodgroup.com/product/energy-infrastructure-fund/</span>
|
| Expenses [Text Block] |
What were the Fund’s annualized costs for the last six months?(based on a hypothetical $10,000 investment) Table SummaryClass Name | Costs of a $10,000 investment | Costs paid as a percentage of a $10,000 investment |
|---|
Ultra Shares | $54 | 0.95% |
|---|
|
| Expenses Paid, Amount |
$ 54
|
| Expense Ratio, Percent |
0.95%
|
| Factors Affecting Performance [Text Block] |
How did the Fund perform during the reporting period? For the trailing period, the Westwood Salient MLP and Energy Infrastructure Fund underperformed its representative benchmark, despite delivering a strong absolute return. The midstream energy sector provided strong performance in the trailing period, as oil and gas volatility increased due to geopolitical shocks in Venezuela and Iran, sending crude oil prices over $100. In this environment, midstream performance was anchored by long-term, fee-based contracts that insulated cash flows. Rising U.S. LNG exports and continued artificial intelligence/data-center electricity demand increased volumes across pipeline, gathering, processing and storage assets. Volumes remained resilient throughout geopolitically induced volatility in oil markets, as production declines were modest and pipelines remained highly contracted. Capital discipline, ongoing debt reduction and continued commitment to dividend growth and buybacks remained defining themes across the industry, helping to anchor investor confidence amid broader energy market fluctuations. Stock selection for the trailing period was the largest contributor to relative underperformance, with the interaction between allocation and selection decisions mitigating a portion of the underperformance. On an absolute basis, the Gathering and Processing and Natural Gas Pipelines subsectors were the largest contributors to performance, both generating strong returns during the period, though security selection within each subsector detracted from relative performance. The LNG and Utilities subsectors were the largest detractors from performance for the trailing period. An underweight allocation to the strong performing LNG subsector was the primary driver of relative performance, while allocation to Utilities, a subsector not represented in the benchmark, drove relative underperformance as the subsector provided the lowest absolute returns for the period. |
| Line Graph [Table Text Block] |
Table Summary | Westwood Salient MLP & Energy Infrastructure Fund - Ultra Shares | Alerian Midstream Energy Select Index | Alerian MLP Index Trust | S&P 500® Index |
|---|
Jan-2016 | $1,000,000 | $1,000,000 | $1,000,000 | $1,000,000 |
|---|
Apr-2016 | $1,092,745 | $1,168,838 | $1,047,455 | $1,032,981 |
|---|
Apr-2017 | $1,387,615 | $1,439,557 | $1,194,947 | $1,218,076 |
|---|
Apr-2018 | $1,198,787 | $1,312,148 | $1,045,832 | $1,379,665 |
|---|
Apr-2019 | $1,268,510 | $1,429,422 | $1,098,914 | $1,565,844 |
|---|
Apr-2020 | $901,945 | $968,686 | $650,712 | $1,579,357 |
|---|
Apr-2021 | $1,216,222 | $1,417,154 | $946,615 | $2,305,577 |
|---|
Apr-2022 | $1,507,810 | $1,854,389 | $1,205,364 | $2,310,488 |
|---|
Apr-2023 | $1,529,288 | $1,907,642 | $1,407,588 | $2,372,046 |
|---|
Apr-2024 | $1,939,676 | $2,396,757 | $1,892,632 | $2,909,591 |
|---|
Apr-2025 | $2,347,151 | $3,100,741 | $2,148,197 | $3,261,540 |
|---|
Apr-2026 | $3,086,567 | $4,144,239 | $2,803,724 | $4,274,341 |
|---|
|
| Average Annual Return [Table Text Block] |
Table Summary | 1 Year | 5 Years | 10 Years |
|---|
Westwood Salient MLP & Energy Infrastructure Fund - Ultra Shares | 31.50% | 20.47% | 10.94% |
|---|
Alerian Midstream Energy Select Index | 33.65% | 23.94% | 13.49% |
|---|
Alerian MLP Index Trust | 30.52% | 24.25% | 10.35% |
|---|
S&P 500® Index | 31.05% | 13.14% | 15.26% |
|---|
|
| AssetsNet |
$ 1,442,177,080
|
| Holdings Count | Holding |
53
|
| Advisory Fees Paid, Amount |
$ 5,595,856
|
| InvestmentCompanyPortfolioTurnover |
15.00%
|
| Additional Fund Statistics [Text Block] |
- Net Assets$1,442,177,080
- Number of Portfolio Holdings53
- Advisory Fee (net of waivers)$5,595,856
- Portfolio Turnover15%
|
| Holdings [Text Block] |
Asset Weighting (% of total investments)Table SummaryValue | Value |
|---|
Affiliated Exchange-Traded Funds | 4.0% | Master Limited Partnerships | 24.4% | MLP Related Companies | 71.3% | Money Market Funds | 0.3% | Sector Weighting (% of net assets)Table SummaryValue | Value |
|---|
Money Market Funds | 0.3% | Renewable Energy Infrastructure | 0.9% | Independent Power Producers | 2.5% | Power Equipment | 2.7% | Affiliated Exchange-Traded Funds | 4.0% | Pipelines | 89.6% | |
| Largest Holdings [Text Block] |
Top 10 Holdings (% of net assets)Table SummaryHolding Name | % of Net Assets |
|---|
Energy Transfer, L.P. | 10.3% |
|---|
Williams Companies, Inc. (The) | 8.2% |
|---|
DT Midstream, Inc. | 7.7% |
|---|
Kinder Morgan, Inc. | 6.9% |
|---|
Enbridge, Inc. | 6.6% |
|---|
TC Energy Corporation | 4.9% |
|---|
Enterprise Products Partners, L.P. | 4.9% |
|---|
Cheniere Energy, Inc. | 4.8% |
|---|
Keyera Corporation | 4.5% |
|---|
MPLX, L.P. | 4.2% |
|---|
|
| Material Fund Change [Text Block] |
No material changes occurred during the period ended April 30, 2026. |
| C000237966 |
|
| Shareholder Report [Line Items] |
|
| Fund Name |
Westwood Real Estate Income Fund
|
| Class Name |
Institutional Shares
|
| Trading Symbol |
KIFYX
|
| Annual or Semi-Annual Statement [Text Block] |
This semi-annual shareholder report contains important information about Westwood Real Estate Income Fund (the "Fund") for the period of November 1, 2025 to April 30, 2026.
|
| Additional Information [Text Block] |
You can find additional information about the Fund at https://westwoodgroup.com/product/real-estate-income-fund/. You can also request this information by contacting us at (877) 386-3944.
|
| Additional Information Phone Number |
(877) 386-3944
|
| Additional Information Website |
<span style="font-weight: 700; box-sizing: border-box; color: rgb(99, 102, 106); display: inline; flex-wrap: nowrap; font-size: 10.6667px; grid-area: auto; line-height: 12.8px; margin: 0px; overflow: visible; text-align: left; text-align-last: left; white-space-collapse: preserve-breaks;">https://westwoodgroup.com/product/real-estate-income-fund/</span>
|
| Expenses [Text Block] |
What were the Fund’s annualized costs for the last six months?(based on a hypothetical $10,000 investment) Table SummaryClass Name | Costs of a $10,000 investment | Costs paid as a percentage of a $10,000 investment |
|---|
Institutional Shares | $44 | 0.87% |
|---|
|
| Expenses Paid, Amount |
$ 44
|
| Expense Ratio, Percent |
0.87%
|
| Factors Affecting Performance [Text Block] |
How did the Fund perform during the reporting period? For the trailing period, the Westwood Real Estate Income Fund outperformed its representative benchmark. U.S. REIT markets operated in a transitional environment, amid moderating—though still volatile—interest rates, widening performance dispersion across property types and improving visibility into economic growth as monetary policy moved from late-2025 easing toward a holding pattern in early 2026. REIT equities faced episodic volatility tied to fluctuations in Treasuries and geopolitical developments yet demonstrated resilience relative to broader equities during periods of market stress in the first quarter of 2026. Office properties continued to face structural headwinds stemming from elevated vacancies, subdued leasing activity and shifts in workplace utilization, resulting in underperformance within the sector. Industrial REITs saw mixed results as new supply deliveries weighed on near-term fundamentals in select markets, partially offset by longer-term logistics and data-infrastructure demand. In contrast, Residential and Retail sectors showed comparatively stronger fundamentals, supported by steady occupancy, moderating supply pipelines and resilient consumer spending, contributing to improved relative stability during the trailing period. The Fund’s allocation to off-benchmark equity and convertible allocation was the largest contributor to relative performance, while REIT preferred securities remained comparatively stable despite broader sector uncertainty and also contributed meaningfully to the Fund’s relative outperformance. Preferreds benefited from their senior capital position and contractual income streams, which helped dampen volatility relative to common equity and supported attractive risk-adjusted returns in a range-bound rate environment. Strong selection within preferred holdings drove returns and contributed meaningfully to the Fund’s outperformance. |
| Line Graph [Table Text Block] |
Table Summary | Westwood Real Estate Income Fund - Institutional Shares | Bloomberg U.S. Aggregate Bond Index | ICE BofA Fixed Rate Preferred Securities Index |
|---|
Apr-2016 | $100,000 | $100,000 | $100,000 |
|---|
Apr-2017 | $112,716 | $100,829 | $106,500 |
|---|
Apr-2018 | $106,292 | $100,507 | $108,601 |
|---|
Apr-2019 | $116,610 | $105,824 | $116,059 |
|---|
Apr-2020 | $95,600 | $117,297 | $120,466 |
|---|
Apr-2021 | $128,889 | $116,984 | $133,291 |
|---|
Apr-2022 | $131,153 | $107,026 | $119,835 |
|---|
Apr-2023 | $123,209 | $106,569 | $121,967 |
|---|
Apr-2024 | $131,833 | $105,004 | $130,297 |
|---|
Apr-2025 | $140,025 | $113,426 | $135,345 |
|---|
Apr-2026 | $151,156 | $118,027 | $145,415 |
|---|
|
| Average Annual Return [Table Text Block] |
Table Summary | 1 Year | 5 Years | 10 Years |
|---|
Westwood Real Estate Income Fund - Institutional Shares | 7.95% | 3.24% | 4.22% |
|---|
Bloomberg U.S. Aggregate Bond Index | 4.06% | 0.18% | 1.67% |
|---|
ICE BofA Fixed Rate Preferred Securities Index | 7.44% | 1.76% | 3.82% |
|---|
|
| AssetsNet |
$ 242,562,764
|
| Holdings Count | Holding |
46
|
| Advisory Fees Paid, Amount |
$ 859,442
|
| InvestmentCompanyPortfolioTurnover |
33.00%
|
| Additional Fund Statistics [Text Block] |
- Net Assets$242,562,764
- Number of Portfolio Holdings46
- Advisory Fee $859,442
- Portfolio Turnover33%
|
| Holdings [Text Block] |
Asset Weighting (% of total investments)Table SummaryValue | Value |
|---|
Common Stocks | 27.8% | Money Market Funds | 1.7% | Preferred Stocks | 70.5% | Industry Weighting (% of net assets)Table SummaryValue | Value |
|---|
Liabilities in Excess of Other Assets | -0.5% | Other Industries | 6.4% | Specialty Finance | 3.0% | Multi-Asset Class | 3.0% | Banking | 3.0% | Industrial | 3.6% | Infrastructure | 3.7% | Mortgage | 3.9% | Shopping Centers | 4.3% | Home Construction | 4.4% | Specialized | 5.6% | Residential | 5.7% | Retail | 5.9% | Diversified | 6.7% | Storage | 7.0% | Healthcare | 7.0% | Office | 8.8% | Hotels | 18.5% | |
| Largest Holdings [Text Block] |
Top 10 Holdings (% of net assets)Table SummaryHolding Name | % of Net Assets |
|---|
Hovnanian Enterprises, Inc., 7.63% - Series A | 4.4% |
|---|
KKR Real Estate Finance Trust, Inc., 6.50% - Series A | 3.9% |
|---|
RLJ Lodging Trust, 7.80% - Series A | 3.9% |
|---|
COPT Defense Properties | 3.9% |
|---|
CTO Realty Growth, Inc., 6.38% - Series A | 3.9% |
|---|
Crown Castle, Inc. | 3.7% |
|---|
Pebblebrook Hotel Trust, 5.70% - Series H | 3.6% |
|---|
LXP Industrial Trust, 6.50% - Series C | 3.6% |
|---|
National Storage Affiliates Trust, 6.00% - Series A | 3.5% |
|---|
Saul Centers, Inc., 6.13% - Series D | 3.2% |
|---|
|
| Material Fund Change [Text Block] |
No material changes occurred during the period ended April 30, 2026. |
| C000237968 |
|
| Shareholder Report [Line Items] |
|
| Fund Name |
Westwood Real Estate Income Fund
|
| Class Name |
A Class Shares
|
| Trading Symbol |
KIFAX
|
| Annual or Semi-Annual Statement [Text Block] |
This semi-annual shareholder report contains important information about Westwood Real Estate Income Fund (the "Fund") for the period of November 1, 2025 to April 30, 2026.
|
| Additional Information [Text Block] |
You can find additional information about the Fund at https://westwoodgroup.com/product/real-estate-income-fund/. You can also request this information by contacting us at (877) 386-3944.
|
| Additional Information Phone Number |
(877) 386-3944
|
| Additional Information Website |
<span style="font-weight: 700; box-sizing: border-box; color: rgb(99, 102, 106); display: inline; flex-wrap: nowrap; font-size: 10.6667px; grid-area: auto; line-height: 12.8px; margin: 0px; overflow: visible; text-align: left; text-align-last: left; white-space-collapse: preserve-breaks;">https://westwoodgroup.com/product/real-estate-income-fund/</span>
|
| Expenses [Text Block] |
What were the Fund’s annualized costs for the last six months?(based on a hypothetical $10,000 investment) Table SummaryClass Name | Costs of a $10,000 investment | Costs paid as a percentage of a $10,000 investment |
|---|
A Class Shares | $59 | 1.17% |
|---|
|
| Expenses Paid, Amount |
$ 59
|
| Expense Ratio, Percent |
1.17%
|
| Factors Affecting Performance [Text Block] |
How did the Fund perform during the reporting period? For the trailing period, the Westwood Real Estate Income Fund outperformed its representative benchmark. U.S. REIT markets operated in a transitional environment, amid moderating—though still volatile—interest rates, widening performance dispersion across property types and improving visibility into economic growth as monetary policy moved from late-2025 easing toward a holding pattern in early 2026. REIT equities faced episodic volatility tied to fluctuations in Treasuries and geopolitical developments yet demonstrated resilience relative to broader equities during periods of market stress in the first quarter of 2026. Office properties continued to face structural headwinds stemming from elevated vacancies, subdued leasing activity and shifts in workplace utilization, resulting in underperformance within the sector. Industrial REITs saw mixed results as new supply deliveries weighed on near-term fundamentals in select markets, partially offset by longer-term logistics and data-infrastructure demand. In contrast, Residential and Retail sectors showed comparatively stronger fundamentals, supported by steady occupancy, moderating supply pipelines and resilient consumer spending, contributing to improved relative stability during the trailing period. The Fund’s allocation to off-benchmark equity and convertible allocation was the largest contributor to relative performance, while REIT preferred securities remained comparatively stable despite broader sector uncertainty and also contributed meaningfully to the Fund’s relative outperformance. Preferreds benefited from their senior capital position and contractual income streams, which helped dampen volatility relative to common equity and supported attractive risk-adjusted returns in a range-bound rate environment. Strong selection within preferred holdings drove returns and contributed meaningfully to the Fund’s outperformance. |
| Line Graph [Table Text Block] |
Table Summary | Westwood Real Estate Income Fund - A Class Shares | Bloomberg U.S. Aggregate Bond Index | ICE BofA Fixed Rate Preferred Securities Index |
|---|
Apr-2016 | $9,426 | $10,000 | $10,000 |
|---|
Apr-2017 | $10,585 | $10,083 | $10,650 |
|---|
Apr-2018 | $9,940 | $10,051 | $10,860 |
|---|
Apr-2019 | $10,871 | $10,582 | $11,606 |
|---|
Apr-2020 | $8,874 | $11,730 | $12,047 |
|---|
Apr-2021 | $11,925 | $11,698 | $13,329 |
|---|
Apr-2022 | $12,084 | $10,703 | $11,984 |
|---|
Apr-2023 | $11,302 | $10,657 | $12,197 |
|---|
Apr-2024 | $12,077 | $10,500 | $13,030 |
|---|
Apr-2025 | $12,784 | $11,343 | $13,535 |
|---|
Apr-2026 | $13,762 | $11,803 | $14,542 |
|---|
|
| Average Annual Return [Table Text Block] |
Table Summary | 1 Year | 5 Years | 10 Years |
|---|
Westwood Real Estate Income Fund - A Class Shares | | | |
|---|
Without Load | 7.65% | 2.91% | 3.86% |
|---|
With LoadFootnote Reference* | 4.44% | 1.70% | 3.24% |
|---|
Bloomberg U.S. Aggregate Bond Index | 4.06% | 0.18% | 1.67% |
|---|
ICE BofA Fixed Rate Preferred Securities Index | 7.44% | 1.76% | 3.82% |
|---|
|
| AssetsNet |
$ 242,562,764
|
| Holdings Count | Holding |
46
|
| Advisory Fees Paid, Amount |
$ 859,442
|
| InvestmentCompanyPortfolioTurnover |
33.00%
|
| Additional Fund Statistics [Text Block] |
- Net Assets$242,562,764
- Number of Portfolio Holdings46
- Advisory Fee $859,442
- Portfolio Turnover33%
|
| Holdings [Text Block] |
Asset Weighting (% of total investments)Table SummaryValue | Value |
|---|
Common Stocks | 27.8% | Money Market Funds | 1.7% | Preferred Stocks | 70.5% | Industry Weighting (% of net assets)Table SummaryValue | Value |
|---|
Liabilities in Excess of Other Assets | -0.5% | Other Industries | 6.4% | Specialty Finance | 3.0% | Multi-Asset Class | 3.0% | Banking | 3.0% | Industrial | 3.6% | Infrastructure | 3.7% | Mortgage | 3.9% | Shopping Centers | 4.3% | Home Construction | 4.4% | Specialized | 5.6% | Residential | 5.7% | Retail | 5.9% | Diversified | 6.7% | Storage | 7.0% | Healthcare | 7.0% | Office | 8.8% | Hotels | 18.5% | |
| Largest Holdings [Text Block] |
Top 10 Holdings (% of net assets)Table SummaryHolding Name | % of Net Assets |
|---|
Hovnanian Enterprises, Inc., 7.63% - Series A | 4.4% |
|---|
KKR Real Estate Finance Trust, Inc., 6.50% - Series A | 3.9% |
|---|
RLJ Lodging Trust, 7.80% - Series A | 3.9% |
|---|
COPT Defense Properties | 3.9% |
|---|
CTO Realty Growth, Inc., 6.38% - Series A | 3.9% |
|---|
Crown Castle, Inc. | 3.7% |
|---|
Pebblebrook Hotel Trust, 5.70% - Series H | 3.6% |
|---|
LXP Industrial Trust, 6.50% - Series C | 3.6% |
|---|
National Storage Affiliates Trust, 6.00% - Series A | 3.5% |
|---|
Saul Centers, Inc., 6.13% - Series D | 3.2% |
|---|
|
| Material Fund Change [Text Block] |
No material changes occurred during the period ended April 30, 2026. |
| Updated Prospectus Phone Number |
(877) 386-3944
|
| Updated Prospectus Web Address |
https://westwoodgroup.com/product/real-estate-income-fund/
|
| C000237951 |
|
| Shareholder Report [Line Items] |
|
| Fund Name |
Westwood Broadmark Tactical Growth Fund
|
| Class Name |
Institutional Shares
|
| Trading Symbol |
FTGWX
|
| Annual or Semi-Annual Statement [Text Block] |
This semi-annual shareholder report contains important information about Westwood Broadmark Tactical Growth Fund (the "Fund") for the period of November 1, 2025 to April 30, 2026.
|
| Additional Information [Text Block] |
You can find additional information about the Fund at https://westwoodgroup.com/product/tactical-growth-fund/. You can also request this information by contacting us at (877)
386-3944.
|
| Additional Information Phone Number |
(877)
386-3944
|
| Additional Information Website |
<span style="font-weight: 700; box-sizing: border-box; color: rgb(99, 102, 106); display: inline; flex-wrap: nowrap; font-size: 10.6667px; grid-area: auto; line-height: 12.8px; margin: 0px; overflow: visible; text-align: left; text-align-last: left; white-space-collapse: preserve-breaks;">https://westwoodgroup.com/product/tactical-growth-fund/</span>
|
| Expenses [Text Block] |
What were the Fund’s annualized costs for the last six months?(based on a hypothetical $10,000 investment) Table SummaryClass Name | Costs of a $10,000 investment | Costs paid as a percentage of a $10,000 investment |
|---|
Institutional Shares | $66 | 1.28% |
|---|
|
| Expenses Paid, Amount |
$ 66
|
| Expense Ratio, Percent |
1.28%
|
| Factors Affecting Performance [Text Block] |
How did the Fund perform during the reporting period? The Westwood Broadmark Tactical Growth Fund outperformed its representative benchmark, the HFRX Equity Hedge Index, in the reporting period. Equity markets experienced increased volatility from geopolitical risks and equity-market shocks, while earnings strength among artificial intelligence-linked mega-cap technology firms remained a key area of support for equities, especially in the U.S. market. An increase in market breadth that began in late 2025 continued throughout early 2026, as value stocks, small caps and non-U.S. equities experienced periodic leadership as investors sought broader participation and downside resilience. From the beginning of the period through January 2026, exposure to the market was increased as the investment team added positions in response to improving relative strength. Exposure was reduced as monetary policy, momentum and market breadth deteriorated in the middle of the period. The team increased exposure in the last month of the period as momentum, market breadth, sentiment and volume showed improvement. With regard to our four-pillar investment process, for much of the period, the valuation pillar pointed to equity valuations being elevated compared to historical norms, as stock market capitalization as a percentage of gross domestic product reached new all-time highs. Monetary factors and credit conditions remained positive for the majority of the period, before turning neutral to end the period as conflict in the Middle East sent oil and other commodity prices upward. The investor sentiment pillar was negative for most of the period, turning positive during March from our contrarian point of view. The momentum pillar was more dynamic, remaining positive but deteriorating until March, when it turned negative, and rebounding to positive territory in April. The team would increase exposure if interest rates declined and if momentum improved further. The team would decrease exposure if our breadth and volume momentum models deteriorated. |
| Line Graph [Table Text Block] |
Table Summary | Westwood Broadmark Tactical Growth Fund - Institutional Shares | HFRX Equity Hedge Index | S&P 500® Index |
|---|
Apr-2016 | $100,000 | $100,000 | $100,000 |
|---|
Apr-2017 | $108,504 | $106,638 | $117,918 |
|---|
Apr-2018 | $114,581 | $114,082 | $133,562 |
|---|
Apr-2019 | $117,929 | $109,558 | $151,585 |
|---|
Apr-2020 | $122,586 | $102,980 | $152,893 |
|---|
Apr-2021 | $140,545 | $125,745 | $223,196 |
|---|
Apr-2022 | $135,617 | $130,664 | $223,672 |
|---|
Apr-2023 | $131,597 | $130,953 | $229,631 |
|---|
Apr-2024 | $135,124 | $141,590 | $281,669 |
|---|
Apr-2025 | $143,032 | $149,160 | $315,741 |
|---|
Apr-2026 | $165,794 | $170,153 | $413,787 |
|---|
|
| Average Annual Return [Table Text Block] |
Table Summary | 1 Year | 5 Years | 10 Years |
|---|
Westwood Broadmark Tactical Growth Fund - Institutional Shares | 15.91% | 3.36% | 5.19% |
|---|
HFRX Equity Hedge Index | 14.07% | 6.24% | 5.46% |
|---|
S&P 500® Index | 31.05% | 13.14% | 15.26% |
|---|
|
| AssetsNet |
$ 184,361,891
|
| Holdings Count | Holding |
10
|
| Advisory Fees Paid, Amount |
$ 960,187
|
| InvestmentCompanyPortfolioTurnover |
66.00%
|
| Additional Fund Statistics [Text Block] |
- Net Assets$184,361,891
- Number of Portfolio Holdings10
- Advisory Fee $960,187
- Portfolio Turnover66%
|
| Holdings [Text Block] |
Asset Weighting (% of total investments)Table SummaryValue | Value |
|---|
Exchange-Traded Funds | 55.8% | Money Market Funds | 44.2% | |
| Material Fund Change [Text Block] |
No material changes occurred during the period ended April 30, 2026. |
| C000237952 |
|
| Shareholder Report [Line Items] |
|
| Fund Name |
Westwood Broadmark Tactical Growth Fund
|
| Class Name |
A Class Shares
|
| Trading Symbol |
FTAGX
|
| Annual or Semi-Annual Statement [Text Block] |
This semi-annual shareholder report contains important information about Westwood Broadmark Tactical Growth Fund (the "Fund") for the period of November 1, 2025 to April 30, 2026.
|
| Additional Information [Text Block] |
You can find additional information about the Fund at https://westwoodgroup.com/product/tactical-growth-fund/. You can also request this information by contacting us at (877) 386-3944.
|
| Additional Information Phone Number |
(877) 386-3944
|
| Additional Information Website |
<span style="font-weight: 700; box-sizing: border-box; color: rgb(99, 102, 106); display: inline; flex-wrap: nowrap; font-size: 10.6667px; grid-area: auto; line-height: 12.8px; margin: 0px; overflow: visible; text-align: left; text-align-last: left; white-space-collapse: preserve-breaks;">https://westwoodgroup.com/product/tactical-growth-fund/</span>
|
| Expenses [Text Block] |
What were the Fund’s annualized costs for the last six months?(based on a hypothetical $10,000 investment) Table SummaryClass Name | Costs of a $10,000 investment | Costs paid as a percentage of a $10,000 investment |
|---|
A Class Shares | $81 | 1.58% |
|---|
|
| Expenses Paid, Amount |
$ 81
|
| Expense Ratio, Percent |
1.58%
|
| Factors Affecting Performance [Text Block] |
How did the Fund perform during the reporting period? The Westwood Broadmark Tactical Growth Fund outperformed its representative benchmark, the HFRX Equity Hedge Index, in the reporting period. Equity markets experienced increased volatility from geopolitical risks and equity-market shocks, while earnings strength among artificial intelligence-linked mega-cap technology firms remained a key area of support for equities, especially in the U.S. market. An increase in market breadth that began in late 2025 continued throughout early 2026, as value stocks, small caps and non-U.S. equities experienced periodic leadership as investors sought broader participation and downside resilience. From the beginning of the period through January 2026, exposure to the market was increased as the investment team added positions in response to improving relative strength. Exposure was reduced as monetary policy, momentum and market breadth deteriorated in the middle of the period. The team increased exposure in the last month of the period as momentum, market breadth, sentiment and volume showed improvement. With regard to our four-pillar investment process, for much of the period, the valuation pillar pointed to equity valuations being elevated compared to historical norms, as stock market capitalization as a percentage of gross domestic product reached new all-time highs. Monetary factors and credit conditions remained positive for the majority of the period, before turning neutral to end the period as conflict in the Middle East sent oil and other commodity prices upward. The investor sentiment pillar was negative for most of the period, turning positive during March from our contrarian point of view. The momentum pillar was more dynamic, remaining positive but deteriorating until March, when it turned negative, and rebounding to positive territory in April. The team would increase exposure if interest rates declined and if momentum improved further. The team would decrease exposure if our breadth and volume momentum models deteriorated. |
| Line Graph [Table Text Block] |
Table Summary | Westwood Broadmark Tactical Growth Fund - A Class Shares | HFRX Equity Hedge Index | S&P 500® Index |
|---|
Apr-2016 | $9,426 | $10,000 | $10,000 |
|---|
Apr-2017 | $10,175 | $10,664 | $11,792 |
|---|
Apr-2018 | $10,694 | $11,408 | $13,356 |
|---|
Apr-2019 | $10,961 | $10,956 | $15,158 |
|---|
Apr-2020 | $11,348 | $10,298 | $15,289 |
|---|
Apr-2021 | $12,957 | $12,575 | $22,320 |
|---|
Apr-2022 | $12,451 | $13,066 | $22,367 |
|---|
Apr-2023 | $12,038 | $13,095 | $22,963 |
|---|
Apr-2024 | $12,331 | $14,159 | $28,167 |
|---|
Apr-2025 | $13,017 | $14,916 | $31,574 |
|---|
Apr-2026 | $15,041 | $17,015 | $41,379 |
|---|
|
| Average Annual Return [Table Text Block] |
Table Summary | 1 Year | 5 Years | 10 Years |
|---|
Westwood Broadmark Tactical Growth Fund - A Class Shares | | | |
|---|
Without Load | 15.55% | 3.03% | 4.78% |
|---|
With LoadFootnote Reference* | 10.91% | 1.81% | 4.17% |
|---|
HFRX Equity Hedge Index | 14.07% | 6.24% | 5.46% |
|---|
S&P 500® Index | 31.05% | 13.14% | 15.26% |
|---|
|
| AssetsNet |
$ 184,361,891
|
| Holdings Count | Holding |
10
|
| Advisory Fees Paid, Amount |
$ 960,187
|
| InvestmentCompanyPortfolioTurnover |
66.00%
|
| Additional Fund Statistics [Text Block] |
- Net Assets$184,361,891
- Number of Portfolio Holdings10
- Advisory Fee $960,187
- Portfolio Turnover66%
|
| Holdings [Text Block] |
Asset Weighting (% of total investments)Table SummaryValue | Value |
|---|
Exchange-Traded Funds | 55.8% | Money Market Funds | 44.2% | |
| Material Fund Change [Text Block] |
No material changes occurred during the period ended April 30, 2026. |
| Updated Prospectus Phone Number |
(877) 386-3944
|
| Updated Prospectus Web Address |
https://westwoodgroup.com/product/tactical-growth-fund/
|
| C000237949 |
|
| Shareholder Report [Line Items] |
|
| Fund Name |
Westwood Broadmark Tactical Growth Fund
|
| Class Name |
C Class Shares
|
| Trading Symbol |
FTGOX
|
| Annual or Semi-Annual Statement [Text Block] |
This semi-annual shareholder report contains important information about Westwood Broadmark Tactical Growth Fund (the "Fund") for the period of November 1, 2025 to April 30, 2026.
|
| Additional Information [Text Block] |
You can find additional information about the Fund at https://westwoodgroup.com/product/tactical-growth-fund/. You can also request this information by contacting us at (877) 386-3944.
|
| Additional Information Phone Number |
(877) 386-3944
|
| Additional Information Website |
<span style="font-weight: 700; box-sizing: border-box; color: rgb(99, 102, 106); display: inline; flex-wrap: nowrap; font-size: 10.6667px; grid-area: auto; line-height: 12.8px; margin: 0px; overflow: visible; text-align: left; text-align-last: left; white-space-collapse: preserve-breaks;">https://westwoodgroup.com/product/tactical-growth-fund/</span>
|
| Expenses [Text Block] |
What were the Fund’s annualized costs for the last six months?(based on a hypothetical $10,000 investment) Table SummaryClass Name | Costs of a $10,000 investment | Costs paid as a percentage of a $10,000 investment |
|---|
C Class Shares | $114 | 2.23% |
|---|
|
| Expenses Paid, Amount |
$ 114
|
| Expense Ratio, Percent |
2.23%
|
| Factors Affecting Performance [Text Block] |
How did the Fund perform during the reporting period? The Westwood Broadmark Tactical Growth Fund outperformed its representative benchmark, the HFRX Equity Hedge Index, in the reporting period. Equity markets experienced increased volatility from geopolitical risks and equity-market shocks, while earnings strength among artificial intelligence-linked mega-cap technology firms remained a key area of support for equities, especially in the U.S. market. An increase in market breadth that began in late 2025 continued throughout early 2026, as value stocks, small caps and non-U.S. equities experienced periodic leadership as investors sought broader participation and downside resilience. From the beginning of the period through January 2026, exposure to the market was increased as the investment team added positions in response to improving relative strength. Exposure was reduced as monetary policy, momentum and market breadth deteriorated in the middle of the period. The team increased exposure in the last month of the period as momentum, market breadth, sentiment and volume showed improvement. With regard to our four-pillar investment process, for much of the period, the valuation pillar pointed to equity valuations being elevated compared to historical norms, as stock market capitalization as a percentage of gross domestic product reached new all-time highs. Monetary factors and credit conditions remained positive for the majority of the period, before turning neutral to end the period as conflict in the Middle East sent oil and other commodity prices upward. The investor sentiment pillar was negative for most of the period, turning positive during March from our contrarian point of view. The momentum pillar was more dynamic, remaining positive but deteriorating until March, when it turned negative, and rebounding to positive territory in April. The team would increase exposure if interest rates declined and if momentum improved further. The team would decrease exposure if our breadth and volume momentum models deteriorated. |
| Line Graph [Table Text Block] |
Table Summary | Westwood Broadmark Tactical Growth Fund - C Class Shares | HFRX Equity Hedge Index | S&P 500® Index |
|---|
Apr-2016 | $10,000 | $10,000 | $10,000 |
|---|
Apr-2017 | $10,745 | $10,664 | $11,792 |
|---|
Apr-2018 | $11,244 | $11,408 | $13,356 |
|---|
Apr-2019 | $11,441 | $10,956 | $15,158 |
|---|
Apr-2020 | $11,783 | $10,298 | $15,289 |
|---|
Apr-2021 | $13,378 | $12,575 | $22,320 |
|---|
Apr-2022 | $12,787 | $13,066 | $22,367 |
|---|
Apr-2023 | $12,291 | $13,095 | $22,963 |
|---|
Apr-2024 | $12,501 | $14,159 | $28,167 |
|---|
Apr-2025 | $13,108 | $14,916 | $31,574 |
|---|
Apr-2026 | $15,049 | $17,015 | $41,379 |
|---|
|
| Average Annual Return [Table Text Block] |
Table Summary | 1 Year | 5 Years | 10 Years |
|---|
Westwood Broadmark Tactical Growth Fund - C Class Shares | | | |
|---|
Without CDSC | 14.81% | 2.38% | 4.17% |
|---|
With CDSC | 13.81% | 2.38% | 4.17% |
|---|
HFRX Equity Hedge Index | 14.07% | 6.24% | 5.46% |
|---|
S&P 500® Index | 31.05% | 13.14% | 15.26% |
|---|
|
| AssetsNet |
$ 184,361,891
|
| Holdings Count | Holding |
10
|
| Advisory Fees Paid, Amount |
$ 960,187
|
| InvestmentCompanyPortfolioTurnover |
66.00%
|
| Additional Fund Statistics [Text Block] |
- Net Assets$184,361,891
- Number of Portfolio Holdings10
- Advisory Fee $960,187
- Portfolio Turnover66%
|
| Holdings [Text Block] |
Asset Weighting (% of total investments)Table SummaryValue | Value |
|---|
Exchange-Traded Funds | 55.8% | Money Market Funds | 44.2% | |
| Material Fund Change [Text Block] |
No material changes occurred during the period ended April 30, 2026. |
| C000237956 |
|
| Shareholder Report [Line Items] |
|
| Fund Name |
Westwood Broadmark Tactical Plus Fund
|
| Class Name |
Institutional Shares
|
| Trading Symbol |
SBTIX
|
| Annual or Semi-Annual Statement [Text Block] |
This semi-annual shareholder report contains important information about Westwood Broadmark Tactical Plus Fund (the "Fund") for the period of November 1, 2025 to April 30, 2026.
|
| Additional Information [Text Block] |
You can find additional information about the Fund at https://westwoodgroup.com/product/tactical-plus-fund/. You can also request this information by contacting us at (877) 386-3944.
|
| Additional Information Phone Number |
(877) 386-3944
|
| Additional Information Website |
<span style="font-weight: 700; box-sizing: border-box; color: rgb(99, 102, 106); display: inline; flex-wrap: nowrap; font-size: 10.6667px; grid-area: auto; line-height: 12.8px; margin: 0px; overflow: visible; text-align: left; text-align-last: left; white-space-collapse: preserve-breaks;">https://westwoodgroup.com/product/tactical-plus-fund/</span>
|
| Expenses [Text Block] |
What were the Fund’s annualized costs for the last six months?(based on a hypothetical $10,000 investment) Table SummaryClass Name | Costs of a $10,000 investment | Costs paid as a percentage of a $10,000 investment |
|---|
Institutional Shares | $60 | 1.20% |
|---|
|
| Expenses Paid, Amount |
$ 60
|
| Expense Ratio, Percent |
1.20%
|
| Factors Affecting Performance [Text Block] |
How did the Fund perform during the reporting period? The Westwood Broadmark Tactical Plus Fund underperformed its representative benchmark, the HFRX Equity Hedge Index, in the reporting period. Equity markets experienced increased volatility from geopolitical risks and equity-market shocks, while earnings strength among artificial intelligence-linked mega-cap technology firms remained a key area of support for equities, especially in the U.S. market. An increase in market breadth that began in late 2025 continued throughout early 2026, as value stocks, small caps and non-U.S. equities experienced periodic leadership as investors sought broader participation and downside resilience. Through January 2026, exposure to the market was increased as the Investment team added positions in response to improving relative strength. Exposure was reduced as monetary policy, momentum and market breadth deteriorated in the middle of the period. The team increased exposure in April as momentum, market breadth, sentiment and volume showed improvement. Relative to the Tactical Growth Fund, the Tactical Plus Fund maintained higher exposure to the market throughout the period. With regard to our four-pillar investment process, for much of the period, the valuation pillar pointed to equity valuations being elevated compared to historical norms, as stock market capitalization as a percentage of gross domestic product reached new all-time highs. Monetary factors and credit conditions remained positive before turning neutral to end the period as conflict in the Middle East sent commodity prices upward. The investor sentiment pillar was negative for most of the period, turning positive during March from our contrarian point of view. The momentum pillar was more dynamic, remaining positive but deteriorating until March, when it turned negative, and rebounding to positive territory in April. The team would increase exposure if interest rates declined and if momentum improved further. The team would decrease exposure if our breadth and volume momentum models deteriorated. |
| Line Graph [Table Text Block] |
Table Summary | Westwood Broadmark Tactical Plus Fund - Institutional Shares | HFRX Equity Hedge Index | S&P 500® Index |
|---|
Apr-2016 | $100,000 | $100,000 | $100,000 |
|---|
Apr-2017 | $108,742 | $106,638 | $117,918 |
|---|
Apr-2018 | $116,789 | $114,082 | $133,562 |
|---|
Apr-2019 | $126,591 | $109,558 | $151,585 |
|---|
Apr-2020 | $127,562 | $102,980 | $152,893 |
|---|
Apr-2021 | $144,138 | $125,745 | $223,196 |
|---|
Apr-2022 | $144,378 | $130,664 | $223,672 |
|---|
Apr-2023 | $144,153 | $130,953 | $229,631 |
|---|
Apr-2024 | $150,748 | $141,590 | $281,669 |
|---|
Apr-2025 | $146,558 | $149,160 | $315,741 |
|---|
Apr-2026 | $155,203 | $170,153 | $413,787 |
|---|
|
| Average Annual Return [Table Text Block] |
Table Summary | 1 Year | 5 Years | 10 Years |
|---|
Westwood Broadmark Tactical Plus Fund - Institutional Shares | 5.90% | 1.49% | 4.49% |
|---|
HFRX Equity Hedge Index | 14.07% | 6.24% | 5.46% |
|---|
S&P 500® Index | 31.05% | 13.14% | 15.26% |
|---|
|
| AssetsNet |
$ 64,382,681
|
| Holdings Count | Holding |
7
|
| Advisory Fees Paid, Amount |
$ 249,378
|
| InvestmentCompanyPortfolioTurnover |
23.00%
|
| Additional Fund Statistics [Text Block] |
- Net Assets$64,382,681
- Number of Portfolio Holdings7
- Advisory Fee (net of waivers)$249,378
- Portfolio Turnover23%
|
| Holdings [Text Block] |
Asset Weighting (% of total investments)Table SummaryValue | Value |
|---|
Exchange-Traded Funds | 28.3% | Money Market Funds | 71.7% | |
| Material Fund Change [Text Block] |
No material changes occurred during the period ended April 30, 2026. |
| C000237953 |
|
| Shareholder Report [Line Items] |
|
| Fund Name |
Westwood Broadmark Tactical Plus Fund
|
| Class Name |
A Class Shares
|
| Trading Symbol |
SBTAX
|
| Annual or Semi-Annual Statement [Text Block] |
This semi-annual shareholder report contains important information about Westwood Broadmark Tactical Plus Fund (the "Fund") for the period of November 1, 2025 to April 30, 2026.
|
| Additional Information [Text Block] |
You can find additional information about the Fund at https://westwoodgroup.com/product/tactical-plus-fund/. You can also request this information by contacting us at (877) 386-3944.
|
| Additional Information Phone Number |
(877) 386-3944
|
| Additional Information Website |
<span style="font-weight: 700; box-sizing: border-box; color: rgb(99, 102, 106); display: inline; flex-wrap: nowrap; font-size: 10.6667px; grid-area: auto; line-height: 12.8px; margin: 0px; overflow: visible; text-align: left; text-align-last: left; white-space-collapse: preserve-breaks;">https://westwoodgroup.com/product/tactical-plus-fund/</span>
|
| Expenses [Text Block] |
What were the Fund’s annualized costs for the last six months?(based on a hypothetical $10,000 investment) Table SummaryClass Name | Costs of a $10,000 investment | Costs paid as a percentage of a $10,000 investment |
|---|
A Class Shares | $73 | 1.45% |
|---|
|
| Expenses Paid, Amount |
$ 73
|
| Expense Ratio, Percent |
1.45%
|
| Factors Affecting Performance [Text Block] |
How did the Fund perform during the reporting period? The Westwood Broadmark Tactical Plus Fund underperformed its representative benchmark, the HFRX Equity Hedge Index, in the reporting period. Equity markets experienced increased volatility from geopolitical risks and equity-market shocks, while earnings strength among artificial intelligence-linked mega-cap technology firms remained a key area of support for equities, especially in the U.S. market. An increase in market breadth that began in late 2025 continued throughout early 2026, as value stocks, small caps and non-U.S. equities experienced periodic leadership as investors sought broader participation and downside resilience. Through January 2026, exposure to the market was increased as the Investment team added positions in response to improving relative strength. Exposure was reduced as monetary policy, momentum and market breadth deteriorated in the middle of the period. The team increased exposure in April as momentum, market breadth, sentiment and volume showed improvement. Relative to the Tactical Growth Fund, the Tactical Plus Fund maintained higher exposure to the market throughout the period. With regard to our four-pillar investment process, for much of the period, the valuation pillar pointed to equity valuations being elevated compared to historical norms, as stock market capitalization as a percentage of gross domestic product reached new all-time highs. Monetary factors and credit conditions remained positive before turning neutral to end the period as conflict in the Middle East sent commodity prices upward. The investor sentiment pillar was negative for most of the period, turning positive during March from our contrarian point of view. The momentum pillar was more dynamic, remaining positive but deteriorating until March, when it turned negative, and rebounding to positive territory in April. The team would increase exposure if interest rates declined and if momentum improved further. The team would decrease exposure if our breadth and volume momentum models deteriorated. |
| Line Graph [Table Text Block] |
Table Summary | Westwood Broadmark Tactical Plus Fund - A Class Shares | HFRX Equity Hedge Index | S&P 500® Index |
|---|
Apr-2016 | $9,447 | $10,000 | $10,000 |
|---|
Apr-2017 | $10,257 | $10,664 | $11,792 |
|---|
Apr-2018 | $10,992 | $11,408 | $13,356 |
|---|
Apr-2019 | $11,879 | $10,956 | $15,158 |
|---|
Apr-2020 | $11,952 | $10,298 | $15,289 |
|---|
Apr-2021 | $13,466 | $12,575 | $22,320 |
|---|
Apr-2022 | $13,455 | $13,066 | $22,367 |
|---|
Apr-2023 | $13,406 | $13,095 | $22,963 |
|---|
Apr-2024 | $13,988 | $14,159 | $28,167 |
|---|
Apr-2025 | $13,552 | $14,916 | $31,574 |
|---|
Apr-2026 | $14,325 | $17,015 | $41,379 |
|---|
|
| Average Annual Return [Table Text Block] |
Table Summary | 1 Year | 5 Years | 10 Years |
|---|
Westwood Broadmark Tactical Plus Fund - A Class Shares | | | |
|---|
Without Load | 5.70% | 1.24% | 4.25% |
|---|
With Load* | 2.52% | 0.11% | 3.66% |
|---|
HFRX Equity Hedge Index | 14.07% | 6.24% | 5.46% |
|---|
S&P 500® Index | 31.05% | 13.14% | 15.26% |
|---|
|
| AssetsNet |
$ 64,382,681
|
| Holdings Count | Holding |
7
|
| Advisory Fees Paid, Amount |
$ 249,378
|
| InvestmentCompanyPortfolioTurnover |
23.00%
|
| Additional Fund Statistics [Text Block] |
- Net Assets$64,382,681
- Number of Portfolio Holdings7
- Advisory Fee (net of waivers)$249,378
- Portfolio Turnover23%
|
| Holdings [Text Block] |
Asset Weighting (% of total investments)Table SummaryValue | Value |
|---|
Exchange-Traded Funds | 28.3% | Money Market Funds | 71.7% | |
| Material Fund Change [Text Block] |
No material changes occurred during the period ended April 30, 2026. |
| Updated Prospectus Phone Number |
(877) 386-3944
|
| Updated Prospectus Web Address |
https://westwoodgroup.com/product/tactical-plus-fund/
|
| C000237955 |
|
| Shareholder Report [Line Items] |
|
| Fund Name |
Westwood Broadmark Tactical Plus Fund
|
| Class Name |
F Class Shares
|
| Trading Symbol |
BTPIX
|
| Annual or Semi-Annual Statement [Text Block] |
This semi-annual shareholder report contains important information about Westwood Broadmark Tactical Plus Fund (the "Fund") for the period of November 1, 2025 to April 30, 2026.
|
| Additional Information [Text Block] |
You can find additional information about the Fund at https://westwoodgroup.com/product/tactical-plus-fund/. You can also request this information by contacting us at (877) 386-3944.
|
| Additional Information Phone Number |
(877) 386-3944
|
| Additional Information Website |
<span style="font-weight: 700; box-sizing: border-box; color: rgb(99, 102, 106); display: inline; flex-wrap: nowrap; font-size: 10.6667px; grid-area: auto; line-height: 12.8px; margin: 0px; overflow: visible; text-align: left; text-align-last: left; white-space-collapse: preserve-breaks;">https://westwoodgroup.com/product/tactical-plus-fund/</span>
|
| Expenses [Text Block] |
What were the Fund’s annualized costs for the last six months?(based on a hypothetical $10,000 investment) Table SummaryClass Name | Costs of a $10,000 investment | Costs paid as a percentage of a $10,000 investment |
|---|
F Class Shares | $45 | 0.89% |
|---|
|
| Expenses Paid, Amount |
$ 45
|
| Expense Ratio, Percent |
0.89%
|
| Factors Affecting Performance [Text Block] |
How did the Fund perform during the reporting period? The Westwood Broadmark Tactical Plus Fund underperformed its representative benchmark, the HFRX Equity Hedge Index, in the reporting period. Equity markets experienced increased volatility from geopolitical risks and equity-market shocks, while earnings strength among artificial intelligence-linked mega-cap technology firms remained a key area of support for equities, especially in the U.S. market. An increase in market breadth that began in late 2025 continued throughout early 2026, as value stocks, small caps and non-U.S. equities experienced periodic leadership as investors sought broader participation and downside resilience. Through January 2026, exposure to the market was increased as the Investment team added positions in response to improving relative strength. Exposure was reduced as monetary policy, momentum and market breadth deteriorated in the middle of the period. The team increased exposure in April as momentum, market breadth, sentiment and volume showed improvement. Relative to the Tactical Growth Fund, the Tactical Plus Fund maintained higher exposure to the market throughout the period. With regard to our four-pillar investment process, for much of the period, the valuation pillar pointed to equity valuations being elevated compared to historical norms, as stock market capitalization as a percentage of gross domestic product reached new all-time highs. Monetary factors and credit conditions remained positive before turning neutral to end the period as conflict in the Middle East sent commodity prices upward. The investor sentiment pillar was negative for most of the period, turning positive during March from our contrarian point of view. The momentum pillar was more dynamic, remaining positive but deteriorating until March, when it turned negative, and rebounding to positive territory in April. The team would increase exposure if interest rates declined and if momentum improved further. The team would decrease exposure if our breadth and volume momentum models deteriorated. |
| Line Graph [Table Text Block] |
Table Summary | Westwood Broadmark Tactical Plus Fund - F Class Shares | HFRX Equity Hedge Index | S&P 500® Index |
|---|
Apr-2016 | $10,000 | $10,000 | $10,000 |
|---|
Apr-2017 | $10,907 | $10,664 | $11,792 |
|---|
Apr-2018 | $11,756 | $11,408 | $13,356 |
|---|
Apr-2019 | $12,776 | $10,956 | $15,158 |
|---|
Apr-2020 | $12,910 | $10,298 | $15,289 |
|---|
Apr-2021 | $14,641 | $12,575 | $22,320 |
|---|
Apr-2022 | $14,713 | $13,066 | $22,367 |
|---|
Apr-2023 | $14,730 | $13,095 | $22,963 |
|---|
Apr-2024 | $15,464 | $14,159 | $28,167 |
|---|
Apr-2025 | $15,065 | $14,916 | $31,574 |
|---|
Apr-2026 | $16,000 | $17,015 | $41,379 |
|---|
|
| Average Annual Return [Table Text Block] |
Table Summary | 1 Year | 5 Years | 10 Years |
|---|
Westwood Broadmark Tactical Plus Fund - F Class Shares | 6.21% | 1.79% | 4.81% |
|---|
HFRX Equity Hedge Index | 14.07% | 6.24% | 5.46% |
|---|
S&P 500® Index | 31.05% | 13.14% | 15.26% |
|---|
|
| AssetsNet |
$ 64,382,681
|
| Holdings Count | Holding |
7
|
| Advisory Fees Paid, Amount |
$ 249,378
|
| InvestmentCompanyPortfolioTurnover |
23.00%
|
| Additional Fund Statistics [Text Block] |
- Net Assets$64,382,681
- Number of Portfolio Holdings7
- Advisory Fee (net of waivers)$249,378
- Portfolio Turnover23%
|
| Holdings [Text Block] |
Asset Weighting (% of total investments)Table SummaryValue | Value |
|---|
Exchange-Traded Funds | 28.3% | Money Market Funds | 71.7% | |
| Material Fund Change [Text Block] |
No material changes occurred during the period ended April 30, 2026. |
| C000248453 |
|
| Shareholder Report [Line Items] |
|
| Fund Name |
Westwood Salient Enhanced Midstream Income ETF
|
| Trading Symbol |
MDST
|
| Security Exchange Name |
NYSE
|
| Annual or Semi-Annual Statement [Text Block] |
This semi-annual shareholder report contains important information about Westwood Salient Enhanced Midstream Income ETF (the "Fund") for the period of November 1, 2025 to April 30, 2026.
|
| Additional Information [Text Block] |
You can find additional information about the Fund at https://westwoodgroup.com/product/westwood-salient-enhanced-midstream-income/. You can also request this information by contacting us at (800) 994-0755.
|
| Additional Information Phone Number |
(800) 994-0755
|
| Additional Information Website |
<span style="font-weight: 700; box-sizing: border-box; color: rgb(99, 102, 106); display: inline; flex-wrap: nowrap; font-size: 10.6667px; grid-area: auto; line-height: 12.8px; margin: 0px; overflow: visible; text-align: left; text-align-last: left; white-space-collapse: preserve-breaks;">https://westwoodgroup.com/product/westwood-salient-enhanced-midstream-income/</span>
|
| Expenses [Text Block] |
What were the Fund’s annualized costs for the last six months?(based on a hypothetical $10,000 investment) Table SummaryFund Name | Costs of a $10,000 investment | Costs paid as a percentage of a $10,000 investment |
|---|
Westwood Salient Enhanced Midstream Income ETF | $44 | 0.80% |
|---|
|
| Expenses Paid, Amount |
$ 44
|
| Expense Ratio, Percent |
0.80%
|
| Factors Affecting Performance [Text Block] |
How did the Fund perform during the reporting period? During the trailing period, the Westwood Salient Enhanced Midstream Income ETF underperformed its representative benchmark, despite delivering a strong absolute return. The midstream energy sector provided strong performance in the trailing period, as oil and gas volatility increased due to geopolitical shocks in Venezuela and Iran, sending crude oil prices over $100. In this environment, midstream performance was anchored by long-term, fee-based contracts that insulated cash flows. Rising U.S. LNG exports and continued AI/data-center electricity demand increased volumes across pipeline, gathering, processing and storage assets. Volumes remained resilient throughout geopolitically induced volatility in oil markets, as production declines were modest and pipelines remained highly contracted. Capital discipline, ongoing debt reduction and continued commitment to dividend growth and buybacks remained defining themes across the industry, helping to anchor investor confidence amid broader energy market fluctuations. The Fund’s underperformance relative to the benchmark was primarily driven by the impact of the covered call overlay, which, by design, limits participation in sharp, short-term rallies in exchange for consistent premium income. On a subsector basis, an underweight allocation to the strong performing LNG subsector led to it being the largest detractor from relative performance for the period, while an overweight allocation to the Gathering & Processing subsector mitigated a portion of the subsector’s relative underperformance stemming from selection. |
| Line Graph [Table Text Block] |
Table Summary | Westwood Salient Enhanced Midstream Income ETF - NAV | S&P 500® Index | Alerian Midstream Energy Select Index |
|---|
04/08/24 | $10,000 | $10,000 | $10,000 |
|---|
04/30/24 | $9,837 | $9,685 | $9,904 |
|---|
04/30/25 | $11,551 | $10,857 | $12,813 |
|---|
04/30/26 | $14,482 | $14,228 | $17,125 |
|---|
|
| Average Annual Return [Table Text Block] |
Table Summary | 1 Year | Since Inception (April 8, 2024) |
|---|
Westwood Salient Enhanced Midstream Income ETF - NAV
| 25.37% | 19.69% |
|---|
S&P 500® Index | 31.05% | 18.67% |
|---|
Alerian Midstream Energy Select Index
| 33.65% | 29.84% |
|---|
|
| Performance Inception Date |
Apr. 08, 2024
|
| AssetsNet |
$ 247,229,761
|
| Holdings Count | Holding |
119
|
| Advisory Fees Paid, Amount |
$ 765,690
|
| InvestmentCompanyPortfolioTurnover |
7.00%
|
| Additional Fund Statistics [Text Block] |
- Net Assets$247,229,761
- Number of Portfolio Holdings119
- Advisory Fee $765,690
- Portfolio Turnover7%
|
| Holdings [Text Block] |
Sector Weighting (% of net assets)Table SummaryValue | Value |
|---|
Liabilities in Excess of Other Assets | -1.3% | Pipelines | 101.3% | |
| Largest Holdings [Text Block] |
Top 10 Holdings (% of net assets)Table SummaryHolding Name | % of Net Assets |
|---|
Energy Transfer, L.P. | 9.1% |
|---|
Enbridge, Inc. | 8.9% |
|---|
Williams Companies, Inc. (The) | 8.7% |
|---|
Enterprise Products Partners, L.P. | 7.0% |
|---|
DT Midstream, Inc. | 6.5% |
|---|
Kinder Morgan, Inc. | 5.7% |
|---|
Cheniere Energy, Inc. | 5.1% |
|---|
ONEOK, Inc. | 5.1% |
|---|
South Bow Corporation | 5.0% |
|---|
TC Energy Corporation | 5.0% |
|---|
|
| Material Fund Change [Text Block] |
No material changes occurred during the period ended April 30, 2026. |
| C000248452 |
|
| Shareholder Report [Line Items] |
|
| Fund Name |
Westwood Salient Enhanced Energy Income ETF
|
| Trading Symbol |
WEEI
|
| Security Exchange Name |
NASDAQ
|
| Annual or Semi-Annual Statement [Text Block] |
This semi-annual shareholder report contains important information about Westwood Salient Enhanced Energy Income ETF (the "Fund") for the period of November 1, 2025 to April 30, 2026.
|
| Additional Information [Text Block] |
You can find additional information about the Fund at https://westwoodgroup.com/product/salient-enhanced-energy-income/. You can also request this information by contacting us at (800) 994-0755.
|
| Additional Information Phone Number |
(800) 994-0755
|
| Additional Information Website |
<span style="font-weight: 700; box-sizing: border-box; color: rgb(99, 102, 106); display: inline; flex-wrap: nowrap; font-size: 10.6667px; grid-area: auto; line-height: 12.8px; margin: 0px; overflow: visible; text-align: left; text-align-last: left; white-space-collapse: preserve-breaks;">https://westwoodgroup.com/product/salient-enhanced-energy-income/</span>
|
| Expenses [Text Block] |
What were the Fund’s annualized costs for the last six months?(based on a hypothetical $10,000 investment) Table SummaryFund Name | Costs of a $10,000 investment | Costs paid as a percentage of a
$10,000 investment |
|---|
Westwood Salient Enhanced Energy Income ETF | $47 | 0.85% |
|---|
|
| Expenses Paid, Amount |
$ 47
|
| Expense Ratio, Percent |
0.85%
|
| Factors Affecting Performance [Text Block] |
How did the Fund perform during the reporting period? For the trailing period, the Westwood Salient Enhanced Energy Income ETF underperformed its representative benchmark, despite delivering a strong absolute return. Performance in the broader energy sector closely tracked oil price movements, which were volatile but largely range-bound through late 2025 as markets repeatedly priced in surplus conditions and global supply growth capped sustained upside for crude prices and upstream equities entering 2026. Geopolitical risk escalated meaningfully in early 2026, including tensions involving Iran, Venezuela and Middle Eastern shipping routes. These developments introduced short-term risk premiums into oil prices, with energy equities experiencing sharp but uneven rallies. Energy equities also served as a macro hedge amid inflation uncertainty and geopolitical instability, attracting tactical flows during periods of broader market stress. The Fund’s underperformance relative to its benchmark was primarily driven by the covered call overlay, which, by design, limits participation in sharp, short-term rallies in exchange for consistent premium income. The Fund’s common equity holdings outperformed the benchmark on a relative basis, primarily driven by selection in the E&P subsector. An overweight allocation to the Gathering & Processing and Refining subsectors, both of which provided strong absolute returns for the period, also mitigated a portion of the underperformance from the covered call overlay. |
| Line Graph [Table Text Block] |
Table Summary | Westwood Salient Enhanced Energy Income ETF - NAV | S&P 500® Index | S&P Energy Select Sector Index |
|---|
04/30/24 | $10,000 | $10,000 | $10,000 |
|---|
04/30/25 | $9,091 | $11,210 | $8,897 |
|---|
04/30/26 | $12,637 | $14,691 | $13,613 |
|---|
|
| Average Annual Return [Table Text Block] |
Table Summary | 1 Year | Since Inception (April 30, 2024) |
|---|
Westwood Salient Enhanced Energy Income ETF - NAV
| 39.01% | 12.41% |
|---|
S&P 500® Index | 31.05% | 21.20% |
|---|
S&P Energy Select Sector Index
| 53.01% | 16.68% |
|---|
|
| Performance Inception Date |
Apr. 30, 2024
|
| AssetsNet |
$ 73,255,243
|
| Holdings Count | Holding |
156
|
| Advisory Fees Paid, Amount |
$ 184,602
|
| InvestmentCompanyPortfolioTurnover |
3.00%
|
| Additional Fund Statistics [Text Block] |
- Net Assets$73,255,243
- Number of Portfolio Holdings156
- Advisory Fee $184,602
- Portfolio Turnover3%
|
| Holdings [Text Block] |
Sector Weighting (% of net assets)Table SummaryValue | Value |
|---|
Liabilities in Excess of Other Assets | -1.3% | U.S. Oil Royalty Trusts | 1.4% | Oilfield Services & Equipment | 11.9% | Refining & Marketing | 12.7% | Pipelines | 15.9% | Exploration & Production | 22.0% | Integrated Oil Companies | 37.4% | |
| Largest Holdings [Text Block] |
Top 10 Holdings (% of net assets)Table SummaryHolding Name | % of Net Assets |
|---|
Exxon Mobil Corporation | 23.6% |
|---|
Chevron Corporation | 13.8% |
|---|
ConocoPhillips | 6.3% |
|---|
Valero Energy Corporation | 5.4% |
|---|
SLB Ltd. | 5.2% |
|---|
Williams Companies, Inc. (The) | 5.1% |
|---|
Baker Hughes Company | 4.2% |
|---|
Phillips 66 | 4.0% |
|---|
EOG Resources, Inc. | 3.9% |
|---|
Kinder Morgan, Inc. | 3.8% |
|---|
|
| Material Fund Change [Text Block] |
No material changes occurred during the period ended April 30, 2026. |
| C000267227 |
|
| Shareholder Report [Line Items] |
|
| Fund Name |
Westwood Enhanced Income Opportunity ETF
|
| Trading Symbol |
YLDW
|
| Security Exchange Name |
NASDAQ
|
| Annual or Semi-Annual Statement [Text Block] |
This semi-annual shareholder report contains important information about Westwood Enhanced Income Opportunity ETF (the "Fund") for the period of December 11, 2025 to April 30, 2026.
|
| Additional Information [Text Block] |
You can find additional information about the Fund at https://westwoodgroup.com/product/enhanced-income/. You can also request this information by contacting us at (800) 994-0755.
|
| Additional Information Phone Number |
(800) 994-0755
|
| Additional Information Website |
<span style="font-weight: 700; box-sizing: border-box; color: rgb(99, 102, 106); display: inline; flex-wrap: nowrap; font-size: 10.6667px; grid-area: auto; line-height: 12.8px; margin: 0px; overflow: visible; text-align: left; text-align-last: left; white-space-collapse: preserve-breaks;">https://westwoodgroup.com/product/enhanced-income/</span>
|
| Expenses [Text Block] |
What were the Fund’s annualized costs for the reporting period?(based on a hypothetical $10,000 investment) Table SummaryFund Name | Costs of a $10,000 investment | Costs paid as a percentage of a $10,000 investment |
|---|
Westwood Enhanced Income Opportunity ETF | $31 | 0.79% |
|---|
|
| Expenses Paid, Amount |
$ 31
|
| Expense Ratio, Percent |
0.79%
|
| Factors Affecting Performance [Text Block] |
How did the Fund perform during the reporting period? For the trailing period, the Westwood Salient Enhanced Energy Income ETF underperformed its representative benchmark, despite delivering a strong absolute return. Performance in the broader energy sector closely tracked oil price movements, which were volatile but largely range-bound through late 2025 as markets repeatedly priced in surplus conditions and global supply growth capped sustained upside for crude prices and upstream equities entering 2026. Geopolitical risk escalated meaningfully in early 2026, including tensions involving Iran, Venezuela and Middle Eastern shipping routes. These developments introduced short-term risk premiums into oil prices, with energy equities experiencing sharp but uneven rallies. Energy equities also served as a macro hedge amid inflation uncertainty and geopolitical instability, attracting tactical flows during periods of broader market stress. The Fund’s underperformance relative to its benchmark was primarily driven by the covered call overlay, which, by design, limits participation in sharp, short-term rallies in exchange for consistent premium income. The Fund’s common equity holdings outperformed the benchmark on a relative basis, primarily driven by selection in the E&P subsector. An overweight allocation to the Gathering & Processing and Refining subsectors, both of which provided strong absolute returns for the period, also mitigated a portion of the underperformance from the covered call overlay. |
| Performance Inception Date |
Dec. 11, 2025
|
| AssetsNet |
$ 22,751,931
|
| Holdings Count | Holding |
139
|
| Advisory Fees Paid, Amount |
$ 43,251
|
| InvestmentCompanyPortfolioTurnover |
15.00%
|
| Additional Fund Statistics [Text Block] |
- Net Assets$22,751,931
- Number of Portfolio Holdings139
- Advisory Fee $43,251
- Portfolio Turnover15%
|
| Holdings [Text Block] |
Sector Weighting (% of net assets)Table SummaryValue | Value |
|---|
Liabilities in Excess of Other Assets | -0.4% | Materials | 1.6% | Consumer Discretionary | 3.2% | Consumer Staples | 3.9% | Utilities | 4.5% | Communications | 4.7% | Real Estate | 4.7% | Health Care | 7.1% | Industrials | 7.5% | Energy | 8.2% | Exchange-Traded Funds | 8.8% | U.S. Government & Agencies | 9.3% | Financials | 16.8% | Technology | 20.1% | |
| Largest Holdings [Text Block] |
Top 10 Holdings (% of net assets)Table SummaryHolding Name | % of Net Assets |
|---|
iShares iBoxx USD High Yield Corporate Bond ETF | 4.4% |
|---|
iShares Broad USD High Yield Corporate Bond ETF | 4.4% |
|---|
Alphabet, Inc. - Class A | 3.1% |
|---|
Gilead Sciences,
Inc. | 2.5% |
|---|
NVIDIA Corporation | 2.1% |
|---|
Microsoft Corporation | 2.0% |
|---|
Broadcom, Inc. | 1.9% |
|---|
Oracle Corporation | 1.9% |
|---|
Wells Fargo & Company | 1.9% |
|---|
JPMorgan Chase & Company | 1.9% |
|---|
|
| Material Fund Change [Text Block] |
No material changes occurred during the period ended April 30, 2026. |