What were the Fund costs for the period?
(based on a hypothetical $10,000 investment)
| Fund Name | Costs of a $10,000 investment | Costs paid as a percentage of a $10,000 investment |
| Hedgeye Capital Allocation ETF | $34 | 0.70%¹ |
¹ Annualized.
Key Fund Statistics
(as of April 30, 2026)
| Fund Net Assets | $378,195,704 |
| Number of Holdings | 24 |
| Total Net Advisory Fee | $811,773 |
| Portfolio Turnover Rate | 1241.66% |
What did the Fund invest in?
(% of Net Assets as of April 30, 2026)
Sector Breakdown
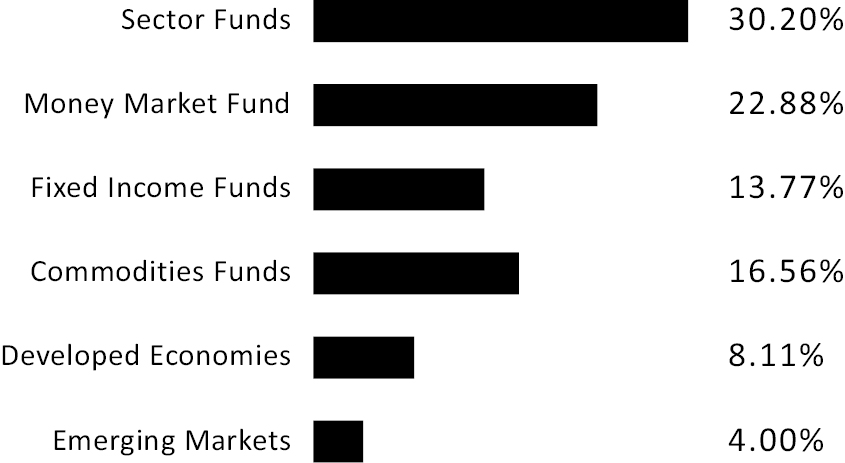
Top Ten Holdings
| First American Money Market Funds | 22.88% |
| Vanguard High Dividend Yield ETF | 5.70% |
| Vanguard Short-Term Inflation-Protected Securities Index Fund | 5.59% |
| Global X US Infrastructure Dev. ETF | 5.32% |
| United States Brent Oil Fund LP | 5.02% |
| AAA CLO ETF | 4.99% |
| Harbor Commodity All Weather Strategy ETF | 4.60% |
| VanEck Oil Services ETF | 4.20% |
| Energy Select Sector SPDR Fund | 4.06% |
| iShares U.S. Healthcare Providers ETF | 4.02% |
Top Ten Holdings
| First American Money Market Funds | 22.88% |
| Vanguard High Dividend Yield ETF | 5.70% |
| Vanguard Short-Term Inflation-Protected Securities Index Fund | 5.59% |
| Global X US Infrastructure Dev. ETF | 5.32% |
| United States Brent Oil Fund LP | 5.02% |
| AAA CLO ETF | 4.99% |
| Harbor Commodity All Weather Strategy ETF | 4.60% |
| VanEck Oil Services ETF | 4.20% |
| Energy Select Sector SPDR Fund | 4.06% |
| iShares U.S. Healthcare Providers ETF | 4.02% |
What were the Fund costs for the period?
(based on a hypothetical $10,000 investment)
| Fund Name | Costs of a $10,000 investment | Costs paid as a percentage of a $10,000 investment |
| Hedgeye Quality Growth ETF | $36 | 0.70%¹ |
¹ Annualized.
Key Fund Statistics
(as of April 30, 2026)
| Fund Net Assets | $97,302,307 |
| Number of Holdings | 52 |
| Total Net Advisory Fee | $249,605 |
| Portfolio Turnover Rate | 277.94% |
What did the Fund invest in?
(% of Net Assets as of April 30, 2026)
Sector Breakdown
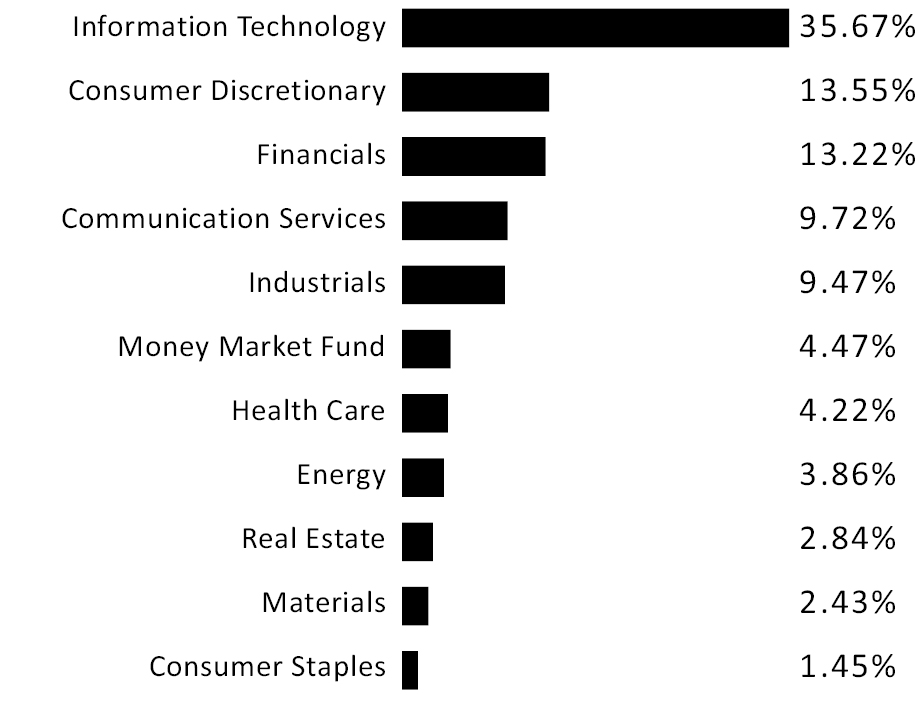
Top Ten Holdings
| Nvidia Corp. | 8.50% |
| Alphabet, Inc. Class A | 8.35% |
| Apple, Inc. | 7.62% |
| Amazon.com, Inc. | 5.69% |
| First American Money Market Funds | 4.47% |
| Broadcom, Inc. | 3.98% |
| Analog Devices, Inc. | 2.87% |
| JPMorgan Chase & Co. | 2.48% |
| GE Vernova LLC | 2.18% |
| Goldman Sachs Group, Inc. | 2.11% |
Top Ten Holdings
| Nvidia Corp. | 8.50% |
| Alphabet, Inc. Class A | 8.35% |
| Apple, Inc. | 7.62% |
| Amazon.com, Inc. | 5.69% |
| First American Money Market Funds | 4.47% |
| Broadcom, Inc. | 3.98% |
| Analog Devices, Inc. | 2.87% |
| JPMorgan Chase & Co. | 2.48% |
| GE Vernova LLC | 2.18% |
| Goldman Sachs Group, Inc. | 2.11% |
What were the Fund costs for the period?
(based on a hypothetical $10,000 investment)
| Fund Name | Costs of a $10,000 investment | Costs paid as a percentage of a $10,000 investment |
| Hedgeye 130/30 Equity ETF | $26¹ | 0.70%2 |
¹ Costs are for the period of December 11, 2025 to April 30, 2026. Costs for a full semi-annual period would be higher.
² Annualized.
Key Fund Statistics
(as of April 30, 2026)
| Fund Net Assets | $24,873,072 |
| Number of Holdings | 77 |
| Total Net Advisory Fee | $75,359 |
| Portfolio Turnover Rate | 310.36% |
What did the Fund invest in?
(% of Net Assets as of April 30, 2026)
Portfolio Composition
| Common Stocks | 96.68% |
| Money Market | 2.60% |
| Total Return Swap Contracts | 0.15% |
| Exchange Traded Funds Sold Short | -0.96% |
| Common Stocks Sold Short | -19.01% |
Top Ten Holdings
| Apple, Inc. | 3.43% |
| Casey's General Stores, Inc. | 3.10% |
| Five Below, Inc. | 2.96% |
| Cisco Systems, Inc. | 2.89% |
| Air Products and Chemicals, Inc. | 2.89% |
| Clean Harbors, Inc. | 2.76% |
| First American Money Market Funds | 2.59% |
| Roku, Inc. | 2.52% |
| Darling Ingredients, Inc. | 2.50% |
| Marriott International Class A | 2.50% |
Top Ten Holdings
| Apple, Inc. | 3.43% |
| Casey's General Stores, Inc. | 3.10% |
| Five Below, Inc. | 2.96% |
| Cisco Systems, Inc. | 2.89% |
| Air Products and Chemicals, Inc. | 2.89% |
| Clean Harbors, Inc. | 2.76% |
| First American Money Market Funds | 2.59% |
| Roku, Inc. | 2.52% |
| Darling Ingredients, Inc. | 2.50% |
| Marriott International Class A | 2.50% |
What were the Fund costs for the period?
(based on a hypothetical $10,000 investment)
| Fund Name | Costs of a $10,000 investment | Costs paid as a percentage of a $10,000 investment |
| Hedgeye Fourth Turning ETF | $32¹ | 0.71%2,3 |
¹ Costs are for the period of November 21, 2025 to April 30, 2026. Costs for a full semi-annual period would be higher.
² Annualized.
3 Gross expenses, excluding tax expense, would have been 0.70% for the period ended April 30, 2026.
Key Fund Statistics
(as of April 30, 2026)
| Fund Net Assets | $105,574,426 |
| Number of Holdings | 62 |
| Total Net Advisory Fee | $145,510 |
| Portfolio Turnover Rate | 237.85% |
What did the Fund invest in?
(% of Net Assets as of April 30, 2026)
Portfolio Composition
| Exchange Traded Funds | 73.46% |
| Common Stocks | 22.01% |
| Money Market | 4.07% |
| Options Purchased | 0.09% |
| Common Stocks Sold Short | -3.77% |
| Exchange Traded Funds Sold Short | -10.90% |
Top Ten Holdings
| State Street SPDR Bloomberg Enhanced Roll Yield Commodity Strategy No K-1 ETF | 13.98% |
| Vanguard Total Stock Market ETF | 8.98% |
| Energy Select Sector SPDR Fund | 4.47% |
| VanEck Oil Services ETF | 4.44% |
| First American Money Market Funds | 4.07% |
| iShares Future AI & Tech ETF | 3.98% |
| SPDR Gold Shares | 3.97% |
| State Street SPDR S&P Global Infrastructure ETF | 3.01% |
| Vanguard FTSE Pacific ETF | 2.26% |
| Robo Global Robotics & Automation Index ETF | 2.00% |
Top Ten Holdings
| State Street SPDR Bloomberg Enhanced Roll Yield Commodity Strategy No K-1 ETF | 13.98% |
| Vanguard Total Stock Market ETF | 8.98% |
| Energy Select Sector SPDR Fund | 4.47% |
| VanEck Oil Services ETF | 4.44% |
| First American Money Market Funds | 4.07% |
| iShares Future AI & Tech ETF | 3.98% |
| SPDR Gold Shares | 3.97% |
| State Street SPDR S&P Global Infrastructure ETF | 3.01% |
| Vanguard FTSE Pacific ETF | 2.26% |
| Robo Global Robotics & Automation Index ETF | 2.00% |
| [1] | Annualized. |
| [2] | Annualized. |
| [3] | Costs are for the period of December 11, 2025 to April 30, 2026. Costs for a full semi-annual period would be higher. |
| [4] | Annualized. |
| [5] | Costs are for the period of November 21, 2025 to April 30, 2026. Costs for a full semi-annual period would be higher. |
| [6] | Gross expenses, excluding tax expense, would have been 0.70% for the period ended April 30, 2026. |
| [7] | Annualized. |