Shareholder Report
Apr. 30, 2026
USD ($)
Holding
What Were The Fund Costs For The Last Year ?
(Based on a hypothetical $10,000 investment)
| Fund (Class) | Costs of a $10,000 investment | Costs paid as a percentage of a $10,000 investment |
| Invesco Energy Fund (Class R6) |
$108 | 0.83% |
How Did The Fund Perform During The Period?
• During the fiscal year ended April 30, 2026, US equity markets experienced periods of volatility driven by geopolitical tensions, elevated energy prices and ongoing uncertainty around inflation and the policy outlook. Energy markets were particularly impacted by supply‑side dynamics, including OPEC+ production discipline and heightened risks around key global supply routes such as the Strait of Hormuz, a critical chokepoint for global oil flows. Concerns around potential disruptions through the Strait of Hormuz created supply‑chain bottlenecks and ripple effects across global energy markets, leading to higher oil prices and increased volatility. Despite these crosscurrents, markets proved resilient, with a sharp rebound in early 2026 and equities reaching new highs. While overall market strength was led by information technology (IT)– and artificial intelligence (AI)–related investments, oil and gas equities benefited from strong free cash flow generation, capital discipline and shareholder returns, supported by resilient global demand and constrained supply.
• For the fiscal year ended April 30, 2026, Class R6 shares of the Fund returned 60.77%. For the same time period, the MSCI World Energy Index (Net) (the “Benchmark”) returned 55.28%. The Fund outperformed the Benchmark due to being overweight in energy equipment and services and underweight in oil and gas drilling, while cash was the largest drag on returns.
What contributed to performance?
Overweight allocation to energy equipment and services | The largest relative contributor versus the Benchmark was the overweight allocation to energy equipment and services. Noble Corp. PLC, Tenaris S.A., Suncor Energy, Inc. and Albemarle Corp. were key relative contributors. Suncor Energy's performance was supported by firm commodity pricing, disciplined capital spending and improving free cash flow generation.
Underweight allocation to and stock selection in oil and gas storage and transportation | Relative contribution to returns came mostly from what was not owned in the Fund like Enbridge Inc., ONEOK, Inc. and The Williams Cos., Inc.
Absolute contributors | Exxon Mobil Corp., Suncor Energy, Inc. and Chevron Corp. were the top absolute contributors.
What detracted from performance?
Cash allocation | Although cash averaged less than 2% for the period, the allocation was the largest relative detractor, which is expected in a strong equity market.
Stock selection in oil and gas refining and marketing | Stock selection in oil and gas refining and marketing was a relative detractor. Some of the key relative detractors were holdings such as Expand Energy Corp. and Shell PLC, ADR. Also, names that were not owned like Valero Energy Corp., Cameco Corp., Eni US Inc. and Cenovus Energy Inc. hurt relative returns.
Absolute detractors | Atlas Energy Solutions Inc. and Expand Energy Corp. were the only absolute detractors from returns. We exited our position in Atlas Energy Solutions during the fiscal year.
How Has The Fund Historically Performed?
Growth of $10,000 Investment
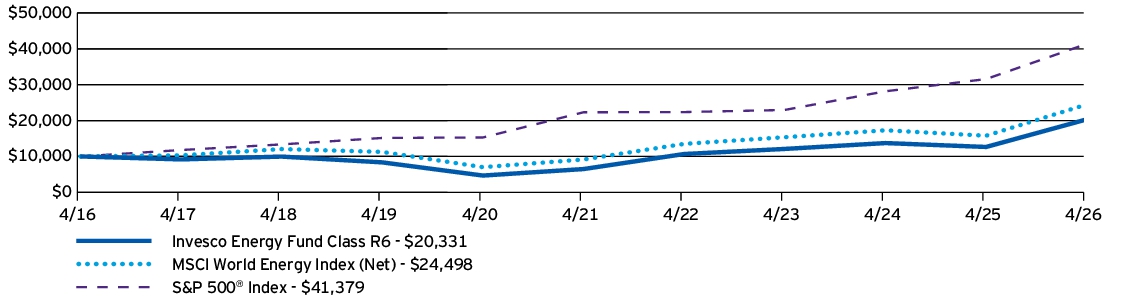
| AVERAGE ANNUAL TOTAL RETURNS | 1 Year | 5 Years | 10 Years |
| Invesco Energy Fund (Class R6) | 60.77% | 25.65% | 7.35% |
| MSCI World Energy Index (Net) | 55.28% | 21.76% | 9.37% |
| S&P 500® Index | 31.05% | 13.14% | 15.26% |
What Are Key Statistics About The Fund?
(as of April 30, 2026)
| Fund net assets | $614,890,276 |
| Total number of portfolio holdings | 30 |
| Total advisory fees paid | $3,357,998 |
| Portfolio turnover rate | 28% |
What Comprised The Fund's Holdings?
(as of April 30, 2026)
Top ten holdings*
(% of net assets)
(% of net assets)
| Exxon Mobil Corp. | 11.06% |
| Chevron Corp. | 6.97% |
| Shell PLC, ADR | 6.76% |
| Suncor Energy, Inc. | 6.58% |
| Devon Energy Corp. | 5.97% |
| Occidental Petroleum Corp. | 5.86% |
| ConocoPhillips | 5.08% |
| Canadian Natural Resources Ltd. | 4.90% |
| Tenaris S.A. | 4.85% |
| TotalEnergies SE | 4.31% |
| * Excluding money market fund holdings, if any. |
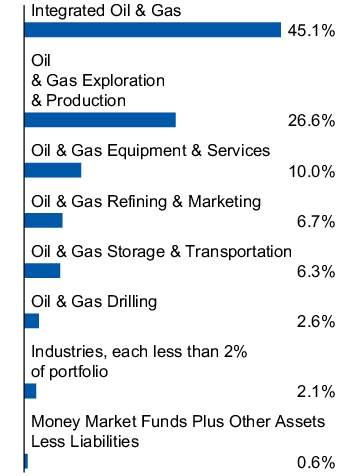
Industry allocation
(% of net assets)
(% of net assets)
Top ten holdings*
(% of net assets)
(% of net assets)
| Exxon Mobil Corp. | 11.06% |
| Chevron Corp. | 6.97% |
| Shell PLC, ADR | 6.76% |
| Suncor Energy, Inc. | 6.58% |
| Devon Energy Corp. | 5.97% |
| Occidental Petroleum Corp. | 5.86% |
| ConocoPhillips | 5.08% |
| Canadian Natural Resources Ltd. | 4.90% |
| Tenaris S.A. | 4.85% |
| TotalEnergies SE | 4.31% |
| * Excluding money market fund holdings, if any. |
What Were The Fund Costs For The Last Year ?
(Based on a hypothetical $10,000 investment)
| Fund (Class) | Costs of a $10,000 investment | Costs paid as a percentage of a $10,000 investment |
| Invesco Energy Fund (Class R5) |
$117 | 0.90% |
How Did The Fund Perform During The Period?
• During the fiscal year ended April 30, 2026, US equity markets experienced periods of volatility driven by geopolitical tensions, elevated energy prices and ongoing uncertainty around inflation and the policy outlook. Energy markets were particularly impacted by supply‑side dynamics, including OPEC+ production discipline and heightened risks around key global supply routes such as the Strait of Hormuz, a critical chokepoint for global oil flows. Concerns around potential disruptions through the Strait of Hormuz created supply‑chain bottlenecks and ripple effects across global energy markets, leading to higher oil prices and increased volatility. Despite these crosscurrents, markets proved resilient, with a sharp rebound in early 2026 and equities reaching new highs. While overall market strength was led by information technology (IT)– and artificial intelligence (AI)–related investments, oil and gas equities benefited from strong free cash flow generation, capital discipline and shareholder returns, supported by resilient global demand and constrained supply.
• For the fiscal year ended April 30, 2026, Class R5 shares of the Fund returned 60.62%. For the same time period, the MSCI World Energy Index (Net) (the “Benchmark”) returned 55.28%. The Fund outperformed the Benchmark due to being overweight in energy equipment and services and underweight in oil and gas drilling, while cash was the largest drag on returns.
What contributed to performance?
Overweight allocation to energy equipment and services | The largest relative contributor versus the Benchmark was the overweight allocation to energy equipment and services. Noble Corp. PLC, Tenaris S.A., Suncor Energy, Inc. and Albemarle Corp. were key relative contributors. Suncor Energy's performance was supported by firm commodity pricing, disciplined capital spending and improving free cash flow generation.
Underweight allocation to and stock selection in oil and gas storage and transportation | Relative contribution to returns came mostly from what was not owned in the Fund like Enbridge Inc., ONEOK, Inc. and The Williams Cos., Inc.
Absolute contributors | Exxon Mobil Corp., Suncor Energy, Inc. and Chevron Corp. were the top absolute contributors.
What detracted from performance?
Cash allocation | Although cash averaged less than 2% for the period, the allocation was the largest relative detractor, which is expected in a strong equity market.
Stock selection in oil and gas refining and marketing | Stock selection in oil and gas refining and marketing was a relative detractor. Some of the key relative detractors were holdings such as Expand Energy Corp. and Shell PLC, ADR. Also, names that were not owned like Valero Energy Corp., Cameco Corp., Eni US Inc. and Cenovus Energy Inc. hurt relative returns.
Absolute detractors | Atlas Energy Solutions Inc. and Expand Energy Corp. were the only absolute detractors from returns. We exited our position in Atlas Energy Solutions during the fiscal year.
How Has The Fund Historically Performed?
Growth of $10,000 Investment
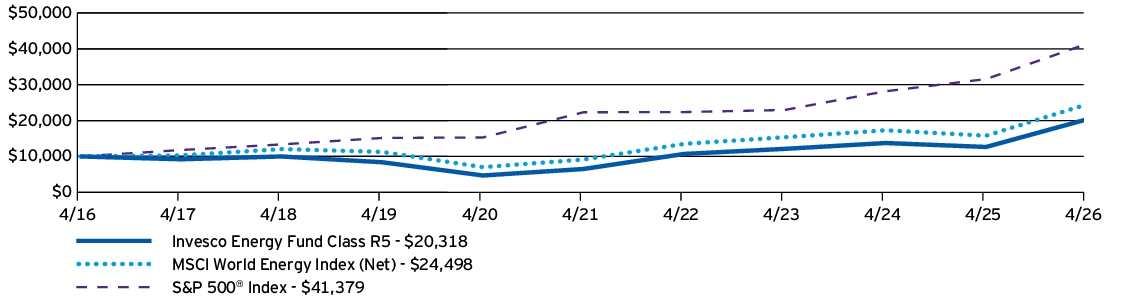
| AVERAGE ANNUAL TOTAL RETURNS | 1 Year | 5 Years | 10 Years |
| Invesco Energy Fund (Class R5) | 60.62% | 25.57% | 7.35% |
| MSCI World Energy Index (Net) | 55.28% | 21.76% | 9.37% |
| S&P 500® Index | 31.05% | 13.14% | 15.26% |
What Are Key Statistics About The Fund?
(as of April 30, 2026)
| Fund net assets | $614,890,276 |
| Total number of portfolio holdings | 30 |
| Total advisory fees paid | $3,357,998 |
| Portfolio turnover rate | 28% |
What Comprised The Fund's Holdings?
(as of April 30, 2026)
Top ten holdings*
(% of net assets)
(% of net assets)
| Exxon Mobil Corp. | 11.06% |
| Chevron Corp. | 6.97% |
| Shell PLC, ADR | 6.76% |
| Suncor Energy, Inc. | 6.58% |
| Devon Energy Corp. | 5.97% |
| Occidental Petroleum Corp. | 5.86% |
| ConocoPhillips | 5.08% |
| Canadian Natural Resources Ltd. | 4.90% |
| Tenaris S.A. | 4.85% |
| TotalEnergies SE | 4.31% |
| * Excluding money market fund holdings, if any. |
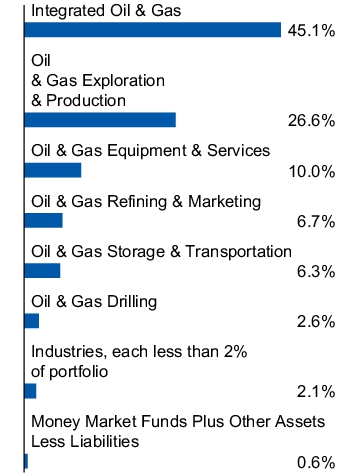
Industry allocation
(% of net assets)
(% of net assets)
Top ten holdings*
(% of net assets)
(% of net assets)
| Exxon Mobil Corp. | 11.06% |
| Chevron Corp. | 6.97% |
| Shell PLC, ADR | 6.76% |
| Suncor Energy, Inc. | 6.58% |
| Devon Energy Corp. | 5.97% |
| Occidental Petroleum Corp. | 5.86% |
| ConocoPhillips | 5.08% |
| Canadian Natural Resources Ltd. | 4.90% |
| Tenaris S.A. | 4.85% |
| TotalEnergies SE | 4.31% |
| * Excluding money market fund holdings, if any. |
What Were The Fund Costs For The Last Year ?
(Based on a hypothetical $10,000 investment)
| Fund (Class) | Costs of a $10,000 investment | Costs paid as a percentage of a $10,000 investment |
| Invesco Energy Fund (Investor Class) |
$159 | 1.22% |
How Did The Fund Perform During The Period?
• During the fiscal year ended April 30, 2026, US equity markets experienced periods of volatility driven by geopolitical tensions, elevated energy prices and ongoing uncertainty around inflation and the policy outlook. Energy markets were particularly impacted by supply‑side dynamics, including OPEC+ production discipline and heightened risks around key global supply routes such as the Strait of Hormuz, a critical chokepoint for global oil flows. Concerns around potential disruptions through the Strait of Hormuz created supply‑chain bottlenecks and ripple effects across global energy markets, leading to higher oil prices and increased volatility. Despite these crosscurrents, markets proved resilient, with a sharp rebound in early 2026 and equities reaching new highs. While overall market strength was led by information technology (IT)– and artificial intelligence (AI)–related investments, oil and gas equities benefited from strong free cash flow generation, capital discipline and shareholder returns, supported by resilient global demand and constrained supply.
• For the fiscal year ended April 30, 2026, Investor Class shares of the Fund returned 60.12%. For the same time period, the MSCI World Energy Index (Net) (the “Benchmark”) returned 55.28%. The Fund outperformed the Benchmark due to being overweight in energy equipment and services and underweight in oil and gas drilling, while cash was the largest drag on returns.
What contributed to performance?
Overweight allocation to energy equipment and services | The largest relative contributor versus the Benchmark was the overweight allocation to energy equipment and services. Noble Corp. PLC, Tenaris S.A., Suncor Energy, Inc. and Albemarle Corp. were key relative contributors. Suncor Energy's performance was supported by firm commodity pricing, disciplined capital spending and improving free cash flow generation.
Underweight allocation to and stock selection in oil and gas storage and transportation | Relative contribution to returns came mostly from what was not owned in the Fund like Enbridge Inc., ONEOK, Inc. and The Williams Cos., Inc.
Absolute contributors | Exxon Mobil Corp., Suncor Energy, Inc. and Chevron Corp. were the top absolute contributors.
What detracted from performance?
Cash allocation | Although cash averaged less than 2% for the period, the allocation was the largest relative detractor, which is expected in a strong equity market.
Stock selection in oil and gas refining and marketing | Stock selection in oil and gas refining and marketing was a relative detractor. Some of the key relative detractors were holdings such as Expand Energy Corp. and Shell PLC, ADR. Also, names that were not owned like Valero Energy Corp., Cameco Corp., Eni US Inc. and Cenovus Energy Inc. hurt relative returns.
Absolute detractors | Atlas Energy Solutions Inc. and Expand Energy Corp. were the only absolute detractors from returns. We exited our position in Atlas Energy Solutions during the fiscal year.
How Has The Fund Historically Performed?
Growth of $10,000 Investment
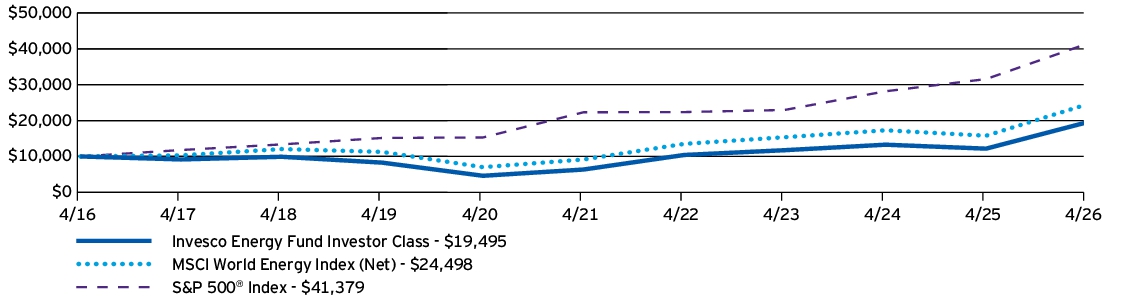
| AVERAGE ANNUAL TOTAL RETURNS | 1 Year | 5 Years | 10 Years |
| Invesco Energy Fund (Investor Class) | 60.12% | 25.12% | 6.90% |
| MSCI World Energy Index (Net) | 55.28% | 21.76% | 9.37% |
| S&P 500® Index | 31.05% | 13.14% | 15.26% |
Performance figures do not reflect deduction of taxes a shareholder would pay on Fund distributions or sale of Fund shares.
What Are Key Statistics About The Fund?
(as of April 30, 2026)
| Fund net assets | $614,890,276 |
| Total number of portfolio holdings | 30 |
| Total advisory fees paid | $3,357,998 |
| Portfolio turnover rate | 28% |
What Comprised The Fund's Holdings?
(as of April 30, 2026)
Top ten holdings*
(% of net assets)
(% of net assets)
| Exxon Mobil Corp. | 11.06% |
| Chevron Corp. | 6.97% |
| Shell PLC, ADR | 6.76% |
| Suncor Energy, Inc. | 6.58% |
| Devon Energy Corp. | 5.97% |
| Occidental Petroleum Corp. | 5.86% |
| ConocoPhillips | 5.08% |
| Canadian Natural Resources Ltd. | 4.90% |
| Tenaris S.A. | 4.85% |
| TotalEnergies SE | 4.31% |
| * Excluding money market fund holdings, if any. |
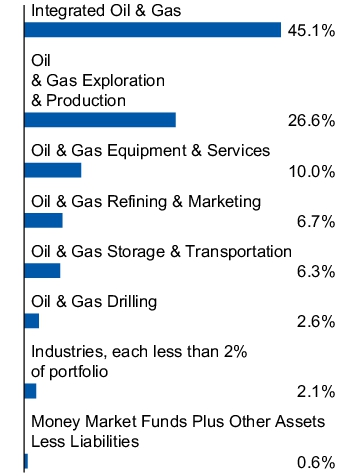
Industry allocation
(% of net assets)
(% of net assets)
Top ten holdings*
(% of net assets)
(% of net assets)
| Exxon Mobil Corp. | 11.06% |
| Chevron Corp. | 6.97% |
| Shell PLC, ADR | 6.76% |
| Suncor Energy, Inc. | 6.58% |
| Devon Energy Corp. | 5.97% |
| Occidental Petroleum Corp. | 5.86% |
| ConocoPhillips | 5.08% |
| Canadian Natural Resources Ltd. | 4.90% |
| Tenaris S.A. | 4.85% |
| TotalEnergies SE | 4.31% |
| * Excluding money market fund holdings, if any. |
What Were The Fund Costs For The Last Year ?
(Based on a hypothetical $10,000 investment)
| Fund (Class) | Costs of a $10,000 investment | Costs paid as a percentage of a $10,000 investment |
| Invesco Energy Fund (Class Y) |
$126 | 0.97% |
How Did The Fund Perform During The Period?
• During the fiscal year ended April 30, 2026, US equity markets experienced periods of volatility driven by geopolitical tensions, elevated energy prices and ongoing uncertainty around inflation and the policy outlook. Energy markets were particularly impacted by supply‑side dynamics, including OPEC+ production discipline and heightened risks around key global supply routes such as the Strait of Hormuz, a critical chokepoint for global oil flows. Concerns around potential disruptions through the Strait of Hormuz created supply‑chain bottlenecks and ripple effects across global energy markets, leading to higher oil prices and increased volatility. Despite these crosscurrents, markets proved resilient, with a sharp rebound in early 2026 and equities reaching new highs. While overall market strength was led by information technology (IT)– and artificial intelligence (AI)–related investments, oil and gas equities benefited from strong free cash flow generation, capital discipline and shareholder returns, supported by resilient global demand and constrained supply.
• For the fiscal year ended April 30, 2026, Class Y shares of the Fund returned 60.53%. For the same time period, the MSCI World Energy Index (Net) (the “Benchmark”) returned 55.28%. The Fund outperformed the Benchmark due to being overweight in energy equipment and services and underweight in oil and gas drilling, while cash was the largest drag on returns.
What contributed to performance?
Overweight allocation to energy equipment and services | The largest relative contributor versus the Benchmark was the overweight allocation to energy equipment and services. Noble Corp. PLC, Tenaris S.A., Suncor Energy, Inc. and Albemarle Corp. were key relative contributors. Suncor Energy's performance was supported by firm commodity pricing, disciplined capital spending and improving free cash flow generation.
Underweight allocation to and stock selection in oil and gas storage and transportation | Relative contribution to returns came mostly from what was not owned in the Fund like Enbridge Inc., ONEOK, Inc. and The Williams Cos., Inc.
Absolute contributors | Exxon Mobil Corp., Suncor Energy, Inc. and Chevron Corp. were the top absolute contributors.
What detracted from performance?
Cash allocation | Although cash averaged less than 2% for the period, the allocation was the largest relative detractor, which is expected in a strong equity market.
Stock selection in oil and gas refining and marketing | Stock selection in oil and gas refining and marketing was a relative detractor. Some of the key relative detractors were holdings such as Expand Energy Corp. and Shell PLC, ADR. Also, names that were not owned like Valero Energy Corp., Cameco Corp., Eni US Inc. and Cenovus Energy Inc. hurt relative returns.
Absolute detractors | Atlas Energy Solutions Inc. and Expand Energy Corp. were the only absolute detractors from returns. We exited our position in Atlas Energy Solutions during the fiscal year.
How Has The Fund Historically Performed?
Growth of $10,000 Investment
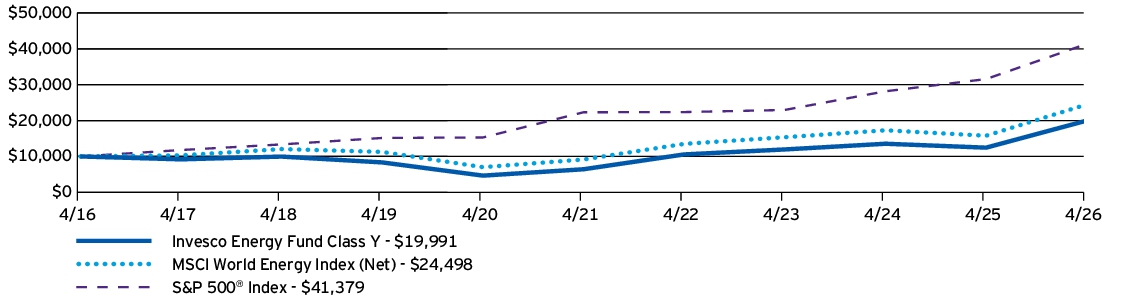
| AVERAGE ANNUAL TOTAL RETURNS | 1 Year | 5 Years | 10 Years |
| Invesco Energy Fund (Class Y) | 60.53% | 25.45% | 7.17% |
| MSCI World Energy Index (Net) | 55.28% | 21.76% | 9.37% |
| S&P 500® Index | 31.05% | 13.14% | 15.26% |
Performance figures do not reflect deduction of taxes a shareholder would pay on Fund distributions or sale of Fund shares.
What Are Key Statistics About The Fund?
(as of April 30, 2026)
| Fund net assets | $614,890,276 |
| Total number of portfolio holdings | 30 |
| Total advisory fees paid | $3,357,998 |
| Portfolio turnover rate | 28% |
What Comprised The Fund's Holdings?
(as of April 30, 2026)
Top ten holdings*
(% of net assets)
(% of net assets)
| Exxon Mobil Corp. | 11.06% |
| Chevron Corp. | 6.97% |
| Shell PLC, ADR | 6.76% |
| Suncor Energy, Inc. | 6.58% |
| Devon Energy Corp. | 5.97% |
| Occidental Petroleum Corp. | 5.86% |
| ConocoPhillips | 5.08% |
| Canadian Natural Resources Ltd. | 4.90% |
| Tenaris S.A. | 4.85% |
| TotalEnergies SE | 4.31% |
| * Excluding money market fund holdings, if any. |
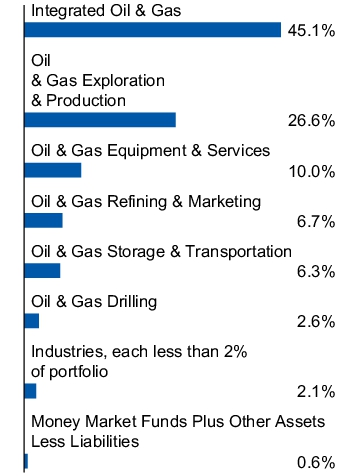
Industry allocation
(% of net assets)
(% of net assets)
Top ten holdings*
(% of net assets)
(% of net assets)
| Exxon Mobil Corp. | 11.06% |
| Chevron Corp. | 6.97% |
| Shell PLC, ADR | 6.76% |
| Suncor Energy, Inc. | 6.58% |
| Devon Energy Corp. | 5.97% |
| Occidental Petroleum Corp. | 5.86% |
| ConocoPhillips | 5.08% |
| Canadian Natural Resources Ltd. | 4.90% |
| Tenaris S.A. | 4.85% |
| TotalEnergies SE | 4.31% |
| * Excluding money market fund holdings, if any. |
What Were The Fund Costs For The Last Year ?
(Based on a hypothetical $10,000 investment)
| Fund (Class) | Costs of a $10,000 investment▼ | Costs paid as a percentage of a $10,000 investment* |
| Invesco Energy Fund (Class R) |
$175 | 1.47% |
|
▼
|
For the period September 30, 2025 (commencement of operations) to April 30, 2026. Expenses for a full reporting period would be higher.
|
| * |
Annualized.
|
How Did The Fund Perform During The Period?
• During the fiscal year ended April 30, 2026, US equity markets experienced periods of volatility driven by geopolitical tensions, elevated energy prices and ongoing uncertainty around inflation and the policy outlook. Energy markets were particularly impacted by supply‑side dynamics, including OPEC+ production discipline and heightened risks around key global supply routes such as the Strait of Hormuz, a critical chokepoint for global oil flows. Concerns around potential disruptions through the Strait of Hormuz created supply‑chain bottlenecks and ripple effects across global energy markets, leading to higher oil prices and increased volatility. Despite these crosscurrents, markets proved resilient, with a sharp rebound in early 2026 and equities reaching new highs. While overall market strength was led by information technology (IT)– and artificial intelligence (AI)–related investments, oil and gas equities benefited from strong free cash flow generation, capital discipline and shareholder returns, supported by resilient global demand and constrained supply.
• For the fiscal year ended April 30, 2026, Class R shares of the Fund returned 59.67%. For the same time period, the MSCI World Energy Index (Net) (the “Benchmark”) returned 55.28%. The Fund outperformed the Benchmark due to being overweight in energy equipment and services and underweight in oil and gas drilling, while cash was the largest drag on returns.
What contributed to performance?
Overweight allocation to energy equipment and services | The largest relative contributor versus the Benchmark was the overweight allocation to energy equipment and services. Noble Corp. PLC, Tenaris S.A., Suncor Energy, Inc. and Albemarle Corp. were key relative contributors. Suncor Energy's performance was supported by firm commodity pricing, disciplined capital spending and improving free cash flow generation.
Underweight allocation to and stock selection in oil and gas storage and transportation | Relative contribution to returns came mostly from what was not owned in the Fund like Enbridge Inc., ONEOK, Inc. and The Williams Cos., Inc.
Absolute contributors | Exxon Mobil Corp., Suncor Energy, Inc. and Chevron Corp. were the top absolute contributors.
What detracted from performance?
Cash allocation | Although cash averaged less than 2% for the period, the allocation was the largest relative detractor, which is expected in a strong equity market.
Stock selection in oil and gas refining and marketing | Stock selection in oil and gas refining and marketing was a relative detractor. Some of the key relative detractors were holdings such as Expand Energy Corp. and Shell PLC, ADR. Also, names that were not owned like Valero Energy Corp., Cameco Corp., Eni US Inc. and Cenovus Energy Inc. hurt relative returns.
Absolute detractors | Atlas Energy Solutions Inc. and Expand Energy Corp. were the only absolute detractors from returns. We exited our position in Atlas Energy Solutions during the fiscal year.
How Has The Fund Historically Performed?
Growth of $10,000 Investment
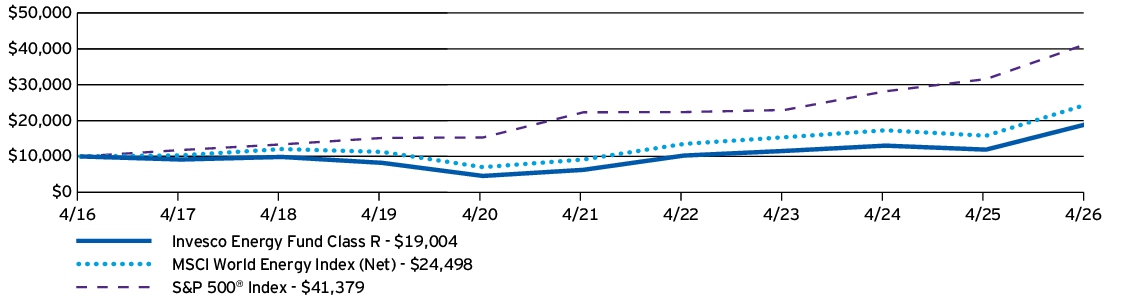
| AVERAGE ANNUAL TOTAL RETURNS | 1 Year | 5 Years | 10 Years |
| Invesco Energy Fund (Class R) | 59.67% | 24.82% | 6.63% |
| MSCI World Energy Index (Net) | 55.28% | 21.76% | 9.37% |
| S&P 500® Index | 31.05% | 13.14% | 15.26% |
Performance figures do not reflect deduction of taxes a shareholder would pay on Fund distributions or sale of Fund shares.
What Are Key Statistics About The Fund?
(as of April 30, 2026)
| Fund net assets | $614,890,276 |
| Total number of portfolio holdings | 30 |
| Total advisory fees paid | $3,357,998 |
| Portfolio turnover rate | 28% |
What Comprised The Fund's Holdings?
(as of April 30, 2026)
Top ten holdings*
(% of net assets)
(% of net assets)
| Exxon Mobil Corp. | 11.06% |
| Chevron Corp. | 6.97% |
| Shell PLC, ADR | 6.76% |
| Suncor Energy, Inc. | 6.58% |
| Devon Energy Corp. | 5.97% |
| Occidental Petroleum Corp. | 5.86% |
| ConocoPhillips | 5.08% |
| Canadian Natural Resources Ltd. | 4.90% |
| Tenaris S.A. | 4.85% |
| TotalEnergies SE | 4.31% |
| * Excluding money market fund holdings, if any. |
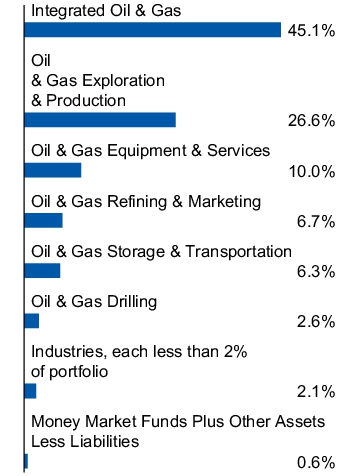
Industry allocation
(% of net assets)
(% of net assets)
Top ten holdings*
(% of net assets)
(% of net assets)
| Exxon Mobil Corp. | 11.06% |
| Chevron Corp. | 6.97% |
| Shell PLC, ADR | 6.76% |
| Suncor Energy, Inc. | 6.58% |
| Devon Energy Corp. | 5.97% |
| Occidental Petroleum Corp. | 5.86% |
| ConocoPhillips | 5.08% |
| Canadian Natural Resources Ltd. | 4.90% |
| Tenaris S.A. | 4.85% |
| TotalEnergies SE | 4.31% |
| * Excluding money market fund holdings, if any. |
What Were The Fund Costs For The Last Year ?
(Based on a hypothetical $10,000 investment)
| Fund (Class) | Costs of a $10,000 investment | Costs paid as a percentage of a $10,000 investment |
| Invesco Energy Fund (Class C) |
$255 | 1.97% |
How Did The Fund Perform During The Period?
• During the fiscal year ended April 30, 2026, US equity markets experienced periods of volatility driven by geopolitical tensions, elevated energy prices and ongoing uncertainty around inflation and the policy outlook. Energy markets were particularly impacted by supply‑side dynamics, including OPEC+ production discipline and heightened risks around key global supply routes such as the Strait of Hormuz, a critical chokepoint for global oil flows. Concerns around potential disruptions through the Strait of Hormuz created supply‑chain bottlenecks and ripple effects across global energy markets, leading to higher oil prices and increased volatility. Despite these crosscurrents, markets proved resilient, with a sharp rebound in early 2026 and equities reaching new highs. While overall market strength was led by information technology (IT)– and artificial intelligence (AI)–related investments, oil and gas equities benefited from strong free cash flow generation, capital discipline and shareholder returns, supported by resilient global demand and constrained supply.
• For the fiscal year ended April 30, 2026, Class C shares of the Fund, excluding sales charge, returned 58.93%. For the same time period, the MSCI World Energy Index (Net) (the “Benchmark”) returned 55.28%. The Fund outperformed the Benchmark due to being overweight in energy equipment and services and underweight in oil and gas drilling, while cash was the largest drag on returns.
What contributed to performance?
Overweight allocation to energy equipment and services | The largest relative contributor versus the Benchmark was the overweight allocation to energy equipment and services. Noble Corp. PLC, Tenaris S.A., Suncor Energy, Inc. and Albemarle Corp. were key relative contributors. Suncor Energy's performance was supported by firm commodity pricing, disciplined capital spending and improving free cash flow generation.
Underweight allocation to and stock selection in oil and gas storage and transportation | Relative contribution to returns came mostly from what was not owned in the Fund like Enbridge Inc., ONEOK, Inc. and The Williams Cos., Inc.
Absolute contributors | Exxon Mobil Corp., Suncor Energy, Inc. and Chevron Corp. were the top absolute contributors.
What detracted from performance?
Cash allocation | Although cash averaged less than 2% for the period, the allocation was the largest relative detractor, which is expected in a strong equity market.
Stock selection in oil and gas refining and marketing | Stock selection in oil and gas refining and marketing was a relative detractor. Some of the key relative detractors were holdings such as Expand Energy Corp. and Shell PLC, ADR. Also, names that were not owned like Valero Energy Corp., Cameco Corp., Eni US Inc. and Cenovus Energy Inc. hurt relative returns.
Absolute detractors | Atlas Energy Solutions Inc. and Expand Energy Corp. were the only absolute detractors from returns. We exited our position in Atlas Energy Solutions during the fiscal year.
How Has The Fund Historically Performed?
Growth of $10,000 Investment
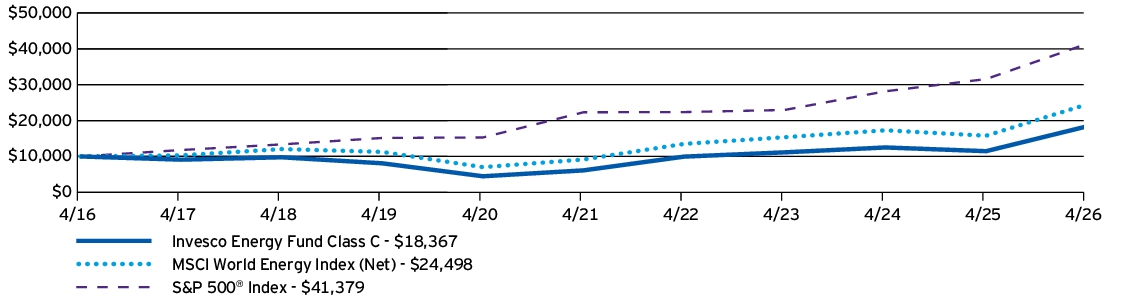
| AVERAGE ANNUAL TOTAL RETURNS | 1 Year | 5 Years | 10 Years |
| Invesco Energy Fund (Class C) —including sales charge | 57.93% | 24.20% | 6.27% |
| Invesco Energy Fund (Class C) —excluding sales charge | 58.93% | 24.20% | 6.27% |
| MSCI World Energy Index (Net) | 55.28% | 21.76% | 9.37% |
| S&P 500® Index | 31.05% | 13.14% | 15.26% |
Performance figures do not reflect deduction of taxes a shareholder would pay on Fund distributions or sale of Fund shares.
What Are Key Statistics About The Fund?
(as of April 30, 2026)
| Fund net assets | $614,890,276 |
| Total number of portfolio holdings | 30 |
| Total advisory fees paid | $3,357,998 |
| Portfolio turnover rate | 28% |
What Comprised The Fund's Holdings?
(as of April 30, 2026)
Top ten holdings*
(% of net assets)
(% of net assets)
| Exxon Mobil Corp. | 11.06% |
| Chevron Corp. | 6.97% |
| Shell PLC, ADR | 6.76% |
| Suncor Energy, Inc. | 6.58% |
| Devon Energy Corp. | 5.97% |
| Occidental Petroleum Corp. | 5.86% |
| ConocoPhillips | 5.08% |
| Canadian Natural Resources Ltd. | 4.90% |
| Tenaris S.A. | 4.85% |
| TotalEnergies SE | 4.31% |
| * Excluding money market fund holdings, if any. |
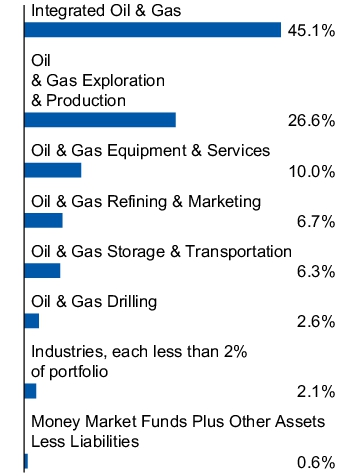
Industry allocation
(% of net assets)
(% of net assets)
Top ten holdings*
(% of net assets)
(% of net assets)
| Exxon Mobil Corp. | 11.06% |
| Chevron Corp. | 6.97% |
| Shell PLC, ADR | 6.76% |
| Suncor Energy, Inc. | 6.58% |
| Devon Energy Corp. | 5.97% |
| Occidental Petroleum Corp. | 5.86% |
| ConocoPhillips | 5.08% |
| Canadian Natural Resources Ltd. | 4.90% |
| Tenaris S.A. | 4.85% |
| TotalEnergies SE | 4.31% |
| * Excluding money market fund holdings, if any. |
What Were The Fund Costs For The Last Year ?
(Based on a hypothetical $10,000 investment)
| Fund (Class) | Costs of a $10,000 investment | Costs paid as a percentage of a $10,000 investment |
| Invesco Energy Fund (Class A) |
$159 | 1.22% |
How Did The Fund Perform During The Period?
• During the fiscal year ended April 30, 2026, US equity markets experienced periods of volatility driven by geopolitical tensions, elevated energy prices and ongoing uncertainty around inflation and the policy outlook. Energy markets were particularly impacted by supply‑side dynamics, including OPEC+ production discipline and heightened risks around key global supply routes such as the Strait of Hormuz, a critical chokepoint for global oil flows. Concerns around potential disruptions through the Strait of Hormuz created supply‑chain bottlenecks and ripple effects across global energy markets, leading to higher oil prices and increased volatility. Despite these crosscurrents, markets proved resilient, with a sharp rebound in early 2026 and equities reaching new highs. While overall market strength was led by information technology (IT)– and artificial intelligence (AI)–related investments, oil and gas equities benefited from strong free cash flow generation, capital discipline and shareholder returns, supported by resilient global demand and constrained supply.
• For the fiscal year ended April 30, 2026, Class A shares of the Fund, excluding sales charge, returned 60.13%. For the same time period, the MSCI World Energy Index (Net) (the “Benchmark”) returned 55.28%. The Fund outperformed the Benchmark due to being overweight in energy equipment and services and underweight in oil and gas drilling, while cash was the largest drag on returns.
What contributed to performance?
Overweight allocation to energy equipment and services | The largest relative contributor versus the Benchmark was the overweight allocation to energy equipment and services. Noble Corp. PLC, Tenaris S.A., Suncor Energy, Inc. and Albemarle Corp. were key relative contributors. Suncor Energy's performance was supported by firm commodity pricing, disciplined capital spending and improving free cash flow generation.
Underweight allocation to and stock selection in oil and gas storage and transportation | Relative contribution to returns came mostly from what was not owned in the Fund like Enbridge Inc., ONEOK, Inc. and The Williams Cos., Inc.
Absolute contributors | Exxon Mobil Corp., Suncor Energy, Inc. and Chevron Corp. were the top absolute contributors.
What detracted from performance?
Cash allocation | Although cash averaged less than 2% for the period, the allocation was the largest relative detractor, which is expected in a strong equity market.
Stock selection in oil and gas refining and marketing | Stock selection in oil and gas refining and marketing was a relative detractor. Some of the key relative detractors were holdings such as Expand Energy Corp. and Shell PLC, ADR. Also, names that were not owned like Valero Energy Corp., Cameco Corp., Eni US Inc. and Cenovus Energy Inc. hurt relative returns.
Absolute detractors | Atlas Energy Solutions Inc. and Expand Energy Corp. were the only absolute detractors from returns. We exited our position in Atlas Energy Solutions during the fiscal year.
How Has The Fund Historically Performed?
Growth of $10,000 Investment
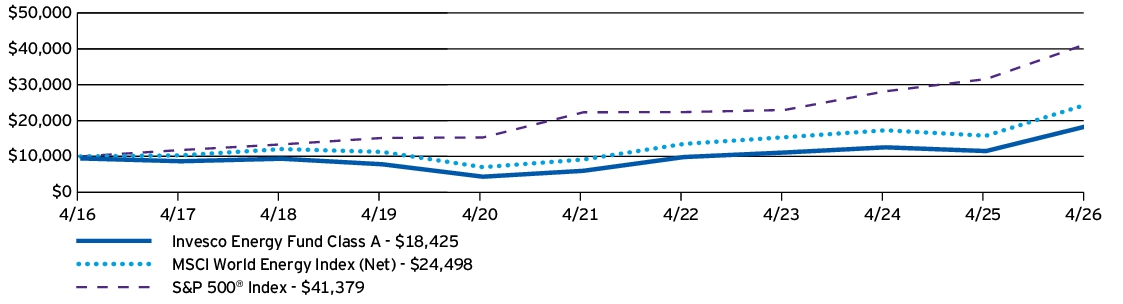
| AVERAGE ANNUAL TOTAL RETURNS | 1 Year | 5 Years | 10 Years |
| Invesco Energy Fund (Class A) —including sales charge | 51.32% | 23.72% | 6.30% |
| Invesco Energy Fund (Class A) —excluding sales charge | 60.13% | 25.14% | 6.90% |
| MSCI World Energy Index (Net) | 55.28% | 21.76% | 9.37% |
| S&P 500® Index | 31.05% | 13.14% | 15.26% |
Performance figures do not reflect deduction of taxes a shareholder would pay on Fund distributions or sale of Fund shares.
What Are Key Statistics About The Fund?
(as of April 30, 2026)
| Fund net assets | $614,890,276 |
| Total number of portfolio holdings | 30 |
| Total advisory fees paid | $3,357,998 |
| Portfolio turnover rate | 28% |
What Comprised The Fund's Holdings?
(as of April 30, 2026)
Top ten holdings*
(% of net assets)
(% of net assets)
| Exxon Mobil Corp. | 11.06% |
| Chevron Corp. | 6.97% |
| Shell PLC, ADR | 6.76% |
| Suncor Energy, Inc. | 6.58% |
| Devon Energy Corp. | 5.97% |
| Occidental Petroleum Corp. | 5.86% |
| ConocoPhillips | 5.08% |
| Canadian Natural Resources Ltd. | 4.90% |
| Tenaris S.A. | 4.85% |
| TotalEnergies SE | 4.31% |
| * Excluding money market fund holdings, if any. |
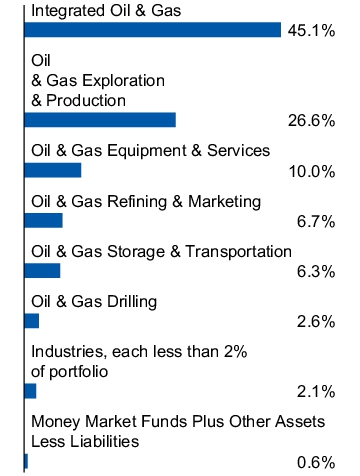
Industry allocation
(% of net assets)
(% of net assets)
Top ten holdings*
(% of net assets)
(% of net assets)
| Exxon Mobil Corp. | 11.06% |
| Chevron Corp. | 6.97% |
| Shell PLC, ADR | 6.76% |
| Suncor Energy, Inc. | 6.58% |
| Devon Energy Corp. | 5.97% |
| Occidental Petroleum Corp. | 5.86% |
| ConocoPhillips | 5.08% |
| Canadian Natural Resources Ltd. | 4.90% |
| Tenaris S.A. | 4.85% |
| TotalEnergies SE | 4.31% |
| * Excluding money market fund holdings, if any. |
This report describes changes to the Fund that occurred during the reporting period.
What Were The Fund Costs For The Last Year ?
(Based on a hypothetical $10,000 investment)
| Fund (Class) | Costs of a $10,000 investment | Costs paid as a percentage of a $10,000 investment |
| Invesco Technology Fund (Class A) |
$135 | 1.00% |
How Did The Fund Perform During The Period?
• During the fiscal year ended April 30, 2026, US equity markets delivered strong gains and reached new record highs, driven by solid corporate earnings and renewed investor enthusiasm for artificial intelligence (AI) and growth‑oriented sectors, despite periods of geopolitical and inflation‑related volatility.
• For the fiscal year ended April 30, 2026, Class A shares of the Fund, excluding sales charge, returned 69.59%. For the same time period, the S&P North American Technology Sector Index (the “Benchmark”) returned 57.75%. The Fund outperformed the Benchmark primarily due to stock selection in the information technology (IT) sector. Within IT, our underweight allocation to the software industry and stock selection in the electronic equipment instruments & components and communications equipment industries was accretive. These results were partially offset by weaker stock selection in the communication services sector.
What contributed to performance?
NVIDIA Corp. | Semiconductor maker NVIDIA's leadership in AI hardware strengthened into early 2026 as Blackwell Graphic Processing Units moved into full-scale production, accelerating deployments across major hyperscalers. Record earnings and strong demand visibility reinforced NVIDIA’s leadership in AI infrastructure.
Lumentum Holdings Inc. | Lumentum is a leading supplier of lasers to the AI ecosystem. The stock rallied due to strong demand for its products in hyperscale and AI data centers, alongside favorable investment sentiment toward AI infrastructure stocks.
Broadcom, Inc. | Broadcom saw robust demand for its custom AI chips and networking solutions. Strategic partnerships and strong execution in its semiconductor segment led to record revenues and positive investor sentiment tied to Broadcom's AI roadmap.
What detracted from performance?
Zscaler, Inc. | Zscaler, a cloud cybersecurity provider, faced pressure as competition intensified in secure access networking and investor sensitivity to AI-related disruption across the software industry heightened. The stock also pulled back due to conservative full-year guidance reported late in the fourth quarter of 2025. We exited our position during the period.
Robinhood Markets, Inc. | Robinhood Markets, a retail trading platform, declined as the price of bitcoin pulled back late in the fourth quarter of 2025. As a result, crypto trading activity on the platform slowed. We exited our position during the period.
Snowflake Inc. | Snowflake, a cloud data platform provider, declined as slowing product revenue growth, cautious guidance and intensifying competition weighed on investor sentiment. We exited our position during the period.
How Has The Fund Historically Performed?
Growth of $10,000 Investment
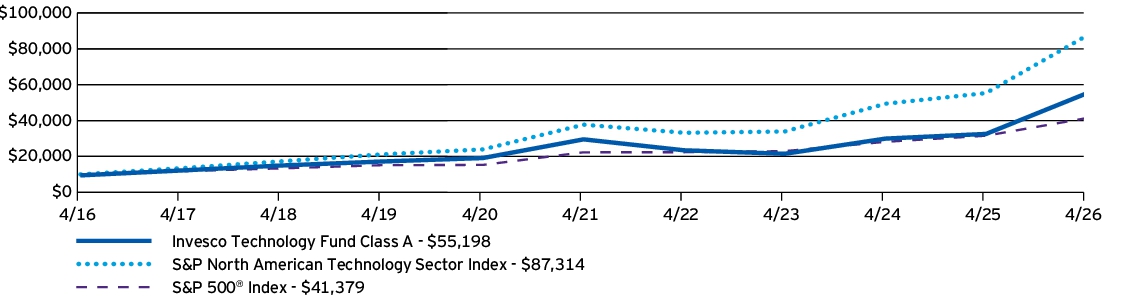
| AVERAGE ANNUAL TOTAL RETURNS | 1 Year | 5 Years | 10 Years |
| Invesco Technology Fund (Class A) —including sales charge | 60.20% | 12.05% | 18.63% |
| Invesco Technology Fund (Class A) —excluding sales charge | 69.59% | 13.32% | 19.30% |
| S&P North American Technology Sector Index | 57.75% | 18.27% | 24.20% |
| S&P 500® Index | 31.05% | 13.14% | 15.26% |
Performance figures do not reflect deduction of taxes a shareholder would pay on Fund distributions or sale of Fund shares.
What Are Key Statistics About The Fund?
(as of April 30, 2026)
| Fund net assets | $2,552,063,143 |
| Total number of portfolio holdings | 47 |
| Total advisory fees paid | $12,016,626 |
| Portfolio turnover rate | 159% |
What Comprised The Fund's Holdings?
(as of April 30, 2026)
Top ten holdings*
(% of net assets)
(% of net assets)
| NVIDIA Corp. | 11.61% |
| Broadcom, Inc. | 6.06% |
| Alphabet, Inc., Class A | 6.02% |
| Taiwan Semiconductor Manufacturing Co. Ltd., ADR | 4.50% |
| Arista Networks, Inc. | 3.80% |
| Amazon.com, Inc. | 3.64% |
| Lam Research Corp. | 3.42% |
| Texas Instruments, Inc. | 2.62% |
| Advanced Micro Devices, Inc. | 2.57% |
| MACOM Technology Solutions Holdings, Inc. | 2.50% |
| * Excluding money market fund holdings, if any. |
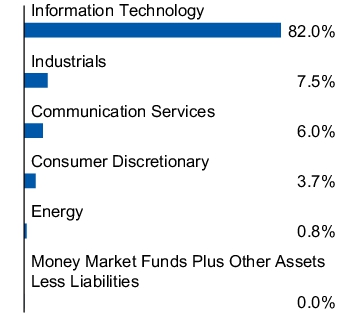
Sector allocation
(% of net assets)
(% of net assets)
Top ten holdings*
(% of net assets)
(% of net assets)
| NVIDIA Corp. | 11.61% |
| Broadcom, Inc. | 6.06% |
| Alphabet, Inc., Class A | 6.02% |
| Taiwan Semiconductor Manufacturing Co. Ltd., ADR | 4.50% |
| Arista Networks, Inc. | 3.80% |
| Amazon.com, Inc. | 3.64% |
| Lam Research Corp. | 3.42% |
| Texas Instruments, Inc. | 2.62% |
| Advanced Micro Devices, Inc. | 2.57% |
| MACOM Technology Solutions Holdings, Inc. | 2.50% |
| * Excluding money market fund holdings, if any. |
How Has The Fund Changed Over The Past Year?
This is a summary of certain changes to the Fund since April 30, 2025. For more complete information, you may review the Fund's prospectus, which is available at invesco.com/reports or upon request at (800) 959-4246.
The Fund added active trading risk to its principal risks to reflect that active trading of portfolio securities may result in added expenses, a lower return and increased tax liability.
The Fund added active trading risk to its principal risks to reflect that active trading of portfolio securities may result in added expenses, a lower return and increased tax liability.
This is a summary of certain changes to the Fund since April 30, 2025. For more complete information, you may review the Fund's prospectus, which is available at invesco.com/reports or upon request at (800) 959-4246.
This report describes changes to the Fund that occurred during the reporting period.
What Were The Fund Costs For The Last Year ?
(Based on a hypothetical $10,000 investment)
| Fund (Class) | Costs of a $10,000 investment | Costs paid as a percentage of a $10,000 investment |
| Invesco Technology Fund (Class C) |
$235 | 1.75% |
How Did The Fund Perform During The Period?
• During the fiscal year ended April 30, 2026, US equity markets delivered strong gains and reached new record highs, driven by solid corporate earnings and renewed investor enthusiasm for artificial intelligence (AI) and growth‑oriented sectors, despite periods of geopolitical and inflation‑related volatility.
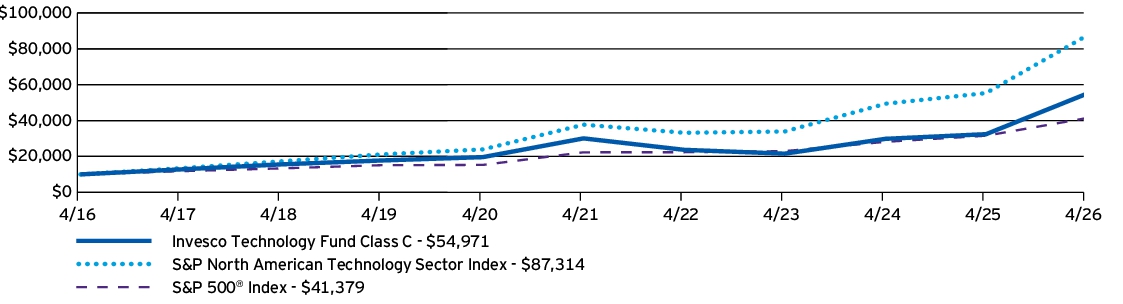
• For the fiscal year ended April 30, 2026, Class C shares of the Fund, excluding sales charge, returned 68.35%. For the same time period, the S&P North American Technology Sector Index (the “Benchmark”) returned 57.75%. The Fund outperformed the Benchmark primarily due to stock selection in the information technology (IT) sector. Within IT, our underweight allocation to the software industry and stock selection in the electronic equipment instruments & components and communications equipment industries was accretive. These results were partially offset by weaker stock selection in the communication services sector.
What contributed to performance?
NVIDIA Corp. | Semiconductor maker NVIDIA's leadership in AI hardware strengthened into early 2026 as Blackwell Graphic Processing Units moved into full-scale production, accelerating deployments across major hyperscalers. Record earnings and strong demand visibility reinforced NVIDIA’s leadership in AI infrastructure.
Lumentum Holdings Inc. | Lumentum is a leading supplier of lasers to the AI ecosystem. The stock rallied due to strong demand for its products in hyperscale and AI data centers, alongside favorable investment sentiment toward AI infrastructure stocks.
Broadcom, Inc. | Broadcom saw robust demand for its custom AI chips and networking solutions. Strategic partnerships and strong execution in its semiconductor segment led to record revenues and positive investor sentiment tied to Broadcom's AI roadmap.
What detracted from performance?
Zscaler, Inc. | Zscaler, a cloud cybersecurity provider, faced pressure as competition intensified in secure access networking and investor sensitivity to AI-related disruption across the software industry heightened. The stock also pulled back due to conservative full-year guidance reported late in the fourth quarter of 2025. We exited our position during the period.
Robinhood Markets, Inc. | Robinhood Markets, a retail trading platform, declined as the price of bitcoin pulled back late in the fourth quarter of 2025. As a result, crypto trading activity on the platform slowed. We exited our position during the period.
Snowflake Inc. | Snowflake, a cloud data platform provider, declined as slowing product revenue growth, cautious guidance and intensifying competition weighed on investor sentiment. We exited our position during the period.
How Has The Fund Historically Performed?
Growth of $10,000 Investment
| AVERAGE ANNUAL TOTAL RETURNS | 1 Year | 5 Years | 10 Years |
| Invesco Technology Fund (Class C) —including sales charge | 67.30% | 12.48% | 18.58% |
| Invesco Technology Fund (Class C) —excluding sales charge | 68.35% | 12.48% | 18.58% |
| S&P North American Technology Sector Index | 57.75% | 18.27% | 24.20% |
| S&P 500® Index | 31.05% | 13.14% | 15.26% |
Performance figures do not reflect deduction of taxes a shareholder would pay on Fund distributions or sale of Fund shares.
What Are Key Statistics About The Fund?
(as of April 30, 2026)
| Fund net assets | $2,552,063,143 |
| Total number of portfolio holdings | 47 |
| Total advisory fees paid | $12,016,626 |
| Portfolio turnover rate | 159% |
What Comprised The Fund's Holdings?
(as of April 30, 2026)
Top ten holdings*
(% of net assets)
(% of net assets)
| NVIDIA Corp. | 11.61% |
| Broadcom, Inc. | 6.06% |
| Alphabet, Inc., Class A | 6.02% |
| Taiwan Semiconductor Manufacturing Co. Ltd., ADR | 4.50% |
| Arista Networks, Inc. | 3.80% |
| Amazon.com, Inc. | 3.64% |
| Lam Research Corp. | 3.42% |
| Texas Instruments, Inc. | 2.62% |
| Advanced Micro Devices, Inc. | 2.57% |
| MACOM Technology Solutions Holdings, Inc. | 2.50% |
| * Excluding money market fund holdings, if any. |
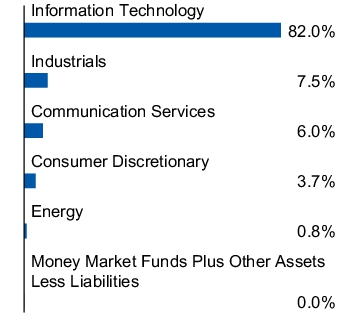
Sector allocation
(% of net assets)
(% of net assets)
Top ten holdings*
(% of net assets)
(% of net assets)
| NVIDIA Corp. | 11.61% |
| Broadcom, Inc. | 6.06% |
| Alphabet, Inc., Class A | 6.02% |
| Taiwan Semiconductor Manufacturing Co. Ltd., ADR | 4.50% |
| Arista Networks, Inc. | 3.80% |
| Amazon.com, Inc. | 3.64% |
| Lam Research Corp. | 3.42% |
| Texas Instruments, Inc. | 2.62% |
| Advanced Micro Devices, Inc. | 2.57% |
| MACOM Technology Solutions Holdings, Inc. | 2.50% |
| * Excluding money market fund holdings, if any. |
How Has The Fund Changed Over The Past Year?
This is a summary of certain changes to the Fund since April 30, 2025. For more complete information, you may review the Fund's prospectus, which is available at invesco.com/reports or upon request at (800) 959-4246.
The Fund added active trading risk to its principal risks to reflect that active trading of portfolio securities may result in added expenses, a lower return and increased tax liability.
The Fund added active trading risk to its principal risks to reflect that active trading of portfolio securities may result in added expenses, a lower return and increased tax liability.
This is a summary of certain changes to the Fund since April 30, 2025. For more complete information, you may review the Fund's prospectus, which is available at invesco.com/reports or upon request at (800) 959-4246.
This report describes changes to the Fund that occurred during the reporting period.
What Were The Fund Costs For The Last Year ?
(Based on a hypothetical $10,000 investment)
| Fund (Class) | Costs of a $10,000 investment▼ | Costs paid as a percentage of a $10,000 investment* |
| Invesco Technology Fund (Class R) |
$141 | 1.25% |
|
▼
|
For the period September 30, 2025 (commencement of operations) to April 30, 2026. Expenses for a full reporting period would be higher.
|
| * |
Annualized.
|
How Did The Fund Perform During The Period?
• During the fiscal year ended April 30, 2026, US equity markets delivered strong gains and reached new record highs, driven by solid corporate earnings and renewed investor enthusiasm for artificial intelligence (AI) and growth‑oriented sectors, despite periods of geopolitical and inflation‑related volatility.
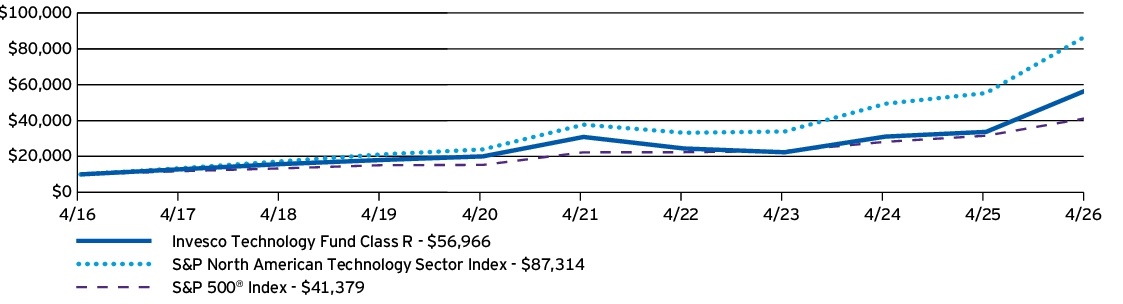
• For the fiscal year ended April 30, 2026, Class R shares of the Fund returned 69.07%. For the same time period, the S&P North American Technology Sector Index (the “Benchmark”) returned 57.75%. The Fund outperformed the Benchmark primarily due to stock selection in the information technology (IT) sector. Within IT, our underweight allocation to the software industry and stock selection in the electronic equipment instruments & components and communications equipment industries was accretive. These results were partially offset by weaker stock selection in the communication services sector.
What contributed to performance?
NVIDIA Corp. | Semiconductor maker NVIDIA's leadership in AI hardware strengthened into early 2026 as Blackwell Graphic Processing Units moved into full-scale production, accelerating deployments across major hyperscalers. Record earnings and strong demand visibility reinforced NVIDIA’s leadership in AI infrastructure.
Lumentum Holdings Inc. | Lumentum is a leading supplier of lasers to the AI ecosystem. The stock rallied due to strong demand for its products in hyperscale and AI data centers, alongside favorable investment sentiment toward AI infrastructure stocks.
Broadcom, Inc. | Broadcom saw robust demand for its custom AI chips and networking solutions. Strategic partnerships and strong execution in its semiconductor segment led to record revenues and positive investor sentiment tied to Broadcom's AI roadmap.
What detracted from performance?
Zscaler, Inc. | Zscaler, a cloud cybersecurity provider, faced pressure as competition intensified in secure access networking and investor sensitivity to AI-related disruption across the software industry heightened. The stock also pulled back due to conservative full-year guidance reported late in the fourth quarter of 2025. We exited our position during the period.
Robinhood Markets, Inc. | Robinhood Markets, a retail trading platform, declined as the price of bitcoin pulled back late in the fourth quarter of 2025. As a result, crypto trading activity on the platform slowed. We exited our position during the period.
Snowflake Inc. | Snowflake, a cloud data platform provider, declined as slowing product revenue growth, cautious guidance and intensifying competition weighed on investor sentiment. We exited our position during the period.
How Has The Fund Historically Performed?
Growth of $10,000 Investment
| AVERAGE ANNUAL TOTAL RETURNS | 1 Year | 5 Years | 10 Years |
| Invesco Technology Fund (Class R) | 69.07% | 13.03% | 19.00% |
| S&P North American Technology Sector Index | 57.75% | 18.27% | 24.20% |
| S&P 500® Index | 31.05% | 13.14% | 15.26% |
Performance figures do not reflect deduction of taxes a shareholder would pay on Fund distributions or sale of Fund shares.
What Are Key Statistics About The Fund?
(as of April 30, 2026)
| Fund net assets | $2,552,063,143 |
| Total number of portfolio holdings | 47 |
| Total advisory fees paid | $12,016,626 |
| Portfolio turnover rate | 159% |
What Comprised The Fund's Holdings?
(as of April 30, 2026)
Top ten holdings*
(% of net assets)
(% of net assets)
| NVIDIA Corp. | 11.61% |
| Broadcom, Inc. | 6.06% |
| Alphabet, Inc., Class A | 6.02% |
| Taiwan Semiconductor Manufacturing Co. Ltd., ADR | 4.50% |
| Arista Networks, Inc. | 3.80% |
| Amazon.com, Inc. | 3.64% |
| Lam Research Corp. | 3.42% |
| Texas Instruments, Inc. | 2.62% |
| Advanced Micro Devices, Inc. | 2.57% |
| MACOM Technology Solutions Holdings, Inc. | 2.50% |
| * Excluding money market fund holdings, if any. |
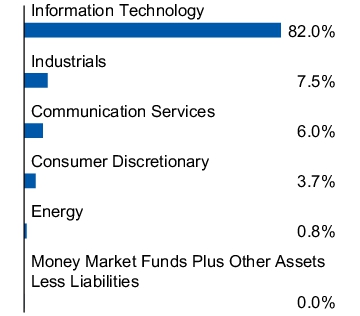
Sector allocation
(% of net assets)
(% of net assets)
Top ten holdings*
(% of net assets)
(% of net assets)
| NVIDIA Corp. | 11.61% |
| Broadcom, Inc. | 6.06% |
| Alphabet, Inc., Class A | 6.02% |
| Taiwan Semiconductor Manufacturing Co. Ltd., ADR | 4.50% |
| Arista Networks, Inc. | 3.80% |
| Amazon.com, Inc. | 3.64% |
| Lam Research Corp. | 3.42% |
| Texas Instruments, Inc. | 2.62% |
| Advanced Micro Devices, Inc. | 2.57% |
| MACOM Technology Solutions Holdings, Inc. | 2.50% |
| * Excluding money market fund holdings, if any. |
How Has The Fund Changed Over The Past Year?
This is a summary of certain changes to the Fund since April 30, 2025. For more complete information, you may review the Fund's prospectus, which is available at invesco.com/reports or upon request at (800) 959-4246.
The Fund added active trading risk to its principal risks to reflect that active trading of portfolio securities may result in added expenses, a lower return and increased tax liability.
The Fund added active trading risk to its principal risks to reflect that active trading of portfolio securities may result in added expenses, a lower return and increased tax liability.
This is a summary of certain changes to the Fund since April 30, 2025. For more complete information, you may review the Fund's prospectus, which is available at invesco.com/reports or upon request at (800) 959-4246.
This report describes changes to the Fund that occurred during the reporting period.
What Were The Fund Costs For The Last Year ?
(Based on a hypothetical $10,000 investment)
| Fund (Class) | Costs of a $10,000 investment | Costs paid as a percentage of a $10,000 investment |
| Invesco Technology Fund (Class Y) |
$101 | 0.75% |
How Did The Fund Perform During The Period?
• During the fiscal year ended April 30, 2026, US equity markets delivered strong gains and reached new record highs, driven by solid corporate earnings and renewed investor enthusiasm for artificial intelligence (AI) and growth‑oriented sectors, despite periods of geopolitical and inflation‑related volatility.
• For the fiscal year ended April 30, 2026, Class Y shares of the Fund returned 70.04%. For the same time period, the S&P North American Technology Sector Index (the “Benchmark”) returned 57.75%. The Fund outperformed the Benchmark primarily due to stock selection in the information technology (IT) sector. Within IT, our underweight allocation to the software industry and stock selection in the electronic equipment instruments & components and communications equipment industries was accretive. These results were partially offset by weaker stock selection in the communication services sector.
What contributed to performance?
NVIDIA Corp. | Semiconductor maker NVIDIA's leadership in AI hardware strengthened into early 2026 as Blackwell Graphic Processing Units moved into full-scale production, accelerating deployments across major hyperscalers. Record earnings and strong demand visibility reinforced NVIDIA’s leadership in AI infrastructure.
Lumentum Holdings Inc. | Lumentum is a leading supplier of lasers to the AI ecosystem. The stock rallied due to strong demand for its products in hyperscale and AI data centers, alongside favorable investment sentiment toward AI infrastructure stocks.
Broadcom, Inc. | Broadcom saw robust demand for its custom AI chips and networking solutions. Strategic partnerships and strong execution in its semiconductor segment led to record revenues and positive investor sentiment tied to Broadcom's AI roadmap.
What detracted from performance?
Zscaler, Inc. | Zscaler, a cloud cybersecurity provider, faced pressure as competition intensified in secure access networking and investor sensitivity to AI-related disruption across the software industry heightened. The stock also pulled back due to conservative full-year guidance reported late in the fourth quarter of 2025. We exited our position during the period.
Robinhood Markets, Inc. | Robinhood Markets, a retail trading platform, declined as the price of bitcoin pulled back late in the fourth quarter of 2025. As a result, crypto trading activity on the platform slowed. We exited our position during the period.
Snowflake Inc. | Snowflake, a cloud data platform provider, declined as slowing product revenue growth, cautious guidance and intensifying competition weighed on investor sentiment. We exited our position during the period.
How Has The Fund Historically Performed?
Growth of $10,000 Investment
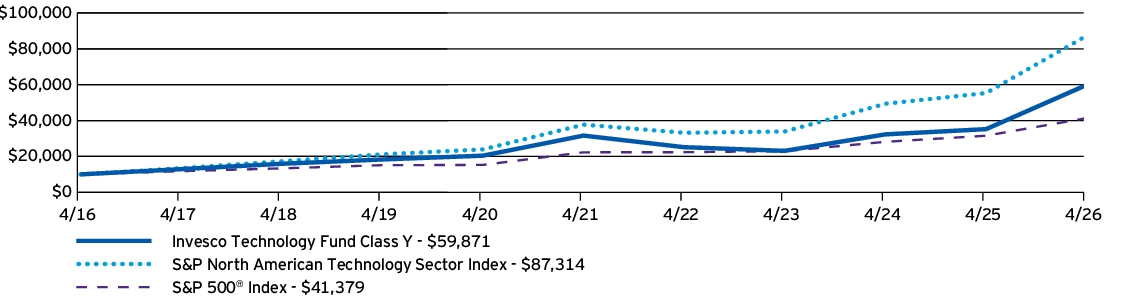
| AVERAGE ANNUAL TOTAL RETURNS | 1 Year | 5 Years | 10 Years |
| Invesco Technology Fund (Class Y) | 70.04% | 13.60% | 19.60% |
| S&P North American Technology Sector Index | 57.75% | 18.27% | 24.20% |
| S&P 500® Index | 31.05% | 13.14% | 15.26% |
Performance figures do not reflect deduction of taxes a shareholder would pay on Fund distributions or sale of Fund shares.
What Are Key Statistics About The Fund?
(as of April 30, 2026)
| Fund net assets | $2,552,063,143 |
| Total number of portfolio holdings | 47 |
| Total advisory fees paid | $12,016,626 |
| Portfolio turnover rate | 159% |
What Comprised The Fund's Holdings?
(as of April 30, 2026)
Top ten holdings*
(% of net assets)
(% of net assets)
| NVIDIA Corp. | 11.61% |
| Broadcom, Inc. | 6.06% |
| Alphabet, Inc., Class A | 6.02% |
| Taiwan Semiconductor Manufacturing Co. Ltd., ADR | 4.50% |
| Arista Networks, Inc. | 3.80% |
| Amazon.com, Inc. | 3.64% |
| Lam Research Corp. | 3.42% |
| Texas Instruments, Inc. | 2.62% |
| Advanced Micro Devices, Inc. | 2.57% |
| MACOM Technology Solutions Holdings, Inc. | 2.50% |
| * Excluding money market fund holdings, if any. |
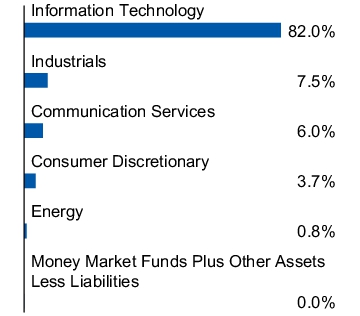
Sector allocation
(% of net assets)
(% of net assets)
Top ten holdings*
(% of net assets)
(% of net assets)
| NVIDIA Corp. | 11.61% |
| Broadcom, Inc. | 6.06% |
| Alphabet, Inc., Class A | 6.02% |
| Taiwan Semiconductor Manufacturing Co. Ltd., ADR | 4.50% |
| Arista Networks, Inc. | 3.80% |
| Amazon.com, Inc. | 3.64% |
| Lam Research Corp. | 3.42% |
| Texas Instruments, Inc. | 2.62% |
| Advanced Micro Devices, Inc. | 2.57% |
| MACOM Technology Solutions Holdings, Inc. | 2.50% |
| * Excluding money market fund holdings, if any. |
How Has The Fund Changed Over The Past Year?
This is a summary of certain changes to the Fund since April 30, 2025. For more complete information, you may review the Fund's prospectus, which is available at invesco.com/reports or upon request at (800) 959-4246.
The Fund added active trading risk to its principal risks to reflect that active trading of portfolio securities may result in added expenses, a lower return and increased tax liability.
The Fund added active trading risk to its principal risks to reflect that active trading of portfolio securities may result in added expenses, a lower return and increased tax liability.
This is a summary of certain changes to the Fund since April 30, 2025. For more complete information, you may review the Fund's prospectus, which is available at invesco.com/reports or upon request at (800) 959-4246.
This report describes changes to the Fund that occurred during the reporting period.
What Were The Fund Costs For The Last Year ?
(Based on a hypothetical $10,000 investment)
| Fund (Class) | Costs of a $10,000 investment | Costs paid as a percentage of a $10,000 investment |
| Invesco Technology Fund (Investor Class) |
$121 | 0.90% |
How Did The Fund Perform During The Period?
• During the fiscal year ended April 30, 2026, US equity markets delivered strong gains and reached new record highs, driven by solid corporate earnings and renewed investor enthusiasm for artificial intelligence (AI) and growth‑oriented sectors, despite periods of geopolitical and inflation‑related volatility.
• For the fiscal year ended April 30, 2026, Investor Class shares of the Fund returned 69.76%. For the same time period, the S&P North American Technology Sector Index (the “Benchmark”) returned 57.75%. The Fund outperformed the Benchmark primarily due to stock selection in the information technology (IT) sector. Within IT, our underweight allocation to the software industry and stock selection in the electronic equipment instruments & components and communications equipment industries was accretive. These results were partially offset by weaker stock selection in the communication services sector.
What contributed to performance?
NVIDIA Corp. | Semiconductor maker NVIDIA's leadership in AI hardware strengthened into early 2026 as Blackwell Graphic Processing Units moved into full-scale production, accelerating deployments across major hyperscalers. Record earnings and strong demand visibility reinforced NVIDIA’s leadership in AI infrastructure.
Lumentum Holdings Inc. | Lumentum is a leading supplier of lasers to the AI ecosystem. The stock rallied due to strong demand for its products in hyperscale and AI data centers, alongside favorable investment sentiment toward AI infrastructure stocks.
Broadcom, Inc. | Broadcom saw robust demand for its custom AI chips and networking solutions. Strategic partnerships and strong execution in its semiconductor segment led to record revenues and positive investor sentiment tied to Broadcom's AI roadmap.
What detracted from performance?
Zscaler, Inc. | Zscaler, a cloud cybersecurity provider, faced pressure as competition intensified in secure access networking and investor sensitivity to AI-related disruption across the software industry heightened. The stock also pulled back due to conservative full-year guidance reported late in the fourth quarter of 2025. We exited our position during the period.
Robinhood Markets, Inc. | Robinhood Markets, a retail trading platform, declined as the price of bitcoin pulled back late in the fourth quarter of 2025. As a result, crypto trading activity on the platform slowed. We exited our position during the period.
Snowflake Inc. | Snowflake, a cloud data platform provider, declined as slowing product revenue growth, cautious guidance and intensifying competition weighed on investor sentiment. We exited our position during the period.
How Has The Fund Historically Performed?
Growth of $10,000 Investment
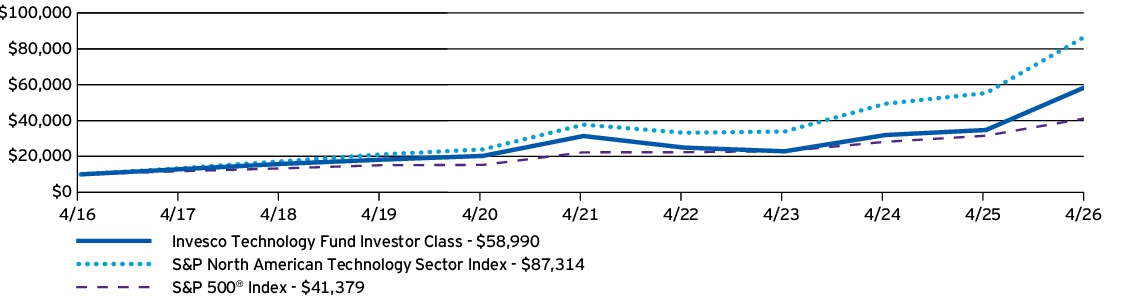
| AVERAGE ANNUAL TOTAL RETURNS | 1 Year | 5 Years | 10 Years |
| Invesco Technology Fund (Investor Class) | 69.76% | 13.44% | 19.42% |
| S&P North American Technology Sector Index | 57.75% | 18.27% | 24.20% |
| S&P 500® Index | 31.05% | 13.14% | 15.26% |
Performance figures do not reflect deduction of taxes a shareholder would pay on Fund distributions or sale of Fund shares.
What Are Key Statistics About The Fund?
(as of April 30, 2026)
| Fund net assets | $2,552,063,143 |
| Total number of portfolio holdings | 47 |
| Total advisory fees paid | $12,016,626 |
| Portfolio turnover rate | 159% |
What Comprised The Fund's Holdings?
(as of April 30, 2026)
Top ten holdings*
(% of net assets)
(% of net assets)
| NVIDIA Corp. | 11.61% |
| Broadcom, Inc. | 6.06% |
| Alphabet, Inc., Class A | 6.02% |
| Taiwan Semiconductor Manufacturing Co. Ltd., ADR | 4.50% |
| Arista Networks, Inc. | 3.80% |
| Amazon.com, Inc. | 3.64% |
| Lam Research Corp. | 3.42% |
| Texas Instruments, Inc. | 2.62% |
| Advanced Micro Devices, Inc. | 2.57% |
| MACOM Technology Solutions Holdings, Inc. | 2.50% |
| * Excluding money market fund holdings, if any. |
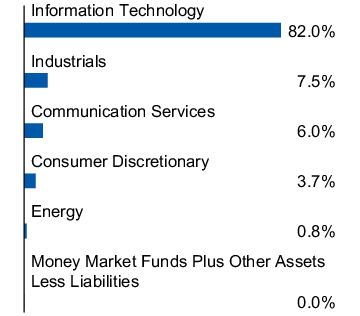
Sector allocation
(% of net assets)
(% of net assets)
Top ten holdings*
(% of net assets)
(% of net assets)
| NVIDIA Corp. | 11.61% |
| Broadcom, Inc. | 6.06% |
| Alphabet, Inc., Class A | 6.02% |
| Taiwan Semiconductor Manufacturing Co. Ltd., ADR | 4.50% |
| Arista Networks, Inc. | 3.80% |
| Amazon.com, Inc. | 3.64% |
| Lam Research Corp. | 3.42% |
| Texas Instruments, Inc. | 2.62% |
| Advanced Micro Devices, Inc. | 2.57% |
| MACOM Technology Solutions Holdings, Inc. | 2.50% |
| * Excluding money market fund holdings, if any. |
How Has The Fund Changed Over The Past Year?
This is a summary of certain changes to the Fund since April 30, 2025. For more complete information, you may review the Fund's prospectus, which is available at invesco.com/reports or upon request at (800) 959-4246.
The Fund added active trading risk to its principal risks to reflect that active trading of portfolio securities may result in added expenses, a lower return and increased tax liability.
The Fund added active trading risk to its principal risks to reflect that active trading of portfolio securities may result in added expenses, a lower return and increased tax liability.
This is a summary of certain changes to the Fund since April 30, 2025. For more complete information, you may review the Fund's prospectus, which is available at invesco.com/reports or upon request at (800) 959-4246.
This report describes changes to the Fund that occurred during the reporting period.
What Were The Fund Costs For The Last Year ?
(Based on a hypothetical $10,000 investment)
| Fund (Class) | Costs of a $10,000 investment | Costs paid as a percentage of a $10,000 investment |
| Invesco Technology Fund (Class R5) |
$97 | 0.72% |
How Did The Fund Perform During The Period?
• During the fiscal year ended April 30, 2026, US equity markets delivered strong gains and reached new record highs, driven by solid corporate earnings and renewed investor enthusiasm for artificial intelligence (AI) and growth‑oriented sectors, despite periods of geopolitical and inflation‑related volatility.
• For the fiscal year ended April 30, 2026, Class R5 shares of the Fund returned 70.07%. For the same time period, the S&P North American Sector Technology Index (the “Benchmark”) returned 57.75%. The Fund outperformed the Benchmark primarily due to stock selection in the information technology (IT) sector. Within IT, our underweight allocation to the software industry and stock selection in the electronic equipment instruments & components and communications equipment industries was accretive. These results were partially offset by weaker stock selection in the communication services sector.
What contributed to performance?
NVIDIA Corp. | Semiconductor maker NVIDIA's leadership in AI hardware strengthened into early 2026 as Blackwell Graphic Processing Units moved into full-scale production, accelerating deployments across major hyperscalers. Record earnings and strong demand visibility reinforced NVIDIA’s leadership in AI infrastructure.
Lumentum Holdings Inc. | Lumentum is a leading supplier of lasers to the AI ecosystem. The stock rallied due to strong demand for its products in hyperscale and AI data centers, alongside favorable investment sentiment toward AI infrastructure stocks.
Broadcom, Inc. | Broadcom saw robust demand for its custom AI chips and networking solutions. Strategic partnerships and strong execution in its semiconductor segment led to record revenues and positive investor sentiment tied to Broadcom's AI roadmap.
What detracted from performance?
Zscaler, Inc. | Zscaler, a cloud cybersecurity provider, faced pressure as competition intensified in secure access networking and investor sensitivity to AI-related disruption across the software industry heightened. The stock also pulled back due to conservative full-year guidance reported late in the fourth quarter of 2025. We exited our position during the period.
Robinhood Markets, Inc. | Robinhood Markets, a retail trading platform, declined as the price of bitcoin pulled back late in the fourth quarter of 2025. As a result, crypto trading activity on the platform slowed. We exited our position during the period.
Snowflake Inc. | Snowflake, a cloud data platform provider, declined as slowing product revenue growth, cautious guidance and intensifying competition weighed on investor sentiment. We exited our position during the period.
How Has The Fund Historically Performed?
Growth of $10,000 Investment
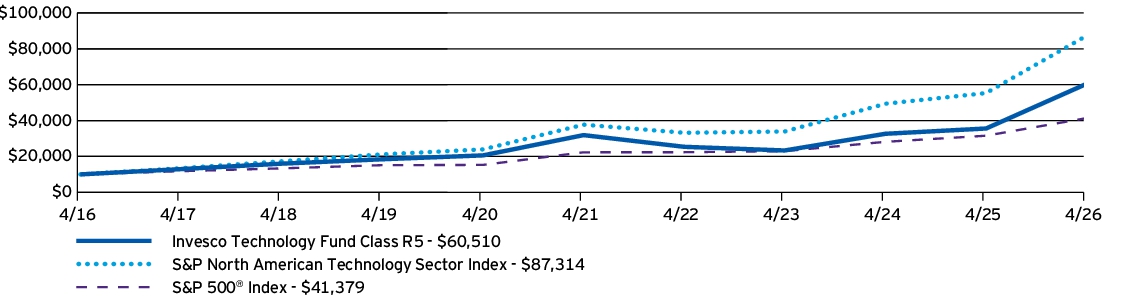
| AVERAGE ANNUAL TOTAL RETURNS | 1 Year | 5 Years | 10 Years |
| Invesco Technology Fund (Class R5) | 70.07% | 13.66% | 19.72% |
| S&P North American Technology Sector Index | 57.75% | 18.27% | 24.20% |
| S&P 500® Index | 31.05% | 13.14% | 15.26% |
Performance figures do not reflect deduction of taxes a shareholder would pay on Fund distributions or sale of Fund shares.
What Are Key Statistics About The Fund?
(as of April 30, 2026)
| Fund net assets | $2,552,063,143 |
| Total number of portfolio holdings | 47 |
| Total advisory fees paid | $12,016,626 |
| Portfolio turnover rate | 159% |
What Comprised The Fund's Holdings?
(as of April 30, 2026)
Top ten holdings*
(% of net assets)
(% of net assets)
| NVIDIA Corp. | 11.61% |
| Broadcom, Inc. | 6.06% |
| Alphabet, Inc., Class A | 6.02% |
| Taiwan Semiconductor Manufacturing Co. Ltd., ADR | 4.50% |
| Arista Networks, Inc. | 3.80% |
| Amazon.com, Inc. | 3.64% |
| Lam Research Corp. | 3.42% |
| Texas Instruments, Inc. | 2.62% |
| Advanced Micro Devices, Inc. | 2.57% |
| MACOM Technology Solutions Holdings, Inc. | 2.50% |
| * Excluding money market fund holdings, if any. |
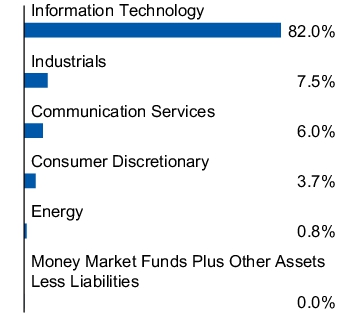
Sector allocation
(% of net assets)
(% of net assets)
Top ten holdings*
(% of net assets)
(% of net assets)
| NVIDIA Corp. | 11.61% |
| Broadcom, Inc. | 6.06% |
| Alphabet, Inc., Class A | 6.02% |
| Taiwan Semiconductor Manufacturing Co. Ltd., ADR | 4.50% |
| Arista Networks, Inc. | 3.80% |
| Amazon.com, Inc. | 3.64% |
| Lam Research Corp. | 3.42% |
| Texas Instruments, Inc. | 2.62% |
| Advanced Micro Devices, Inc. | 2.57% |
| MACOM Technology Solutions Holdings, Inc. | 2.50% |
| * Excluding money market fund holdings, if any. |
How Has The Fund Changed Over The Past Year?
This is a summary of certain changes to the Fund since April 30, 2025. For more complete information, you may review the Fund's prospectus, which is available at invesco.com/reports or upon request at (800) 959-4246.
The Fund added active trading risk to its principal risks to reflect that active trading of portfolio securities may result in added expenses, a lower return and increased tax liability.
The Fund added active trading risk to its principal risks to reflect that active trading of portfolio securities may result in added expenses, a lower return and increased tax liability.
This is a summary of certain changes to the Fund since April 30, 2025. For more complete information, you may review the Fund's prospectus, which is available at invesco.com/reports or upon request at (800) 959-4246.
This report describes changes to the Fund that occurred during the reporting period.
What Were The Fund Costs For The Last Year ?
(Based on a hypothetical $10,000 investment)
| Fund (Class) | Costs of a $10,000 investment | Costs paid as a percentage of a $10,000 investment |
| Invesco Technology Fund (Class R6) |
$88 | 0.65% |
How Did The Fund Perform During The Period?
• During the fiscal year ended April 30, 2026, US equity markets delivered strong gains and reached new record highs, driven by solid corporate earnings and renewed investor enthusiasm for artificial intelligence (AI) and growth‑oriented sectors, despite periods of geopolitical and inflation‑related volatility.
• For the fiscal year ended April 30, 2026, Class R6 shares of the Fund returned 70.21%. For the same time period, the S&P North American Technology Sector Index (the “Benchmark”) returned 57.75%. The Fund outperformed the Benchmark primarily due to stock selection in the information technology (IT) sector. Within IT, our underweight allocation to the software industry and stock selection in the electronic equipment instruments & components and communications equipment industries was accretive. These results were partially offset by weaker stock selection in the communication services sector.
What contributed to performance?
NVIDIA Corp. | Semiconductor maker NVIDIA's leadership in AI hardware strengthened into early 2026 as Blackwell Graphic Processing Units moved into full-scale production, accelerating deployments across major hyperscalers. Record earnings and strong demand visibility reinforced NVIDIA’s leadership in AI infrastructure.
Lumentum Holdings Inc. | Lumentum is a leading supplier of lasers to the AI ecosystem. The stock rallied due to strong demand for its products in hyperscale and AI data centers, alongside favorable investment sentiment toward AI infrastructure stocks.
Broadcom, Inc. | Broadcom saw robust demand for its custom AI chips and networking solutions. Strategic partnerships and strong execution in its semiconductor segment led to record revenues and positive investor sentiment tied to Broadcom's AI roadmap.
What detracted from performance?
Zscaler, Inc. | Zscaler, a cloud cybersecurity provider, faced pressure as competition intensified in secure access networking and investor sensitivity to AI-related disruption across the software industry heightened. The stock also pulled back due to conservative full-year guidance reported late in the fourth quarter of 2025. We exited our position during the period.
Robinhood Markets, Inc. | Robinhood Markets, a retail trading platform, declined as the price of bitcoin pulled back late in the fourth quarter of 2025. As a result, crypto trading activity on the platform slowed. We exited our position during the period.
Snowflake Inc. | Snowflake, a cloud data platform provider, declined as slowing product revenue growth, cautious guidance and intensifying competition weighed on investor sentiment. We exited our position during the period.
How Has The Fund Historically Performed?
Growth of $10,000 Investment
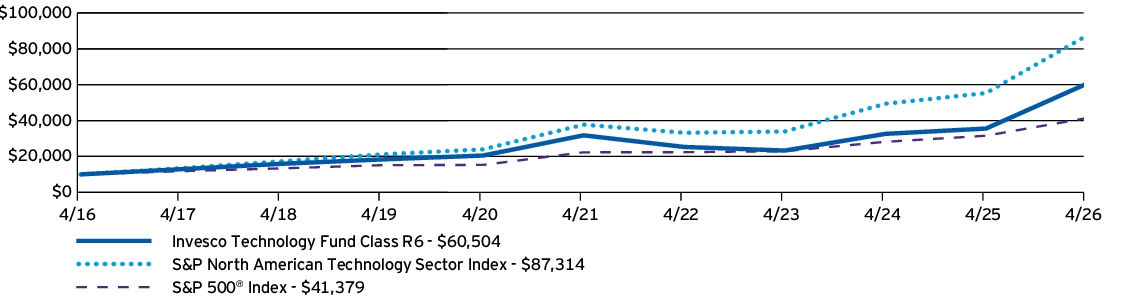
| AVERAGE ANNUAL TOTAL RETURNS | 1 Year | 5 Years | 10 Years |
| Invesco Technology Fund (Class R6) | 70.21% | 13.74% | 19.72% |
| S&P North American Technology Sector Index | 57.75% | 18.27% | 24.20% |
| S&P 500® Index | 31.05% | 13.14% | 15.26% |
Performance figures do not reflect deduction of taxes a shareholder would pay on Fund distributions or sale of Fund shares.
What Are Key Statistics About The Fund?
(as of April 30, 2026)
| Fund net assets | $2,552,063,143 |
| Total number of portfolio holdings | 47 |
| Total advisory fees paid | $12,016,626 |
| Portfolio turnover rate | 159% |
What Comprised The Fund's Holdings?
(as of April 30, 2026)
Top ten holdings*
(% of net assets)
(% of net assets)
| NVIDIA Corp. | 11.61% |
| Broadcom, Inc. | 6.06% |
| Alphabet, Inc., Class A | 6.02% |
| Taiwan Semiconductor Manufacturing Co. Ltd., ADR | 4.50% |
| Arista Networks, Inc. | 3.80% |
| Amazon.com, Inc. | 3.64% |
| Lam Research Corp. | 3.42% |
| Texas Instruments, Inc. | 2.62% |
| Advanced Micro Devices, Inc. | 2.57% |
| MACOM Technology Solutions Holdings, Inc. | 2.50% |
| * Excluding money market fund holdings, if any. |
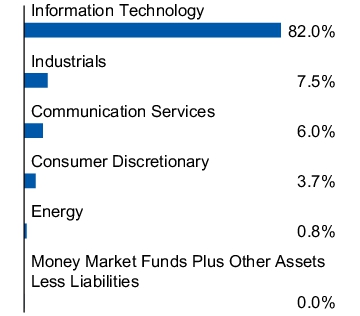
Sector allocation
(% of net assets)
(% of net assets)
Top ten holdings*
(% of net assets)
(% of net assets)
| NVIDIA Corp. | 11.61% |
| Broadcom, Inc. | 6.06% |
| Alphabet, Inc., Class A | 6.02% |
| Taiwan Semiconductor Manufacturing Co. Ltd., ADR | 4.50% |
| Arista Networks, Inc. | 3.80% |
| Amazon.com, Inc. | 3.64% |
| Lam Research Corp. | 3.42% |
| Texas Instruments, Inc. | 2.62% |
| Advanced Micro Devices, Inc. | 2.57% |
| MACOM Technology Solutions Holdings, Inc. | 2.50% |
| * Excluding money market fund holdings, if any. |
How Has The Fund Changed Over The Past Year?
This is a summary of certain changes to the Fund since April 30, 2025. For more complete information, you may review the Fund's prospectus, which is available at invesco.com/reports or upon request at (800) 959-4246.
The Fund added active trading risk to its principal risks to reflect that active trading of portfolio securities may result in added expenses, a lower return and increased tax liability.
The Fund added active trading risk to its principal risks to reflect that active trading of portfolio securities may result in added expenses, a lower return and increased tax liability.
This is a summary of certain changes to the Fund since April 30, 2025. For more complete information, you may review the Fund's prospectus, which is available at invesco.com/reports or upon request at (800) 959-4246.
What Were The Fund Costs For The Last Year ?
(Based on a hypothetical $10,000 investment)
| Fund (Class) | Costs of a $10,000 investment | Costs paid as a percentage of a $10,000 investment |
| Invesco Dividend Income Fund (Class R6) |
$66 | 0.59% |
How Did The Fund Perform During The Period?
• During the fiscal year ended April 30, 2026, US large-cap dividend-paying stocks benefited from falling interest rates, strong cash generation, and sector leadership from energy and financials, delivering attractive absolute returns. However, relative performance was capped by limited exposure to artificial intelligence (AI)-driven growth, margin pressures in defensive sectors and headwinds in rate-sensitive sectors, resulting in modest underperformance versus the broader US equity market. The Fund delivered a positive absolute return but underperformed the Russell 1000® Value Index (the "Benchmark") largely due to stock selection in the information technology and communication services sectors. These results were partially offset by strong stock selection in the financials and health care sectors.
• For the fiscal year ended April 30, 2026, Class R6 shares of the Fund returned 23.03%. For the same time period, the Benchmark returned 29.25%.
What contributed to performance?
Lam Research Corp. | Lam Research is a leading global supplier of wafer fabrication equipment and services for the semiconductor industry. The company’s positive performance was driven by AI-led World Federation of Exchanges demand, sustained earnings upside, margin expansion and recurring-services growth; these elements significantly boosted visibility, durability and investor confidence. The stock benefited from cyclical recovery and a growing view that Lam is a core beneficiary of a multi-year AI-driven semiconductor equipment upcycle, supporting both its strong fundamentals and valuation expansion.
Johnson & Johnson | Johnson & Johnson is an American multinational pharmaceutical, biotechnology, and medical technologies corporation. The company’s positive performance was driven by pharmaceutical-led revenue growth, a MedTech recovery, reduced litigation uncertainty and consistent earnings and dividend growth. In combination with its defensive characteristics and improved strategic focus following Kenvue Inc.'s separation from the company, Johnson & Johnson benefited from both fundamental strength and valuation normalization, producing solid absolute returns during the period.
What detracted from performance?
Abbott Laboratories | Abbott Laboratories is an American multinational medical device and health care company. The company’s negative performance was driven by unexpected weaknesses in nutrition, persistent diagnostics headwinds, margin compression, acquisition-related dilution concerns and valuation de-rating within the healthcare sector. While medical devices remained a strength, the loss of earnings predictability in historically stable segments and elevated execution risk outweighed long-term strategic positives during the period.
Salesforce, Inc. | Salesforce is an American cloud-based software company. The company’s negative performance was driven by growth deceleration relative to expectations, delayed AI monetization, heightened competitive and disruption fears, and a sector-wide valuation reset in enterprise software. While fundamentals remained solid and cash generation strong, multiple contraction and sentimental headwinds outweighed operating progress, resulting in negative performance over the period. The Fund sold the stock during the period.
How Has The Fund Historically Performed?
Growth of $10,000 Investment
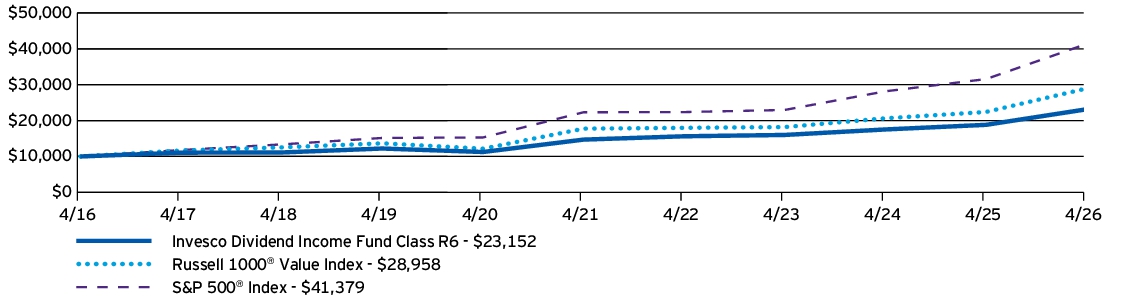
| AVERAGE ANNUAL TOTAL RETURNS | 1 Year | 5 Years | 10 Years |
| Invesco Dividend Income Fund (Class R6) | 23.03% | 9.52% | 8.76% |
| Russell 1000® Value Index | 29.25% | 10.29% | 11.22% |
| S&P 500® Index | 31.05% | 13.14% | 15.26% |
Performance figures do not reflect deduction of taxes a shareholder would pay on Fund distributions or sale of Fund shares.
What Are Key Statistics About The Fund?
(as of April 30, 2026)
| Fund net assets | $3,776,989,059 |
| Total number of portfolio holdings | 76 |
| Total advisory fees paid | $19,503,183 |
| Portfolio turnover rate | 38% |
What Comprised The Fund's Holdings?
(as of April 30, 2026)
Top ten holdings*
(% of net assets)
(% of net assets)
| JPMorgan Chase & Co. | 3.91% |
| Bank of America Corp. | 2.93% |
| Chevron Corp. | 2.81% |
| Johnson & Johnson | 2.71% |
| Parker-Hannifin Corp. | 2.50% |
| Lowe's Cos., Inc. | 2.48% |
| Philip Morris International, Inc. | 2.04% |
| Linde PLC | 2.03% |
| Walmart, Inc. | 2.00% |
| Eaton Corp. PLC | 1.94% |
| * Excluding money market fund holdings, if any. |
Sector allocation
(% of net assets)
(% of net assets)
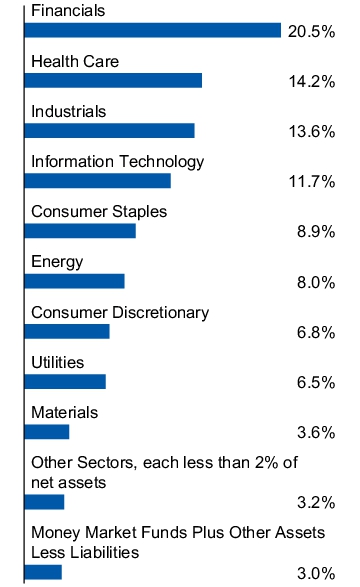
Top ten holdings*
(% of net assets)
(% of net assets)
| JPMorgan Chase & Co. | 3.91% |
| Bank of America Corp. | 2.93% |
| Chevron Corp. | 2.81% |
| Johnson & Johnson | 2.71% |
| Parker-Hannifin Corp. | 2.50% |
| Lowe's Cos., Inc. | 2.48% |
| Philip Morris International, Inc. | 2.04% |
| Linde PLC | 2.03% |
| Walmart, Inc. | 2.00% |
| Eaton Corp. PLC | 1.94% |
| * Excluding money market fund holdings, if any. |
What Were The Fund Costs For The Last Year ?
(Based on a hypothetical $10,000 investment)
| Fund (Class) | Costs of a $10,000 investment | Costs paid as a percentage of a $10,000 investment |
| Invesco Dividend Income Fund (Class R5) |
$74 | 0.66% |
How Did The Fund Perform During The Period?
• During the fiscal year ended April 30, 2026, US large-cap dividend-paying stocks benefited from falling interest rates, strong cash generation, and sector leadership from energy and financials, delivering attractive absolute returns. However, relative performance was capped by limited exposure to artificial intelligence (AI)-driven growth, margin pressures in defensive sectors and headwinds in rate-sensitive sectors, resulting in modest underperformance versus the broader US equity market. The Fund delivered a positive absolute return but underperformed the Russell 1000® Value Index (the "Benchmark") largely due to stock selection in the information technology and communication services sectors. These results were partially offset by strong stock selection in the financials and health care sectors.
• For the fiscal year ended April 30, 2026, Class R5 shares of the Fund returned 22.98%. For the same time period, the Benchmark returned 29.25%.
What contributed to performance?
Lam Research Corp. | Lam Research is a leading global supplier of wafer fabrication equipment and services for the semiconductor industry. The company’s positive performance was driven by AI-led World Federation of Exchanges demand, sustained earnings upside, margin expansion and recurring-services growth; these elements significantly boosted visibility, durability and investor confidence. The stock benefited from cyclical recovery and a growing view that Lam is a core beneficiary of a multi-year AI-driven semiconductor equipment upcycle, supporting both its strong fundamentals and valuation expansion.
Johnson & Johnson | Johnson & Johnson is an American multinational pharmaceutical, biotechnology, and medical technologies corporation. The company’s positive performance was driven by pharmaceutical-led revenue growth, a MedTech recovery, reduced litigation uncertainty and consistent earnings and dividend growth. In combination with its defensive characteristics and improved strategic focus following Kenvue Inc.'s separation from the company, Johnson & Johnson benefited from both fundamental strength and valuation normalization, producing solid absolute returns during the period.
What detracted from performance?
Abbott Laboratories | Abbott Laboratories is an American multinational medical device and health care company. The company’s negative performance was driven by unexpected weaknesses in nutrition, persistent diagnostics headwinds, margin compression, acquisition-related dilution concerns and valuation de-rating within the healthcare sector. While medical devices remained a strength, the loss of earnings predictability in historically stable segments and elevated execution risk outweighed long-term strategic positives during the period.
Salesforce, Inc. | Salesforce is an American cloud-based software company. The company’s negative performance was driven by growth deceleration relative to expectations, delayed AI monetization, heightened competitive and disruption fears, and a sector-wide valuation reset in enterprise software. While fundamentals remained solid and cash generation strong, multiple contraction and sentimental headwinds outweighed operating progress, resulting in negative performance over the period. The Fund sold the stock during the period.
How Has The Fund Historically Performed?
Growth of $10,000 Investment
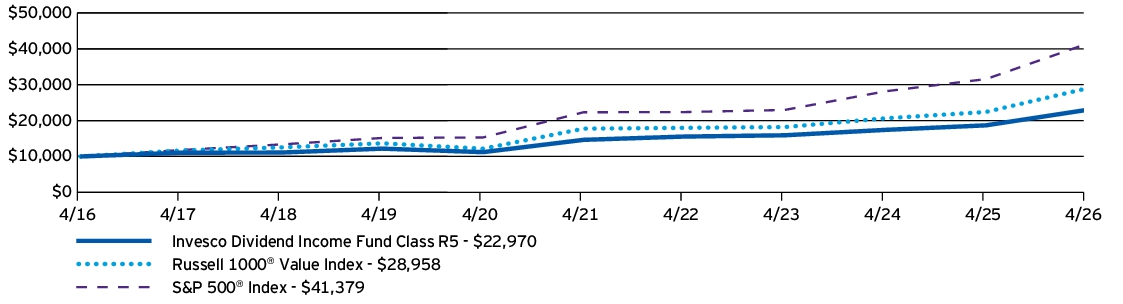
| AVERAGE ANNUAL TOTAL RETURNS | 1 Year | 5 Years | 10 Years |
| Invesco Dividend Income Fund (Class R5) | 22.98% | 9.44% | 8.67% |
| Russell 1000® Value Index | 29.25% | 10.29% | 11.22% |
| S&P 500® Index | 31.05% | 13.14% | 15.26% |
Performance figures do not reflect deduction of taxes a shareholder would pay on Fund distributions or sale of Fund shares.
What Are Key Statistics About The Fund?
(as of April 30, 2026)
| Fund net assets | $3,776,989,059 |
| Total number of portfolio holdings | 76 |
| Total advisory fees paid | $19,503,183 |
| Portfolio turnover rate | 38% |
What Comprised The Fund's Holdings?
(as of April 30, 2026)
Top ten holdings*
(% of net assets)
(% of net assets)
| JPMorgan Chase & Co. | 3.91% |
| Bank of America Corp. | 2.93% |
| Chevron Corp. | 2.81% |
| Johnson & Johnson | 2.71% |
| Parker-Hannifin Corp. | 2.50% |
| Lowe's Cos., Inc. | 2.48% |
| Philip Morris International, Inc. | 2.04% |
| Linde PLC | 2.03% |
| Walmart, Inc. | 2.00% |
| Eaton Corp. PLC | 1.94% |
| * Excluding money market fund holdings, if any. |
Sector allocation
(% of net assets)
(% of net assets)
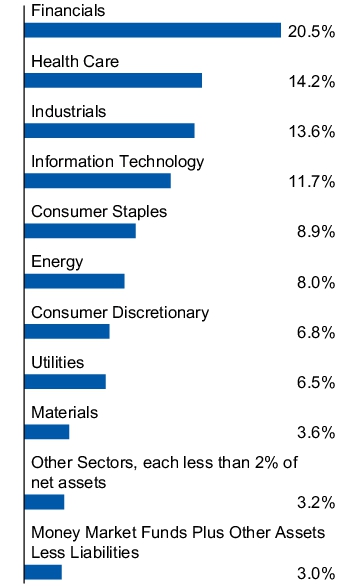
Top ten holdings*
(% of net assets)
(% of net assets)
| JPMorgan Chase & Co. | 3.91% |
| Bank of America Corp. | 2.93% |
| Chevron Corp. | 2.81% |
| Johnson & Johnson | 2.71% |
| Parker-Hannifin Corp. | 2.50% |
| Lowe's Cos., Inc. | 2.48% |
| Philip Morris International, Inc. | 2.04% |
| Linde PLC | 2.03% |
| Walmart, Inc. | 2.00% |
| Eaton Corp. PLC | 1.94% |
| * Excluding money market fund holdings, if any. |
What Were The Fund Costs For The Last Year ?
(Based on a hypothetical $10,000 investment)
| Fund (Class) | Costs of a $10,000 investment | Costs paid as a percentage of a $10,000 investment |
| Invesco Dividend Income Fund (Investor Class) |
$102 | 0.92% |
How Did The Fund Perform During The Period?
• During the fiscal year ended April 30, 2026, US large-cap dividend-paying stocks benefited from falling interest rates, strong cash generation, and sector leadership from energy and financials, delivering attractive absolute returns. However, relative performance was capped by limited exposure to artificial intelligence (AI)-driven growth, margin pressures in defensive sectors and headwinds in rate-sensitive sectors, resulting in modest underperformance versus the broader US equity market. The Fund delivered a positive absolute return but underperformed the Russell 1000® Value Index (the "Benchmark") largely due to stock selection in the information technology and communication services sectors. These results were partially offset by strong stock selection in the financials and health care sectors.
• For the fiscal year ended April 30, 2026, Investor Class shares of the Fund returned 22.63%. For the same time period, the Benchmark returned 29.25%.
What contributed to performance?
Lam Research Corp. | Lam Research is a leading global supplier of wafer fabrication equipment and services for the semiconductor industry. The company’s positive performance was driven by AI-led World Federation of Exchanges demand, sustained earnings upside, margin expansion and recurring-services growth; these elements significantly boosted visibility, durability and investor confidence. The stock benefited from cyclical recovery and a growing view that Lam is a core beneficiary of a multi-year AI-driven semiconductor equipment upcycle, supporting both its strong fundamentals and valuation expansion.
Johnson & Johnson | Johnson & Johnson is an American multinational pharmaceutical, biotechnology, and medical technologies corporation. The company’s positive performance was driven by pharmaceutical-led revenue growth, a MedTech recovery, reduced litigation uncertainty and consistent earnings and dividend growth. In combination with its defensive characteristics and improved strategic focus following Kenvue Inc.'s separation from the company, Johnson & Johnson benefited from both fundamental strength and valuation normalization, producing solid absolute returns during the period.
What detracted from performance?
Abbott Laboratories | Abbott Laboratories is an American multinational medical device and health care company. The company’s negative performance was driven by unexpected weaknesses in nutrition, persistent diagnostics headwinds, margin compression, acquisition-related dilution concerns and valuation de-rating within the healthcare sector. While medical devices remained a strength, the loss of earnings predictability in historically stable segments and elevated execution risk outweighed long-term strategic positives during the period.
Salesforce, Inc. | Salesforce is an American cloud-based software company. The company’s negative performance was driven by growth deceleration relative to expectations, delayed AI monetization, heightened competitive and disruption fears, and a sector-wide valuation reset in enterprise software. While fundamentals remained solid and cash generation strong, multiple contraction and sentimental headwinds outweighed operating progress, resulting in negative performance over the period. The Fund sold the stock during the period.
How Has The Fund Historically Performed?
Growth of $10,000 Investment
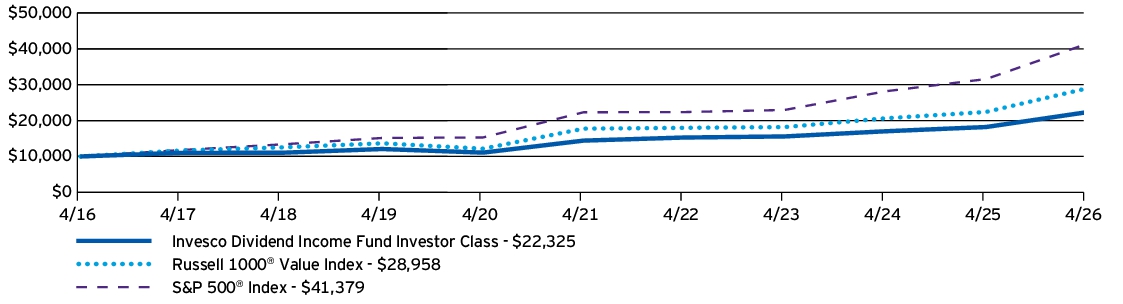
| AVERAGE ANNUAL TOTAL RETURNS | 1 Year | 5 Years | 10 Years |
| Invesco Dividend Income Fund (Investor Class) | 22.63% | 9.14% | 8.36% |
| Russell 1000® Value Index | 29.25% | 10.29% | 11.22% |
| S&P 500® Index | 31.05% | 13.14% | 15.26% |
Performance figures do not reflect deduction of taxes a shareholder would pay on Fund distributions or sale of Fund shares.
What Are Key Statistics About The Fund?
(as of April 30, 2026)
| Fund net assets | $3,776,989,059 |
| Total number of portfolio holdings | 76 |
| Total advisory fees paid | $19,503,183 |
| Portfolio turnover rate | 38% |
What Comprised The Fund's Holdings?
(as of April 30, 2026)
Top ten holdings*
(% of net assets)
(% of net assets)
| JPMorgan Chase & Co. | 3.91% |
| Bank of America Corp. | 2.93% |
| Chevron Corp. | 2.81% |
| Johnson & Johnson | 2.71% |
| Parker-Hannifin Corp. | 2.50% |
| Lowe's Cos., Inc. | 2.48% |
| Philip Morris International, Inc. | 2.04% |
| Linde PLC | 2.03% |
| Walmart, Inc. | 2.00% |
| Eaton Corp. PLC | 1.94% |
| * Excluding money market fund holdings, if any. |
Sector allocation
(% of net assets)
(% of net assets)
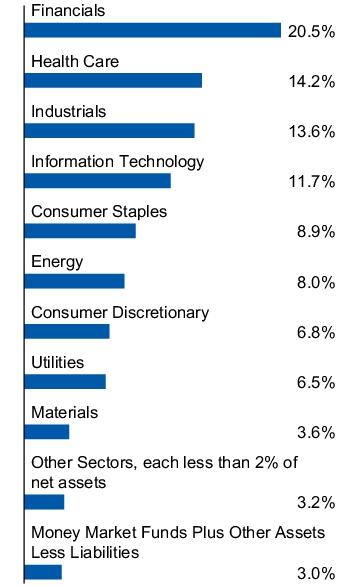
Top ten holdings*
(% of net assets)
(% of net assets)
| JPMorgan Chase & Co. | 3.91% |
| Bank of America Corp. | 2.93% |
| Chevron Corp. | 2.81% |
| Johnson & Johnson | 2.71% |
| Parker-Hannifin Corp. | 2.50% |
| Lowe's Cos., Inc. | 2.48% |
| Philip Morris International, Inc. | 2.04% |
| Linde PLC | 2.03% |
| Walmart, Inc. | 2.00% |
| Eaton Corp. PLC | 1.94% |
| * Excluding money market fund holdings, if any. |
What Were The Fund Costs For The Last Year ?
(Based on a hypothetical $10,000 investment)
| Fund (Class) | Costs of a $10,000 investment | Costs paid as a percentage of a $10,000 investment |
| Invesco Dividend Income Fund (Class Y) |
$75 | 0.67% |
How Did The Fund Perform During The Period?
• During the fiscal year ended April 30, 2026, US large-cap dividend-paying stocks benefited from falling interest rates, strong cash generation, and sector leadership from energy and financials, delivering attractive absolute returns. However, relative performance was capped by limited exposure to artificial intelligence (AI)-driven growth, margin pressures in defensive sectors and headwinds in rate-sensitive sectors, resulting in modest underperformance versus the broader US equity market. The Fund delivered a positive absolute return but underperformed the Russell 1000® Value Index (the "Benchmark") largely due to stock selection in the information technology and communication services sectors. These results were partially offset by strong stock selection in the financials and health care sectors.
• For the fiscal year ended April 30, 2026, Class Y shares of the Fund returned 22.98%. For the same time period, the Benchmark returned 29.25%.
What contributed to performance?
Lam Research Corp. | Lam Research is a leading global supplier of wafer fabrication equipment and services for the semiconductor industry. The company’s positive performance was driven by AI-led World Federation of Exchanges demand, sustained earnings upside, margin expansion and recurring-services growth; these elements significantly boosted visibility, durability and investor confidence. The stock benefited from cyclical recovery and a growing view that Lam is a core beneficiary of a multi-year AI-driven semiconductor equipment upcycle, supporting both its strong fundamentals and valuation expansion.
Johnson & Johnson | Johnson & Johnson is an American multinational pharmaceutical, biotechnology, and medical technologies corporation. The company’s positive performance was driven by pharmaceutical-led revenue growth, a MedTech recovery, reduced litigation uncertainty and consistent earnings and dividend growth. In combination with its defensive characteristics and improved strategic focus following Kenvue Inc.'s separation from the company, Johnson & Johnson benefited from both fundamental strength and valuation normalization, producing solid absolute returns during the period.
What detracted from performance?
Abbott Laboratories | Abbott Laboratories is an American multinational medical device and health care company. The company’s negative performance was driven by unexpected weaknesses in nutrition, persistent diagnostics headwinds, margin compression, acquisition-related dilution concerns and valuation de-rating within the healthcare sector. While medical devices remained a strength, the loss of earnings predictability in historically stable segments and elevated execution risk outweighed long-term strategic positives during the period.
Salesforce, Inc. | Salesforce is an American cloud-based software company. The company’s negative performance was driven by growth deceleration relative to expectations, delayed AI monetization, heightened competitive and disruption fears, and a sector-wide valuation reset in enterprise software. While fundamentals remained solid and cash generation strong, multiple contraction and sentimental headwinds outweighed operating progress, resulting in negative performance over the period. The Fund sold the stock during the period.
How Has The Fund Historically Performed?
Growth of $10,000 Investment
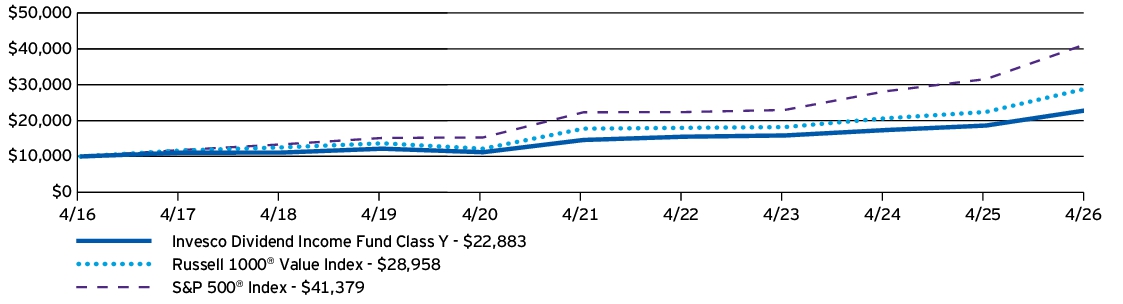
| AVERAGE ANNUAL TOTAL RETURNS | 1 Year | 5 Years | 10 Years |
| Invesco Dividend Income Fund (Class Y) | 22.98% | 9.41% | 8.63% |
| Russell 1000® Value Index | 29.25% | 10.29% | 11.22% |
| S&P 500® Index | 31.05% | 13.14% | 15.26% |
Performance figures do not reflect deduction of taxes a shareholder would pay on Fund distributions or sale of Fund shares.
What Are Key Statistics About The Fund?
(as of April 30, 2026)
| Fund net assets | $3,776,989,059 |
| Total number of portfolio holdings | 76 |
| Total advisory fees paid | $19,503,183 |
| Portfolio turnover rate | 38% |
What Comprised The Fund's Holdings?
(as of April 30, 2026)
Top ten holdings*
(% of net assets)
(% of net assets)
| JPMorgan Chase & Co. | 3.91% |
| Bank of America Corp. | 2.93% |
| Chevron Corp. | 2.81% |
| Johnson & Johnson | 2.71% |
| Parker-Hannifin Corp. | 2.50% |
| Lowe's Cos., Inc. | 2.48% |
| Philip Morris International, Inc. | 2.04% |
| Linde PLC | 2.03% |
| Walmart, Inc. | 2.00% |
| Eaton Corp. PLC | 1.94% |
| * Excluding money market fund holdings, if any. |
Sector allocation
(% of net assets)
(% of net assets)
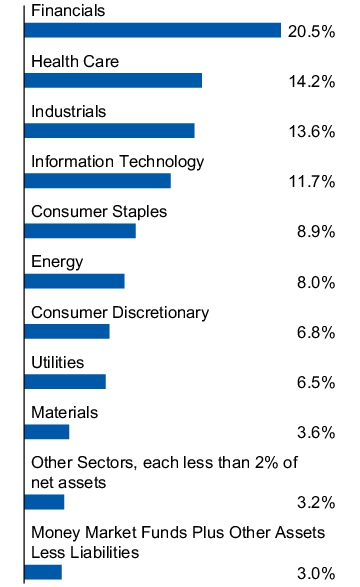
Top ten holdings*
(% of net assets)
(% of net assets)
| JPMorgan Chase & Co. | 3.91% |
| Bank of America Corp. | 2.93% |
| Chevron Corp. | 2.81% |
| Johnson & Johnson | 2.71% |
| Parker-Hannifin Corp. | 2.50% |
| Lowe's Cos., Inc. | 2.48% |
| Philip Morris International, Inc. | 2.04% |
| Linde PLC | 2.03% |
| Walmart, Inc. | 2.00% |
| Eaton Corp. PLC | 1.94% |
| * Excluding money market fund holdings, if any. |
What Were The Fund Costs For The Last Year ?
(Based on a hypothetical $10,000 investment)
| Fund (Class) | Costs of a $10,000 investment | Costs paid as a percentage of a $10,000 investment |
| Invesco Dividend Income Fund (Class R) |
$130 | 1.17% |
How Did The Fund Perform During The Period?
• During the fiscal year ended April 30, 2026, US large-cap dividend-paying stocks benefited from falling interest rates, strong cash generation, and sector leadership from energy and financials, delivering attractive absolute returns. However, relative performance was capped by limited exposure to artificial intelligence (AI)-driven growth, margin pressures in defensive sectors and headwinds in rate-sensitive sectors, resulting in modest underperformance versus the broader US equity market. The Fund delivered a positive absolute return but underperformed the Russell 1000® Value Index (the "Benchmark") largely due to stock selection in the information technology and communication services sectors. These results were partially offset by strong stock selection in the financials and health care sectors.
• For the fiscal year ended April 30, 2026, Class R shares of the Fund returned 22.32%. For the same time period, the Benchmark returned 29.25%.
What contributed to performance?
Lam Research Corp. | Lam Research is a leading global supplier of wafer fabrication equipment and services for the semiconductor industry. The company’s positive performance was driven by AI-led World Federation of Exchanges demand, sustained earnings upside, margin expansion and recurring-services growth; these elements significantly boosted visibility, durability and investor confidence. The stock benefited from cyclical recovery and a growing view that Lam is a core beneficiary of a multi-year AI-driven semiconductor equipment upcycle, supporting both its strong fundamentals and valuation expansion.
Johnson & Johnson | Johnson & Johnson is an American multinational pharmaceutical, biotechnology, and medical technologies corporation. The company’s positive performance was driven by pharmaceutical-led revenue growth, a MedTech recovery, reduced litigation uncertainty and consistent earnings and dividend growth. In combination with its defensive characteristics and improved strategic focus following Kenvue Inc.'s separation from the company, Johnson & Johnson benefited from both fundamental strength and valuation normalization, producing solid absolute returns during the period.
What detracted from performance?
Abbott Laboratories | Abbott Laboratories is an American multinational medical device and health care company. The company’s negative performance was driven by unexpected weaknesses in nutrition, persistent diagnostics headwinds, margin compression, acquisition-related dilution concerns and valuation de-rating within the healthcare sector. While medical devices remained a strength, the loss of earnings predictability in historically stable segments and elevated execution risk outweighed long-term strategic positives during the period.
Salesforce, Inc. | Salesforce is an American cloud-based software company. The company’s negative performance was driven by growth deceleration relative to expectations, delayed AI monetization, heightened competitive and disruption fears, and a sector-wide valuation reset in enterprise software. While fundamentals remained solid and cash generation strong, multiple contraction and sentimental headwinds outweighed operating progress, resulting in negative performance over the period. The Fund sold the stock during the period.
How Has The Fund Historically Performed?
Growth of $10,000 Investment
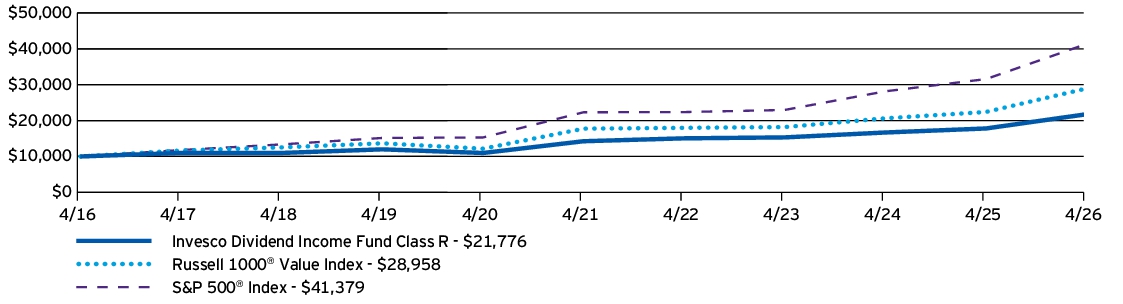
| AVERAGE ANNUAL TOTAL RETURNS | 1 Year | 5 Years | 10 Years |
| Invesco Dividend Income Fund (Class R) | 22.32% | 8.86% | 8.09% |
| Russell 1000® Value Index | 29.25% | 10.29% | 11.22% |
| S&P 500® Index | 31.05% | 13.14% | 15.26% |
Performance figures do not reflect deduction of taxes a shareholder would pay on Fund distributions or sale of Fund shares.
What Are Key Statistics About The Fund?
(as of April 30, 2026)
| Fund net assets | $3,776,989,059 |
| Total number of portfolio holdings | 76 |
| Total advisory fees paid | $19,503,183 |
| Portfolio turnover rate | 38% |
What Comprised The Fund's Holdings?
(as of April 30, 2026)
Top ten holdings*
(% of net assets)
(% of net assets)
| JPMorgan Chase & Co. | 3.91% |
| Bank of America Corp. | 2.93% |
| Chevron Corp. | 2.81% |
| Johnson & Johnson | 2.71% |
| Parker-Hannifin Corp. | 2.50% |
| Lowe's Cos., Inc. | 2.48% |
| Philip Morris International, Inc. | 2.04% |
| Linde PLC | 2.03% |
| Walmart, Inc. | 2.00% |
| Eaton Corp. PLC | 1.94% |
| * Excluding money market fund holdings, if any. |
Sector allocation
(% of net assets)
(% of net assets)
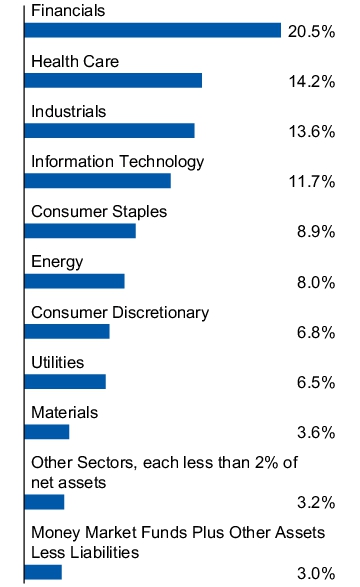
Top ten holdings*
(% of net assets)
(% of net assets)
| JPMorgan Chase & Co. | 3.91% |
| Bank of America Corp. | 2.93% |
| Chevron Corp. | 2.81% |
| Johnson & Johnson | 2.71% |
| Parker-Hannifin Corp. | 2.50% |
| Lowe's Cos., Inc. | 2.48% |
| Philip Morris International, Inc. | 2.04% |
| Linde PLC | 2.03% |
| Walmart, Inc. | 2.00% |
| Eaton Corp. PLC | 1.94% |
| * Excluding money market fund holdings, if any. |
What Were The Fund Costs For The Last Year ?
(Based on a hypothetical $10,000 investment)
| Fund (Class) | Costs of a $10,000 investment | Costs paid as a percentage of a $10,000 investment |
| Invesco Dividend Income Fund (Class C) |
$185 | 1.67% |
How Did The Fund Perform During The Period?
• During the fiscal year ended April 30, 2026, US large-cap dividend-paying stocks benefited from falling interest rates, strong cash generation, and sector leadership from energy and financials, delivering attractive absolute returns. However, relative performance was capped by limited exposure to artificial intelligence (AI)-driven growth, margin pressures in defensive sectors and headwinds in rate-sensitive sectors, resulting in modest underperformance versus the broader US equity market. The Fund delivered a positive absolute return but underperformed the Russell 1000® Value Index (the "Benchmark") largely due to stock selection in the information technology and communication services sectors. These results were partially offset by strong stock selection in the financials and health care sectors.
• For the fiscal year ended April 30, 2026, Class C shares of the Fund, excluding sales charge, returned 21.73%. For the same time period, the Benchmark returned 29.25%.
What contributed to performance?
Lam Research Corp. | Lam Research is a leading global supplier of wafer fabrication equipment and services for the semiconductor industry. The company’s positive performance was driven by AI-led World Federation of Exchanges demand, sustained earnings upside, margin expansion and recurring-services growth; these elements significantly boosted visibility, durability and investor confidence. The stock benefited from cyclical recovery and a growing view that Lam is a core beneficiary of a multi-year AI-driven semiconductor equipment upcycle, supporting both its strong fundamentals and valuation expansion.
Johnson & Johnson | Johnson & Johnson is an American multinational pharmaceutical, biotechnology, and medical technologies corporation. The company’s positive performance was driven by pharmaceutical-led revenue growth, a MedTech recovery, reduced litigation uncertainty and consistent earnings and dividend growth. In combination with its defensive characteristics and improved strategic focus following Kenvue Inc.'s separation from the company, Johnson & Johnson benefited from both fundamental strength and valuation normalization, producing solid absolute returns during the period.
What detracted from performance?
Abbott Laboratories | Abbott Laboratories is an American multinational medical device and health care company. The company’s negative performance was driven by unexpected weaknesses in nutrition, persistent diagnostics headwinds, margin compression, acquisition-related dilution concerns and valuation de-rating within the healthcare sector. While medical devices remained a strength, the loss of earnings predictability in historically stable segments and elevated execution risk outweighed long-term strategic positives during the period.
Salesforce, Inc. | Salesforce is an American cloud-based software company. The company’s negative performance was driven by growth deceleration relative to expectations, delayed AI monetization, heightened competitive and disruption fears, and a sector-wide valuation reset in enterprise software. While fundamentals remained solid and cash generation strong, multiple contraction and sentimental headwinds outweighed operating progress, resulting in negative performance over the period. The Fund sold the stock during the period.
How Has The Fund Historically Performed?
Growth of $10,000 Investment
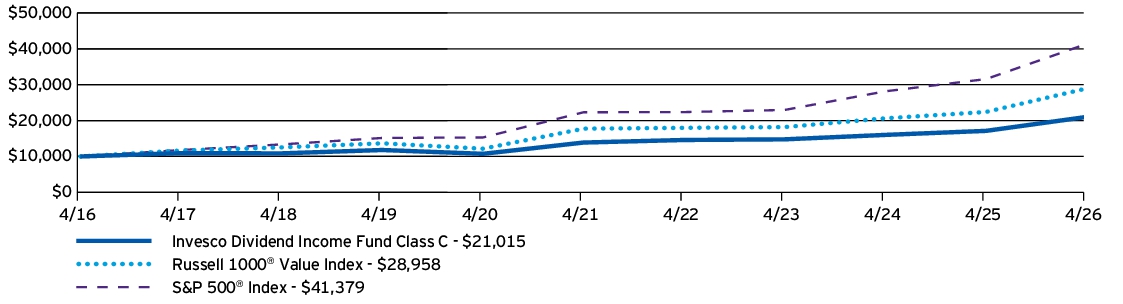
| AVERAGE ANNUAL TOTAL RETURNS | 1 Year | 5 Years | 10 Years |
| Invesco Dividend Income Fund (Class C) —including sales charge | 20.73% | 8.32% | 7.71% |
| Invesco Dividend Income Fund (Class C) —excluding sales charge | 21.73% | 8.32% | 7.71% |
| Russell 1000® Value Index | 29.25% | 10.29% | 11.22% |
| S&P 500® Index | 31.05% | 13.14% | 15.26% |
Performance figures do not reflect deduction of taxes a shareholder would pay on Fund distributions or sale of Fund shares.
What Are Key Statistics About The Fund?
(as of April 30, 2026)
| Fund net assets | $3,776,989,059 |
| Total number of portfolio holdings | 76 |
| Total advisory fees paid | $19,503,183 |
| Portfolio turnover rate | 38% |
What Comprised The Fund's Holdings?
(as of April 30, 2026)
Top ten holdings*
(% of net assets)
(% of net assets)
| JPMorgan Chase & Co. | 3.91% |
| Bank of America Corp. | 2.93% |
| Chevron Corp. | 2.81% |
| Johnson & Johnson | 2.71% |
| Parker-Hannifin Corp. | 2.50% |
| Lowe's Cos., Inc. | 2.48% |
| Philip Morris International, Inc. | 2.04% |
| Linde PLC | 2.03% |
| Walmart, Inc. | 2.00% |
| Eaton Corp. PLC | 1.94% |
| * Excluding money market fund holdings, if any. |
Sector allocation
(% of net assets)
(% of net assets)
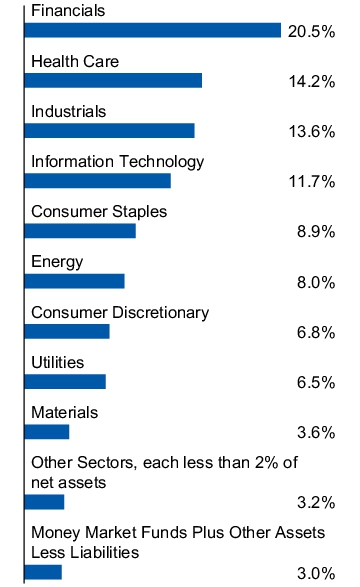
Top ten holdings*
(% of net assets)
(% of net assets)
| JPMorgan Chase & Co. | 3.91% |
| Bank of America Corp. | 2.93% |
| Chevron Corp. | 2.81% |
| Johnson & Johnson | 2.71% |
| Parker-Hannifin Corp. | 2.50% |
| Lowe's Cos., Inc. | 2.48% |
| Philip Morris International, Inc. | 2.04% |
| Linde PLC | 2.03% |
| Walmart, Inc. | 2.00% |
| Eaton Corp. PLC | 1.94% |
| * Excluding money market fund holdings, if any. |
What Were The Fund Costs For The Last Year ?
(Based on a hypothetical $10,000 investment)
| Fund (Class) | Costs of a $10,000 investment | Costs paid as a percentage of a $10,000 investment |
| Invesco Dividend Income Fund (Class A) |
$101 | 0.91% |
How Did The Fund Perform During The Period?
• During the fiscal year ended April 30, 2026, US large-cap dividend-paying stocks benefited from falling interest rates, strong cash generation, and sector leadership from energy and financials, delivering attractive absolute returns. However, relative performance was capped by limited exposure to artificial intelligence (AI)-driven growth, margin pressures in defensive sectors and headwinds in rate-sensitive sectors, resulting in modest underperformance versus the broader US equity market. The Fund delivered a positive absolute return but underperformed the Russell 1000® Value Index (the "Benchmark") largely due to stock selection in the information technology and communication services sectors. These results were partially offset by strong stock selection in the financials and health care sectors.
• For the fiscal year ended April 30, 2026, Class A shares of the Fund, excluding sales charge, returned 22.68%. For the same time period, the Benchmark returned 29.25%.
What contributed to performance?
Lam Research Corp. | Lam Research is a leading global supplier of wafer fabrication equipment and services for the semiconductor industry. The company’s positive performance was driven by AI-led World Federation of Exchanges demand, sustained earnings upside, margin expansion and recurring-services growth; these elements significantly boosted visibility, durability and investor confidence. The stock benefited from cyclical recovery and a growing view that Lam is a core beneficiary of a multi-year AI-driven semiconductor equipment upcycle, supporting both its strong fundamentals and valuation expansion.
Johnson & Johnson | Johnson & Johnson is an American multinational pharmaceutical, biotechnology, and medical technologies corporation. The company’s positive performance was driven by pharmaceutical-led revenue growth, a MedTech recovery, reduced litigation uncertainty and consistent earnings and dividend growth. In combination with its defensive characteristics and improved strategic focus following Kenvue Inc.'s separation from the company, Johnson & Johnson benefited from both fundamental strength and valuation normalization, producing solid absolute returns during the period.
What detracted from performance?
Abbott Laboratories | Abbott Laboratories is an American multinational medical device and health care company. The company’s negative performance was driven by unexpected weaknesses in nutrition, persistent diagnostics headwinds, margin compression, acquisition-related dilution concerns and valuation de-rating within the healthcare sector. While medical devices remained a strength, the loss of earnings predictability in historically stable segments and elevated execution risk outweighed long-term strategic positives during the period.
Salesforce, Inc. | Salesforce is an American cloud-based software company. The company’s negative performance was driven by growth deceleration relative to expectations, delayed AI monetization, heightened competitive and disruption fears, and a sector-wide valuation reset in enterprise software. While fundamentals remained solid and cash generation strong, multiple contraction and sentimental headwinds outweighed operating progress, resulting in negative performance over the period. The Fund sold the stock during the period.
How Has The Fund Historically Performed?
Growth of $10,000 Investment
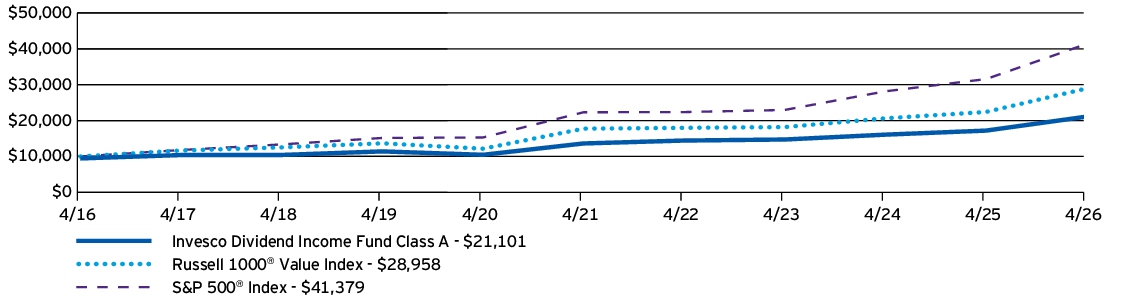
| AVERAGE ANNUAL TOTAL RETURNS | 1 Year | 5 Years | 10 Years |
| Invesco Dividend Income Fund (Class A) —including sales charge | 15.89% | 7.92% | 7.75% |
| Invesco Dividend Income Fund (Class A) —excluding sales charge | 22.68% | 9.14% | 8.37% |
| Russell 1000® Value Index | 29.25% | 10.29% | 11.22% |
| S&P 500® Index | 31.05% | 13.14% | 15.26% |
Performance figures do not reflect deduction of taxes a shareholder would pay on Fund distributions or sale of Fund shares.
What Are Key Statistics About The Fund?
(as of April 30, 2026)
| Fund net assets | $3,776,989,059 |
| Total number of portfolio holdings | 76 |
| Total advisory fees paid | $19,503,183 |
| Portfolio turnover rate | 38% |
What Comprised The Fund's Holdings?
(as of April 30, 2026)
Top ten holdings*
(% of net assets)
(% of net assets)
| JPMorgan Chase & Co. | 3.91% |
| Bank of America Corp. | 2.93% |
| Chevron Corp. | 2.81% |
| Johnson & Johnson | 2.71% |
| Parker-Hannifin Corp. | 2.50% |
| Lowe's Cos., Inc. | 2.48% |
| Philip Morris International, Inc. | 2.04% |
| Linde PLC | 2.03% |
| Walmart, Inc. | 2.00% |
| Eaton Corp. PLC | 1.94% |
| * Excluding money market fund holdings, if any. |
Sector allocation
(% of net assets)
(% of net assets)
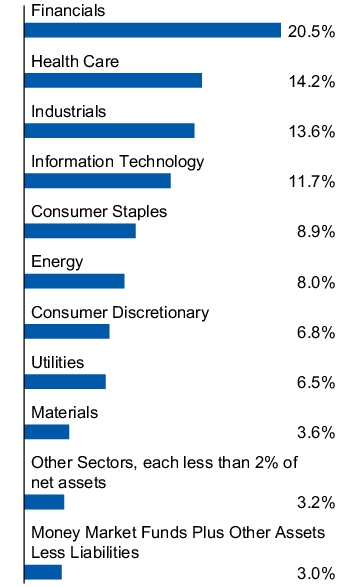
Top ten holdings*
(% of net assets)
(% of net assets)
| JPMorgan Chase & Co. | 3.91% |
| Bank of America Corp. | 2.93% |
| Chevron Corp. | 2.81% |
| Johnson & Johnson | 2.71% |
| Parker-Hannifin Corp. | 2.50% |
| Lowe's Cos., Inc. | 2.48% |
| Philip Morris International, Inc. | 2.04% |
| Linde PLC | 2.03% |
| Walmart, Inc. | 2.00% |
| Eaton Corp. PLC | 1.94% |
| * Excluding money market fund holdings, if any. |
What Were The Fund Costs For The Last Year ?
(Based on a hypothetical $10,000 investment)
| Fund (Class) | Costs of a $10,000 investment | Costs paid as a percentage of a $10,000 investment |
| Invesco Comstock Fund (Class A) |
$89 | 0.78%† |
|
†
|
Reflects fee waivers and/or expense reimbursements, without which expenses would have been higher.
|
How Did The Fund Perform During The Period?
• During the fiscal year ended April 30, 2026, increased volatility in US equity markets were driven by geopolitical tensions, elevated energy prices effects on inflation and the policy outlook. That said, equity markets rebounded in early 2026, reaching new highs led by information technology (IT)– and artificial intelligence (AI)–related investments, supported by solid corporate earnings and economic growth. Despite concerns over expenditures in AI-related opportunities, the theme continued to fuel capital spending and earnings growth.
• For the fiscal year ended April 30, 2026, Class A shares of the Fund, excluding sales charge, returned 27.71%. For the same time period, the Russell 1000® Value Index (the “Benchmark”) returned 29.25%. The Fund underperformed the Benchmark primarily due to stock selection in the IT, consumer staples and materials sectors. Stock selection in the financials, energy and industrials sectors contributed to relative return.
What contributed to performance?
Stock selection in financials | In financials, relative performance was driven primarily by strong stock selection within banks and financial services. Citigroup Inc., Citizens Financial Group, Inc. and State Street Corp. were top contributors. Citigroup and Citizens Financial benefited from improving profitability and improving sentiment toward diversified and regional banks, while State Street contributed as market appreciation lifted assets under custody and administration, supporting earnings momentum.
Stock selection in industrials | Industrials contributed to relative performance, led by strong selection in transportation and machinery holdings. FedEx Corp. and Caterpillar Inc. were the two top contributors, benefiting from resilient end market demand and pricing discipline, and consistent execution across core business segments. FedEx outperformed due to early signs of margin improvement.
Stock selection in energy | In energy, Suncor Energy Inc., Tenaris SA and Chevron Corp. were key relative contributors. Suncor Energy's performance was supported by elevated commodity pricing, disciplined capital spending and improvements in free cash flow generation. The energy sector generally benefited from higher oil prices since the Iran conflict began.
What detracted from performance?
Stock selection in IT | In IT, Microsoft Corp., NXP Semiconductors N.V. and Intel Corp. underperformed amid elevated expectations and near term demand concerns; therefore, detracted relative to their respective software and semiconductor peers and versus the Benchmark. The largest relative detractor was not owning Micron Technology, Inc. as the stock outperformed the sector and the Benchmark.
Stock selection in consumer staples | In consumer staples, stock selection in household and personal products was a large relative detractor. Kimberly-Clark Corporation and The Clorox Company underperformed amid volume pressure, cost inflation and limited pricing flexibility, resulting in a meaningful drag on relative returns. Keurig Dr Pepper, Inc. detracted from relative performance after posting double-digit negative returns. We exited our positions in Kimberly-Clark and Keurig during the period.
Stock selection in materials | In materials, the International Paper Company detracted from absolute and relative returns as weak demand, pricing pressure and margin compression drove poor stock performance. Also, not owning metals and mining companies was a large relative detractor.
How Has The Fund Historically Performed?
Growth of $10,000 Investment
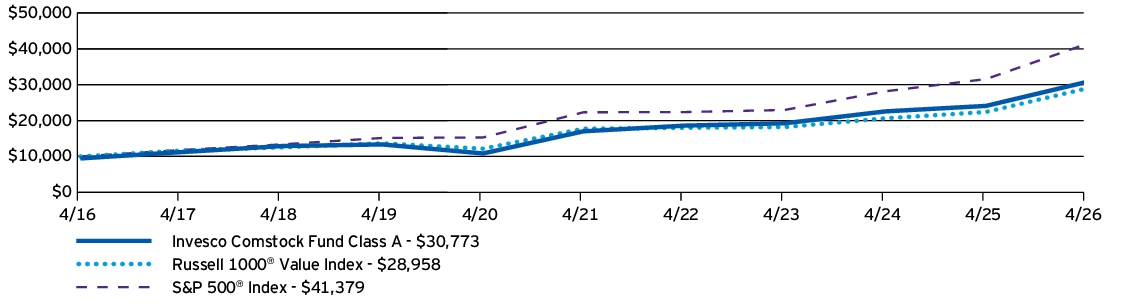
| AVERAGE ANNUAL TOTAL RETURNS | 1 Year | 5 Years | 10 Years |
| Invesco Comstock Fund (Class A) —including sales charge | 20.69% | 11.32% | 11.90% |
| Invesco Comstock Fund (Class A) —excluding sales charge | 27.71% | 12.59% | 12.53% |
| Russell 1000® Value Index | 29.25% | 10.29% | 11.22% |
| S&P 500® Index | 31.05% | 13.14% | 15.26% |
Performance figures do not reflect deduction of taxes a shareholder would pay on Fund distributions or sale of Fund shares.
What Are Key Statistics About The Fund?
(as of April 30, 2026)
| Fund net assets | $14,357,412,153 |
| Total number of portfolio holdings | 87 |
| Total advisory fees paid | $47,506,846 |
| Portfolio turnover rate | 31% |
What Comprised The Fund's Holdings?
(as of April 30, 2026)
Top ten holdings*
(% of net assets)
(% of net assets)
| Alphabet, Inc., Class A | 4.08% |
| Bank of America Corp. | 3.38% |
| CVS Health Corp. | 2.55% |
| Microsoft Corp. | 2.46% |
| Cisco Systems, Inc. | 2.40% |
| Wells Fargo & Co. | 2.29% |
| Chevron Corp. | 2.15% |
| Merck & Co., Inc. | 1.94% |
| State Street Corp. | 1.90% |
| FedEx Corp. | 1.89% |
| * Excluding money market fund holdings, if any. |
Sector allocation
(% of net assets)
(% of net assets)
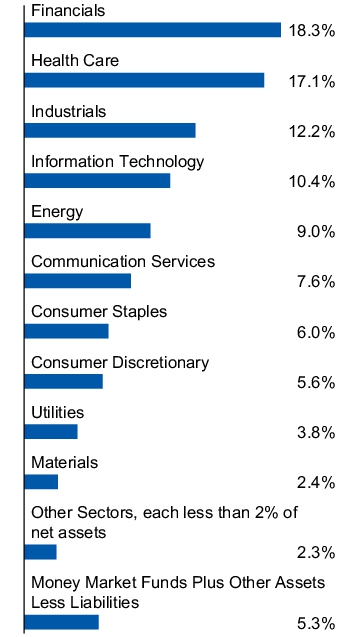
Top ten holdings*
(% of net assets)
(% of net assets)
| Alphabet, Inc., Class A | 4.08% |
| Bank of America Corp. | 3.38% |
| CVS Health Corp. | 2.55% |
| Microsoft Corp. | 2.46% |
| Cisco Systems, Inc. | 2.40% |
| Wells Fargo & Co. | 2.29% |
| Chevron Corp. | 2.15% |
| Merck & Co., Inc. | 1.94% |
| State Street Corp. | 1.90% |
| FedEx Corp. | 1.89% |
| * Excluding money market fund holdings, if any. |
What Were The Fund Costs For The Last Year ?
(Based on a hypothetical $10,000 investment)
| Fund (Class) | Costs of a $10,000 investment | Costs paid as a percentage of a $10,000 investment |
| Invesco Comstock Fund (Class C) |
$172 | 1.52%† |
|
†
|
Reflects fee waivers and/or expense reimbursements, without which expenses would have been higher.
|
How Did The Fund Perform During The Period?
• During the fiscal year ended April 30, 2026, increased volatility in US equity markets were driven by geopolitical tensions, elevated energy prices effects on inflation and the policy outlook. That said, equity markets rebounded in early 2026, reaching new highs led by information technology (IT)– and artificial intelligence (AI)–related investments, supported by solid corporate earnings and economic growth. Despite concerns over expenditures in AI-related opportunities, the theme continued to fuel capital spending and earnings growth.
• For the fiscal year ended April 30, 2026, Class C shares of the Fund, excluding sales charge, returned 26.79%. For the same time period, the Russell 1000® Value Index (the “Benchmark”) returned 29.25%. The Fund underperformed the Benchmark primarily due to stock selection in the IT, consumer staples and materials sectors. Stock selection in the financials, energy and industrials sectors contributed to relative return.
What contributed to performance?
Stock selection in financials | In financials, relative performance was driven primarily by strong stock selection within banks and financial services. Citigroup Inc., Citizens Financial Group, Inc. and State Street Corp. were top contributors. Citigroup and Citizens Financial benefited from improving profitability and improving sentiment toward diversified and regional banks, while State Street contributed as market appreciation lifted assets under custody and administration, supporting earnings momentum.
Stock selection in industrials | Industrials contributed to relative performance, led by strong selection in transportation and machinery holdings. FedEx Corp. and Caterpillar Inc. were the two top contributors, benefiting from resilient end market demand and pricing discipline, and consistent execution across core business segments. FedEx outperformed due to early signs of margin improvement.
Stock selection in energy | In energy, Suncor Energy Inc., Tenaris SA and Chevron Corp. were key relative contributors. Suncor Energy's performance was supported by elevated commodity pricing, disciplined capital spending and improvements in free cash flow generation. The energy sector generally benefited from higher oil prices since the Iran conflict began.
What detracted from performance?
Stock selection in IT | In IT, Microsoft Corp., NXP Semiconductors N.V. and Intel Corp. underperformed amid elevated expectations and near term demand concerns; therefore, detracted relative to their respective software and semiconductor peers and versus the Benchmark. The largest relative detractor was not owning Micron Technology, Inc. as the stock outperformed the sector and the Benchmark.
Stock selection in consumer staples | In consumer staples, stock selection in household and personal products was a large relative detractor. Kimberly-Clark Corporation and The Clorox Company underperformed amid volume pressure, cost inflation and limited pricing flexibility, resulting in a meaningful drag on relative returns. Keurig Dr Pepper, Inc. detracted from relative performance after posting double-digit negative returns. We exited our positions in Kimberly-Clark and Keurig during the period.
Stock selection in materials | In materials, the International Paper Company detracted from absolute and relative returns as weak demand, pricing pressure and margin compression drove poor stock performance. Also, not owning metals and mining companies was a large relative detractor.
How Has The Fund Historically Performed?
Growth of $10,000 Investment
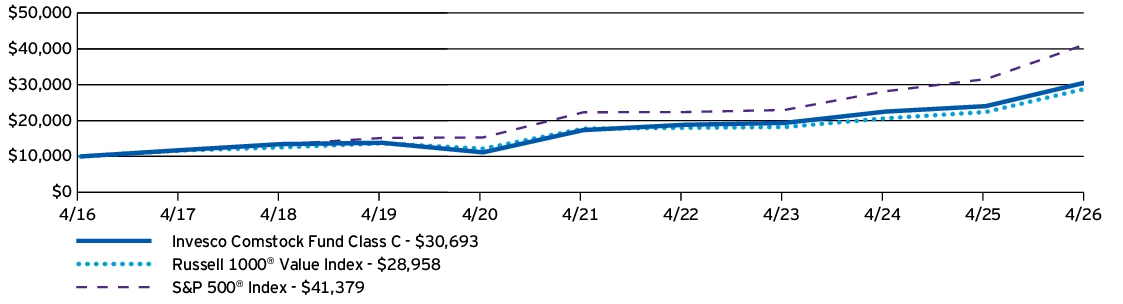
| AVERAGE ANNUAL TOTAL RETURNS | 1 Year | 5 Years | 10 Years |
| Invesco Comstock Fund (Class C) —including sales charge | 25.79% | 11.77% | 11.87% |
| Invesco Comstock Fund (Class C) —excluding sales charge | 26.79% | 11.77% | 11.87% |
| Russell 1000® Value Index | 29.25% | 10.29% | 11.22% |
| S&P 500® Index | 31.05% | 13.14% | 15.26% |
Performance figures do not reflect deduction of taxes a shareholder would pay on Fund distributions or sale of Fund shares.
What Are Key Statistics About The Fund?
(as of April 30, 2026)
| Fund net assets | $14,357,412,153 |
| Total number of portfolio holdings | 87 |
| Total advisory fees paid | $47,506,846 |
| Portfolio turnover rate | 31% |
What Comprised The Fund's Holdings?
(as of April 30, 2026)
Top ten holdings*
(% of net assets)
(% of net assets)
| Alphabet, Inc., Class A | 4.08% |
| Bank of America Corp. | 3.38% |
| CVS Health Corp. | 2.55% |
| Microsoft Corp. | 2.46% |
| Cisco Systems, Inc. | 2.40% |
| Wells Fargo & Co. | 2.29% |
| Chevron Corp. | 2.15% |
| Merck & Co., Inc. | 1.94% |
| State Street Corp. | 1.90% |
| FedEx Corp. | 1.89% |
| * Excluding money market fund holdings, if any. |
Sector allocation
(% of net assets)
(% of net assets)
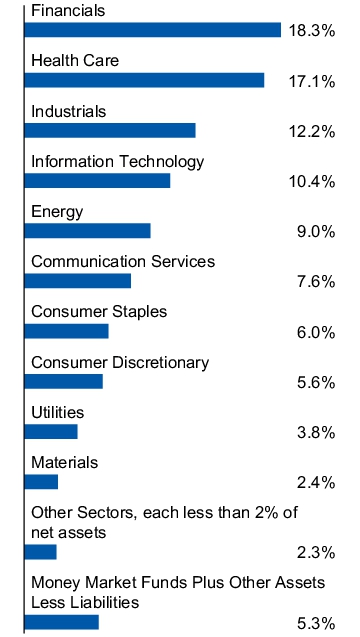
Top ten holdings*
(% of net assets)
(% of net assets)
| Alphabet, Inc., Class A | 4.08% |
| Bank of America Corp. | 3.38% |
| CVS Health Corp. | 2.55% |
| Microsoft Corp. | 2.46% |
| Cisco Systems, Inc. | 2.40% |
| Wells Fargo & Co. | 2.29% |
| Chevron Corp. | 2.15% |
| Merck & Co., Inc. | 1.94% |
| State Street Corp. | 1.90% |
| FedEx Corp. | 1.89% |
| * Excluding money market fund holdings, if any. |
What Were The Fund Costs For The Last Year ?
(Based on a hypothetical $10,000 investment)
| Fund (Class) | Costs of a $10,000 investment | Costs paid as a percentage of a $10,000 investment |
| Invesco Comstock Fund (Class R) |
$117 | 1.03%† |
|
†
|
Reflects fee waivers and/or expense reimbursements, without which expenses would have been higher.
|
How Did The Fund Perform During The Period?
• During the fiscal year ended April 30, 2026, increased volatility in US equity markets were driven by geopolitical tensions, elevated energy prices effects on inflation and the policy outlook. That said, equity markets rebounded in early 2026, reaching new highs led by information technology (IT)– and artificial intelligence (AI)–related investments, supported by solid corporate earnings and economic growth. Despite concerns over expenditures in AI-related opportunities, the theme continued to fuel capital spending and earnings growth.
• For the fiscal year ended April 30, 2026, Class R shares of the Fund returned 27.42%. For the same time period, the Russell 1000® Value Index (the “Benchmark”) returned 29.25%. The Fund underperformed the Benchmark primarily due to stock selection in the IT, consumer staples and materials sectors. Stock selection in the financials, energy and industrials sectors contributed to relative return.
What contributed to performance?
Stock selection in financials | In financials, relative performance was driven primarily by strong stock selection within banks and financial services. Citigroup Inc., Citizens Financial Group, Inc. and State Street Corp. were top contributors. Citigroup and Citizens Financial benefited from improving profitability and improving sentiment toward diversified and regional banks, while State Street contributed as market appreciation lifted assets under custody and administration, supporting earnings momentum.
Stock selection in industrials | Industrials contributed to relative performance, led by strong selection in transportation and machinery holdings. FedEx Corp. and Caterpillar Inc. were the two top contributors, benefiting from resilient end market demand and pricing discipline, and consistent execution across core business segments. FedEx outperformed due to early signs of margin improvement.
Stock selection in energy | In energy, Suncor Energy Inc., Tenaris SA and Chevron Corp. were key relative contributors. Suncor Energy's performance was supported by elevated commodity pricing, disciplined capital spending and improvements in free cash flow generation. The energy sector generally benefited from higher oil prices since the Iran conflict began.
What detracted from performance?
Stock selection in IT | In IT, Microsoft Corp., NXP Semiconductors N.V. and Intel Corp. underperformed amid elevated expectations and near term demand concerns; therefore, detracted relative to their respective software and semiconductor peers and versus the Benchmark. The largest relative detractor was not owning Micron Technology, Inc. as the stock outperformed the sector and the Benchmark.
Stock selection in consumer staples | In consumer staples, stock selection in household and personal products was a large relative detractor. Kimberly-Clark Corporation and The Clorox Company underperformed amid volume pressure, cost inflation and limited pricing flexibility, resulting in a meaningful drag on relative returns. Keurig Dr Pepper, Inc. detracted from relative performance after posting double-digit negative returns. We exited our positions in Kimberly-Clark and Keurig during the period.
Stock selection in materials | In materials, the International Paper Company detracted from absolute and relative returns as weak demand, pricing pressure and margin compression drove poor stock performance. Also, not owning metals and mining companies was a large relative detractor.
How Has The Fund Historically Performed?
Growth of $10,000 Investment
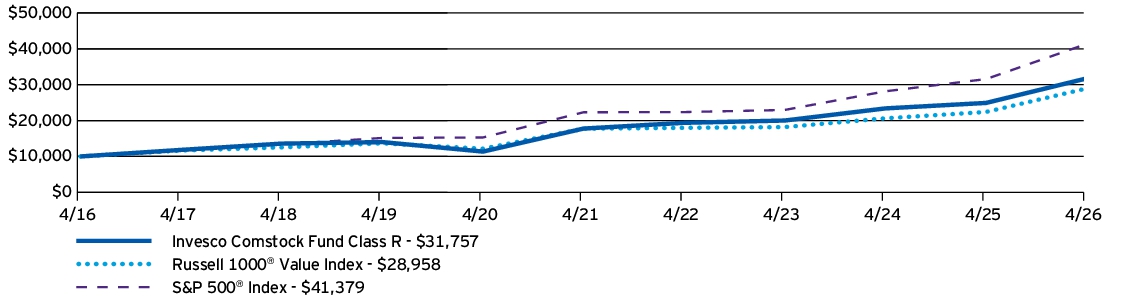
| AVERAGE ANNUAL TOTAL RETURNS | 1 Year | 5 Years | 10 Years |
| Invesco Comstock Fund (Class R) | 27.42% | 12.31% | 12.25% |
| Russell 1000® Value Index | 29.25% | 10.29% | 11.22% |
| S&P 500® Index | 31.05% | 13.14% | 15.26% |
What Are Key Statistics About The Fund?
(as of April 30, 2026)
| Fund net assets | $14,357,412,153 |
| Total number of portfolio holdings | 87 |
| Total advisory fees paid | $47,506,846 |
| Portfolio turnover rate | 31% |
What Comprised The Fund's Holdings?
(as of April 30, 2026)
Top ten holdings*
(% of net assets)
(% of net assets)
| Alphabet, Inc., Class A | 4.08% |
| Bank of America Corp. | 3.38% |
| CVS Health Corp. | 2.55% |
| Microsoft Corp. | 2.46% |
| Cisco Systems, Inc. | 2.40% |
| Wells Fargo & Co. | 2.29% |
| Chevron Corp. | 2.15% |
| Merck & Co., Inc. | 1.94% |
| State Street Corp. | 1.90% |
| FedEx Corp. | 1.89% |
| * Excluding money market fund holdings, if any. |
Sector allocation
(% of net assets)
(% of net assets)
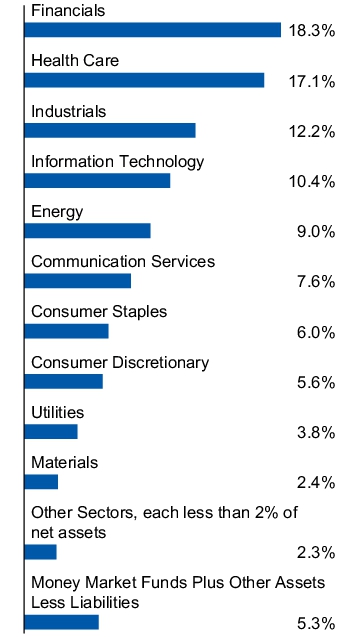
Top ten holdings*
(% of net assets)
(% of net assets)
| Alphabet, Inc., Class A | 4.08% |
| Bank of America Corp. | 3.38% |
| CVS Health Corp. | 2.55% |
| Microsoft Corp. | 2.46% |
| Cisco Systems, Inc. | 2.40% |
| Wells Fargo & Co. | 2.29% |
| Chevron Corp. | 2.15% |
| Merck & Co., Inc. | 1.94% |
| State Street Corp. | 1.90% |
| FedEx Corp. | 1.89% |
| * Excluding money market fund holdings, if any. |
What Were The Fund Costs For The Last Year ?
(Based on a hypothetical $10,000 investment)
| Fund (Class) | Costs of a $10,000 investment | Costs paid as a percentage of a $10,000 investment |
| Invesco Comstock Fund (Class Y) |
$60 | 0.53%† |
|
†
|
Reflects fee waivers and/or expense reimbursements, without which expenses would have been higher.
|
How Did The Fund Perform During The Period?
• During the fiscal year ended April 30, 2026, increased volatility in US equity markets were driven by geopolitical tensions, elevated energy prices effects on inflation and the policy outlook. That said, equity markets rebounded in early 2026, reaching new highs led by information technology (IT)– and artificial intelligence (AI)–related investments, supported by solid corporate earnings and economic growth. Despite concerns over expenditures in AI-related opportunities, the theme continued to fuel capital spending and earnings growth.
• For the fiscal year ended April 30, 2026, Class Y shares of the Fund returned 28.05%. For the same time period, the Russell 1000® Value Index (the “Benchmark”) returned 29.25%. The Fund underperformed the Benchmark primarily due to stock selection in the IT, consumer staples and materials sectors. Stock selection in the financials, energy and industrials sectors contributed to relative return.
What contributed to performance?
Stock selection in financials | In financials, relative performance was driven primarily by strong stock selection within banks and financial services. Citigroup Inc., Citizens Financial Group, Inc. and State Street Corp. were top contributors. Citigroup and Citizens Financial benefited from improving profitability and improving sentiment toward diversified and regional banks, while State Street contributed as market appreciation lifted assets under custody and administration, supporting earnings momentum.
Stock selection in industrials | Industrials contributed to relative performance, led by strong selection in transportation and machinery holdings. FedEx Corp. and Caterpillar Inc. were the two top contributors, benefiting from resilient end market demand and pricing discipline, and consistent execution across core business segments. FedEx outperformed due to early signs of margin improvement.
Stock selection in energy | In energy, Suncor Energy Inc., Tenaris SA and Chevron Corp. were key relative contributors. Suncor Energy's performance was supported by elevated commodity pricing, disciplined capital spending and improvements in free cash flow generation. The energy sector generally benefited from higher oil prices since the Iran conflict began.
What detracted from performance?
Stock selection in IT | In IT, Microsoft Corp., NXP Semiconductors N.V. and Intel Corp. underperformed amid elevated expectations and near term demand concerns; therefore, detracted relative to their respective software and semiconductor peers and versus the Benchmark. The largest relative detractor was not owning Micron Technology, Inc. as the stock outperformed the sector and the Benchmark.
Stock selection in consumer staples | In consumer staples, stock selection in household and personal products was a large relative detractor. Kimberly-Clark Corporation and The Clorox Company underperformed amid volume pressure, cost inflation and limited pricing flexibility, resulting in a meaningful drag on relative returns. Keurig Dr Pepper, Inc. detracted from relative performance after posting double-digit negative returns. We exited our positions in Kimberly-Clark and Keurig during the period.
Stock selection in materials | In materials, the International Paper Company detracted from absolute and relative returns as weak demand, pricing pressure and margin compression drove poor stock performance. Also, not owning metals and mining companies was a large relative detractor.
How Has The Fund Historically Performed?
Growth of $10,000 Investment
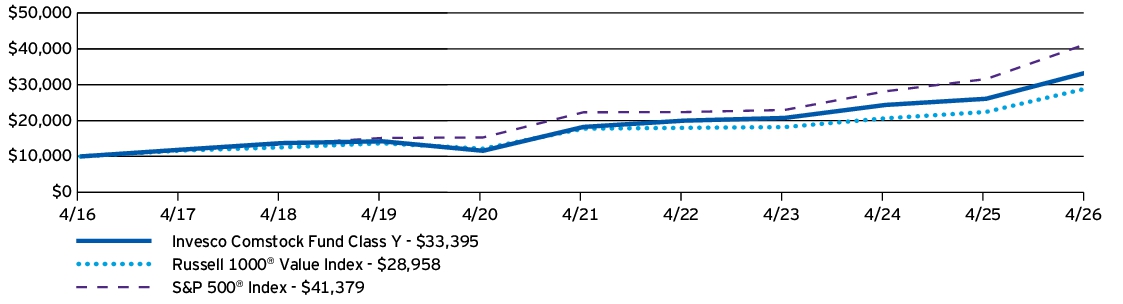
| AVERAGE ANNUAL TOTAL RETURNS | 1 Year | 5 Years | 10 Years |
| Invesco Comstock Fund (Class Y) | 28.05% | 12.87% | 12.82% |
| Russell 1000® Value Index | 29.25% | 10.29% | 11.22% |
| S&P 500® Index | 31.05% | 13.14% | 15.26% |
What Are Key Statistics About The Fund?
(as of April 30, 2026)
| Fund net assets | $14,357,412,153 |
| Total number of portfolio holdings | 87 |
| Total advisory fees paid | $47,506,846 |
| Portfolio turnover rate | 31% |
What Comprised The Fund's Holdings?
(as of April 30, 2026)
Top ten holdings*
(% of net assets)
(% of net assets)
| Alphabet, Inc., Class A | 4.08% |
| Bank of America Corp. | 3.38% |
| CVS Health Corp. | 2.55% |
| Microsoft Corp. | 2.46% |
| Cisco Systems, Inc. | 2.40% |
| Wells Fargo & Co. | 2.29% |
| Chevron Corp. | 2.15% |
| Merck & Co., Inc. | 1.94% |
| State Street Corp. | 1.90% |
| FedEx Corp. | 1.89% |
| * Excluding money market fund holdings, if any. |
Sector allocation
(% of net assets)
(% of net assets)
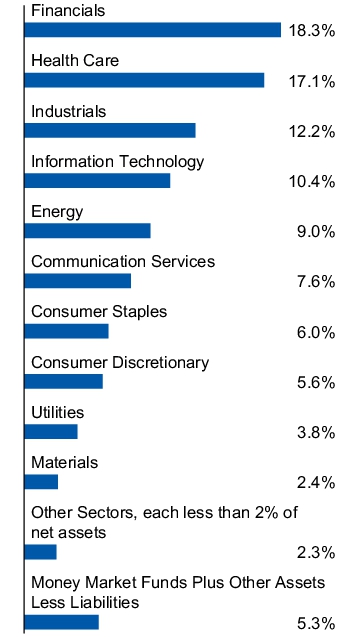
Top ten holdings*
(% of net assets)
(% of net assets)
| Alphabet, Inc., Class A | 4.08% |
| Bank of America Corp. | 3.38% |
| CVS Health Corp. | 2.55% |
| Microsoft Corp. | 2.46% |
| Cisco Systems, Inc. | 2.40% |
| Wells Fargo & Co. | 2.29% |
| Chevron Corp. | 2.15% |
| Merck & Co., Inc. | 1.94% |
| State Street Corp. | 1.90% |
| FedEx Corp. | 1.89% |
| * Excluding money market fund holdings, if any. |
What Were The Fund Costs For The Last Year ?
(Based on a hypothetical $10,000 investment)
| Fund (Class) | Costs of a $10,000 investment | Costs paid as a percentage of a $10,000 investment |
| Invesco Comstock Fund (Class R5) |
$56 | 0.49%† |
|
†
|
Reflects fee waivers and/or expense reimbursements, without which expenses would have been higher.
|
How Did The Fund Perform During The Period?
• During the fiscal year ended April 30, 2026, increased volatility in US equity markets were driven by geopolitical tensions, elevated energy prices effects on inflation and the policy outlook. That said, equity markets rebounded in early 2026, reaching new highs led by information technology (IT)– and artificial intelligence (AI)–related investments, supported by solid corporate earnings and economic growth. Despite concerns over expenditures in AI-related opportunities, the theme continued to fuel capital spending and earnings growth.
• For the fiscal year ended April 30, 2026, Class R5 shares of the Fund returned 28.14%. For the same time period, the Russell 1000® Value Index (the “Benchmark”) returned 29.25%. The Fund underperformed the Benchmark primarily due to stock selection in the IT, consumer staples and materials sectors. Stock selection in the financials, energy and industrials sectors contributed to relative return.
What contributed to performance?
Stock selection in financials | In financials, relative performance was driven primarily by strong stock selection within banks and financial services. Citigroup Inc., Citizens Financial Group, Inc. and State Street Corp. were top contributors. Citigroup and Citizens Financial benefited from improving profitability and improving sentiment toward diversified and regional banks, while State Street contributed as market appreciation lifted assets under custody and administration, supporting earnings momentum.
Stock selection in industrials | Industrials contributed to relative performance, led by strong selection in transportation and machinery holdings. FedEx Corp. and Caterpillar Inc. were the two top contributors, benefiting from resilient end market demand and pricing discipline, and consistent execution across core business segments. FedEx outperformed due to early signs of margin improvement.
Stock selection in energy | In energy, Suncor Energy Inc., Tenaris SA and Chevron Corp. were key relative contributors. Suncor Energy's performance was supported by elevated commodity pricing, disciplined capital spending and improvements in free cash flow generation. The energy sector generally benefited from higher oil prices since the Iran conflict began.
What detracted from performance?
Stock selection in IT | In IT, Microsoft Corp., NXP Semiconductors N.V. and Intel Corp. underperformed amid elevated expectations and near term demand concerns; therefore, detracted relative to their respective software and semiconductor peers and versus the Benchmark. The largest relative detractor was not owning Micron Technology, Inc. as the stock outperformed the sector and the Benchmark.
Stock selection in consumer staples | In consumer staples, stock selection in household and personal products was a large relative detractor. Kimberly-Clark Corporation and The Clorox Company underperformed amid volume pressure, cost inflation and limited pricing flexibility, resulting in a meaningful drag on relative returns. Keurig Dr Pepper, Inc. detracted from relative performance after posting double-digit negative returns. We exited our positions in Kimberly-Clark and Keurig during the period.
Stock selection in materials | In materials, the International Paper Company detracted from absolute and relative returns as weak demand, pricing pressure and margin compression drove poor stock performance. Also, not owning metals and mining companies was a large relative detractor.
How Has The Fund Historically Performed?
Growth of $10,000 Investment
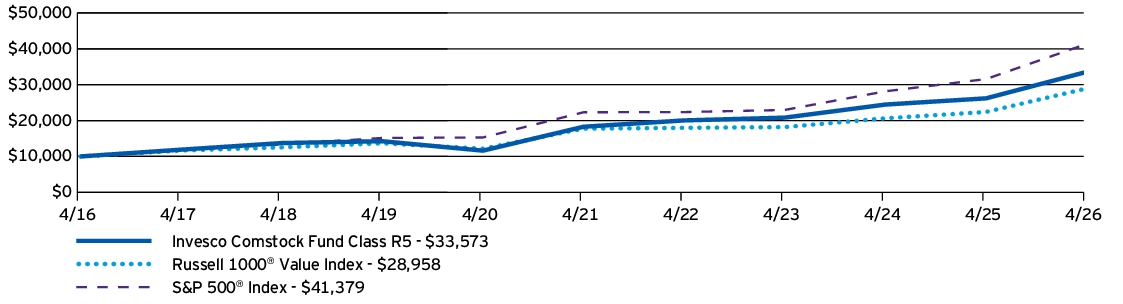
| AVERAGE ANNUAL TOTAL RETURNS | 1 Year | 5 Years | 10 Years |
| Invesco Comstock Fund (Class R5) | 28.14% | 12.92% | 12.88% |
| Russell 1000® Value Index | 29.25% | 10.29% | 11.22% |
| S&P 500® Index | 31.05% | 13.14% | 15.26% |
Performance figures do not reflect deduction of taxes a shareholder would pay on Fund distributions or sale of Fund shares.
What Are Key Statistics About The Fund?
(as of April 30, 2026)
| Fund net assets | $14,357,412,153 |
| Total number of portfolio holdings | 87 |
| Total advisory fees paid | $47,506,846 |
| Portfolio turnover rate | 31% |
What Comprised The Fund's Holdings?
(as of April 30, 2026)
Top ten holdings*
(% of net assets)
(% of net assets)
| Alphabet, Inc., Class A | 4.08% |
| Bank of America Corp. | 3.38% |
| CVS Health Corp. | 2.55% |
| Microsoft Corp. | 2.46% |
| Cisco Systems, Inc. | 2.40% |
| Wells Fargo & Co. | 2.29% |
| Chevron Corp. | 2.15% |
| Merck & Co., Inc. | 1.94% |
| State Street Corp. | 1.90% |
| FedEx Corp. | 1.89% |
| * Excluding money market fund holdings, if any. |
Sector allocation
(% of net assets)
(% of net assets)
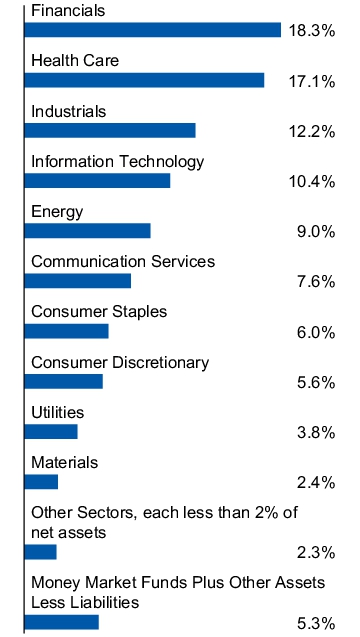
Top ten holdings*
(% of net assets)
(% of net assets)
| Alphabet, Inc., Class A | 4.08% |
| Bank of America Corp. | 3.38% |
| CVS Health Corp. | 2.55% |
| Microsoft Corp. | 2.46% |
| Cisco Systems, Inc. | 2.40% |
| Wells Fargo & Co. | 2.29% |
| Chevron Corp. | 2.15% |
| Merck & Co., Inc. | 1.94% |
| State Street Corp. | 1.90% |
| FedEx Corp. | 1.89% |
| * Excluding money market fund holdings, if any. |
What Were The Fund Costs For The Last Year ?
(Based on a hypothetical $10,000 investment)
| Fund (Class) | Costs of a $10,000 investment | Costs paid as a percentage of a $10,000 investment |
| Invesco Comstock Fund (Class R6) |
$48 | 0.42%† |
|
†
|
Reflects fee waivers and/or expense reimbursements, without which expenses would have been higher.
|
How Did The Fund Perform During The Period?
• During the fiscal year ended April 30, 2026, increased volatility in US equity markets were driven by geopolitical tensions, elevated energy prices effects on inflation and the policy outlook. That said, equity markets rebounded in early 2026, reaching new highs led by information technology (IT)– and artificial intelligence (AI)–related investments, supported by solid corporate earnings and economic growth. Despite concerns over expenditures in AI-related opportunities, the theme continued to fuel capital spending and earnings growth.
• For the fiscal year ended April 30, 2026, Class R6 shares of the Fund returned 28.20%. For the same time period, the Russell 1000® Value Index (the “Benchmark”) returned 29.25%. The Fund underperformed the Benchmark primarily due to stock selection in the IT, consumer staples and materials sectors. Stock selection in the financials, energy and industrials sectors contributed to relative return.
What contributed to performance?
Stock selection in financials | In financials, relative performance was driven primarily by strong stock selection within banks and financial services. Citigroup Inc., Citizens Financial Group, Inc. and State Street Corp. were top contributors. Citigroup and Citizens Financial benefited from improving profitability and improving sentiment toward diversified and regional banks, while State Street contributed as market appreciation lifted assets under custody and administration, supporting earnings momentum.
Stock selection in industrials | Industrials contributed to relative performance, led by strong selection in transportation and machinery holdings. FedEx Corp. and Caterpillar Inc. were the two top contributors, benefiting from resilient end market demand and pricing discipline, and consistent execution across core business segments. FedEx outperformed due to early signs of margin improvement.
Stock selection in energy | In energy, Suncor Energy Inc., Tenaris SA and Chevron Corp. were key relative contributors. Suncor Energy's performance was supported by elevated commodity pricing, disciplined capital spending and improvements in free cash flow generation. The energy sector generally benefited from higher oil prices since the Iran conflict began.
What detracted from performance?
Stock selection in IT | In IT, Microsoft Corp., NXP Semiconductors N.V. and Intel Corp. underperformed amid elevated expectations and near term demand concerns; therefore, detracted relative to their respective software and semiconductor peers and versus the Benchmark. The largest relative detractor was not owning Micron Technology, Inc. as the stock outperformed the sector and the Benchmark.
Stock selection in consumer staples | In consumer staples, stock selection in household and personal products was a large relative detractor. Kimberly-Clark Corporation and The Clorox Company underperformed amid volume pressure, cost inflation and limited pricing flexibility, resulting in a meaningful drag on relative returns. Keurig Dr Pepper, Inc. detracted from relative performance after posting double-digit negative returns. We exited our positions in Kimberly-Clark and Keurig during the period.
Stock selection in materials | In materials, the International Paper Company detracted from absolute and relative returns as weak demand, pricing pressure and margin compression drove poor stock performance. Also, not owning metals and mining companies was a large relative detractor.
How Has The Fund Historically Performed?
Growth of $10,000 Investment
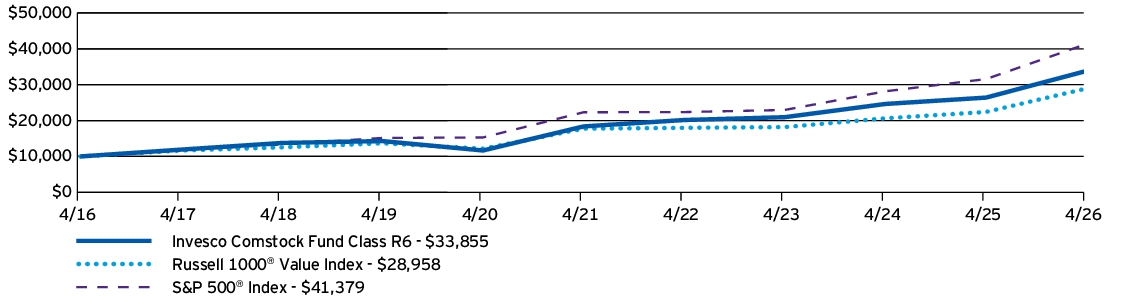
| AVERAGE ANNUAL TOTAL RETURNS | 1 Year | 5 Years | 10 Years |
| Invesco Comstock Fund (Class R6) | 28.20% | 13.00% | 12.97% |
| Russell 1000® Value Index | 29.25% | 10.29% | 11.22% |
| S&P 500® Index | 31.05% | 13.14% | 15.26% |
Performance figures do not reflect deduction of taxes a shareholder would pay on Fund distributions or sale of Fund shares.
What Are Key Statistics About The Fund?
(as of April 30, 2026)
| Fund net assets | $14,357,412,153 |
| Total number of portfolio holdings | 87 |
| Total advisory fees paid | $47,506,846 |
| Portfolio turnover rate | 31% |
What Comprised The Fund's Holdings?
(as of April 30, 2026)
Top ten holdings*
(% of net assets)
(% of net assets)
| Alphabet, Inc., Class A | 4.08% |
| Bank of America Corp. | 3.38% |
| CVS Health Corp. | 2.55% |
| Microsoft Corp. | 2.46% |
| Cisco Systems, Inc. | 2.40% |
| Wells Fargo & Co. | 2.29% |
| Chevron Corp. | 2.15% |
| Merck & Co., Inc. | 1.94% |
| State Street Corp. | 1.90% |
| FedEx Corp. | 1.89% |
| * Excluding money market fund holdings, if any. |
Sector allocation
(% of net assets)
(% of net assets)
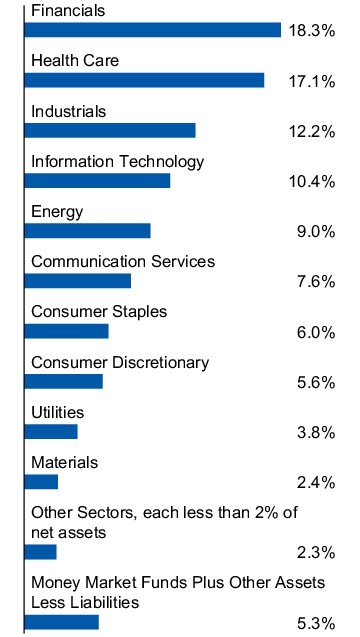
Top ten holdings*
(% of net assets)
(% of net assets)
| Alphabet, Inc., Class A | 4.08% |
| Bank of America Corp. | 3.38% |
| CVS Health Corp. | 2.55% |
| Microsoft Corp. | 2.46% |
| Cisco Systems, Inc. | 2.40% |
| Wells Fargo & Co. | 2.29% |
| Chevron Corp. | 2.15% |
| Merck & Co., Inc. | 1.94% |
| State Street Corp. | 1.90% |
| FedEx Corp. | 1.89% |
| * Excluding money market fund holdings, if any. |
What Were The Fund Costs For The Last Year ?
(Based on a hypothetical $10,000 investment)
| Fund (Class) | Costs of a $10,000 investment | Costs paid as a percentage of a $10,000 investment |
| Invesco Small Cap Value Fund (Class R6) |
$89 | 0.68% |
How Did The Fund Perform During The Period?
• During the fiscal year ended April 30, 2026, US equity markets experienced periods of volatility driven by geopolitical tensions, elevated energy prices, and uncertainty around inflation and the policy outlook. Despite these crosscurrents, markets proved resilient, with a sharp rebound in early 2026 with equities reaching new highs. Strength was led by information technology (IT) and artificial intelligence (AI)–related investments, which remained the dominant market drivers, supported by solid corporate earnings and continued economic growth. While investors became more discerning around AI-related opportunities, the theme continued to fuel capital spending, earnings growth, and market leadership.
• For the fiscal year ended April 30, 2026, Class R6 shares of the Fund returned 62.59%. For the same time the Russell 2000® Value Index (the "Benchmark") returned 46.34%. The Fund outperformed the Benchmark primarily due to an overweight position and strong stock selection in IT, which was also the largest contributor to the Fund's absolute performance. Stock selection and an overweight position in materials and the Fund's avoidance of the real estate sector contributed to relative results. Conversely, stock selection in health care detracted most from the Fund's relative and absolute returns and an overweight position in energy detracted from relative return. The Fund's cash holding, while just 3% on average, also detracted from returns in the strong market environment.
What contributed to performance?
Coherent Corp. | Coherent is a laser company that develops and manufactures optoelectronic components and devices. Its optical transceivers are key enablers for networking of AI servers. The company reported strong earnings and revenue growth, driven primarily by sustained demand from its AI‑related data center and communications markets.
Lumentum Holdings, Inc. | Shares of Lumentum Holdings, a market-leading designer and manufacturer of innovative optical and photonic products, rose in the first quarter of 2026 amid investor enthusiasm for its AI-driven growth potential, particularly for its advanced technology products used in data center applications.
MKS, Inc. | MKS supplies advanced instruments, subsystems and process‑control solutions for semiconductor manufacturing and other industrial uses. Demand has been strong, supported by higher capital spending tied to AI and advanced computing infrastructure.
What detracted from performance?
Globant S.A. | Globant is a digital services and technology consulting firm that helps companies transform through innovation, design and software engineering. Shares declined sharply amid concerns about the long-term effect of AI on digital consulting and management’s more cautious forward guidance. We sold this position during the period.
Molina Healthcare, Inc. | Molina Healthcare, a health insurer, faced headwinds from rising medical costs and reduction in participants due to Medicaid redeterminations during the period. The July 2025 passage of the “One Big Beautiful Bill Act” further pressured the stock, given approximately $1 trillion in potential cuts to Medicaid. We sold the position during the period.
QuidelOrtho Corp. | QuidelOrtho is a global diagnostics firm that manufactures and markets rapid tests, lab-based diagnostics, and blood screening solutions for infectious diseases and other health conditions. Fears around the impact of tariffs on their product costs as well as uncertainty over potential Chinese reimbursement changes caused a decline in the stock during the fiscal year.
How Has The Fund Historically Performed?
Growth of $10,000 Investment
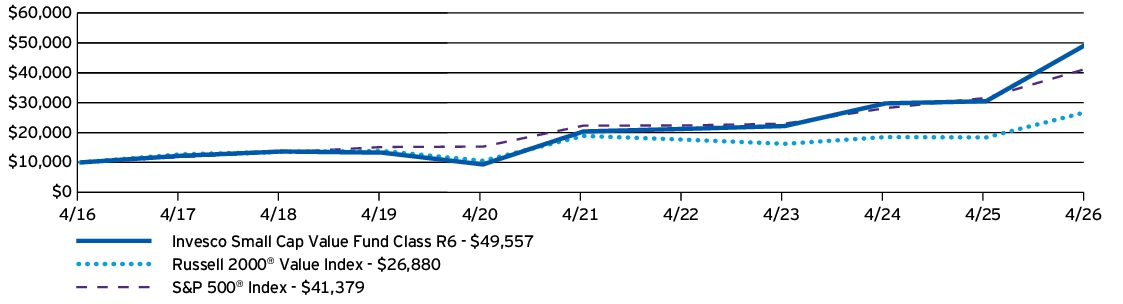
| AVERAGE ANNUAL TOTAL RETURNS | 1 Year | 5 Years | 10 Years |
| Invesco Small Cap Value Fund (Class R6) | 62.59% | 19.47% | 17.36% |
| Russell 2000® Value Index | 46.34% | 7.33% | 10.39% |
| S&P 500® Index | 31.05% | 13.14% | 15.26% |
Performance figures do not reflect deduction of taxes a shareholder would pay on Fund distributions or sale of Fund shares.
What Are Key Statistics About The Fund?
(as of April 30, 2026)
| Fund net assets | $10,759,293,136 |
| Total number of portfolio holdings | 110 |
| Total advisory fees paid | $49,549,672 |
| Portfolio turnover rate | 79% |
What Comprised The Fund's Holdings?
(as of April 30, 2026)
Top ten holdings*
(% of net assets)
(% of net assets)
| Coherent Corp. | 4.13% |
| MKS, Inc. | 3.03% |
| Rambus, Inc. | 2.99% |
| Entegris, Inc. | 2.61% |
| Globe Life, Inc. | 2.03% |
| Allegro MicroSystems, Inc. | 2.00% |
| Western Alliance Bancorporation | 1.97% |
| Element Solutions, Inc. | 1.94% |
| Ovintiv, Inc. | 1.81% |
| Melexis N.V. | 1.79% |
| * Excluding money market fund holdings, if any. |
Sector allocation
(% of net assets)
(% of net assets)
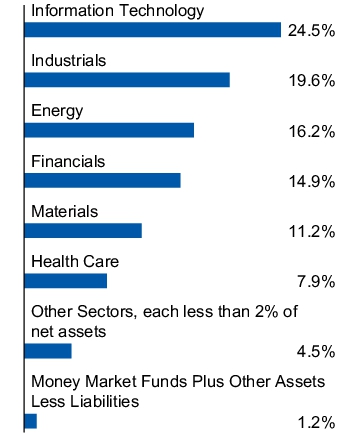
Top ten holdings*
(% of net assets)
(% of net assets)
| Coherent Corp. | 4.13% |
| MKS, Inc. | 3.03% |
| Rambus, Inc. | 2.99% |
| Entegris, Inc. | 2.61% |
| Globe Life, Inc. | 2.03% |
| Allegro MicroSystems, Inc. | 2.00% |
| Western Alliance Bancorporation | 1.97% |
| Element Solutions, Inc. | 1.94% |
| Ovintiv, Inc. | 1.81% |
| Melexis N.V. | 1.79% |
| * Excluding money market fund holdings, if any. |
What Were The Fund Costs For The Last Year ?
(Based on a hypothetical $10,000 investment)
| Fund (Class) | Costs of a $10,000 investment | Costs paid as a percentage of a $10,000 investment |
| Invesco Small Cap Value Fund (Class Y) |
$105 | 0.80% |
How Did The Fund Perform During The Period?
• During the fiscal year ended April 30, 2026, US equity markets experienced periods of volatility driven by geopolitical tensions, elevated energy prices, and uncertainty around inflation and the policy outlook. Despite these crosscurrents, markets proved resilient, with a sharp rebound in early 2026 with equities reaching new highs. Strength was led by information technology (IT) and artificial intelligence (AI)–related investments, which remained the dominant market drivers, supported by solid corporate earnings and continued economic growth. While investors became more discerning around AI-related opportunities, the theme continued to fuel capital spending, earnings growth, and market leadership.
• For the fiscal year ended April 30, 2026, Class Y shares of the Fund returned 62.41%. or the same time the Russell 2000® Value Index (the "Benchmark") returned 46.34%. The Fund outperformed the Benchmark primarily due to an overweight position and strong stock selection in IT, which was also the largest contributor to the Fund's absolute performance. Stock selection and an overweight position in materials and the Fund's avoidance of the real estate sector contributed to relative results. Conversely, stock selection in health care detracted most from the Fund's relative and absolute returns and an overweight position in energy detracted from relative return. The Fund's cash holding, while just 3% on average, also detracted from returns in the strong market environment.
What contributed to performance?
Coherent Corp. | Coherent is a laser company that develops and manufactures optoelectronic components and devices. Its optical transceivers are key enablers for networking of AI servers. The company reported strong earnings and revenue growth, driven primarily by sustained demand from its AI‑related data center and communications markets.
Lumentum Holdings, Inc. | Shares of Lumentum Holdings, a market-leading designer and manufacturer of innovative optical and photonic products, rose in the first quarter of 2026 amid investor enthusiasm for its AI-driven growth potential, particularly for its advanced technology products used in data center applications.
MKS, Inc. | MKS supplies advanced instruments, subsystems and process‑control solutions for semiconductor manufacturing and other industrial uses. Demand has been strong, supported by higher capital spending tied to AI and advanced computing infrastructure.
What detracted from performance?
Globant S.A. | Globant is a digital services and technology consulting firm that helps companies transform through innovation, design and software engineering. Shares declined sharply amid concerns about the long-term effect of AI on digital consulting and management’s more cautious forward guidance. We sold this position during the period.
Molina Healthcare, Inc. | Molina Healthcare, a health insurer, faced headwinds from rising medical costs and reduction in participants due to Medicaid redeterminations during the period. The July 2025 passage of the “One Big Beautiful Bill Act” further pressured the stock, given approximately $1 trillion in potential cuts to Medicaid. We sold the position during the period.
QuidelOrtho Corp. | QuidelOrtho is a global diagnostics firm that manufactures and markets rapid tests, lab-based diagnostics, and blood screening solutions for infectious diseases and other health conditions. Fears around the impact of tariffs on their product costs as well as uncertainty over potential Chinese reimbursement changes caused a decline in the stock during the fiscal year.
How Has The Fund Historically Performed?
Growth of $10,000 Investment
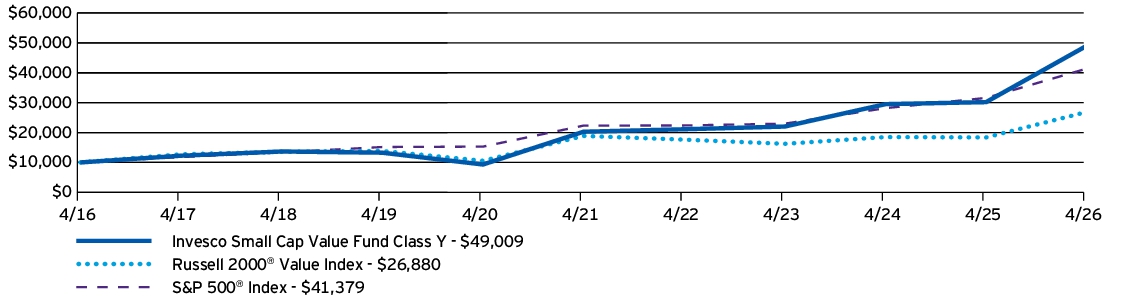
| AVERAGE ANNUAL TOTAL RETURNS | 1 Year | 5 Years | 10 Years |
| Invesco Small Cap Value Fund (Class Y) | 62.41% | 19.31% | 17.23% |
| Russell 2000® Value Index | 46.34% | 7.33% | 10.39% |
| S&P 500® Index | 31.05% | 13.14% | 15.26% |
Performance figures do not reflect deduction of taxes a shareholder would pay on Fund distributions or sale of Fund shares.
What Are Key Statistics About The Fund?
(as of April 30, 2026)
| Fund net assets | $10,759,293,136 |
| Total number of portfolio holdings | 110 |
| Total advisory fees paid | $49,549,672 |
| Portfolio turnover rate | 79% |
What Comprised The Fund's Holdings?
(as of April 30, 2026)
Top ten holdings*
(% of net assets)
(% of net assets)
| Coherent Corp. | 4.13% |
| MKS, Inc. | 3.03% |
| Rambus, Inc. | 2.99% |
| Entegris, Inc. | 2.61% |
| Globe Life, Inc. | 2.03% |
| Allegro MicroSystems, Inc. | 2.00% |
| Western Alliance Bancorporation | 1.97% |
| Element Solutions, Inc. | 1.94% |
| Ovintiv, Inc. | 1.81% |
| Melexis N.V. | 1.79% |
| * Excluding money market fund holdings, if any. |
Sector allocation
(% of net assets)
(% of net assets)
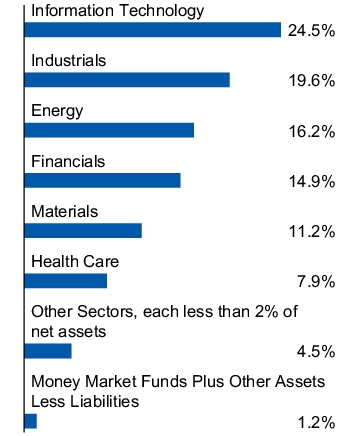
Top ten holdings*
(% of net assets)
(% of net assets)
| Coherent Corp. | 4.13% |
| MKS, Inc. | 3.03% |
| Rambus, Inc. | 2.99% |
| Entegris, Inc. | 2.61% |
| Globe Life, Inc. | 2.03% |
| Allegro MicroSystems, Inc. | 2.00% |
| Western Alliance Bancorporation | 1.97% |
| Element Solutions, Inc. | 1.94% |
| Ovintiv, Inc. | 1.81% |
| Melexis N.V. | 1.79% |
| * Excluding money market fund holdings, if any. |
What Were The Fund Costs For The Last Year ?
(Based on a hypothetical $10,000 investment)
| Fund (Class) | Costs of a $10,000 investment | Costs paid as a percentage of a $10,000 investment |
| Invesco Small Cap Value Fund (Class R) |
$170 | 1.30% |
How Did The Fund Perform During The Period?
• During the fiscal year ended April 30, 2026, US equity markets experienced periods of volatility driven by geopolitical tensions, elevated energy prices, and uncertainty around inflation and the policy outlook. Despite these crosscurrents, markets proved resilient, with a sharp rebound in early 2026 with equities reaching new highs. Strength was led by information technology (IT) and artificial intelligence (AI)–related investments, which remained the dominant market drivers, supported by solid corporate earnings and continued economic growth. While investors became more discerning around AI-related opportunities, the theme continued to fuel capital spending, earnings growth, and market leadership.
• For the fiscal year ended April 30, 2026, Class R shares of the Fund returned 61.58%. For the same time the Benchmark returned 46.34%. The Fund outperformed the Russell 2000® Value Index (the "Benchmark") primarily due to an overweight position and strong stock selection in IT, the largest contributor to absolute performance. Selection and an overweight position in materials and the Fund's avoidance of the real estate sector contributed to relative results. Conversely, stock selection in health care detracted most from the Fund's relative and absolute returns and an overweight position in energy detracted from the relative return. The Fund's cash holding, while just 3% on average, also detracted in the strong market environment.
What contributed to performance?
Coherent Corp. | Coherent is a laser company that develops and manufactures optoelectronic components and devices. Its optical transceivers are key enablers for networking of AI servers. The company reported strong earnings and revenue growth, driven primarily by sustained demand from its AI‑related data center and communications markets.
Lumentum Holdings, Inc. | Shares of Lumentum Holdings, a market-leading designer and manufacturer of innovative optical and photonic products, rose in the first quarter of 2026 amid investor enthusiasm for its AI-driven growth potential, particularly for its advanced technology products used in data center applications.
MKS, Inc. | MKS supplies advanced instruments, subsystems and process‑control solutions for semiconductor manufacturing and other industrial uses. Demand has been strong, supported by higher capital spending tied to AI and advanced computing infrastructure.
What detracted from performance?
Globant S.A. | Globant is a digital services and technology consulting firm that helps companies transform through innovation, design and software engineering. Shares declined sharply amid concerns about the long-term effect of AI on digital consulting and management’s more cautious forward guidance. We sold this position during the period.
Molina Healthcare, Inc. | Molina Healthcare, a health insurer, faced headwinds from rising medical costs and reduction in participants due to Medicaid redeterminations during the period. The July 2025 passage of the “One Big Beautiful Bill Act” further pressured the stock, given approximately $1 trillion in potential cuts to Medicaid. We sold the position during the period.
QuidelOrtho Corp. | QuidelOrtho is a global diagnostics firm that manufactures and markets rapid tests, lab-based diagnostics, and blood screening solutions for infectious diseases and other health conditions. Fears around the impact of tariffs on their product costs as well as uncertainty over potential Chinese reimbursement changes caused a decline in the stock during the fiscal year.
How Has The Fund Historically Performed?
Growth of $10,000 Investment
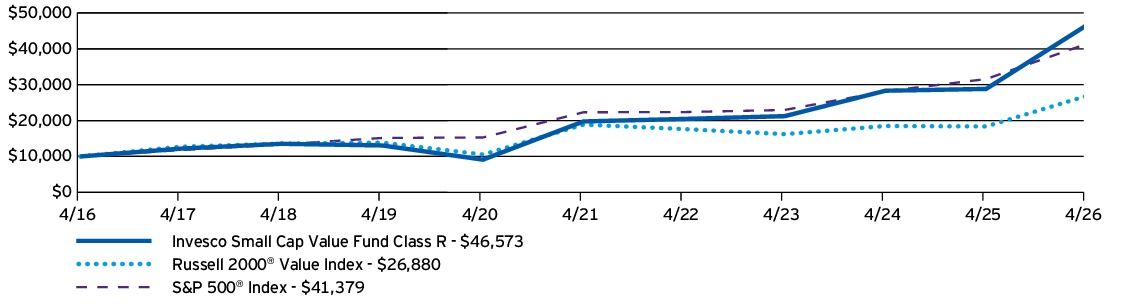
| AVERAGE ANNUAL TOTAL RETURNS | 1 Year | 5 Years | 10 Years |
| Invesco Small Cap Value Fund (Class R) | 61.58% | 18.71% | 16.63% |
| Russell 2000® Value Index | 46.34% | 7.33% | 10.39% |
| S&P 500® Index | 31.05% | 13.14% | 15.26% |
Performance figures do not reflect deduction of taxes a shareholder would pay on Fund distributions or sale of Fund shares.
What Are Key Statistics About The Fund?
(as of April 30, 2026)
| Fund net assets | $10,759,293,136 |
| Total number of portfolio holdings | 110 |
| Total advisory fees paid | $49,549,672 |
| Portfolio turnover rate | 79% |
What Comprised The Fund's Holdings?
(as of April 30, 2026)
Top ten holdings*
(% of net assets)
(% of net assets)
| Coherent Corp. | 4.13% |
| MKS, Inc. | 3.03% |
| Rambus, Inc. | 2.99% |
| Entegris, Inc. | 2.61% |
| Globe Life, Inc. | 2.03% |
| Allegro MicroSystems, Inc. | 2.00% |
| Western Alliance Bancorporation | 1.97% |
| Element Solutions, Inc. | 1.94% |
| Ovintiv, Inc. | 1.81% |
| Melexis N.V. | 1.79% |
| * Excluding money market fund holdings, if any. |
Sector allocation
(% of net assets)
(% of net assets)
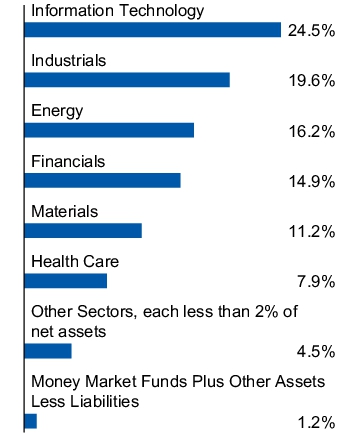
Top ten holdings*
(% of net assets)
(% of net assets)
| Coherent Corp. | 4.13% |
| MKS, Inc. | 3.03% |
| Rambus, Inc. | 2.99% |
| Entegris, Inc. | 2.61% |
| Globe Life, Inc. | 2.03% |
| Allegro MicroSystems, Inc. | 2.00% |
| Western Alliance Bancorporation | 1.97% |
| Element Solutions, Inc. | 1.94% |
| Ovintiv, Inc. | 1.81% |
| Melexis N.V. | 1.79% |
| * Excluding money market fund holdings, if any. |
What Were The Fund Costs For The Last Year ?
(Based on a hypothetical $10,000 investment)
| Fund (Class) | Costs of a $10,000 investment | Costs paid as a percentage of a $10,000 investment |
| Invesco Small Cap Value Fund (Class C) |
$235 | 1.80% |
How Did The Fund Perform During The Period?
• During the fiscal year ended April 30, 2026, US equity markets experienced periods of volatility driven by geopolitical tensions, elevated energy prices, and uncertainty around inflation and the policy outlook. Despite these crosscurrents, markets proved resilient, with a sharp rebound in early 2026 with equities reaching new highs. Strength was led by information technology (IT) and artificial intelligence (AI)–related investments, which remained the dominant market drivers, supported by solid corporate earnings and continued economic growth. While investors became more discerning around AI-related opportunities, the theme continued to fuel capital spending, earnings growth, and market leadership.
• For the fiscal year ended April 30, 2026, Class C shares of the Fund, excluding sales charge, returned 60.78%. For the same time the Russell 2000® Value Index (the "Benchmark") returned 46.34%. The Fund outperformed the Benchmark primarily due to an overweight position and strong stock selection in IT, which was also the largest contributor to the Fund's absolute performance. Stock selection and an overweight position in materials and the Fund's avoidance of the real estate sector contributed to relative results. Conversely, stock selection in health care detracted most from the Fund's relative and absolute returns and an overweight position in energy detracted from relative return. The Fund's cash holding, while just 3% on average, also detracted from returns in the strong market environment.
What contributed to performance?
Coherent Corp. | Coherent is a laser company that develops and manufactures optoelectronic components and devices. Its optical transceivers are key enablers for networking of AI servers. The company reported strong earnings and revenue growth, driven primarily by sustained demand from its AI‑related data center and communications markets.
Lumentum Holdings, Inc. | Shares of Lumentum Holdings, a market-leading designer and manufacturer of innovative optical and photonic products, rose in the first quarter of 2026 amid investor enthusiasm for its AI-driven growth potential, particularly for its advanced technology products used in data center applications.
MKS, Inc. | MKS supplies advanced instruments, subsystems and process‑control solutions for semiconductor manufacturing and other industrial uses. Demand has been strong, supported by higher capital spending tied to AI and advanced computing infrastructure.
What detracted from performance?
Globant S.A. | Globant is a digital services and technology consulting firm that helps companies transform through innovation, design and software engineering. Shares declined sharply amid concerns about the long-term effect of AI on digital consulting and management’s more cautious forward guidance. We sold this position during the period.
Molina Healthcare, Inc. | Molina Healthcare, a health insurer, faced headwinds from rising medical costs and reduction in participants due to Medicaid redeterminations during the period. The July 2025 passage of the “One Big Beautiful Bill Act” further pressured the stock, given approximately $1 trillion in potential cuts to Medicaid. We sold the position during the period.
QuidelOrtho Corp. | QuidelOrtho is a global diagnostics firm that manufactures and markets rapid tests, lab-based diagnostics, and blood screening solutions for infectious diseases and other health conditions. Fears around the impact of tariffs on their product costs as well as uncertainty over potential Chinese reimbursement changes caused a decline in the stock during the fiscal year.
How Has The Fund Historically Performed?
Growth of $10,000 Investment
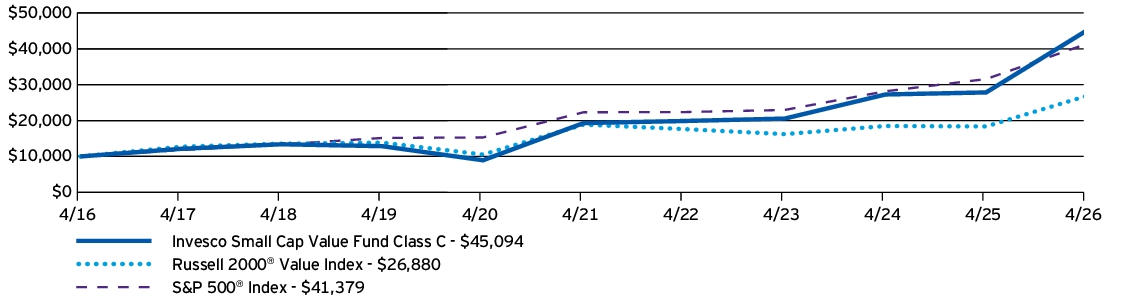
| AVERAGE ANNUAL TOTAL RETURNS | 1 Year | 5 Years | 10 Years |
| Invesco Small Cap Value Fund (Class C) —including sales charge | 59.78% | 18.13% | 16.26% |
| Invesco Small Cap Value Fund (Class C) —excluding sales charge | 60.78% | 18.13% | 16.26% |
| Russell 2000® Value Index | 46.34% | 7.33% | 10.39% |
| S&P 500® Index | 31.05% | 13.14% | 15.26% |
Performance figures do not reflect deduction of taxes a shareholder would pay on Fund distributions or sale of Fund shares.
What Are Key Statistics About The Fund?
(as of April 30, 2026)
| Fund net assets | $10,759,293,136 |
| Total number of portfolio holdings | 110 |
| Total advisory fees paid | $49,549,672 |
| Portfolio turnover rate | 79% |
What Comprised The Fund's Holdings?
(as of April 30, 2026)
Top ten holdings*
(% of net assets)
(% of net assets)
| Coherent Corp. | 4.13% |
| MKS, Inc. | 3.03% |
| Rambus, Inc. | 2.99% |
| Entegris, Inc. | 2.61% |
| Globe Life, Inc. | 2.03% |
| Allegro MicroSystems, Inc. | 2.00% |
| Western Alliance Bancorporation | 1.97% |
| Element Solutions, Inc. | 1.94% |
| Ovintiv, Inc. | 1.81% |
| Melexis N.V. | 1.79% |
| * Excluding money market fund holdings, if any. |
Sector allocation
(% of net assets)
(% of net assets)
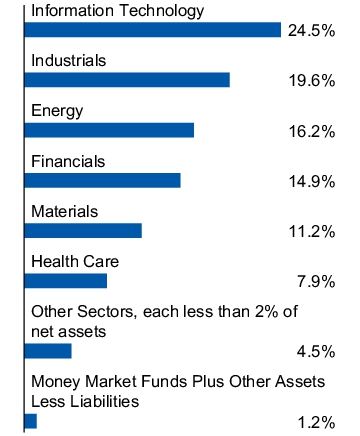
Top ten holdings*
(% of net assets)
(% of net assets)
| Coherent Corp. | 4.13% |
| MKS, Inc. | 3.03% |
| Rambus, Inc. | 2.99% |
| Entegris, Inc. | 2.61% |
| Globe Life, Inc. | 2.03% |
| Allegro MicroSystems, Inc. | 2.00% |
| Western Alliance Bancorporation | 1.97% |
| Element Solutions, Inc. | 1.94% |
| Ovintiv, Inc. | 1.81% |
| Melexis N.V. | 1.79% |
| * Excluding money market fund holdings, if any. |
What Were The Fund Costs For The Last Year ?
(Based on a hypothetical $10,000 investment)
| Fund (Class) | Costs of a $10,000 investment | Costs paid as a percentage of a $10,000 investment |
| Invesco Small Cap Value Fund (Class A) |
$138 | 1.05% |
How Did The Fund Perform During The Period?
• During the fiscal year ended April 30, 2026, US equity markets experienced periods of volatility driven by geopolitical tensions, elevated energy prices, and uncertainty around inflation and the policy outlook. Despite these crosscurrents, markets proved resilient, with a sharp rebound in early 2026 with equities reaching new highs. Strength was led by information technology (IT) and artificial intelligence (AI)–related investments, which remained the dominant market drivers, supported by solid corporate earnings and continued economic growth. While investors became more discerning around AI-related opportunities, the theme continued to fuel capital spending, earnings growth, and market leadership.
• For the fiscal year ended April 30, 2026, Class A shares of the Fund, excluding sales charge, returned 61.95%. For the same time the Russell 2000® Value Index (the "Benchmark") returned 46.34%. The Fund outperformed the Benchmark primarily due to an overweight position and strong stock selection in IT, which was also the largest contributor to the Fund's absolute performance. Stock selection and an overweight position in materials and the Fund's avoidance of the real estate sector contributed to relative results. Conversely, stock selection in health care detracted most from the Fund's relative and absolute returns and an overweight position in energy detracted from relative return. The Fund's cash holding, while just 3% on average, also detracted from returns in the strong market environment.
What contributed to performance?
Coherent Corp. | Coherent is a laser company that develops and manufactures optoelectronic components and devices. Its optical transceivers are key enablers for networking of AI servers. The company reported strong earnings and revenue growth, driven primarily by sustained demand from its AI‑related data center and communications markets.
Lumentum Holdings, Inc. | Shares of Lumentum Holdings, a market-leading designer and manufacturer of innovative optical and photonic products, rose in the first quarter of 2026 amid investor enthusiasm for its AI-driven growth potential, particularly for its advanced technology products used in data center applications.
MKS, Inc. | MKS supplies advanced instruments, subsystems and process‑control solutions for semiconductor manufacturing and other industrial uses. Demand has been strong, supported by higher capital spending tied to AI and advanced computing infrastructure.
What detracted from performance?
Globant S.A. | Globant is a digital services and technology consulting firm that helps companies transform through innovation, design and software engineering. Shares declined sharply amid concerns about the long-term effect of AI on digital consulting and management’s more cautious forward guidance. We sold this position during the period.
Molina Healthcare, Inc. | Molina Healthcare, a health insurer, faced headwinds from rising medical costs and reduction in participants due to Medicaid redeterminations during the period. The July 2025 passage of the “One Big Beautiful Bill Act” further pressured the stock, given approximately $1 trillion in potential cuts to Medicaid. We sold the position during the period.
QuidelOrtho Corp. | QuidelOrtho is a global diagnostics firm that manufactures and markets rapid tests, lab-based diagnostics, and blood screening solutions for infectious diseases and other health conditions. Fears around the impact of tariffs on their product costs as well as uncertainty over potential Chinese reimbursement changes caused a decline in the stock during the fiscal year.
How Has The Fund Historically Performed?
Growth of $10,000 Investment
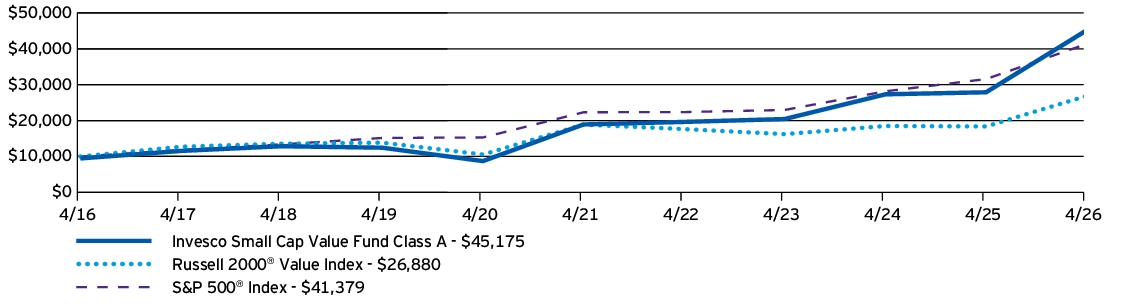
| AVERAGE ANNUAL TOTAL RETURNS | 1 Year | 5 Years | 10 Years |
| Invesco Small Cap Value Fund (Class A) —including sales charge | 53.03% | 17.67% | 16.28% |
| Invesco Small Cap Value Fund (Class A) —excluding sales charge | 61.95% | 19.01% | 16.93% |
| Russell 2000® Value Index | 46.34% | 7.33% | 10.39% |
| S&P 500® Index | 31.05% | 13.14% | 15.26% |
Performance figures do not reflect deduction of taxes a shareholder would pay on Fund distributions or sale of Fund shares.
What Are Key Statistics About The Fund?
(as of April 30, 2026)
| Fund net assets | $10,759,293,136 |
| Total number of portfolio holdings | 110 |
| Total advisory fees paid | $49,549,672 |
| Portfolio turnover rate | 79% |
What Comprised The Fund's Holdings?
(as of April 30, 2026)
Top ten holdings*
(% of net assets)
(% of net assets)
| Coherent Corp. | 4.13% |
| MKS, Inc. | 3.03% |
| Rambus, Inc. | 2.99% |
| Entegris, Inc. | 2.61% |
| Globe Life, Inc. | 2.03% |
| Allegro MicroSystems, Inc. | 2.00% |
| Western Alliance Bancorporation | 1.97% |
| Element Solutions, Inc. | 1.94% |
| Ovintiv, Inc. | 1.81% |
| Melexis N.V. | 1.79% |
| * Excluding money market fund holdings, if any. |
Sector allocation
(% of net assets)
(% of net assets)
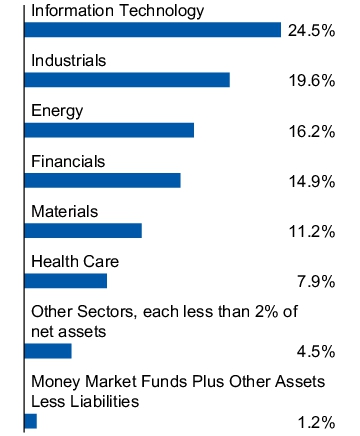
Top ten holdings*
(% of net assets)
(% of net assets)
| Coherent Corp. | 4.13% |
| MKS, Inc. | 3.03% |
| Rambus, Inc. | 2.99% |
| Entegris, Inc. | 2.61% |
| Globe Life, Inc. | 2.03% |
| Allegro MicroSystems, Inc. | 2.00% |
| Western Alliance Bancorporation | 1.97% |
| Element Solutions, Inc. | 1.94% |
| Ovintiv, Inc. | 1.81% |
| Melexis N.V. | 1.79% |
| * Excluding money market fund holdings, if any. |
What Were The Fund Costs For The Last Year ?
(Based on a hypothetical $10,000 investment)
| Fund (Class) | Costs of a $10,000 investment | Costs paid as a percentage of a $10,000 investment |
| Invesco Value Opportunities Fund (Class A) |
$126 | 1.00% |
How Did The Fund Perform During The Period?
• During the fiscal year ended April 30, 2026, US equity markets experienced periods of volatility driven by geopolitical tensions, elevated energy prices, and uncertainty around inflation and the policy outlook. Despite these crosscurrents, markets proved resilient, with a sharp rebound in early 2026 with equities reaching new highs. Strength was led by information technology (IT) and artificial intelligence (AI)–related investments, which remained the dominant market drivers, supported by solid corporate earnings and continued economic growth. While investors became more discerning around AI-related opportunities, the theme continued to fuel capital spending, earnings growth, and market leadership.
• For the fiscal year ended April 30, 2026, Class A shares of the Fund, excluding sales charge, returned 52.67%. For the same time the Russell Midcap® Value Index (the "Benchmark") returned 29.76%. The Fund outperformed the Benchmark primarily due to strong stock selection in the industrials and IT sectors. These sectors were also the largest contributors to absolute performance. Stock selection in materials, and a lack of exposure to real estate also aided relative returns. Conversely, stock selection in health care detracted the most from the Fund's relative and absolute return and stock selection in financials also detracted from the Fund's relative return. The Fund's cash holding, while approximately 4% on average, also detracted from returns in the strong market environment.
What contributed to performance?
Coherent Corp. | Coherent is a laser company that develops and manufactures optoelectronic components and devices. Its optical transceivers are key enablers for networking of AI servers. The company reported strong earnings and revenue growth, driven primarily by sustained demand from its AI‑related data center and communications markets.
Lumentum Holdings, Inc. | Shares of Lumentum Holdings, a market-leading designer and manufacturer of innovative optical and photonic products, rose in the first quarter of 2026 amid investor enthusiasm for its AI-driven growth potential, particularly for its advanced technology products used in data center applications.
AppLovin Corp. | AppLovin is a mobile technology firm that provides developers with tools to market, monetize, analyze and publish their apps. The company reported a strong increase in revenues, along with better-than-expected earnings and also announced its entry into the e-commerce market, which we believe may be another avenue for growth.
What detracted from performance?
Centene Corp. | Centene is a leading provider of both Medicaid and Affordable Care Act insurance coverage. Centene’s stock dropped sharply after the company pulled its 2025 earnings guidance due to lower growth in the health care exchange market and rising medical costs. The passage of the “One Big Beautiful Bill Act” put further pressure on shares, given the approximately $1 trillion in potential cuts to Medicaid.
Globant S.A. | Globant is a digital services and technology consulting firm that helps companies transform through innovation, design and software engineering. Shares declined sharply amid concerns about the long-term effect of AI on digital consulting and management’s more cautious forward guidance. We sold this position during the period.
Fidelity National Information Services, Inc. | Fidelity National Information Services, known as FIS, is a leading provider of technology solutions for merchants, banks and capital markets firms. The stock declined as FIS faced a number of headwinds, including tough year‑over‑year earnings comparisons in its capital markets segment, issues related to its sale of payment processing firm Worldpay, and short‑term profit margin dilution from a recent acquisition.
How Has The Fund Historically Performed?
Growth of $10,000 Investment
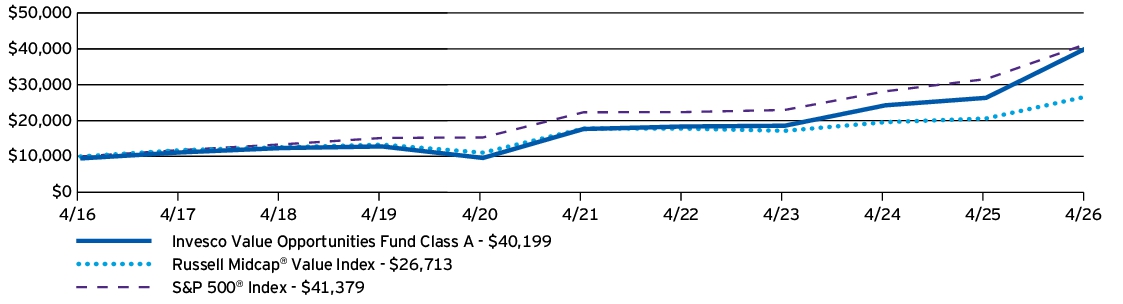
| AVERAGE ANNUAL TOTAL RETURNS | 1 Year | 5 Years | 10 Years |
| Invesco Value Opportunities Fund (Class A) —including sales charge | 44.30% | 16.57% | 14.93% |
| Invesco Value Opportunities Fund (Class A) —excluding sales charge | 52.67% | 17.90% | 15.58% |
| Russell Midcap® Value Index | 29.76% | 8.50% | 10.32% |
| S&P 500® Index | 31.05% | 13.14% | 15.26% |
Performance figures do not reflect deduction of taxes a shareholder would pay on Fund distributions or sale of Fund shares.
What Are Key Statistics About The Fund?
(as of April 30, 2026)
| Fund net assets | $8,439,370,604 |
| Total number of portfolio holdings | 80 |
| Total advisory fees paid | $35,259,137 |
| Portfolio turnover rate | 86% |
What Comprised The Fund's Holdings?
(as of April 30, 2026)
Top ten holdings*
(% of net assets)
(% of net assets)
| Coherent Corp. | 4.08% |
| Marvell Technology, Inc. | 3.15% |
| MKS, Inc. | 2.97% |
| Rambus, Inc. | 2.93% |
| STMicroelectronics N.V., New York Shares | 2.88% |
| Entegris, Inc. | 2.54% |
| Rentokil Initial PLC | 2.50% |
| Vertiv Holdings Co., Class A | 2.24% |
| NRG Energy, Inc. | 2.24% |
| Cenovus Energy, Inc. | 2.02% |
| * Excluding money market fund holdings, if any. |
Sector allocation
(% of net assets)
(% of net assets)
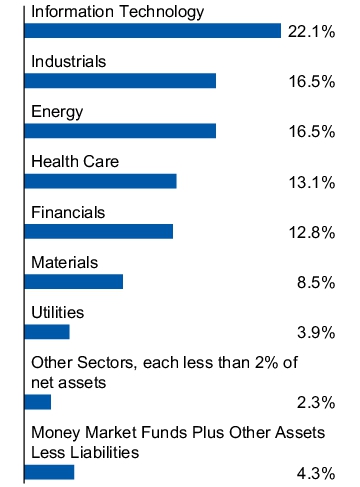
Top ten holdings*
(% of net assets)
(% of net assets)
| Coherent Corp. | 4.08% |
| Marvell Technology, Inc. | 3.15% |
| MKS, Inc. | 2.97% |
| Rambus, Inc. | 2.93% |
| STMicroelectronics N.V., New York Shares | 2.88% |
| Entegris, Inc. | 2.54% |
| Rentokil Initial PLC | 2.50% |
| Vertiv Holdings Co., Class A | 2.24% |
| NRG Energy, Inc. | 2.24% |
| Cenovus Energy, Inc. | 2.02% |
| * Excluding money market fund holdings, if any. |
What Were The Fund Costs For The Last Year ?
(Based on a hypothetical $10,000 investment)
| Fund (Class) | Costs of a $10,000 investment | Costs paid as a percentage of a $10,000 investment |
| Invesco Value Opportunities Fund (Class C) |
$220 | 1.75% |
How Did The Fund Perform During The Period?
• During the fiscal year ended April 30, 2026, US equity markets experienced periods of volatility driven by geopolitical tensions, elevated energy prices, and uncertainty around inflation and the policy outlook. Despite these crosscurrents, markets proved resilient, with a sharp rebound in early 2026 with equities reaching new highs. Strength was led by information technology (IT) and artificial intelligence (AI)–related investments, which remained the dominant market drivers, supported by solid corporate earnings and continued economic growth. While investors became more discerning around AI-related opportunities, the theme continued to fuel capital spending, earnings growth, and market leadership.
• For the fiscal year ended April 30, 2026, Class C shares of the Fund, excluding sales charge, returned 51.55%. For the same time the Russell Midcap® Value Index (the "Benchmark") returned 29.76%. The Fund outperformed the Benchmark primarily due to strong stock selection in the industrials and IT sectors. These sectors were also the largest contributors to absolute performance. Stock selection in materials, and a lack of exposure to real estate also aided relative returns. Conversely, stock selection in health care detracted the most from the Fund's relative and absolute return and stock selection in financials also detracted from the Fund's relative return. The Fund's cash holding, while approximately 4% on average, also detracted from returns in the strong market environment.
What contributed to performance?
Coherent Corp. | Coherent is a laser company that develops and manufactures optoelectronic components and devices. Its optical transceivers are key enablers for networking of AI servers. The company reported strong earnings and revenue growth, driven primarily by sustained demand from its AI‑related data center and communications markets.
Lumentum Holdings, Inc. | Shares of Lumentum Holdings, a market-leading designer and manufacturer of innovative optical and photonic products, rose in the first quarter of 2026 amid investor enthusiasm for its AI-driven growth potential, particularly for its advanced technology products used in data center applications.
AppLovin Corp. | AppLovin is a mobile technology firm that provides developers with tools to market, monetize, analyze and publish their apps. The company reported a strong increase in revenues, along with better-than-expected earnings and also announced its entry into the e-commerce market, which we believe may be another avenue for growth.
What detracted from performance?
Centene Corp. | Centene is a leading provider of both Medicaid and Affordable Care Act insurance coverage. Centene’s stock dropped sharply after the company pulled its 2025 earnings guidance due to lower growth in the health care exchange market and rising medical costs. The passage of the “One Big Beautiful Bill Act” put further pressure on shares, given the approximately $1 trillion in potential cuts to Medicaid.
Globant S.A. | Globant is a digital services and technology consulting firm that helps companies transform through innovation, design and software engineering. Shares declined sharply amid concerns about the long-term effect of AI on digital consulting and management’s more cautious forward guidance. We sold this position during the period.
Fidelity National Information Services, Inc. | Fidelity National Information Services, known as FIS, is a leading provider of technology solutions for merchants, banks and capital markets firms. The stock declined as FIS faced a number of headwinds, including tough year‑over‑year earnings comparisons in its capital markets segment, issues related to its sale of payment processing firm Worldpay, and short‑term profit margin dilution from a recent acquisition.
How Has The Fund Historically Performed?
Growth of $10,000 Investment
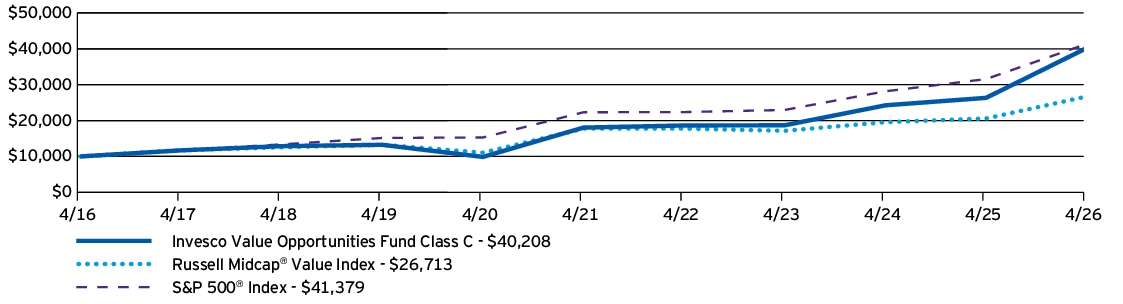
| AVERAGE ANNUAL TOTAL RETURNS | 1 Year | 5 Years | 10 Years |
| Invesco Value Opportunities Fund (Class C) —including sales charge | 50.46% | 17.02% | 14.93% |
| Invesco Value Opportunities Fund (Class C) —excluding sales charge | 51.55% | 17.02% | 14.93% |
| Russell Midcap® Value Index | 29.76% | 8.50% | 10.32% |
| S&P 500® Index | 31.05% | 13.14% | 15.26% |
Performance figures do not reflect deduction of taxes a shareholder would pay on Fund distributions or sale of Fund shares.
What Are Key Statistics About The Fund?
(as of April 30, 2026)
| Fund net assets | $8,439,370,604 |
| Total number of portfolio holdings | 80 |
| Total advisory fees paid | $35,259,137 |
| Portfolio turnover rate | 86% |
What Comprised The Fund's Holdings?
(as of April 30, 2026)
Top ten holdings*
(% of net assets)
(% of net assets)
| Coherent Corp. | 4.08% |
| Marvell Technology, Inc. | 3.15% |
| MKS, Inc. | 2.97% |
| Rambus, Inc. | 2.93% |
| STMicroelectronics N.V., New York Shares | 2.88% |
| Entegris, Inc. | 2.54% |
| Rentokil Initial PLC | 2.50% |
| Vertiv Holdings Co., Class A | 2.24% |
| NRG Energy, Inc. | 2.24% |
| Cenovus Energy, Inc. | 2.02% |
| * Excluding money market fund holdings, if any. |
Sector allocation
(% of net assets)
(% of net assets)
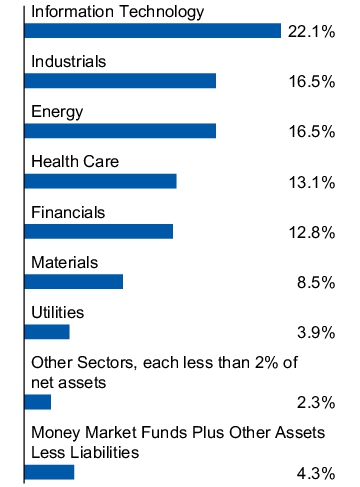
Top ten holdings*
(% of net assets)
(% of net assets)
| Coherent Corp. | 4.08% |
| Marvell Technology, Inc. | 3.15% |
| MKS, Inc. | 2.97% |
| Rambus, Inc. | 2.93% |
| STMicroelectronics N.V., New York Shares | 2.88% |
| Entegris, Inc. | 2.54% |
| Rentokil Initial PLC | 2.50% |
| Vertiv Holdings Co., Class A | 2.24% |
| NRG Energy, Inc. | 2.24% |
| Cenovus Energy, Inc. | 2.02% |
| * Excluding money market fund holdings, if any. |
What Were The Fund Costs For The Last Year ?
(Based on a hypothetical $10,000 investment)
| Fund (Class) | Costs of a $10,000 investment | Costs paid as a percentage of a $10,000 investment |
| Invesco Value Opportunities Fund (Class R) |
$158 | 1.25% |
How Did The Fund Perform During The Period?
• During the fiscal year ended April 30, 2026, US equity markets experienced periods of volatility driven by geopolitical tensions, elevated energy prices, and uncertainty around inflation and the policy outlook. Despite these crosscurrents, markets proved resilient, with a sharp rebound in early 2026 with equities reaching new highs. Strength was led by information technology (IT) and artificial intelligence (AI)–related investments, which remained the dominant market drivers, supported by solid corporate earnings and continued economic growth. While investors became more discerning around AI-related opportunities, the theme continued to fuel capital spending, earnings growth, and market leadership.
• For the fiscal year ended April 30, 2026, Class R shares of the Fund returned 52.27%. For the same time the Russell Midcap® Value Index (the "Benchmark") returned 29.76%. The Fund outperformed the Benchmark primarily due to strong stock selection in the industrials and IT sectors. These sectors were also the largest contributors to absolute performance. Stock selection in materials, and a lack of exposure to real estate also aided relative returns. Conversely, stock selection in health care detracted the most from the Fund's relative and absolute return and stock selection in financials also detracted from the Fund's relative return. The Fund's cash holding, while approximately 4% on average, also detracted from returns in the strong market environment.
What contributed to performance?
Coherent Corp. | Coherent is a laser company that develops and manufactures optoelectronic components and devices. Its optical transceivers are key enablers for networking of AI servers. The company reported strong earnings and revenue growth, driven primarily by sustained demand from its AI‑related data center and communications markets.
Lumentum Holdings, Inc. | Shares of Lumentum Holdings, a market-leading designer and manufacturer of innovative optical and photonic products, rose in the first quarter of 2026 amid investor enthusiasm for its AI-driven growth potential, particularly for its advanced technology products used in data center applications.
AppLovin Corp. | AppLovin is a mobile technology firm that provides developers with tools to market, monetize, analyze and publish their apps. The company reported a strong increase in revenues, along with better-than-expected earnings and also announced its entry into the e-commerce market, which we believe may be another avenue for growth.
What detracted from performance?
Centene Corp. | Centene is a leading provider of both Medicaid and Affordable Care Act insurance coverage. Centene’s stock dropped sharply after the company pulled its 2025 earnings guidance due to lower growth in the health care exchange market and rising medical costs. The passage of the “One Big Beautiful Bill Act” put further pressure on shares, given the approximately $1 trillion in potential cuts to Medicaid.
Globant S.A. | Globant is a digital services and technology consulting firm that helps companies transform through innovation, design and software engineering. Shares declined sharply amid concerns about the long-term effect of AI on digital consulting and management’s more cautious forward guidance. We sold this position during the period.
Fidelity National Information Services, Inc. | Fidelity National Information Services, known as FIS, is a leading provider of technology solutions for merchants, banks and capital markets firms. The stock declined as FIS faced a number of headwinds, including tough year‑over‑year earnings comparisons in its capital markets segment, issues related to its sale of payment processing firm Worldpay, and short‑term profit margin dilution from a recent acquisition.
How Has The Fund Historically Performed?
Growth of $10,000 Investment
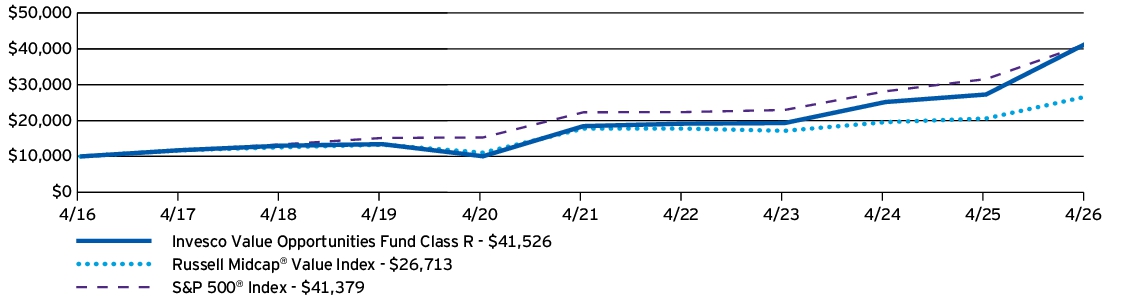
| AVERAGE ANNUAL TOTAL RETURNS | 1 Year | 5 Years | 10 Years |
| Invesco Value Opportunities Fund (Class R) | 52.27% | 17.61% | 15.30% |
| Russell Midcap® Value Index | 29.76% | 8.50% | 10.32% |
| S&P 500® Index | 31.05% | 13.14% | 15.26% |
Performance figures do not reflect deduction of taxes a shareholder would pay on Fund distributions or sale of Fund shares.
What Are Key Statistics About The Fund?
(as of April 30, 2026)
| Fund net assets | $8,439,370,604 |
| Total number of portfolio holdings | 80 |
| Total advisory fees paid | $35,259,137 |
| Portfolio turnover rate | 86% |
What Comprised The Fund's Holdings?
(as of April 30, 2026)
Top ten holdings*
(% of net assets)
(% of net assets)
| Coherent Corp. | 4.08% |
| Marvell Technology, Inc. | 3.15% |
| MKS, Inc. | 2.97% |
| Rambus, Inc. | 2.93% |
| STMicroelectronics N.V., New York Shares | 2.88% |
| Entegris, Inc. | 2.54% |
| Rentokil Initial PLC | 2.50% |
| Vertiv Holdings Co., Class A | 2.24% |
| NRG Energy, Inc. | 2.24% |
| Cenovus Energy, Inc. | 2.02% |
| * Excluding money market fund holdings, if any. |
Sector allocation
(% of net assets)
(% of net assets)
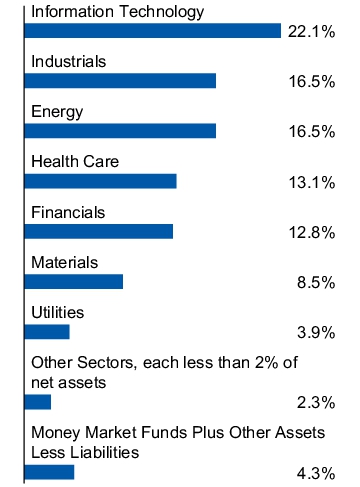
Top ten holdings*
(% of net assets)
(% of net assets)
| Coherent Corp. | 4.08% |
| Marvell Technology, Inc. | 3.15% |
| MKS, Inc. | 2.97% |
| Rambus, Inc. | 2.93% |
| STMicroelectronics N.V., New York Shares | 2.88% |
| Entegris, Inc. | 2.54% |
| Rentokil Initial PLC | 2.50% |
| Vertiv Holdings Co., Class A | 2.24% |
| NRG Energy, Inc. | 2.24% |
| Cenovus Energy, Inc. | 2.02% |
| * Excluding money market fund holdings, if any. |
What Were The Fund Costs For The Last Year ?
(Based on a hypothetical $10,000 investment)
| Fund (Class) | Costs of a $10,000 investment | Costs paid as a percentage of a $10,000 investment |
| Invesco Value Opportunities Fund (Class Y) |
$95 | 0.75% |
How Did The Fund Perform During The Period?
• During the fiscal year ended April 30, 2026, US equity markets experienced periods of volatility driven by geopolitical tensions, elevated energy prices, and uncertainty around inflation and the policy outlook. Despite these crosscurrents, markets proved resilient, with a sharp rebound in early 2026 with equities reaching new highs. Strength was led by information technology (IT) and artificial intelligence (AI)–related investments, which remained the dominant market drivers, supported by solid corporate earnings and continued economic growth. While investors became more discerning around AI-related opportunities, the theme continued to fuel capital spending, earnings growth, and market leadership.
• For the fiscal year ended April 30, 2026, Class Y shares of the Fund returned 53.04%. For the same time the Russell Midcap® Value Index (the "Benchmark") returned 29.76%. The Fund outperformed the Benchmark primarily due to strong stock selection in the industrials and IT sectors. These sectors were also the largest contributors to absolute performance. Stock selection in materials, and a lack of exposure to real estate also aided relative returns. Conversely, stock selection in health care detracted the most from the Fund's relative and absolute return and stock selection in financials also detracted from the Fund's relative return. The Fund's cash holding, while approximately 4% on average, also detracted from returns in the strong market environment.
What contributed to performance?
Coherent Corp. | Coherent is a laser company that develops and manufactures optoelectronic components and devices. Its optical transceivers are key enablers for networking of AI servers. The company reported strong earnings and revenue growth, driven primarily by sustained demand from its AI‑related data center and communications markets.
Lumentum Holdings, Inc. | Shares of Lumentum Holdings, a market-leading designer and manufacturer of innovative optical and photonic products, rose in the first quarter of 2026 amid investor enthusiasm for its AI-driven growth potential, particularly for its advanced technology products used in data center applications.
AppLovin Corp. | AppLovin is a mobile technology firm that provides developers with tools to market, monetize, analyze and publish their apps. The company reported a strong increase in revenues, along with better-than-expected earnings and also announced its entry into the e-commerce market, which we believe may be another avenue for growth.
What detracted from performance?
Centene Corp. | Centene is a leading provider of both Medicaid and Affordable Care Act insurance coverage. Centene’s stock dropped sharply after the company pulled its 2025 earnings guidance due to lower growth in the health care exchange market and rising medical costs. The passage of the “One Big Beautiful Bill Act” put further pressure on shares, given the approximately $1 trillion in potential cuts to Medicaid.
Globant S.A. | Globant is a digital services and technology consulting firm that helps companies transform through innovation, design and software engineering. Shares declined sharply amid concerns about the long-term effect of AI on digital consulting and management’s more cautious forward guidance. We sold this position during the period.
Fidelity National Information Services, Inc. | Fidelity National Information Services, known as FIS, is a leading provider of technology solutions for merchants, banks and capital markets firms. The stock declined as FIS faced a number of headwinds, including tough year‑over‑year earnings comparisons in its capital markets segment, issues related to its sale of payment processing firm Worldpay, and short‑term profit margin dilution from a recent acquisition.
How Has The Fund Historically Performed?
Growth of $10,000 Investment
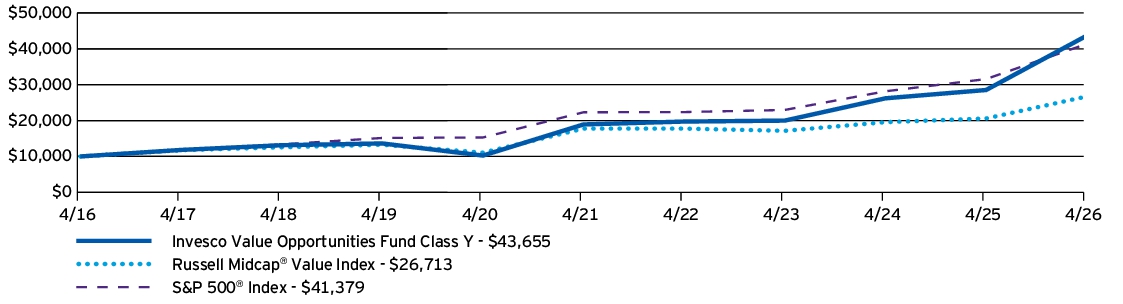
| AVERAGE ANNUAL TOTAL RETURNS | 1 Year | 5 Years | 10 Years |
| Invesco Value Opportunities Fund (Class Y) | 53.04% | 18.19% | 15.88% |
| Russell Midcap® Value Index | 29.76% | 8.50% | 10.32% |
| S&P 500® Index | 31.05% | 13.14% | 15.26% |
Performance figures do not reflect deduction of taxes a shareholder would pay on Fund distributions or sale of Fund shares.
What Are Key Statistics About The Fund?
(as of April 30, 2026)
| Fund net assets | $8,439,370,604 |
| Total number of portfolio holdings | 80 |
| Total advisory fees paid | $35,259,137 |
| Portfolio turnover rate | 86% |
What Comprised The Fund's Holdings?
(as of April 30, 2026)
Top ten holdings*
(% of net assets)
(% of net assets)
| Coherent Corp. | 4.08% |
| Marvell Technology, Inc. | 3.15% |
| MKS, Inc. | 2.97% |
| Rambus, Inc. | 2.93% |
| STMicroelectronics N.V., New York Shares | 2.88% |
| Entegris, Inc. | 2.54% |
| Rentokil Initial PLC | 2.50% |
| Vertiv Holdings Co., Class A | 2.24% |
| NRG Energy, Inc. | 2.24% |
| Cenovus Energy, Inc. | 2.02% |
| * Excluding money market fund holdings, if any. |
Sector allocation
(% of net assets)
(% of net assets)
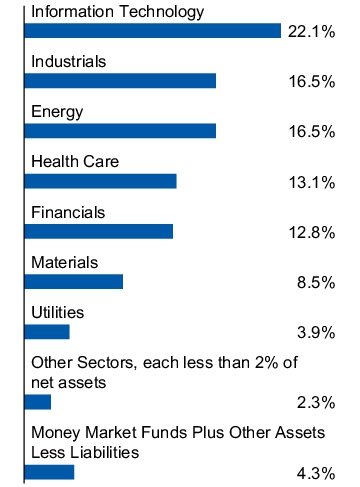
Top ten holdings*
(% of net assets)
(% of net assets)
| Coherent Corp. | 4.08% |
| Marvell Technology, Inc. | 3.15% |
| MKS, Inc. | 2.97% |
| Rambus, Inc. | 2.93% |
| STMicroelectronics N.V., New York Shares | 2.88% |
| Entegris, Inc. | 2.54% |
| Rentokil Initial PLC | 2.50% |
| Vertiv Holdings Co., Class A | 2.24% |
| NRG Energy, Inc. | 2.24% |
| Cenovus Energy, Inc. | 2.02% |
| * Excluding money market fund holdings, if any. |
What Were The Fund Costs For The Last Year ?
(Based on a hypothetical $10,000 investment)
| Fund (Class) | Costs of a $10,000 investment | Costs paid as a percentage of a $10,000 investment |
| Invesco Value Opportunities Fund (Class R5) |
$91 | 0.72% |
How Did The Fund Perform During The Period?
• During the fiscal year ended April 30, 2026, US equity markets experienced periods of volatility driven by geopolitical tensions, elevated energy prices, and uncertainty around inflation and the policy outlook. Despite these crosscurrents, markets proved resilient, with a sharp rebound in early 2026 with equities reaching new highs. Strength was led by information technology (IT) and artificial intelligence (AI)–related investments, which remained the dominant market drivers, supported by solid corporate earnings and continued economic growth. While investors became more discerning around AI-related opportunities, the theme continued to fuel capital spending, earnings growth, and market leadership.
• For the fiscal year ended April 30, 2026, Class R5 shares of the Fund returned 53.08%. For the same time the Russell Midcap® Value Index (the "Benchmark") returned 29.76%. The Fund outperformed the Benchmark primarily due to strong stock selection in the industrials and IT sectors. These sectors were also the largest contributors to absolute performance. Stock selection in materials, and a lack of exposure to real estate also aided relative returns. Conversely, stock selection in health care detracted the most from the Fund's relative and absolute return and stock selection in financials also detracted from the Fund's relative return. The Fund's cash holding, while approximately 4% on average, also detracted from returns in the strong market environment.
What contributed to performance?
Coherent Corp. | Coherent is a laser company that develops and manufactures optoelectronic components and devices. Its optical transceivers are key enablers for networking of AI servers. The company reported strong earnings and revenue growth, driven primarily by sustained demand from its AI‑related data center and communications markets.
Lumentum Holdings, Inc. | Shares of Lumentum Holdings, a market-leading designer and manufacturer of innovative optical and photonic products, rose in the first quarter of 2026 amid investor enthusiasm for its AI-driven growth potential, particularly for its advanced technology products used in data center applications.
AppLovin Corp. | AppLovin is a mobile technology firm that provides developers with tools to market, monetize, analyze and publish their apps. The company reported a strong increase in revenues, along with better-than-expected earnings and also announced its entry into the e-commerce market, which we believe may be another avenue for growth.
What detracted from performance?
Centene Corp. | Centene is a leading provider of both Medicaid and Affordable Care Act insurance coverage. Centene’s stock dropped sharply after the company pulled its 2025 earnings guidance due to lower growth in the health care exchange market and rising medical costs. The passage of the “One Big Beautiful Bill Act” put further pressure on shares, given the approximately $1 trillion in potential cuts to Medicaid.
Globant S.A. | Globant is a digital services and technology consulting firm that helps companies transform through innovation, design and software engineering. Shares declined sharply amid concerns about the long-term effect of AI on digital consulting and management’s more cautious forward guidance. We sold this position during the period.
Fidelity National Information Services, Inc. | Fidelity National Information Services, known as FIS, is a leading provider of technology solutions for merchants, banks and capital markets firms. The stock declined as FIS faced a number of headwinds, including tough year‑over‑year earnings comparisons in its capital markets segment, issues related to its sale of payment processing firm Worldpay, and short‑term profit margin dilution from a recent acquisition.
How Has The Fund Historically Performed?
Growth of $10,000 Investment
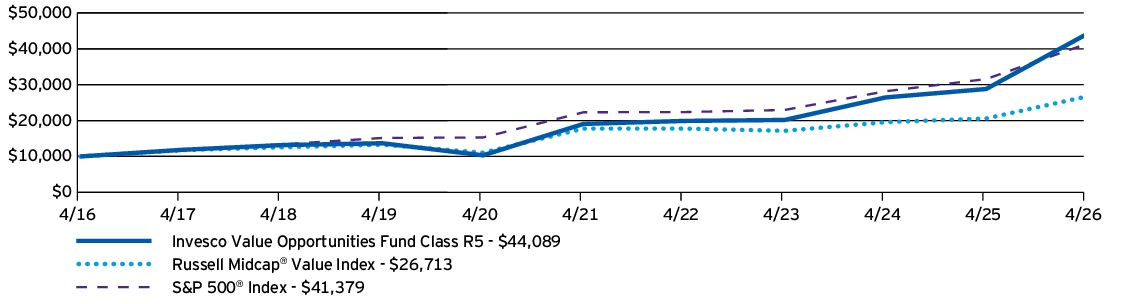
| AVERAGE ANNUAL TOTAL RETURNS | 1 Year | 5 Years | 10 Years |
| Invesco Value Opportunities Fund (Class R5) | 53.08% | 18.25% | 15.99% |
| Russell Midcap® Value Index | 29.76% | 8.50% | 10.32% |
| S&P 500® Index | 31.05% | 13.14% | 15.26% |
Performance figures do not reflect deduction of taxes a shareholder would pay on Fund distributions or sale of Fund shares.
What Are Key Statistics About The Fund?
(as of April 30, 2026)
| Fund net assets | $8,439,370,604 |
| Total number of portfolio holdings | 80 |
| Total advisory fees paid | $35,259,137 |
| Portfolio turnover rate | 86% |
What Comprised The Fund's Holdings?
(as of April 30, 2026)
Top ten holdings*
(% of net assets)
(% of net assets)
| Coherent Corp. | 4.08% |
| Marvell Technology, Inc. | 3.15% |
| MKS, Inc. | 2.97% |
| Rambus, Inc. | 2.93% |
| STMicroelectronics N.V., New York Shares | 2.88% |
| Entegris, Inc. | 2.54% |
| Rentokil Initial PLC | 2.50% |
| Vertiv Holdings Co., Class A | 2.24% |
| NRG Energy, Inc. | 2.24% |
| Cenovus Energy, Inc. | 2.02% |
| * Excluding money market fund holdings, if any. |
Sector allocation
(% of net assets)
(% of net assets)
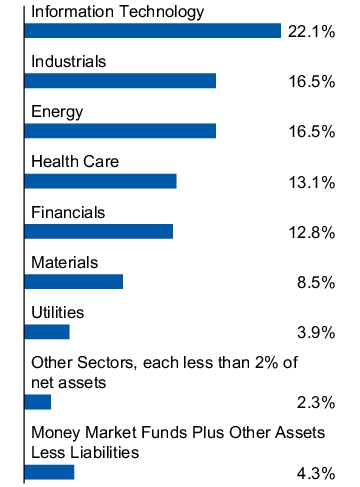
Top ten holdings*
(% of net assets)
(% of net assets)
| Coherent Corp. | 4.08% |
| Marvell Technology, Inc. | 3.15% |
| MKS, Inc. | 2.97% |
| Rambus, Inc. | 2.93% |
| STMicroelectronics N.V., New York Shares | 2.88% |
| Entegris, Inc. | 2.54% |
| Rentokil Initial PLC | 2.50% |
| Vertiv Holdings Co., Class A | 2.24% |
| NRG Energy, Inc. | 2.24% |
| Cenovus Energy, Inc. | 2.02% |
| * Excluding money market fund holdings, if any. |
What Were The Fund Costs For The Last Year ?
(Based on a hypothetical $10,000 investment)
| Fund (Class) | Costs of a $10,000 investment | Costs paid as a percentage of a $10,000 investment |
| Invesco Value Opportunities Fund (Class R6) |
$82 | 0.65% |
How Did The Fund Perform During The Period?
• During the fiscal year ended April 30, 2026, US equity markets experienced periods of volatility driven by geopolitical tensions, elevated energy prices, and uncertainty around inflation and the policy outlook. Despite these crosscurrents, markets proved resilient, with a sharp rebound in early 2026 with equities reaching new highs. Strength was led by information technology (IT) and artificial intelligence (AI)–related investments, which remained the dominant market drivers, supported by solid corporate earnings and continued economic growth. While investors became more discerning around AI-related opportunities, the theme continued to fuel capital spending, earnings growth, and market leadership.
• For the fiscal year ended April 30, 2026, Class R6 shares of the Fund returned 53.18%. For the same time the Russell Midcap® Value Index (the "Benchmark") returned 29.76%. The Fund outperformed the Benchmark primarily due to strong stock selection in the industrials and IT sectors. These sectors were also the largest contributors to absolute performance. Stock selection in materials, and a lack of exposure to real estate also aided relative returns. Conversely, stock selection in health care detracted the most from the Fund's relative and absolute return and stock selection in financials also detracted from the Fund's relative return. The Fund's cash holding, while approximately 4% on average, also detracted from returns in the strong market environment.
What contributed to performance?
Coherent Corp. | Coherent is a laser company that develops and manufactures optoelectronic components and devices. Its optical transceivers are key enablers for networking of AI servers. The company reported strong earnings and revenue growth, driven primarily by sustained demand from its AI‑related data center and communications markets.
Lumentum Holdings, Inc. | Shares of Lumentum Holdings, a market-leading designer and manufacturer of innovative optical and photonic products, rose in the first quarter of 2026 amid investor enthusiasm for its AI-driven growth potential, particularly for its advanced technology products used in data center applications.
AppLovin Corp. | AppLovin is a mobile technology firm that provides developers with tools to market, monetize, analyze and publish their apps. The company reported a strong increase in revenues, along with better-than-expected earnings and also announced its entry into the e-commerce market, which we believe may be another avenue for growth.
What detracted from performance?
Centene Corp. | Centene is a leading provider of both Medicaid and Affordable Care Act insurance coverage. Centene’s stock dropped sharply after the company pulled its 2025 earnings guidance due to lower growth in the health care exchange market and rising medical costs. The passage of the “One Big Beautiful Bill Act” put further pressure on shares, given the approximately $1 trillion in potential cuts to Medicaid.
Globant S.A. | Globant is a digital services and technology consulting firm that helps companies transform through innovation, design and software engineering. Shares declined sharply amid concerns about the long-term effect of AI on digital consulting and management’s more cautious forward guidance. We sold this position during the period.
Fidelity National Information Services, Inc. | Fidelity National Information Services, known as FIS, is a leading provider of technology solutions for merchants, banks and capital markets firms. The stock declined as FIS faced a number of headwinds, including tough year‑over‑year earnings comparisons in its capital markets segment, issues related to its sale of payment processing firm Worldpay, and short‑term profit margin dilution from a recent acquisition.
How Has The Fund Historically Performed?
Growth of $10,000 Investment
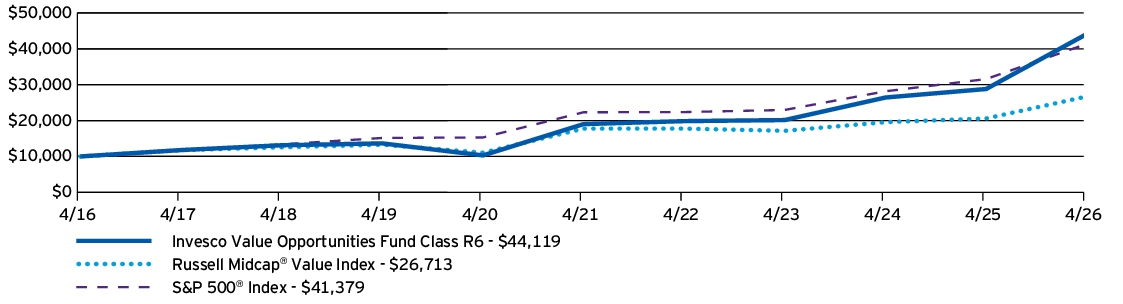
| AVERAGE ANNUAL TOTAL RETURNS | 1 Year | 5 Years | 10 Years |
| Invesco Value Opportunities Fund (Class R6) | 53.18% | 18.33% | 16.00% |
| Russell Midcap® Value Index | 29.76% | 8.50% | 10.32% |
| S&P 500® Index | 31.05% | 13.14% | 15.26% |
Performance figures do not reflect deduction of taxes a shareholder would pay on Fund distributions or sale of Fund shares.
What Are Key Statistics About The Fund?
(as of April 30, 2026)
| Fund net assets | $8,439,370,604 |
| Total number of portfolio holdings | 80 |
| Total advisory fees paid | $35,259,137 |
| Portfolio turnover rate | 86% |
What Comprised The Fund's Holdings?
(as of April 30, 2026)
Top ten holdings*
(% of net assets)
(% of net assets)
| Coherent Corp. | 4.08% |
| Marvell Technology, Inc. | 3.15% |
| MKS, Inc. | 2.97% |
| Rambus, Inc. | 2.93% |
| STMicroelectronics N.V., New York Shares | 2.88% |
| Entegris, Inc. | 2.54% |
| Rentokil Initial PLC | 2.50% |
| Vertiv Holdings Co., Class A | 2.24% |
| NRG Energy, Inc. | 2.24% |
| Cenovus Energy, Inc. | 2.02% |
| * Excluding money market fund holdings, if any. |
Sector allocation
(% of net assets)
(% of net assets)
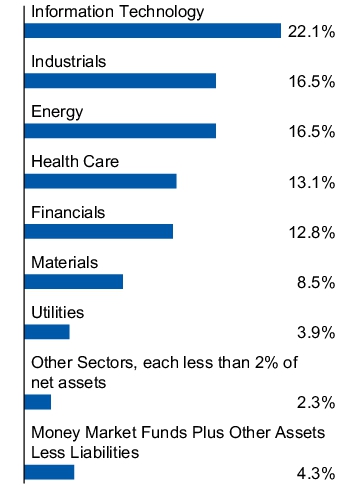
Top ten holdings*
(% of net assets)
(% of net assets)
| Coherent Corp. | 4.08% |
| Marvell Technology, Inc. | 3.15% |
| MKS, Inc. | 2.97% |
| Rambus, Inc. | 2.93% |
| STMicroelectronics N.V., New York Shares | 2.88% |
| Entegris, Inc. | 2.54% |
| Rentokil Initial PLC | 2.50% |
| Vertiv Holdings Co., Class A | 2.24% |
| NRG Energy, Inc. | 2.24% |
| Cenovus Energy, Inc. | 2.02% |
| * Excluding money market fund holdings, if any. |
This report describes changes to the Fund that occurred during the reporting period.
What Were The Fund Costs For The Last Year ?
(Based on a hypothetical $10,000 investment)
| Fund (Class) | Costs of a $10,000 investment | Costs paid as a percentage of a $10,000 investment |
| Invesco Gold & Special Minerals Fund (Class R6) |
$83 | 0.59% |
How Did The Fund Perform During The Period?
• During the fiscal year ended April 30, 2026, gold advanced to $4,642/oz (+43.32%) amid heightened geopolitical risk and tariff-related uncertainty. Gold and precious metals mining equities outperformed bullion and returned 93.36% over the period. While operating costs increased, the sector continued to prioritize financial discipline, demonstrating improved balance sheet strength and cost control relative to the COVID era, supporting earnings resilience and continued operating-margin expansion. Silver earnings growth, which led earlier in the year, subsequently moderated and was broadly in line with gold. Primary drivers for gold demand included sustained foreign central bank purchases, sizeable fiscal deficits across the US and other developed markets, and interest-rate cuts against a backdrop of moderating US growth.
• For the fiscal year ended April 30, 2026, Class R6 shares of the Fund returned 80.12%. For the same time period, the Philadelphia Gold & Silver Index (the “Benchmark”) returned 93.36%. Effective June 30, 2025, the investment process evolved. The Fund strategy continued to seek capital appreciation at a reasonable price, with a focus on quality of management and an active approach with off-Benchmark positions and use of options. Where the Fund strategy evolved, however, was in the use of systematic tools to evaluate company fundamentals using a systematic and proprietary process. For options, the focus shifted to index options instead of single stock options. During the period, the Fund sought to take advantage of favorable market conditions to offload smaller equity positions over the period and overall retained a beta of less than one, consistent with past experience.
What contributed to performance?
OceanaGold Corp. | OceanaGold is a Canada-based gold and copper producer. The company reported record revenue, profit, and cash flow during the fiscal year driven by surging gold prices, higher production, and a shift to higher‑grade underground mining, and shares rallied in response. The Fund benefited from holding this non-Benchmark name, which contributed to active return.
Newmont Corp. | Newmont is the world’s largest gold producer, based in the US. The company delivered strong performance during the fiscal year, driven by higher gold prices, proceeds from divesting non‑core assets, the ramp‑up of Ahafo North, and cost reductions, resulting in record earnings and free cash flow. This security was held at an overweight relative to the Benchmark, which added to relative performance.
What detracted from performance?
Barrick Mining Corp. | Barrick is one of the world’s largest gold producers, with operations globally. Shares rose during the fiscal year, driven by higher gold prices, delivery on production targets, and strong cash generation with capital returned through dividends and buybacks. The Fund held an underweight position, which detracted from active performance.
Coeur Mining, Inc. | Coeur Mining is a US-based precious metals producer. The company delivered strong share price performance during the fiscal year, driven by higher gold and silver prices and production growth from the Rochester expansion and Las Chispas integration. However, the position detracted from relative performance as it was held at an underweight.
How Has The Fund Historically Performed?
Growth of $10,000 Investment
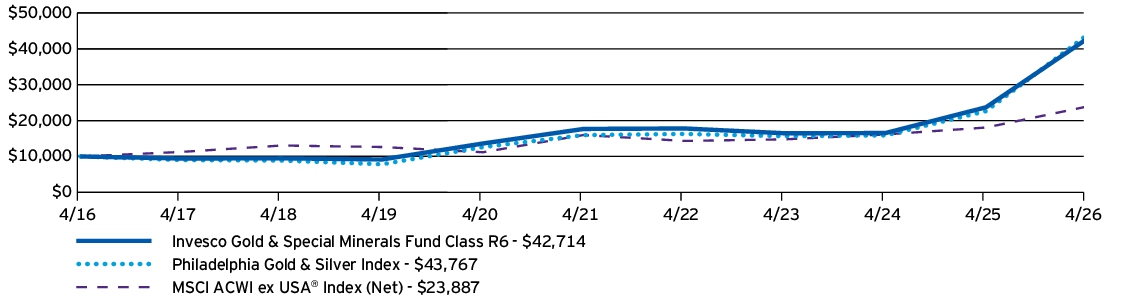
| AVERAGE ANNUAL TOTAL RETURNS | 1 Year | 5 Years | 10 Years |
| Invesco Gold & Special Minerals Fund (Class R6) | 80.12% | 19.31% | 15.63% |
| Philadelphia Gold & Silver Index | 93.36% | 22.37% | 15.91% |
| MSCI ACWI ex USA® Index (Net) | 32.20% | 8.38% | 9.10% |
Performance figures do not reflect deduction of taxes a shareholder would pay on Fund distributions or sale of Fund shares.
What Are Key Statistics About The Fund?
(as of April 30, 2026)
| Fund net assets | $4,194,191,589 |
| Total number of portfolio holdings | 88 |
| Total advisory fees paid | $19,574,388 |
| Portfolio turnover rate | 74% |
What Comprised The Fund's Holdings?
(as of April 30, 2026)
Top ten holdings*
(% of net assets)
(% of net assets)
| Newmont Corp. | 12.52% |
| Agnico Eagle Mines Ltd. | 10.12% |
| Barrick Mining Corp. | 4.70% |
| Kinross Gold Corp. | 4.63% |
| Franco-Nevada Corp. | 4.55% |
| Wheaton Precious Metals Corp. | 4.49% |
| Gold Fields Ltd., ADR | 3.55% |
| Zijin Mining Group Co. Ltd., H Shares | 3.10% |
| Pan American Silver Corp. | 3.06% |
| AngloGold Ashanti PLC | 3.01% |
| * Excluding money market fund holdings, if any. |
Industry allocation
(% of net assets)
(% of net assets)
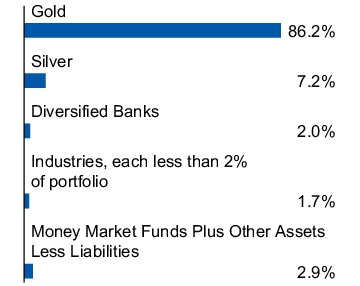
Top ten holdings*
(% of net assets)
(% of net assets)
| Newmont Corp. | 12.52% |
| Agnico Eagle Mines Ltd. | 10.12% |
| Barrick Mining Corp. | 4.70% |
| Kinross Gold Corp. | 4.63% |
| Franco-Nevada Corp. | 4.55% |
| Wheaton Precious Metals Corp. | 4.49% |
| Gold Fields Ltd., ADR | 3.55% |
| Zijin Mining Group Co. Ltd., H Shares | 3.10% |
| Pan American Silver Corp. | 3.06% |
| AngloGold Ashanti PLC | 3.01% |
| * Excluding money market fund holdings, if any. |
How Has The Fund Changed Over The Past Year?
This is a summary of certain changes to the Fund since April 30, 2025. For more complete information, you may review the Fund's prospectus, which is available at invesco.com/reports or upon request at (800) 959-4246.
The Fund modified its principal investment strategies and principal risks to reflect that the Fund may invest in equity-linked notes ("ELNs"), which are susceptible to the risks of their underlying securities or index, and which could include management risk, market risk and, as applicable, foreign securities and currency risks. ELNs are also subject to certain debt securities risks, such as interest rate and credit risks. Additionally, the trading market for certain ELNs may be less liquid than traditional investments and the Fund may not be able to sell ELNs at a desirable time or price.
The Fund also modified its principal investment strategies and principal risks to reflect that the Fund may utilize systematic strategies to evaluate companies for potential investment. Systematic strategies are based upon factors that measure securities relative to each other and may be highly reliant on data from third parties and other external sources. Any errors in the factors, or data on which measurements of those factors are based, could adversely affect the use of systematic strategies.
The Fund modified its principal investment strategies and principal risks to reflect that the Fund may invest in equity-linked notes ("ELNs"), which are susceptible to the risks of their underlying securities or index, and which could include management risk, market risk and, as applicable, foreign securities and currency risks. ELNs are also subject to certain debt securities risks, such as interest rate and credit risks. Additionally, the trading market for certain ELNs may be less liquid than traditional investments and the Fund may not be able to sell ELNs at a desirable time or price.
The Fund also modified its principal investment strategies and principal risks to reflect that the Fund may utilize systematic strategies to evaluate companies for potential investment. Systematic strategies are based upon factors that measure securities relative to each other and may be highly reliant on data from third parties and other external sources. Any errors in the factors, or data on which measurements of those factors are based, could adversely affect the use of systematic strategies.
The Fund modified its principal investment strategies and principal risks to reflect that the Fund may invest in equity-linked notes ("ELNs"), which are susceptible to the risks of their underlying securities or index, and which could include management risk, market risk and, as applicable, foreign securities and currency risks. ELNs are also subject to certain debt securities risks, such as interest rate and credit risks. Additionally, the trading market for certain ELNs may be less liquid than traditional investments and the Fund may not be able to sell ELNs at a desirable time or price.
The Fund also modified its principal investment strategies and principal risks to reflect that the Fund may utilize systematic strategies to evaluate companies for potential investment. Systematic strategies are based upon factors that measure securities relative to each other and may be highly reliant on data from third parties and other external sources. Any errors in the factors, or data on which measurements of those factors are based, could adversely affect the use of systematic strategies.
This is a summary of certain changes to the Fund since April 30, 2025. For more complete information, you may review the Fund's prospectus, which is available at invesco.com/reports or upon request at (800) 959-4246.
This report describes changes to the Fund that occurred during the reporting period.
What Were The Fund Costs For The Last Year ?
(Based on a hypothetical $10,000 investment)
| Fund (Class) | Costs of a $10,000 investment | Costs paid as a percentage of a $10,000 investment |
| Invesco Gold & Special Minerals Fund (Class R5) |
$92 | 0.66% |
How Did The Fund Perform During The Period?
• During the fiscal year ended April 30, 2026, gold advanced to $4,642/oz (+43.32%) amid heightened geopolitical risk and tariff-related uncertainty. Gold and precious metals mining equities outperformed bullion and returned 93.36% over the period. While operating costs increased, the sector continued to prioritize financial discipline, demonstrating improved balance sheet strength and cost control relative to the COVID era, supporting earnings resilience and continued operating-margin expansion. Silver earnings growth, which led earlier in the year, subsequently moderated and was broadly in line with gold. Primary drivers for gold demand included sustained foreign central bank purchases, sizeable fiscal deficits across the US and other developed markets, and interest-rate cuts against a backdrop of moderating US growth.
• For the fiscal year ended April 30, 2026, Class R5 shares of the Fund returned 79.99%. For the same time period, the Philadelphia Gold & Silver Index (the “Benchmark”) returned 93.36%. Effective June 30, 2025, the investment process evolved. The Fund strategy continued to seek capital appreciation at a reasonable price, with a focus on quality of management and an active approach with off-Benchmark positions and use of options. Where the Fund strategy evolved, however, was in the use of systematic tools to evaluate company fundamentals using a systematic and proprietary process. For options, the focus shifted to index options instead of single stock options. During the period, the Fund sought to take advantage of favorable market conditions to offload smaller equity positions over the period and overall retained a beta of less than one, consistent with past experience.
What contributed to performance?
OceanaGold Corp. | OceanaGold is a Canada-based gold and copper producer. The company reported record revenue, profit, and cash flow during the fiscal year driven by surging gold prices, higher production, and a shift to higher‑grade underground mining, and shares rallied in response. The Fund benefited from holding this non-Benchmark name, which contributed to active return.
Newmont Corp. | Newmont is the world’s largest gold producer, based in the US. The company delivered strong performance during the fiscal year, driven by higher gold prices, proceeds from divesting non‑core assets, the ramp‑up of Ahafo North, and cost reductions, resulting in record earnings and free cash flow. This security was held at an overweight relative to the Benchmark, which added to relative performance.
What detracted from performance?
Barrick Mining Corp. | Barrick is one of the world’s largest gold producers, with operations globally. Shares rose during the fiscal year, driven by higher gold prices, delivery on production targets, and strong cash generation with capital returned through dividends and buybacks. The Fund held an underweight position, which detracted from active performance.
Coeur Mining, Inc. | Coeur Mining is a US-based precious metals producer. The company delivered strong share price performance during the fiscal year, driven by higher gold and silver prices and production growth from the Rochester expansion and Las Chispas integration. However, the position detracted from relative performance as it was held at an underweight.
How Has The Fund Historically Performed?
Growth of $10,000 Investment
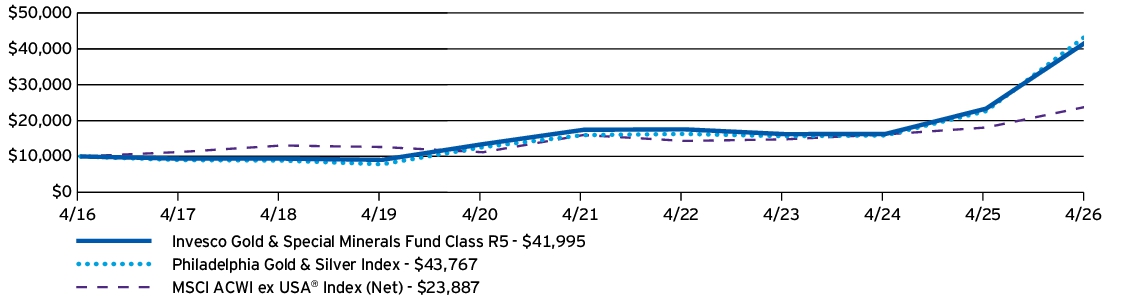
| AVERAGE ANNUAL TOTAL RETURNS | 1 Year | 5 Years | 10 Years |
| Invesco Gold & Special Minerals Fund (Class R5) | 79.99% | 19.23% | 15.43% |
| Philadelphia Gold & Silver Index | 93.36% | 22.37% | 15.91% |
| MSCI ACWI ex USA® Index (Net) | 32.20% | 8.38% | 9.10% |
Performance figures do not reflect deduction of taxes a shareholder would pay on Fund distributions or sale of Fund shares.
What Are Key Statistics About The Fund?
(as of April 30, 2026)
| Fund net assets | $4,194,191,589 |
| Total number of portfolio holdings | 88 |
| Total advisory fees paid | $19,574,388 |
| Portfolio turnover rate | 74% |
What Comprised The Fund's Holdings?
(as of April 30, 2026)
Top ten holdings*
(% of net assets)
(% of net assets)
| Newmont Corp. | 12.52% |
| Agnico Eagle Mines Ltd. | 10.12% |
| Barrick Mining Corp. | 4.70% |
| Kinross Gold Corp. | 4.63% |
| Franco-Nevada Corp. | 4.55% |
| Wheaton Precious Metals Corp. | 4.49% |
| Gold Fields Ltd., ADR | 3.55% |
| Zijin Mining Group Co. Ltd., H Shares | 3.10% |
| Pan American Silver Corp. | 3.06% |
| AngloGold Ashanti PLC | 3.01% |
| * Excluding money market fund holdings, if any. |
Industry allocation
(% of net assets)
(% of net assets)
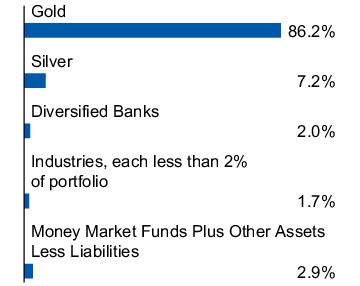
Top ten holdings*
(% of net assets)
(% of net assets)
| Newmont Corp. | 12.52% |
| Agnico Eagle Mines Ltd. | 10.12% |
| Barrick Mining Corp. | 4.70% |
| Kinross Gold Corp. | 4.63% |
| Franco-Nevada Corp. | 4.55% |
| Wheaton Precious Metals Corp. | 4.49% |
| Gold Fields Ltd., ADR | 3.55% |
| Zijin Mining Group Co. Ltd., H Shares | 3.10% |
| Pan American Silver Corp. | 3.06% |
| AngloGold Ashanti PLC | 3.01% |
| * Excluding money market fund holdings, if any. |
How Has The Fund Changed Over The Past Year?
This is a summary of certain changes to the Fund since April 30, 2025. For more complete information, you may review the Fund's prospectus, which is available at invesco.com/reports or upon request at (800) 959-4246.
The Fund modified its principal investment strategies and principal risks to reflect that the Fund may invest in equity-linked notes ("ELNs"), which are susceptible to the risks of their underlying securities or index, and which could include management risk, market risk and, as applicable, foreign securities and currency risks. ELNs are also subject to certain debt securities risks, such as interest rate and credit risks. Additionally, the trading market for certain ELNs may be less liquid than traditional investments and the Fund may not be able to sell ELNs at a desirable time or price.
The Fund also modified its principal investment strategies and principal risks to reflect that the Fund may utilize systematic strategies to evaluate companies for potential investment. Systematic strategies are based upon factors that measure securities relative to each other and may be highly reliant on data from third parties and other external sources. Any errors in the factors, or data on which measurements of those factors are based, could adversely affect the use of systematic strategies.
The Fund modified its principal investment strategies and principal risks to reflect that the Fund may invest in equity-linked notes ("ELNs"), which are susceptible to the risks of their underlying securities or index, and which could include management risk, market risk and, as applicable, foreign securities and currency risks. ELNs are also subject to certain debt securities risks, such as interest rate and credit risks. Additionally, the trading market for certain ELNs may be less liquid than traditional investments and the Fund may not be able to sell ELNs at a desirable time or price.
The Fund also modified its principal investment strategies and principal risks to reflect that the Fund may utilize systematic strategies to evaluate companies for potential investment. Systematic strategies are based upon factors that measure securities relative to each other and may be highly reliant on data from third parties and other external sources. Any errors in the factors, or data on which measurements of those factors are based, could adversely affect the use of systematic strategies.
The Fund modified its principal investment strategies and principal risks to reflect that the Fund may invest in equity-linked notes ("ELNs"), which are susceptible to the risks of their underlying securities or index, and which could include management risk, market risk and, as applicable, foreign securities and currency risks. ELNs are also subject to certain debt securities risks, such as interest rate and credit risks. Additionally, the trading market for certain ELNs may be less liquid than traditional investments and the Fund may not be able to sell ELNs at a desirable time or price.
The Fund also modified its principal investment strategies and principal risks to reflect that the Fund may utilize systematic strategies to evaluate companies for potential investment. Systematic strategies are based upon factors that measure securities relative to each other and may be highly reliant on data from third parties and other external sources. Any errors in the factors, or data on which measurements of those factors are based, could adversely affect the use of systematic strategies.
This is a summary of certain changes to the Fund since April 30, 2025. For more complete information, you may review the Fund's prospectus, which is available at invesco.com/reports or upon request at (800) 959-4246.
This report describes changes to the Fund that occurred during the reporting period.
What Were The Fund Costs For The Last Year ?
(Based on a hypothetical $10,000 investment)
| Fund (Class) | Costs of a $10,000 investment | Costs paid as a percentage of a $10,000 investment |
| Invesco Gold & Special Minerals Fund (Class Y) |
$98 | 0.70% |
How Did The Fund Perform During The Period?
• During the fiscal year ended April 30, 2026, gold advanced to $4,642/oz (+43.32%) amid heightened geopolitical risk and tariff-related uncertainty. Gold and precious metals mining equities outperformed bullion and returned 93.36% over the period. While operating costs increased, the sector continued to prioritize financial discipline, demonstrating improved balance sheet strength and cost control relative to the COVID era, supporting earnings resilience and continued operating-margin expansion. Silver earnings growth, which led earlier in the year, subsequently moderated and was broadly in line with gold. Primary drivers for gold demand included sustained foreign central bank purchases, sizeable fiscal deficits across the US and other developed markets, and interest-rate cuts against a backdrop of moderating US growth.
• For the fiscal year ended April 30, 2026, Class Y shares of the Fund returned 79.89%. For the same time period, the Philadelphia Gold & Silver Index (the “Benchmark”) returned 93.36%. Effective June 30, 2025, the investment process evolved. The Fund strategy continued to seek capital appreciation at a reasonable price, with a focus on quality of management and an active approach with off-Benchmark positions and use of options. Where the Fund strategy evolved, however, was in the use of systematic tools to evaluate company fundamentals using a systematic and proprietary process. For options, the focus shifted to index options instead of single stock options. During the period, the Fund sought to take advantage of favorable market conditions to offload smaller equity positions over the period and overall retained a beta of less than one, consistent with past experience.
What contributed to performance?
OceanaGold Corp. | OceanaGold is a Canada-based gold and copper producer. The company reported record revenue, profit, and cash flow during the fiscal year driven by surging gold prices, higher production, and a shift to higher‑grade underground mining, and shares rallied in response. The Fund benefited from holding this non-Benchmark name, which contributed to active return.
Newmont Corp. | Newmont is the world’s largest gold producer, based in the US. The company delivered strong performance during the fiscal year, driven by higher gold prices, proceeds from divesting non‑core assets, the ramp‑up of Ahafo North, and cost reductions, resulting in record earnings and free cash flow. This security was held at an overweight relative to the Benchmark, which added to relative performance.
What detracted from performance?
Barrick Mining Corp. | Barrick is one of the world’s largest gold producers, with operations globally. Shares rose during the fiscal year, driven by higher gold prices, delivery on production targets, and strong cash generation with capital returned through dividends and buybacks. The Fund held an underweight position, which detracted from active performance.
Coeur Mining, Inc. | Coeur Mining is a US-based precious metals producer. The company delivered strong share price performance during the fiscal year, driven by higher gold and silver prices and production growth from the Rochester expansion and Las Chispas integration. However, the position detracted from relative performance as it was held at an underweight.
How Has The Fund Historically Performed?
Growth of $10,000 Investment
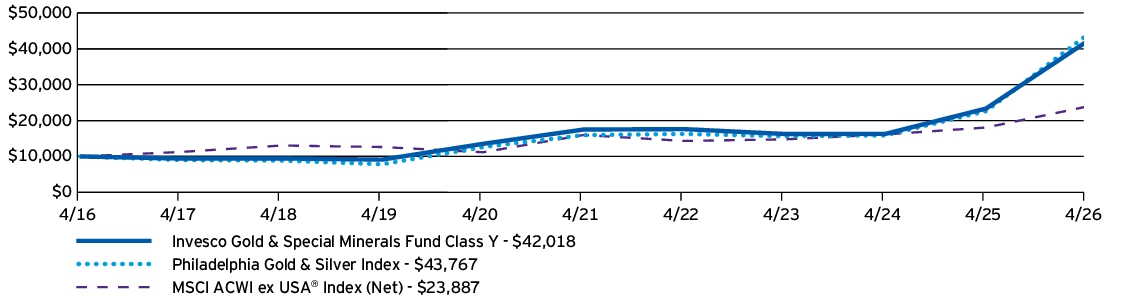
| AVERAGE ANNUAL TOTAL RETURNS | 1 Year | 5 Years | 10 Years |
| Invesco Gold & Special Minerals Fund (Class Y) | 79.89% | 19.14% | 15.44% |
| Philadelphia Gold & Silver Index | 93.36% | 22.37% | 15.91% |
| MSCI ACWI ex USA® Index (Net) | 32.20% | 8.38% | 9.10% |
Performance figures do not reflect deduction of taxes a shareholder would pay on Fund distributions or sale of Fund shares.
What Are Key Statistics About The Fund?
(as of April 30, 2026)
| Fund net assets | $4,194,191,589 |
| Total number of portfolio holdings | 88 |
| Total advisory fees paid | $19,574,388 |
| Portfolio turnover rate | 74% |
What Comprised The Fund's Holdings?
(as of April 30, 2026)
Top ten holdings*
(% of net assets)
(% of net assets)
| Newmont Corp. | 12.52% |
| Agnico Eagle Mines Ltd. | 10.12% |
| Barrick Mining Corp. | 4.70% |
| Kinross Gold Corp. | 4.63% |
| Franco-Nevada Corp. | 4.55% |
| Wheaton Precious Metals Corp. | 4.49% |
| Gold Fields Ltd., ADR | 3.55% |
| Zijin Mining Group Co. Ltd., H Shares | 3.10% |
| Pan American Silver Corp. | 3.06% |
| AngloGold Ashanti PLC | 3.01% |
| * Excluding money market fund holdings, if any. |
Industry allocation
(% of net assets)
(% of net assets)
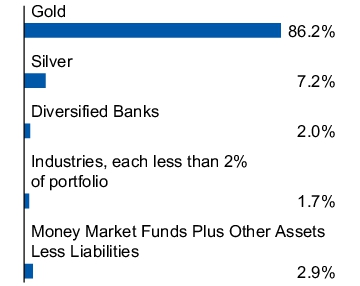
Top ten holdings*
(% of net assets)
(% of net assets)
| Newmont Corp. | 12.52% |
| Agnico Eagle Mines Ltd. | 10.12% |
| Barrick Mining Corp. | 4.70% |
| Kinross Gold Corp. | 4.63% |
| Franco-Nevada Corp. | 4.55% |
| Wheaton Precious Metals Corp. | 4.49% |
| Gold Fields Ltd., ADR | 3.55% |
| Zijin Mining Group Co. Ltd., H Shares | 3.10% |
| Pan American Silver Corp. | 3.06% |
| AngloGold Ashanti PLC | 3.01% |
| * Excluding money market fund holdings, if any. |
How Has The Fund Changed Over The Past Year?
This is a summary of certain changes to the Fund since April 30, 2025. For more complete information, you may review the Fund's prospectus, which is available at invesco.com/reports or upon request at (800) 959-4246.
The Fund modified its principal investment strategies and principal risks to reflect that the Fund may invest in equity-linked notes ("ELNs"), which are susceptible to the risks of their underlying securities or index, and which could include management risk, market risk and, as applicable, foreign securities and currency risks. ELNs are also subject to certain debt securities risks, such as interest rate and credit risks. Additionally, the trading market for certain ELNs may be less liquid than traditional investments and the Fund may not be able to sell ELNs at a desirable time or price.
The Fund also modified its principal investment strategies and principal risks to reflect that the Fund may utilize systematic strategies to evaluate companies for potential investment. Systematic strategies are based upon factors that measure securities relative to each other and may be highly reliant on data from third parties and other external sources. Any errors in the factors, or data on which measurements of those factors are based, could adversely affect the use of systematic strategies.
The Fund modified its principal investment strategies and principal risks to reflect that the Fund may invest in equity-linked notes ("ELNs"), which are susceptible to the risks of their underlying securities or index, and which could include management risk, market risk and, as applicable, foreign securities and currency risks. ELNs are also subject to certain debt securities risks, such as interest rate and credit risks. Additionally, the trading market for certain ELNs may be less liquid than traditional investments and the Fund may not be able to sell ELNs at a desirable time or price.
The Fund also modified its principal investment strategies and principal risks to reflect that the Fund may utilize systematic strategies to evaluate companies for potential investment. Systematic strategies are based upon factors that measure securities relative to each other and may be highly reliant on data from third parties and other external sources. Any errors in the factors, or data on which measurements of those factors are based, could adversely affect the use of systematic strategies.
The Fund modified its principal investment strategies and principal risks to reflect that the Fund may invest in equity-linked notes ("ELNs"), which are susceptible to the risks of their underlying securities or index, and which could include management risk, market risk and, as applicable, foreign securities and currency risks. ELNs are also subject to certain debt securities risks, such as interest rate and credit risks. Additionally, the trading market for certain ELNs may be less liquid than traditional investments and the Fund may not be able to sell ELNs at a desirable time or price.
The Fund also modified its principal investment strategies and principal risks to reflect that the Fund may utilize systematic strategies to evaluate companies for potential investment. Systematic strategies are based upon factors that measure securities relative to each other and may be highly reliant on data from third parties and other external sources. Any errors in the factors, or data on which measurements of those factors are based, could adversely affect the use of systematic strategies.
This is a summary of certain changes to the Fund since April 30, 2025. For more complete information, you may review the Fund's prospectus, which is available at invesco.com/reports or upon request at (800) 959-4246.
This report describes changes to the Fund that occurred during the reporting period.
What Were The Fund Costs For The Last Year ?
(Based on a hypothetical $10,000 investment)
| Fund (Class) | Costs of a $10,000 investment | Costs paid as a percentage of a $10,000 investment |
| Invesco Gold & Special Minerals Fund (Class R) |
$167 | 1.20% |
How Did The Fund Perform During The Period?
• During the fiscal year ended April 30, 2026, gold advanced to $4,642/oz (+43.32%) amid heightened geopolitical risk and tariff-related uncertainty. Gold and precious metals mining equities outperformed bullion and returned 93.36% over the period. While operating costs increased, the sector continued to prioritize financial discipline, demonstrating improved balance sheet strength and cost control relative to the COVID era, supporting earnings resilience and continued operating-margin expansion. Silver earnings growth, which led earlier in the year, subsequently moderated and was broadly in line with gold. Primary drivers for gold demand included sustained foreign central bank purchases, sizeable fiscal deficits across the US and other developed markets, and interest-rate cuts against a backdrop of moderating US growth.
• For the fiscal year ended April 30, 2026, Class R shares of the Fund returned 78.94%. For the same time period, the Philadelphia Gold & Silver Index (the “Benchmark”) returned 93.36%. Effective June 30, 2025, the investment process evolved. The Fund strategy continued to seek capital appreciation at a reasonable price, with a focus on quality of management and an active approach with off-Benchmark positions and use of options. Where the Fund strategy evolved, however, was in the use of systematic tools to evaluate company fundamentals using a systematic and proprietary process. For options, the focus shifted to index options instead of single stock options. During the period, the Fund sought to take advantage of favorable market conditions to offload smaller equity positions over the period and overall retained a beta of less than one, consistent with past experience.
What contributed to performance?
OceanaGold Corp. | OceanaGold is a Canada-based gold and copper producer. The company reported record revenue, profit, and cash flow during the fiscal year driven by surging gold prices, higher production, and a shift to higher‑grade underground mining, and shares rallied in response. The Fund benefited from holding this non-Benchmark name, which contributed to active return.
Newmont Corp. | Newmont is the world’s largest gold producer, based in the US. The company delivered strong performance during the fiscal year, driven by higher gold prices, proceeds from divesting non‑core assets, the ramp‑up of Ahafo North, and cost reductions, resulting in record earnings and free cash flow. This security was held at an overweight relative to the Benchmark, which added to relative performance.
What detracted from performance?
Barrick Mining Corp. | Barrick is one of the world’s largest gold producers, with operations globally. Shares rose during the fiscal year, driven by higher gold prices, delivery on production targets, and strong cash generation with capital returned through dividends and buybacks. The Fund held an underweight position, which detracted from active performance.
Coeur Mining, Inc. | Coeur Mining is a US-based precious metals producer. The company delivered strong share price performance during the fiscal year, driven by higher gold and silver prices and production growth from the Rochester expansion and Las Chispas integration. However, the position detracted from relative performance as it was held at an underweight.
How Has The Fund Historically Performed?
Growth of $10,000 Investment
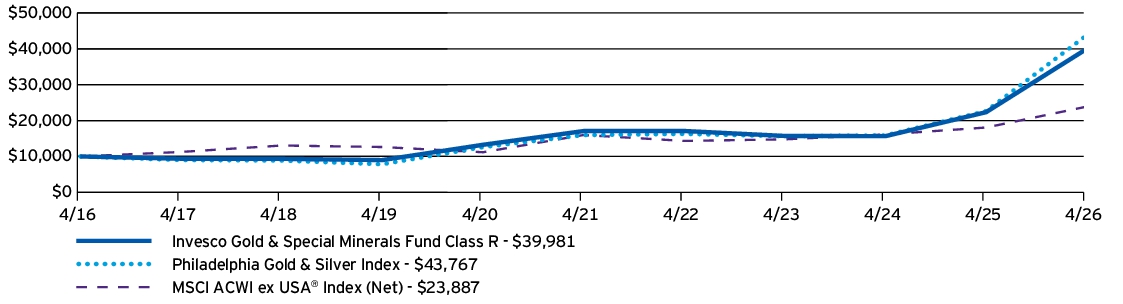
| AVERAGE ANNUAL TOTAL RETURNS | 1 Year | 5 Years | 10 Years |
| Invesco Gold & Special Minerals Fund (Class R) | 78.94% | 18.55% | 14.86% |
| Philadelphia Gold & Silver Index | 93.36% | 22.37% | 15.91% |
| MSCI ACWI ex USA® Index (Net) | 32.20% | 8.38% | 9.10% |
Performance figures do not reflect deduction of taxes a shareholder would pay on Fund distributions or sale of Fund shares.
What Are Key Statistics About The Fund?
(as of April 30, 2026)
| Fund net assets | $4,194,191,589 |
| Total number of portfolio holdings | 88 |
| Total advisory fees paid | $19,574,388 |
| Portfolio turnover rate | 74% |
What Comprised The Fund's Holdings?
(as of April 30, 2026)
Top ten holdings*
(% of net assets)
(% of net assets)
| Newmont Corp. | 12.52% |
| Agnico Eagle Mines Ltd. | 10.12% |
| Barrick Mining Corp. | 4.70% |
| Kinross Gold Corp. | 4.63% |
| Franco-Nevada Corp. | 4.55% |
| Wheaton Precious Metals Corp. | 4.49% |
| Gold Fields Ltd., ADR | 3.55% |
| Zijin Mining Group Co. Ltd., H Shares | 3.10% |
| Pan American Silver Corp. | 3.06% |
| AngloGold Ashanti PLC | 3.01% |
| * Excluding money market fund holdings, if any. |
Industry allocation
(% of net assets)
(% of net assets)
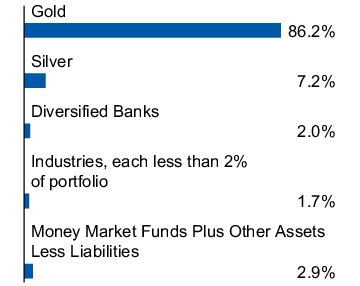
Top ten holdings*
(% of net assets)
(% of net assets)
| Newmont Corp. | 12.52% |
| Agnico Eagle Mines Ltd. | 10.12% |
| Barrick Mining Corp. | 4.70% |
| Kinross Gold Corp. | 4.63% |
| Franco-Nevada Corp. | 4.55% |
| Wheaton Precious Metals Corp. | 4.49% |
| Gold Fields Ltd., ADR | 3.55% |
| Zijin Mining Group Co. Ltd., H Shares | 3.10% |
| Pan American Silver Corp. | 3.06% |
| AngloGold Ashanti PLC | 3.01% |
| * Excluding money market fund holdings, if any. |
How Has The Fund Changed Over The Past Year?
This is a summary of certain changes to the Fund since April 30, 2025. For more complete information, you may review the Fund's prospectus, which is available at invesco.com/reports or upon request at (800) 959-4246.
The Fund modified its principal investment strategies and principal risks to reflect that the Fund may invest in equity-linked notes ("ELNs"), which are susceptible to the risks of their underlying securities or index, and which could include management risk, market risk and, as applicable, foreign securities and currency risks. ELNs are also subject to certain debt securities risks, such as interest rate and credit risks. Additionally, the trading market for certain ELNs may be less liquid than traditional investments and the Fund may not be able to sell ELNs at a desirable time or price.
The Fund also modified its principal investment strategies and principal risks to reflect that the Fund may utilize systematic strategies to evaluate companies for potential investment. Systematic strategies are based upon factors that measure securities relative to each other and may be highly reliant on data from third parties and other external sources. Any errors in the factors, or data on which measurements of those factors are based, could adversely affect the use of systematic strategies.
The Fund modified its principal investment strategies and principal risks to reflect that the Fund may invest in equity-linked notes ("ELNs"), which are susceptible to the risks of their underlying securities or index, and which could include management risk, market risk and, as applicable, foreign securities and currency risks. ELNs are also subject to certain debt securities risks, such as interest rate and credit risks. Additionally, the trading market for certain ELNs may be less liquid than traditional investments and the Fund may not be able to sell ELNs at a desirable time or price.
The Fund also modified its principal investment strategies and principal risks to reflect that the Fund may utilize systematic strategies to evaluate companies for potential investment. Systematic strategies are based upon factors that measure securities relative to each other and may be highly reliant on data from third parties and other external sources. Any errors in the factors, or data on which measurements of those factors are based, could adversely affect the use of systematic strategies.
The Fund modified its principal investment strategies and principal risks to reflect that the Fund may invest in equity-linked notes ("ELNs"), which are susceptible to the risks of their underlying securities or index, and which could include management risk, market risk and, as applicable, foreign securities and currency risks. ELNs are also subject to certain debt securities risks, such as interest rate and credit risks. Additionally, the trading market for certain ELNs may be less liquid than traditional investments and the Fund may not be able to sell ELNs at a desirable time or price.
The Fund also modified its principal investment strategies and principal risks to reflect that the Fund may utilize systematic strategies to evaluate companies for potential investment. Systematic strategies are based upon factors that measure securities relative to each other and may be highly reliant on data from third parties and other external sources. Any errors in the factors, or data on which measurements of those factors are based, could adversely affect the use of systematic strategies.
This is a summary of certain changes to the Fund since April 30, 2025. For more complete information, you may review the Fund's prospectus, which is available at invesco.com/reports or upon request at (800) 959-4246.
This report describes changes to the Fund that occurred during the reporting period.
What Were The Fund Costs For The Last Year ?
(Based on a hypothetical $10,000 investment)
| Fund (Class) | Costs of a $10,000 investment | Costs paid as a percentage of a $10,000 investment |
| Invesco Gold & Special Minerals Fund (Class C) |
$236 | 1.70% |
How Did The Fund Perform During The Period?
• During the fiscal year ended April 30, 2026, gold advanced to $4,642/oz (+43.32%) amid heightened geopolitical risk and tariff-related uncertainty. Gold and precious metals mining equities outperformed bullion and returned 93.36% over the period. While operating costs increased, the sector continued to prioritize financial discipline, demonstrating improved balance sheet strength and cost control relative to the COVID era, supporting earnings resilience and continued operating-margin expansion. Silver earnings growth, which led earlier in the year, subsequently moderated and was broadly in line with gold. Primary drivers for gold demand included sustained foreign central bank purchases, sizeable fiscal deficits across the US and other developed markets, and interest-rate cuts against a backdrop of moderating US growth.
• For the fiscal year ended April 30, 2026, Class C shares of the Fund, excluding sales charge, returned 78.08%. For the same time period, the Philadelphia Gold & Silver Index (the “Benchmark”) returned 93.36%. Effective June 30, 2025, the investment process evolved. The Fund strategy continued to seek capital appreciation at a reasonable price, with a focus on quality of management and an active approach with off-Benchmark positions and use of options. Where the Fund strategy evolved, however, was in the use of systematic tools to evaluate company fundamentals using a systematic and proprietary process. For options, the focus shifted to index options instead of single stock options. During the period, the Fund sought to take advantage of favorable market conditions to offload smaller equity positions over the period and overall retained a beta of less than one, consistent with past experience.
What contributed to performance?
OceanaGold Corp. | OceanaGold is a Canada-based gold and copper producer. The company reported record revenue, profit, and cash flow during the fiscal year driven by surging gold prices, higher production, and a shift to higher‑grade underground mining, and shares rallied in response. The Fund benefited from holding this non-Benchmark name, which contributed to active return.
Newmont Corp. | Newmont is the world’s largest gold producer, based in the US. The company delivered strong performance during the fiscal year, driven by higher gold prices, proceeds from divesting non‑core assets, the ramp‑up of Ahafo North, and cost reductions, resulting in record earnings and free cash flow. This security was held at an overweight relative to the Benchmark, which added to relative performance.
What detracted from performance?
Barrick Mining Corp. | Barrick is one of the world’s largest gold producers, with operations globally. Shares rose during the fiscal year, driven by higher gold prices, delivery on production targets, and strong cash generation with capital returned through dividends and buybacks. The Fund held an underweight position, which detracted from active performance.
Coeur Mining, Inc. | Coeur Mining is a US-based precious metals producer. The company delivered strong share price performance during the fiscal year, driven by higher gold and silver prices and production growth from the Rochester expansion and Las Chispas integration. However, the position detracted from relative performance as it was held at an underweight.
How Has The Fund Historically Performed?
Growth of $10,000 Investment
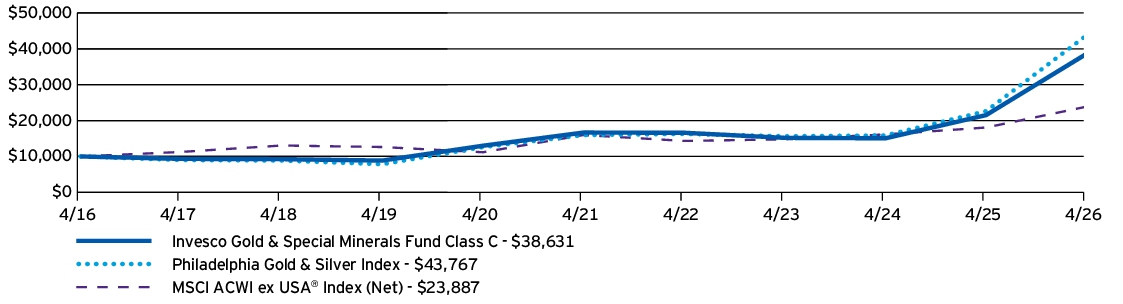
| AVERAGE ANNUAL TOTAL RETURNS | 1 Year | 5 Years | 10 Years |
| Invesco Gold & Special Minerals Fund (Class C) —including sales charge | 77.08% | 17.95% | 14.47% |
| Invesco Gold & Special Minerals Fund (Class C) —excluding sales charge | 78.08% | 17.95% | 14.47% |
| Philadelphia Gold & Silver Index | 93.36% | 22.37% | 15.91% |
| MSCI ACWI ex USA® Index (Net) | 32.20% | 8.38% | 9.10% |
Performance figures do not reflect deduction of taxes a shareholder would pay on Fund distributions or sale of Fund shares.
What Are Key Statistics About The Fund?
(as of April 30, 2026)
| Fund net assets | $4,194,191,589 |
| Total number of portfolio holdings | 88 |
| Total advisory fees paid | $19,574,388 |
| Portfolio turnover rate | 74% |
What Comprised The Fund's Holdings?
(as of April 30, 2026)
Top ten holdings*
(% of net assets)
(% of net assets)
| Newmont Corp. | 12.52% |
| Agnico Eagle Mines Ltd. | 10.12% |
| Barrick Mining Corp. | 4.70% |
| Kinross Gold Corp. | 4.63% |
| Franco-Nevada Corp. | 4.55% |
| Wheaton Precious Metals Corp. | 4.49% |
| Gold Fields Ltd., ADR | 3.55% |
| Zijin Mining Group Co. Ltd., H Shares | 3.10% |
| Pan American Silver Corp. | 3.06% |
| AngloGold Ashanti PLC | 3.01% |
| * Excluding money market fund holdings, if any. |
Industry allocation
(% of net assets)
(% of net assets)
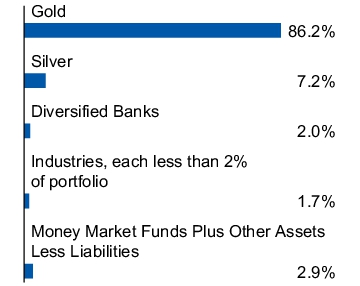
Top ten holdings*
(% of net assets)
(% of net assets)
| Newmont Corp. | 12.52% |
| Agnico Eagle Mines Ltd. | 10.12% |
| Barrick Mining Corp. | 4.70% |
| Kinross Gold Corp. | 4.63% |
| Franco-Nevada Corp. | 4.55% |
| Wheaton Precious Metals Corp. | 4.49% |
| Gold Fields Ltd., ADR | 3.55% |
| Zijin Mining Group Co. Ltd., H Shares | 3.10% |
| Pan American Silver Corp. | 3.06% |
| AngloGold Ashanti PLC | 3.01% |
| * Excluding money market fund holdings, if any. |
How Has The Fund Changed Over The Past Year?
This is a summary of certain changes to the Fund since April 30, 2025. For more complete information, you may review the Fund's prospectus, which is available at invesco.com/reports or upon request at (800) 959-4246.
The Fund modified its principal investment strategies and principal risks to reflect that the Fund may invest in equity-linked notes ("ELNs"), which are susceptible to the risks of their underlying securities or index, and which could include management risk, market risk and, as applicable, foreign securities and currency risks. ELNs are also subject to certain debt securities risks, such as interest rate and credit risks. Additionally, the trading market for certain ELNs may be less liquid than traditional investments and the Fund may not be able to sell ELNs at a desirable time or price.
The Fund also modified its principal investment strategies and principal risks to reflect that the Fund may utilize systematic strategies to evaluate companies for potential investment. Systematic strategies are based upon factors that measure securities relative to each other and may be highly reliant on data from third parties and other external sources. Any errors in the factors, or data on which measurements of those factors are based, could adversely affect the use of systematic strategies.
The Fund modified its principal investment strategies and principal risks to reflect that the Fund may invest in equity-linked notes ("ELNs"), which are susceptible to the risks of their underlying securities or index, and which could include management risk, market risk and, as applicable, foreign securities and currency risks. ELNs are also subject to certain debt securities risks, such as interest rate and credit risks. Additionally, the trading market for certain ELNs may be less liquid than traditional investments and the Fund may not be able to sell ELNs at a desirable time or price.
The Fund also modified its principal investment strategies and principal risks to reflect that the Fund may utilize systematic strategies to evaluate companies for potential investment. Systematic strategies are based upon factors that measure securities relative to each other and may be highly reliant on data from third parties and other external sources. Any errors in the factors, or data on which measurements of those factors are based, could adversely affect the use of systematic strategies.
The Fund modified its principal investment strategies and principal risks to reflect that the Fund may invest in equity-linked notes ("ELNs"), which are susceptible to the risks of their underlying securities or index, and which could include management risk, market risk and, as applicable, foreign securities and currency risks. ELNs are also subject to certain debt securities risks, such as interest rate and credit risks. Additionally, the trading market for certain ELNs may be less liquid than traditional investments and the Fund may not be able to sell ELNs at a desirable time or price.
The Fund also modified its principal investment strategies and principal risks to reflect that the Fund may utilize systematic strategies to evaluate companies for potential investment. Systematic strategies are based upon factors that measure securities relative to each other and may be highly reliant on data from third parties and other external sources. Any errors in the factors, or data on which measurements of those factors are based, could adversely affect the use of systematic strategies.
This is a summary of certain changes to the Fund since April 30, 2025. For more complete information, you may review the Fund's prospectus, which is available at invesco.com/reports or upon request at (800) 959-4246.
This report describes changes to the Fund that occurred during the reporting period.
What Were The Fund Costs For The Last Year ?
(Based on a hypothetical $10,000 investment)
| Fund (Class) | Costs of a $10,000 investment | Costs paid as a percentage of a $10,000 investment |
| Invesco Gold & Special Minerals Fund (Class A) |
$131 | 0.94% |
How Did The Fund Perform During The Period?
• During the fiscal year ended April 30, 2026, gold advanced to $4,642/oz (+43.32%) amid heightened geopolitical risk and tariff-related uncertainty. Gold and precious metals mining equities outperformed bullion and returned 93.36% over the period. While operating costs increased, the sector continued to prioritize financial discipline, demonstrating improved balance sheet strength and cost control relative to the COVID era, supporting earnings resilience and continued operating-margin expansion. Silver earnings growth, which led earlier in the year, subsequently moderated and was broadly in line with gold. Primary drivers for gold demand included sustained foreign central bank purchases, sizeable fiscal deficits across the US and other developed markets, and interest-rate cuts against a backdrop of moderating US growth.
• For the fiscal year ended April 30, 2026, Class A shares of the Fund, excluding sales charge, returned 79.44%. For the same time period, the Philadelphia Gold & Silver Index (the “Benchmark”) returned 93.36%. Effective June 30, 2025, the investment process evolved. The Fund strategy continued to seek capital appreciation at a reasonable price, with a focus on quality of management and an active approach with off-Benchmark positions and use of options. Where the Fund strategy evolved, however, was in the use of systematic tools to evaluate company fundamentals using a systematic and proprietary process. For options, the focus shifted to index options instead of single stock options. During the period, the Fund sought to take advantage of favorable market conditions to offload smaller equity positions over the period and overall retained a beta of less than one, consistent with past experience.
What contributed to performance?
OceanaGold Corp. | OceanaGold is a Canada-based gold and copper producer. The company reported record revenue, profit, and cash flow during the fiscal year driven by surging gold prices, higher production, and a shift to higher‑grade underground mining, and shares rallied in response. The Fund benefited from holding this non-Benchmark name, which contributed to active return.
Newmont Corp. | Newmont is the world’s largest gold producer, based in the US. The company delivered strong performance during the fiscal year, driven by higher gold prices, proceeds from divesting non‑core assets, the ramp‑up of Ahafo North, and cost reductions, resulting in record earnings and free cash flow. This security was held at an overweight relative to the Benchmark, which added to relative performance.
What detracted from performance?
Barrick Mining Corp. | Barrick is one of the world’s largest gold producers, with operations globally. Shares rose during the fiscal year, driven by higher gold prices, delivery on production targets, and strong cash generation with capital returned through dividends and buybacks. The Fund held an underweight position, which detracted from active performance.
Coeur Mining, Inc. | Coeur Mining is a US-based precious metals producer. The company delivered strong share price performance during the fiscal year, driven by higher gold and silver prices and production growth from the Rochester expansion and Las Chispas integration. However, the position detracted from relative performance as it was held at an underweight.
How Has The Fund Historically Performed?
Growth of $10,000 Investment
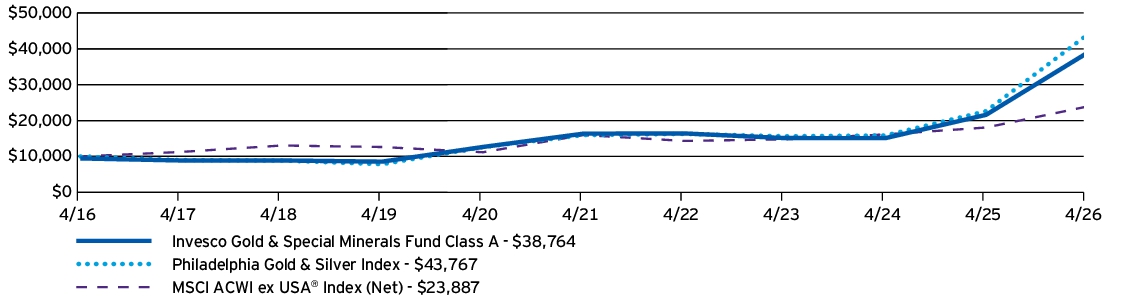
| AVERAGE ANNUAL TOTAL RETURNS | 1 Year | 5 Years | 10 Years |
| Invesco Gold & Special Minerals Fund (Class A) —including sales charge | 69.57% | 17.51% | 14.51% |
| Invesco Gold & Special Minerals Fund (Class A) —excluding sales charge | 79.44% | 18.84% | 15.16% |
| Philadelphia Gold & Silver Index | 93.36% | 22.37% | 15.91% |
| MSCI ACWI ex USA® Index (Net) | 32.20% | 8.38% | 9.10% |
Performance figures do not reflect deduction of taxes a shareholder would pay on Fund distributions or sale of Fund shares.
What Are Key Statistics About The Fund?
(as of April 30, 2026)
| Fund net assets | $4,194,191,589 |
| Total number of portfolio holdings | 88 |
| Total advisory fees paid | $19,574,388 |
| Portfolio turnover rate | 74% |
What Comprised The Fund's Holdings?
(as of April 30, 2026)
Top ten holdings*
(% of net assets)
(% of net assets)
| Newmont Corp. | 12.52% |
| Agnico Eagle Mines Ltd. | 10.12% |
| Barrick Mining Corp. | 4.70% |
| Kinross Gold Corp. | 4.63% |
| Franco-Nevada Corp. | 4.55% |
| Wheaton Precious Metals Corp. | 4.49% |
| Gold Fields Ltd., ADR | 3.55% |
| Zijin Mining Group Co. Ltd., H Shares | 3.10% |
| Pan American Silver Corp. | 3.06% |
| AngloGold Ashanti PLC | 3.01% |
| * Excluding money market fund holdings, if any. |
Industry allocation
(% of net assets)
(% of net assets)
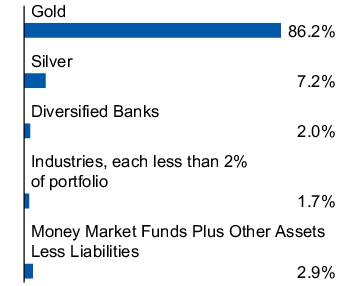
Top ten holdings*
(% of net assets)
(% of net assets)
| Newmont Corp. | 12.52% |
| Agnico Eagle Mines Ltd. | 10.12% |
| Barrick Mining Corp. | 4.70% |
| Kinross Gold Corp. | 4.63% |
| Franco-Nevada Corp. | 4.55% |
| Wheaton Precious Metals Corp. | 4.49% |
| Gold Fields Ltd., ADR | 3.55% |
| Zijin Mining Group Co. Ltd., H Shares | 3.10% |
| Pan American Silver Corp. | 3.06% |
| AngloGold Ashanti PLC | 3.01% |
| * Excluding money market fund holdings, if any. |
How Has The Fund Changed Over The Past Year?
This is a summary of certain changes to the Fund since April 30, 2025. For more complete information, you may review the Fund's prospectus, which is available at invesco.com/reports or upon request at (800) 959-4246.
The Fund modified its principal investment strategies and principal risks to reflect that the Fund may invest in equity-linked notes ("ELNs"), which are susceptible to the risks of their underlying securities or index, and which could include management risk, market risk and, as applicable, foreign securities and currency risks. ELNs are also subject to certain debt securities risks, such as interest rate and credit risks. Additionally, the trading market for certain ELNs may be less liquid than traditional investments and the Fund may not be able to sell ELNs at a desirable time or price.
The Fund also modified its principal investment strategies and principal risks to reflect that the Fund may utilize systematic strategies to evaluate companies for potential investment. Systematic strategies are based upon factors that measure securities relative to each other and may be highly reliant on data from third parties and other external sources. Any errors in the factors, or data on which measurements of those factors are based, could adversely affect the use of systematic strategies.
The Fund modified its principal investment strategies and principal risks to reflect that the Fund may invest in equity-linked notes ("ELNs"), which are susceptible to the risks of their underlying securities or index, and which could include management risk, market risk and, as applicable, foreign securities and currency risks. ELNs are also subject to certain debt securities risks, such as interest rate and credit risks. Additionally, the trading market for certain ELNs may be less liquid than traditional investments and the Fund may not be able to sell ELNs at a desirable time or price.
The Fund also modified its principal investment strategies and principal risks to reflect that the Fund may utilize systematic strategies to evaluate companies for potential investment. Systematic strategies are based upon factors that measure securities relative to each other and may be highly reliant on data from third parties and other external sources. Any errors in the factors, or data on which measurements of those factors are based, could adversely affect the use of systematic strategies.
The Fund modified its principal investment strategies and principal risks to reflect that the Fund may invest in equity-linked notes ("ELNs"), which are susceptible to the risks of their underlying securities or index, and which could include management risk, market risk and, as applicable, foreign securities and currency risks. ELNs are also subject to certain debt securities risks, such as interest rate and credit risks. Additionally, the trading market for certain ELNs may be less liquid than traditional investments and the Fund may not be able to sell ELNs at a desirable time or price.
The Fund also modified its principal investment strategies and principal risks to reflect that the Fund may utilize systematic strategies to evaluate companies for potential investment. Systematic strategies are based upon factors that measure securities relative to each other and may be highly reliant on data from third parties and other external sources. Any errors in the factors, or data on which measurements of those factors are based, could adversely affect the use of systematic strategies.
This is a summary of certain changes to the Fund since April 30, 2025. For more complete information, you may review the Fund's prospectus, which is available at invesco.com/reports or upon request at (800) 959-4246.
What Were The Fund Costs For The Last Year ?
(Based on a hypothetical $10,000 investment)
| Fund (Class) | Costs of a $10,000 investment | Costs paid as a percentage of a $10,000 investment |
| Invesco Comstock Select Fund (Class A) |
$105 | 0.92% |
How Did The Fund Perform During The Period?
• During the fiscal year ended April 30, 2026, US equity markets experienced periods of volatility driven by geopolitical tensions, elevated energy prices and uncertainty around inflation and the policy outlook. Despite these crosscurrents, markets proved resilient, with a sharp rebound in early 2026 with equities reaching new highs. Strength was led by information technology (IT)– and artificial intelligence (AI)–related investments, which remained the dominant market drivers, supported by solid corporate earnings and continued economic growth. While investors became more discerning around AI-related opportunities, the theme continued to fuel capital spending, earnings growth and market leadership.
• For the fiscal year ended April 30, 2026, Class A shares of the Fund, excluding sales charge, returned 28.56%. For the same time period, the Russell 1000® Value Index (the “Benchmark”) returned 29.25%. The Fund performed in-line with the Benchmark primarily due to stock selection in the financials, energy and consumer staples sectors. Stock selection in the IT, communication services and materials sectors were key detractors from relative return.
What contributed to performance?
Stock selection in financials | In financials, relative performance was driven primarily by strong stock selection within banks and financial services. State Street Corp., Citigroup Inc. and Bank of America Corp. were top contributors. Citigroup contributed due to improving profitability and favorable investor sentiment toward diversified and regional banks, while State Street contributed as market appreciation lifted assets under custody and administration, supporting earnings momentum.
Stock selection in energy | In energy, Suncor Energy Inc., ConocoPhillips Corp. and Chevron Corp. were key contributors. Strong performance was supported by elevated commodity pricing, disciplined capital spending and improvements in free cash flow generation. The energy sector generally benefited from higher oil prices since the Iran conflict began.
Stock selection in consumer staples | In consumer staples, stock selection and the sector being underweight versus the Benchmark contributed to relative performance. In addition to not owning Philip Morris International Inc., having no exposure in some industries like food products, were large relative contributors.
What detracted from performance?
Stock selection in IT | In IT, Cognizant Technology Solutions Corp. and Microsoft Corp. were the largest detractors, along with having no exposure to semiconductor materials and equipment. Weak performance in the Fund's software holdings lagged the Benchmark peers amid elevated expectations and near term demand concerns. Not owning Micron Technology, Inc. was the largest relative detractor as the stock materially outperformed the sector and the Benchmark.
Stock selection in communication services | In communication services, Charter Communications, Inc. was a top detractor due to slowing broadband growth, increased competition and higher capital expenditures. Ongoing video subscriber losses and weaker advertising revenue further pressured performance. Also, not owning Alphabet Inc. Class C shares was a large detractor as it materially outperformed the sector and the Benchmark.
Stock selection in materials | In materials, the International Paper Company detracted from absolute and relative returns as weak demand, pricing pressure and margin compression drove poor stock performance. Also, not owning metals and mining companies was a large relative detractor.
How Has The Fund Historically Performed?
Growth of $10,000 Investment
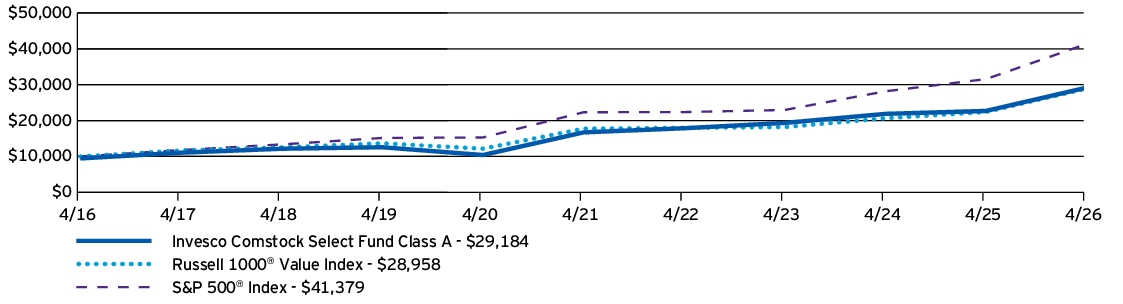
| AVERAGE ANNUAL TOTAL RETURNS | 1 Year | 5 Years | 10 Years |
| Invesco Comstock Select Fund (Class A) —including sales charge | 21.49% | 10.54% | 11.30% |
| Invesco Comstock Select Fund (Class A) —excluding sales charge | 28.56% | 11.80% | 11.94% |
| Russell 1000® Value Index | 29.25% | 10.29% | 11.22% |
| S&P 500® Index | 31.05% | 13.14% | 15.26% |
Performance figures do not reflect deduction of taxes a shareholder would pay on Fund distributions or sale of Fund shares.
What Are Key Statistics About The Fund?
(as of April 30, 2026)
| Fund net assets | $832,687,878 |
| Total number of portfolio holdings | 34 |
| Total advisory fees paid | $3,977,748 |
| Portfolio turnover rate | 67% |
What Comprised The Fund's Holdings?
(as of April 30, 2026)
Top ten holdings*
(% of net assets)
(% of net assets)
| NXP Semiconductors N.V. | 4.89% |
| UnitedHealth Group, Inc. | 4.85% |
| State Street Corp. | 4.73% |
| Alphabet, Inc., Class A | 4.43% |
| FedEx Corp. | 4.31% |
| CVS Health Corp. | 4.18% |
| Huntington Bancshares, Inc. | 3.90% |
| Anheuser-Busch InBev S.A./N.V. | 3.86% |
| Fifth Third Bancorp | 3.78% |
| Bank of America Corp. | 3.72% |
| * Excluding money market fund holdings, if any. |
Sector allocation
(% of net assets)
(% of net assets)
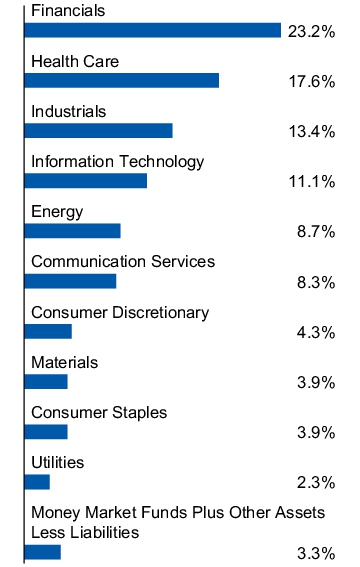
Top ten holdings*
(% of net assets)
(% of net assets)
| NXP Semiconductors N.V. | 4.89% |
| UnitedHealth Group, Inc. | 4.85% |
| State Street Corp. | 4.73% |
| Alphabet, Inc., Class A | 4.43% |
| FedEx Corp. | 4.31% |
| CVS Health Corp. | 4.18% |
| Huntington Bancshares, Inc. | 3.90% |
| Anheuser-Busch InBev S.A./N.V. | 3.86% |
| Fifth Third Bancorp | 3.78% |
| Bank of America Corp. | 3.72% |
| * Excluding money market fund holdings, if any. |
What Were The Fund Costs For The Last Year ?
(Based on a hypothetical $10,000 investment)
| Fund (Class) | Costs of a $10,000 investment | Costs paid as a percentage of a $10,000 investment |
| Invesco Comstock Select Fund (Class C) |
$191 | 1.68% |
How Did The Fund Perform During The Period?
• During the fiscal year ended April 30, 2026, US equity markets experienced periods of volatility driven by geopolitical tensions, elevated energy prices and uncertainty around inflation and the policy outlook. Despite these crosscurrents, markets proved resilient, with a sharp rebound in early 2026 with equities reaching new highs. Strength was led by information technology (IT)– and artificial intelligence (AI)–related investments, which remained the dominant market drivers, supported by solid corporate earnings and continued economic growth. While investors became more discerning around AI-related opportunities, the theme continued to fuel capital spending, earnings growth and market leadership.
• For the fiscal year ended April 30, 2026, Class C shares of the Fund, excluding sales charge, returned 27.59%. For the same time period, the Russell 1000® Value Index (the “Benchmark”) returned 29.25%. The Fund performed in-line with the Benchmark primarily due to stock selection in the financials, energy and consumer staples sectors. Stock selection in the IT, communication services and materials sectors were key detractors from relative return.
What contributed to performance?
Stock selection in financials | In financials, relative performance was driven primarily by strong stock selection within banks and financial services. State Street Corp., Citigroup Inc. and Bank of America Corp. were top contributors. Citigroup contributed due to improving profitability and favorable investor sentiment toward diversified and regional banks, while State Street contributed as market appreciation lifted assets under custody and administration, supporting earnings momentum.
Stock selection in energy | In energy, Suncor Energy Inc., ConocoPhillips Corp. and Chevron Corp. were key contributors. Strong performance was supported by elevated commodity pricing, disciplined capital spending and improvements in free cash flow generation. The energy sector generally benefited from higher oil prices since the Iran conflict began.
Stock selection in consumer staples | In consumer staples, stock selection and the sector being underweight versus the Benchmark contributed to relative performance. In addition to not owning Philip Morris International Inc., having no exposure in some industries like food products, were large relative contributors.
What detracted from performance?
Stock selection in IT | In IT, Cognizant Technology Solutions Corp. and Microsoft Corp. were the largest detractors, along with having no exposure to semiconductor materials and equipment. Weak performance in the Fund's software holdings lagged the Benchmark peers amid elevated expectations and near term demand concerns. Not owning Micron Technology, Inc. was the largest relative detractor as the stock materially outperformed the sector and the Benchmark.
Stock selection in communication services | In communication services, Charter Communications, Inc. was a top detractor due to slowing broadband growth, increased competition and higher capital expenditures. Ongoing video subscriber losses and weaker advertising revenue further pressured performance. Also, not owning Alphabet Inc. Class C shares was a large detractor as it materially outperformed the sector and the Benchmark.
Stock selection in materials | In materials, the International Paper Company detracted from absolute and relative returns as weak demand, pricing pressure and margin compression drove poor stock performance. Also, not owning metals and mining companies was a large relative detractor.
How Has The Fund Historically Performed?
Growth of $10,000 Investment
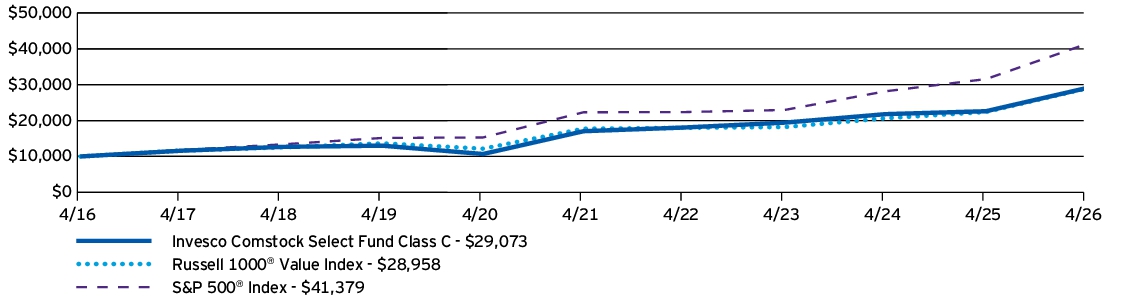
| AVERAGE ANNUAL TOTAL RETURNS | 1 Year | 5 Years | 10 Years |
| Invesco Comstock Select Fund (Class C) —including sales charge | 26.59% | 10.94% | 11.26% |
| Invesco Comstock Select Fund (Class C) —excluding sales charge | 27.59% | 10.94% | 11.26% |
| Russell 1000® Value Index | 29.25% | 10.29% | 11.22% |
| S&P 500® Index | 31.05% | 13.14% | 15.26% |
Performance figures do not reflect deduction of taxes a shareholder would pay on Fund distributions or sale of Fund shares.
What Are Key Statistics About The Fund?
(as of April 30, 2026)
| Fund net assets | $832,687,878 |
| Total number of portfolio holdings | 34 |
| Total advisory fees paid | $3,977,748 |
| Portfolio turnover rate | 67% |
What Comprised The Fund's Holdings?
(as of April 30, 2026)
Top ten holdings*
(% of net assets)
(% of net assets)
| NXP Semiconductors N.V. | 4.89% |
| UnitedHealth Group, Inc. | 4.85% |
| State Street Corp. | 4.73% |
| Alphabet, Inc., Class A | 4.43% |
| FedEx Corp. | 4.31% |
| CVS Health Corp. | 4.18% |
| Huntington Bancshares, Inc. | 3.90% |
| Anheuser-Busch InBev S.A./N.V. | 3.86% |
| Fifth Third Bancorp | 3.78% |
| Bank of America Corp. | 3.72% |
| * Excluding money market fund holdings, if any. |
Sector allocation
(% of net assets)
(% of net assets)
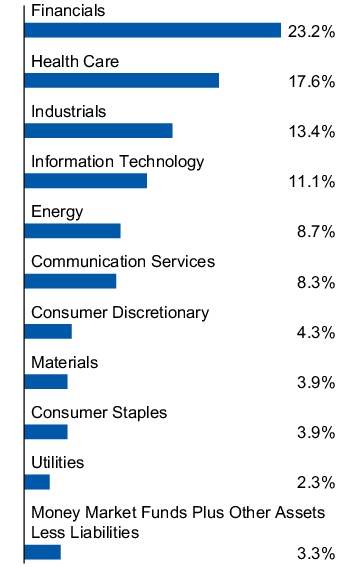
Top ten holdings*
(% of net assets)
(% of net assets)
| NXP Semiconductors N.V. | 4.89% |
| UnitedHealth Group, Inc. | 4.85% |
| State Street Corp. | 4.73% |
| Alphabet, Inc., Class A | 4.43% |
| FedEx Corp. | 4.31% |
| CVS Health Corp. | 4.18% |
| Huntington Bancshares, Inc. | 3.90% |
| Anheuser-Busch InBev S.A./N.V. | 3.86% |
| Fifth Third Bancorp | 3.78% |
| Bank of America Corp. | 3.72% |
| * Excluding money market fund holdings, if any. |
What Were The Fund Costs For The Last Year ?
(Based on a hypothetical $10,000 investment)
| Fund (Class) | Costs of a $10,000 investment | Costs paid as a percentage of a $10,000 investment |
| Invesco Comstock Select Fund (Class R) |
$135 | 1.18% |
How Did The Fund Perform During The Period?
• During the fiscal year ended April 30, 2026, US equity markets experienced periods of volatility driven by geopolitical tensions, elevated energy prices and uncertainty around inflation and the policy outlook. Despite these crosscurrents, markets proved resilient, with a sharp rebound in early 2026 with equities reaching new highs. Strength was led by information technology (IT)– and artificial intelligence (AI)–related investments, which remained the dominant market drivers, supported by solid corporate earnings and continued economic growth. While investors became more discerning around AI-related opportunities, the theme continued to fuel capital spending, earnings growth and market leadership.
• For the fiscal year ended April 30, 2026, Class R shares of the Fund returned 28.21%. For the same time period, the Russell 1000® Value Index (the “Benchmark”) returned 29.25%. The Fund performed in-line with the Benchmark primarily due to stock selection in the financials, energy and consumer staples sectors. Stock selection in the IT, communication services and materials sectors were key detractors from relative return.
What contributed to performance?
Stock selection in financials | In financials, relative performance was driven primarily by strong stock selection within banks and financial services. State Street Corp., Citigroup Inc. and Bank of America Corp. were top contributors. Citigroup contributed due to improving profitability and favorable investor sentiment toward diversified and regional banks, while State Street contributed as market appreciation lifted assets under custody and administration, supporting earnings momentum.
Stock selection in energy | In energy, Suncor Energy Inc., ConocoPhillips Corp. and Chevron Corp. were key contributors. Strong performance was supported by elevated commodity pricing, disciplined capital spending and improvements in free cash flow generation. The energy sector generally benefited from higher oil prices since the Iran conflict began.
Stock selection in consumer staples | In consumer staples, stock selection and the sector being underweight versus the Benchmark contributed to relative performance. In addition to not owning Philip Morris International Inc., having no exposure in some industries like food products, were large relative contributors.
What detracted from performance?
Stock selection in IT | In IT, Cognizant Technology Solutions Corp. and Microsoft Corp. were the largest detractors, along with having no exposure to semiconductor materials and equipment. Weak performance in the Fund's software holdings lagged the Benchmark peers amid elevated expectations and near term demand concerns. Not owning Micron Technology, Inc. was the largest relative detractor as the stock materially outperformed the sector and the Benchmark.
Stock selection in communication services | In communication services, Charter Communications, Inc. was a top detractor due to slowing broadband growth, increased competition and higher capital expenditures. Ongoing video subscriber losses and weaker advertising revenue further pressured performance. Also, not owning Alphabet Inc. Class C shares was a large detractor as it materially outperformed the sector and the Benchmark.
Stock selection in materials | In materials, the International Paper Company detracted from absolute and relative returns as weak demand, pricing pressure and margin compression drove poor stock performance. Also, not owning metals and mining companies was a large relative detractor.
How Has The Fund Historically Performed?
Growth of $10,000 Investment
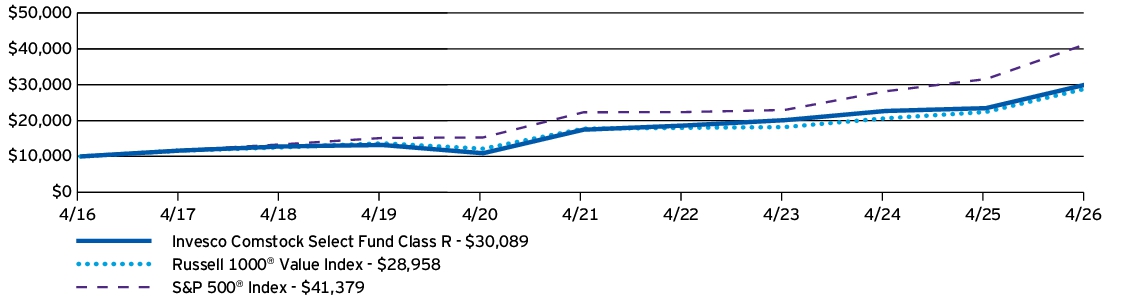
| AVERAGE ANNUAL TOTAL RETURNS | 1 Year | 5 Years | 10 Years |
| Invesco Comstock Select Fund (Class R) | 28.21% | 11.50% | 11.65% |
| Russell 1000® Value Index | 29.25% | 10.29% | 11.22% |
| S&P 500® Index | 31.05% | 13.14% | 15.26% |
Performance figures do not reflect deduction of taxes a shareholder would pay on Fund distributions or sale of Fund shares.
What Are Key Statistics About The Fund?
(as of April 30, 2026)
| Fund net assets | $832,687,878 |
| Total number of portfolio holdings | 34 |
| Total advisory fees paid | $3,977,748 |
| Portfolio turnover rate | 67% |
What Comprised The Fund's Holdings?
(as of April 30, 2026)
Top ten holdings*
(% of net assets)
(% of net assets)
| NXP Semiconductors N.V. | 4.89% |
| UnitedHealth Group, Inc. | 4.85% |
| State Street Corp. | 4.73% |
| Alphabet, Inc., Class A | 4.43% |
| FedEx Corp. | 4.31% |
| CVS Health Corp. | 4.18% |
| Huntington Bancshares, Inc. | 3.90% |
| Anheuser-Busch InBev S.A./N.V. | 3.86% |
| Fifth Third Bancorp | 3.78% |
| Bank of America Corp. | 3.72% |
| * Excluding money market fund holdings, if any. |
Sector allocation
(% of net assets)
(% of net assets)
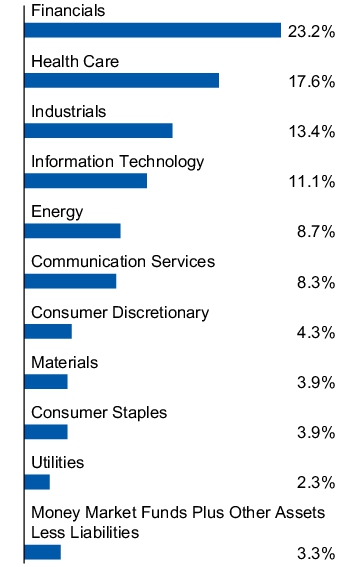
Top ten holdings*
(% of net assets)
(% of net assets)
| NXP Semiconductors N.V. | 4.89% |
| UnitedHealth Group, Inc. | 4.85% |
| State Street Corp. | 4.73% |
| Alphabet, Inc., Class A | 4.43% |
| FedEx Corp. | 4.31% |
| CVS Health Corp. | 4.18% |
| Huntington Bancshares, Inc. | 3.90% |
| Anheuser-Busch InBev S.A./N.V. | 3.86% |
| Fifth Third Bancorp | 3.78% |
| Bank of America Corp. | 3.72% |
| * Excluding money market fund holdings, if any. |
What Were The Fund Costs For The Last Year ?
(Based on a hypothetical $10,000 investment)
| Fund (Class) | Costs of a $10,000 investment | Costs paid as a percentage of a $10,000 investment |
| Invesco Comstock Select Fund (Class Y) |
$78 | 0.68% |
How Did The Fund Perform During The Period?
• During the fiscal year ended April 30, 2026, US equity markets experienced periods of volatility driven by geopolitical tensions, elevated energy prices and uncertainty around inflation and the policy outlook. Despite these crosscurrents, markets proved resilient, with a sharp rebound in early 2026 with equities reaching new highs. Strength was led by information technology (IT)– and artificial intelligence (AI)–related investments, which remained the dominant market drivers, supported by solid corporate earnings and continued economic growth. While investors became more discerning around AI-related opportunities, the theme continued to fuel capital spending, earnings growth and market leadership.
• For the fiscal year ended April 30, 2026, Class Y shares of the Fund returned 28.88%. For the same time period, the Russell 1000® Value Index (the “Benchmark”) returned 29.25%. The Fund performed in-line with the Benchmark primarily due to stock selection in the financials, energy and consumer staples sectors. Stock selection in the IT, communication services and materials sectors were key detractors from relative return.
What contributed to performance?
Stock selection in financials | In financials, relative performance was driven primarily by strong stock selection within banks and financial services. State Street Corp., Citigroup Inc. and Bank of America Corp. were top contributors. Citigroup contributed due to improving profitability and favorable investor sentiment toward diversified and regional banks, while State Street contributed as market appreciation lifted assets under custody and administration, supporting earnings momentum.
Stock selection in energy | In energy, Suncor Energy Inc., ConocoPhillips Corp. and Chevron Corp. were key contributors. Strong performance was supported by elevated commodity pricing, disciplined capital spending and improvements in free cash flow generation. The energy sector generally benefited from higher oil prices since the Iran conflict began.
Stock selection in consumer staples | In consumer staples, stock selection and the sector being underweight versus the Benchmark contributed to relative performance. In addition to not owning Philip Morris International Inc., having no exposure in some industries like food products, were large relative contributors.
What detracted from performance?
Stock selection in IT | In IT, Cognizant Technology Solutions Corp. and Microsoft Corp. were the largest detractors, along with having no exposure to semiconductor materials and equipment. Weak performance in the Fund's software holdings lagged the Benchmark peers amid elevated expectations and near term demand concerns. Not owning Micron Technology, Inc. was the largest relative detractor as the stock materially outperformed the sector and the Benchmark.
Stock selection in communication services | In communication services, Charter Communications, Inc. was a top detractor due to slowing broadband growth, increased competition and higher capital expenditures. Ongoing video subscriber losses and weaker advertising revenue further pressured performance. Also, not owning Alphabet Inc. Class C shares was a large detractor as it materially outperformed the sector and the Benchmark.
Stock selection in materials | In materials, the International Paper Company detracted from absolute and relative returns as weak demand, pricing pressure and margin compression drove poor stock performance. Also, not owning metals and mining companies was a large relative detractor.
How Has The Fund Historically Performed?
Growth of $10,000 Investment
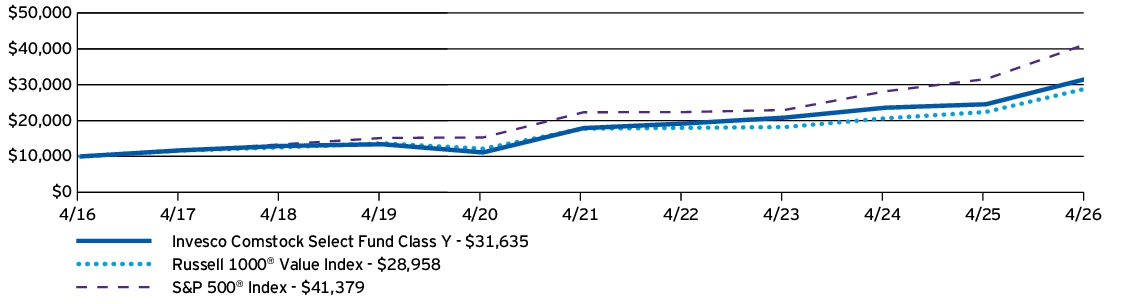
| AVERAGE ANNUAL TOTAL RETURNS | 1 Year | 5 Years | 10 Years |
| Invesco Comstock Select Fund (Class Y) | 28.88% | 12.06% | 12.21% |
| Russell 1000® Value Index | 29.25% | 10.29% | 11.22% |
| S&P 500® Index | 31.05% | 13.14% | 15.26% |
Performance figures do not reflect deduction of taxes a shareholder would pay on Fund distributions or sale of Fund shares.
What Are Key Statistics About The Fund?
(as of April 30, 2026)
| Fund net assets | $832,687,878 |
| Total number of portfolio holdings | 34 |
| Total advisory fees paid | $3,977,748 |
| Portfolio turnover rate | 67% |
What Comprised The Fund's Holdings?
(as of April 30, 2026)
Top ten holdings*
(% of net assets)
(% of net assets)
| NXP Semiconductors N.V. | 4.89% |
| UnitedHealth Group, Inc. | 4.85% |
| State Street Corp. | 4.73% |
| Alphabet, Inc., Class A | 4.43% |
| FedEx Corp. | 4.31% |
| CVS Health Corp. | 4.18% |
| Huntington Bancshares, Inc. | 3.90% |
| Anheuser-Busch InBev S.A./N.V. | 3.86% |
| Fifth Third Bancorp | 3.78% |
| Bank of America Corp. | 3.72% |
| * Excluding money market fund holdings, if any. |
Sector allocation
(% of net assets)
(% of net assets)
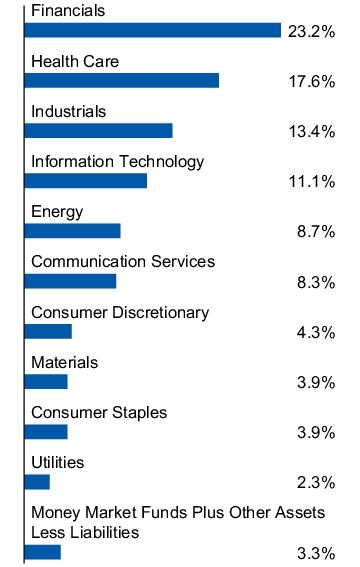
Top ten holdings*
(% of net assets)
(% of net assets)
| NXP Semiconductors N.V. | 4.89% |
| UnitedHealth Group, Inc. | 4.85% |
| State Street Corp. | 4.73% |
| Alphabet, Inc., Class A | 4.43% |
| FedEx Corp. | 4.31% |
| CVS Health Corp. | 4.18% |
| Huntington Bancshares, Inc. | 3.90% |
| Anheuser-Busch InBev S.A./N.V. | 3.86% |
| Fifth Third Bancorp | 3.78% |
| Bank of America Corp. | 3.72% |
| * Excluding money market fund holdings, if any. |
What Were The Fund Costs For The Last Year ?
(Based on a hypothetical $10,000 investment)
| Fund (Class) | Costs of a $10,000 investment | Costs paid as a percentage of a $10,000 investment |
| Invesco Comstock Select Fund (Class R5) |
$68 | 0.59% |
How Did The Fund Perform During The Period?
• During the fiscal year ended April 30, 2026, US equity markets experienced periods of volatility driven by geopolitical tensions, elevated energy prices and uncertainty around inflation and the policy outlook. Despite these crosscurrents, markets proved resilient, with a sharp rebound in early 2026 with equities reaching new highs. Strength was led by information technology (IT)– and artificial intelligence (AI)–related investments, which remained the dominant market drivers, supported by solid corporate earnings and continued economic growth. While investors became more discerning around AI-related opportunities, the theme continued to fuel capital spending, earnings growth and market leadership.
• For the fiscal year ended April 30, 2026, Class R5 shares of the Fund returned 29.01%. For the same time period, the Russell 1000® Value Index (the “Benchmark”) returned 29.25%. The Fund performed in-line with the Benchmark primarily due to stock selection in the financials, energy and consumer staples sectors. Stock selection in the IT, communication services and materials sectors were key detractors from relative return.
What contributed to performance?
Stock selection in financials | In financials, relative performance was driven primarily by strong stock selection within banks and financial services. State Street Corp., Citigroup Inc. and Bank of America Corp. were top contributors. Citigroup contributed due to improving profitability and favorable investor sentiment toward diversified and regional banks, while State Street contributed as market appreciation lifted assets under custody and administration, supporting earnings momentum.
Stock selection in energy | In energy, Suncor Energy Inc., ConocoPhillips Corp. and Chevron Corp. were key contributors. Strong performance was supported by elevated commodity pricing, disciplined capital spending and improvements in free cash flow generation. The energy sector generally benefited from higher oil prices since the Iran conflict began.
Stock selection in consumer staples | In consumer staples, stock selection and the sector being underweight versus the Benchmark contributed to relative performance. In addition to not owning Philip Morris International Inc., having no exposure in some industries like food products, were large relative contributors.
What detracted from performance?
Stock selection in IT | In IT, Cognizant Technology Solutions Corp. and Microsoft Corp. were the largest detractors, along with having no exposure to semiconductor materials and equipment. Weak performance in the Fund's software holdings lagged the Benchmark peers amid elevated expectations and near term demand concerns. Not owning Micron Technology, Inc. was the largest relative detractor as the stock materially outperformed the sector and the Benchmark.
Stock selection in communication services | In communication services, Charter Communications, Inc. was a top detractor due to slowing broadband growth, increased competition and higher capital expenditures. Ongoing video subscriber losses and weaker advertising revenue further pressured performance. Also, not owning Alphabet Inc. Class C shares was a large detractor as it materially outperformed the sector and the Benchmark.
Stock selection in materials | In materials, the International Paper Company detracted from absolute and relative returns as weak demand, pricing pressure and margin compression drove poor stock performance. Also, not owning metals and mining companies was a large relative detractor.
How Has The Fund Historically Performed?
Growth of $10,000 Investment
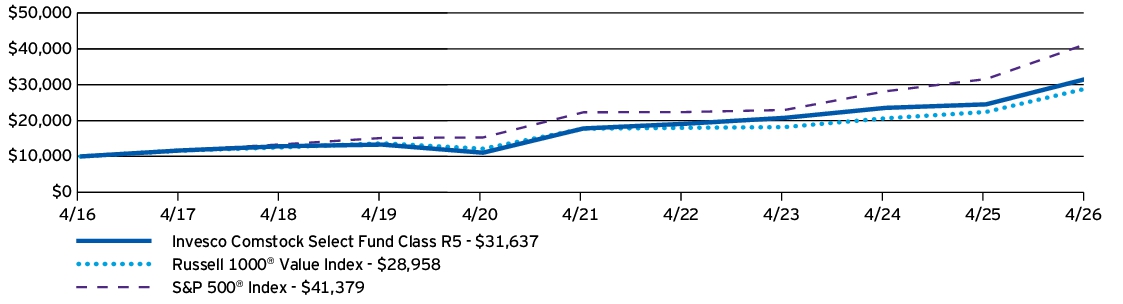
| AVERAGE ANNUAL TOTAL RETURNS | 1 Year | 5 Years | 10 Years |
| Invesco Comstock Select Fund (Class R5) | 29.01% | 12.18% | 12.21% |
| Russell 1000® Value Index | 29.25% | 10.29% | 11.22% |
| S&P 500® Index | 31.05% | 13.14% | 15.26% |
Performance figures do not reflect deduction of taxes a shareholder would pay on Fund distributions or sale of Fund shares.
What Are Key Statistics About The Fund?
(as of April 30, 2026)
| Fund net assets | $832,687,878 |
| Total number of portfolio holdings | 34 |
| Total advisory fees paid | $3,977,748 |
| Portfolio turnover rate | 67% |
What Comprised The Fund's Holdings?
(as of April 30, 2026)
Top ten holdings*
(% of net assets)
(% of net assets)
| NXP Semiconductors N.V. | 4.89% |
| UnitedHealth Group, Inc. | 4.85% |
| State Street Corp. | 4.73% |
| Alphabet, Inc., Class A | 4.43% |
| FedEx Corp. | 4.31% |
| CVS Health Corp. | 4.18% |
| Huntington Bancshares, Inc. | 3.90% |
| Anheuser-Busch InBev S.A./N.V. | 3.86% |
| Fifth Third Bancorp | 3.78% |
| Bank of America Corp. | 3.72% |
| * Excluding money market fund holdings, if any. |
Sector allocation
(% of net assets)
(% of net assets)
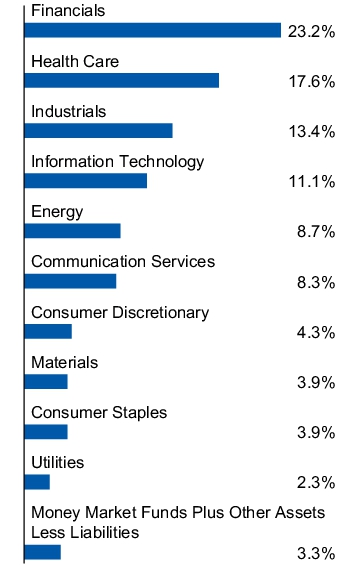
Top ten holdings*
(% of net assets)
(% of net assets)
| NXP Semiconductors N.V. | 4.89% |
| UnitedHealth Group, Inc. | 4.85% |
| State Street Corp. | 4.73% |
| Alphabet, Inc., Class A | 4.43% |
| FedEx Corp. | 4.31% |
| CVS Health Corp. | 4.18% |
| Huntington Bancshares, Inc. | 3.90% |
| Anheuser-Busch InBev S.A./N.V. | 3.86% |
| Fifth Third Bancorp | 3.78% |
| Bank of America Corp. | 3.72% |
| * Excluding money market fund holdings, if any. |
What Were The Fund Costs For The Last Year ?
(Based on a hypothetical $10,000 investment)
| Fund (Class) | Costs of a $10,000 investment | Costs paid as a percentage of a $10,000 investment |
| Invesco Comstock Select Fund (Class R6) |
$68 | 0.59% |
How Did The Fund Perform During The Period?
• During the fiscal year ended April 30, 2026, US equity markets experienced periods of volatility driven by geopolitical tensions, elevated energy prices and uncertainty around inflation and the policy outlook. Despite these crosscurrents, markets proved resilient, with a sharp rebound in early 2026 with equities reaching new highs. Strength was led by information technology (IT)– and artificial intelligence (AI)–related investments, which remained the dominant market drivers, supported by solid corporate earnings and continued economic growth. While investors became more discerning around AI-related opportunities, the theme continued to fuel capital spending, earnings growth and market leadership.
• For the fiscal year ended April 30, 2026, Class R6 shares of the Fund returned 28.97%. For the same time period, the Russell 1000® Value Index (the “Benchmark”) returned 29.25%. The Fund performed in-line with the Benchmark primarily due to stock selection in the financials, energy and consumer staples sectors. Stock selection in the IT, communication services and materials sectors were key detractors from relative return.
What contributed to performance?
Stock selection in financials | In financials, relative performance was driven primarily by strong stock selection within banks and financial services. State Street Corp., Citigroup Inc. and Bank of America Corp. were top contributors. Citigroup contributed due to improving profitability and favorable investor sentiment toward diversified and regional banks, while State Street contributed as market appreciation lifted assets under custody and administration, supporting earnings momentum.
Stock selection in energy | In energy, Suncor Energy Inc., ConocoPhillips Corp. and Chevron Corp. were key contributors. Strong performance was supported by elevated commodity pricing, disciplined capital spending and improvements in free cash flow generation. The energy sector generally benefited from higher oil prices since the Iran conflict began.
Stock selection in consumer staples | In consumer staples, stock selection and the sector being underweight versus the Benchmark contributed to relative performance. In addition to not owning Philip Morris International Inc., having no exposure in some industries like food products, were large relative contributors.
What detracted from performance?
Stock selection in IT | In IT, Cognizant Technology Solutions Corp. and Microsoft Corp. were the largest detractors, along with having no exposure to semiconductor materials and equipment. Weak performance in the Fund's software holdings lagged the Benchmark peers amid elevated expectations and near term demand concerns. Not owning Micron Technology, Inc. was the largest relative detractor as the stock materially outperformed the sector and the Benchmark.
Stock selection in communication services | In communication services, Charter Communications, Inc. was a top detractor due to slowing broadband growth, increased competition and higher capital expenditures. Ongoing video subscriber losses and weaker advertising revenue further pressured performance. Also, not owning Alphabet Inc. Class C shares was a large detractor as it materially outperformed the sector and the Benchmark.
Stock selection in materials | In materials, the International Paper Company detracted from absolute and relative returns as weak demand, pricing pressure and margin compression drove poor stock performance. Also, not owning metals and mining companies was a large relative detractor.
How Has The Fund Historically Performed?
Growth of $10,000 Investment
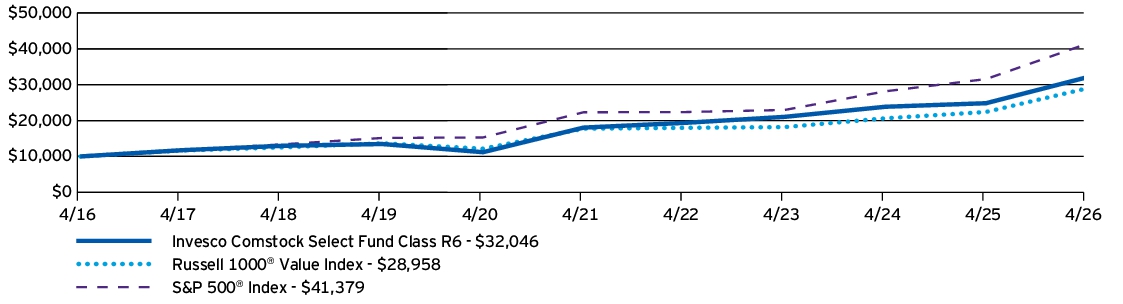
| AVERAGE ANNUAL TOTAL RETURNS | 1 Year | 5 Years | 10 Years |
| Invesco Comstock Select Fund (Class R6) | 28.97% | 12.17% | 12.35% |
| Russell 1000® Value Index | 29.25% | 10.29% | 11.22% |
| S&P 500® Index | 31.05% | 13.14% | 15.26% |
Performance figures do not reflect deduction of taxes a shareholder would pay on Fund distributions or sale of Fund shares.
What Are Key Statistics About The Fund?
(as of April 30, 2026)
| Fund net assets | $832,687,878 |
| Total number of portfolio holdings | 34 |
| Total advisory fees paid | $3,977,748 |
| Portfolio turnover rate | 67% |
What Comprised The Fund's Holdings?
(as of April 30, 2026)
Top ten holdings*
(% of net assets)
(% of net assets)
| NXP Semiconductors N.V. | 4.89% |
| UnitedHealth Group, Inc. | 4.85% |
| State Street Corp. | 4.73% |
| Alphabet, Inc., Class A | 4.43% |
| FedEx Corp. | 4.31% |
| CVS Health Corp. | 4.18% |
| Huntington Bancshares, Inc. | 3.90% |
| Anheuser-Busch InBev S.A./N.V. | 3.86% |
| Fifth Third Bancorp | 3.78% |
| Bank of America Corp. | 3.72% |
| * Excluding money market fund holdings, if any. |
Sector allocation
(% of net assets)
(% of net assets)
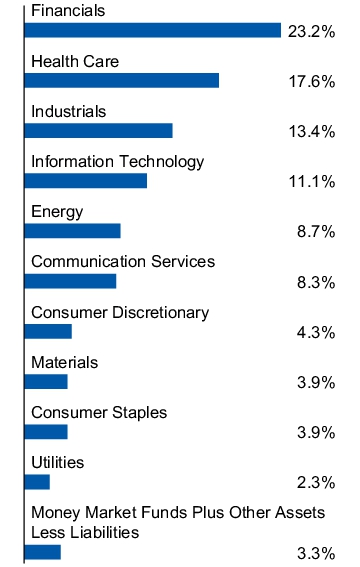
Top ten holdings*
(% of net assets)
(% of net assets)
| NXP Semiconductors N.V. | 4.89% |
| UnitedHealth Group, Inc. | 4.85% |
| State Street Corp. | 4.73% |
| Alphabet, Inc., Class A | 4.43% |
| FedEx Corp. | 4.31% |
| CVS Health Corp. | 4.18% |
| Huntington Bancshares, Inc. | 3.90% |
| Anheuser-Busch InBev S.A./N.V. | 3.86% |
| Fifth Third Bancorp | 3.78% |
| Bank of America Corp. | 3.72% |
| * Excluding money market fund holdings, if any. |
| [1] | For the period September 30, 2025 (commencement of operations) to April 30, 2026. Expenses for a full reporting period would be higher. |
| [2] | Annualized. |
| [3] | For the period September 30, 2025 (commencement of operations) to April 30, 2026. Expenses for a full reporting period would be higher. |
| [4] | Annualized. |
| [5] | Reflects fee waivers and/or expense reimbursements, without which expenses would have been higher. |
| [6] | Reflects fee waivers and/or expense reimbursements, without which expenses would have been higher. |
| [7] | Reflects fee waivers and/or expense reimbursements, without which expenses would have been higher. |
| [8] | Reflects fee waivers and/or expense reimbursements, without which expenses would have been higher. |
| [9] | Reflects fee waivers and/or expense reimbursements, without which expenses would have been higher. |
| [10] | Reflects fee waivers and/or expense reimbursements, without which expenses would have been higher. |