What
were the Fund costs for the past year?
(based
on a hypothetical $10,000 investment)
|
Fund
Name
|
Costs
of a $10,000 investment
|
Costs
paid as a percentage of a $10,000 investment
|
|---|---|---|
|
Genter
Capital Dividend Income ETF
|
$44
|
0.38%
|
How did the Fund perform last year and what affected its performance?
For the fiscal year ended April 30, 2026, the Fund returned 31.44%. It outperformed its benchmark, the S&P 500 Index, which returned 31.05% for the same period. The Fund also outperformed the Russell 1000 Value Index, which returned 29.25% for the same period.
Factors that Impacted the Fund’s Performance
The U.S. economy continues to grow, supported by solid consumer spending and ongoing infrastructure investment, particularly in areas tied to productivity and technology. That said, the pace of growth appears to be moderating, at least in the margins. The most notable shift has been in the labor market. After several years of steady strength, hiring has meaningfully slowed. The jobs market is now operating in what can best be described as a “low hire, low fire” environment, where employers are reluctant to aggressively expand headcount but are also not significantly reducing it. While this dynamic does not suggest an imminent downturn, it does imply that labor expansion is no longer providing the same level of incremental support to economic growth.
The Fund’s security selection within the Financials and Healthcare sectors materially outperformed the benchmark leading to the Fund’s outperformance.
The main contributors to performance include:
• Corning Inc: The company has outperformed due to AI driven demand for fiber-optic connectivity highlighted by large multi-year deals.
• Microchip Technology Inc: The company has corrected its inventory and is seeing improved demand across automotive, industrial and data center markets.
• Cisco Systems Inc: The company is seeing strong AI demand for data center networking combined with a broad networking upgrade cycle.
The main detractors to performance include:
• Kenvue, Inc: The company is facing reputational and litigation risks surrounding the prenatal use of Tylenol by expectant mothers. The company has agreed to a merger with Kimberly Clark.
• Accenture PLC: Companies have shifted spending away fromdiscretionary consulting towards transformational AI projects. This hascaused near term growth to slow.
• Comcast Corp: Broadband competition and continued cord cutting hascut cable growth and been a headwind to margins.
How did the Fund perform since inception?
The following graph compares the initial and subsequent account values at the end of the most recently completed fiscal years of the Fund. It assumes a $10,000 initial investment at the inception date of the Fund in an appropriate broad-based index and a more narrowly based index that reflects the market sectors that the Fund invests in for the same period.
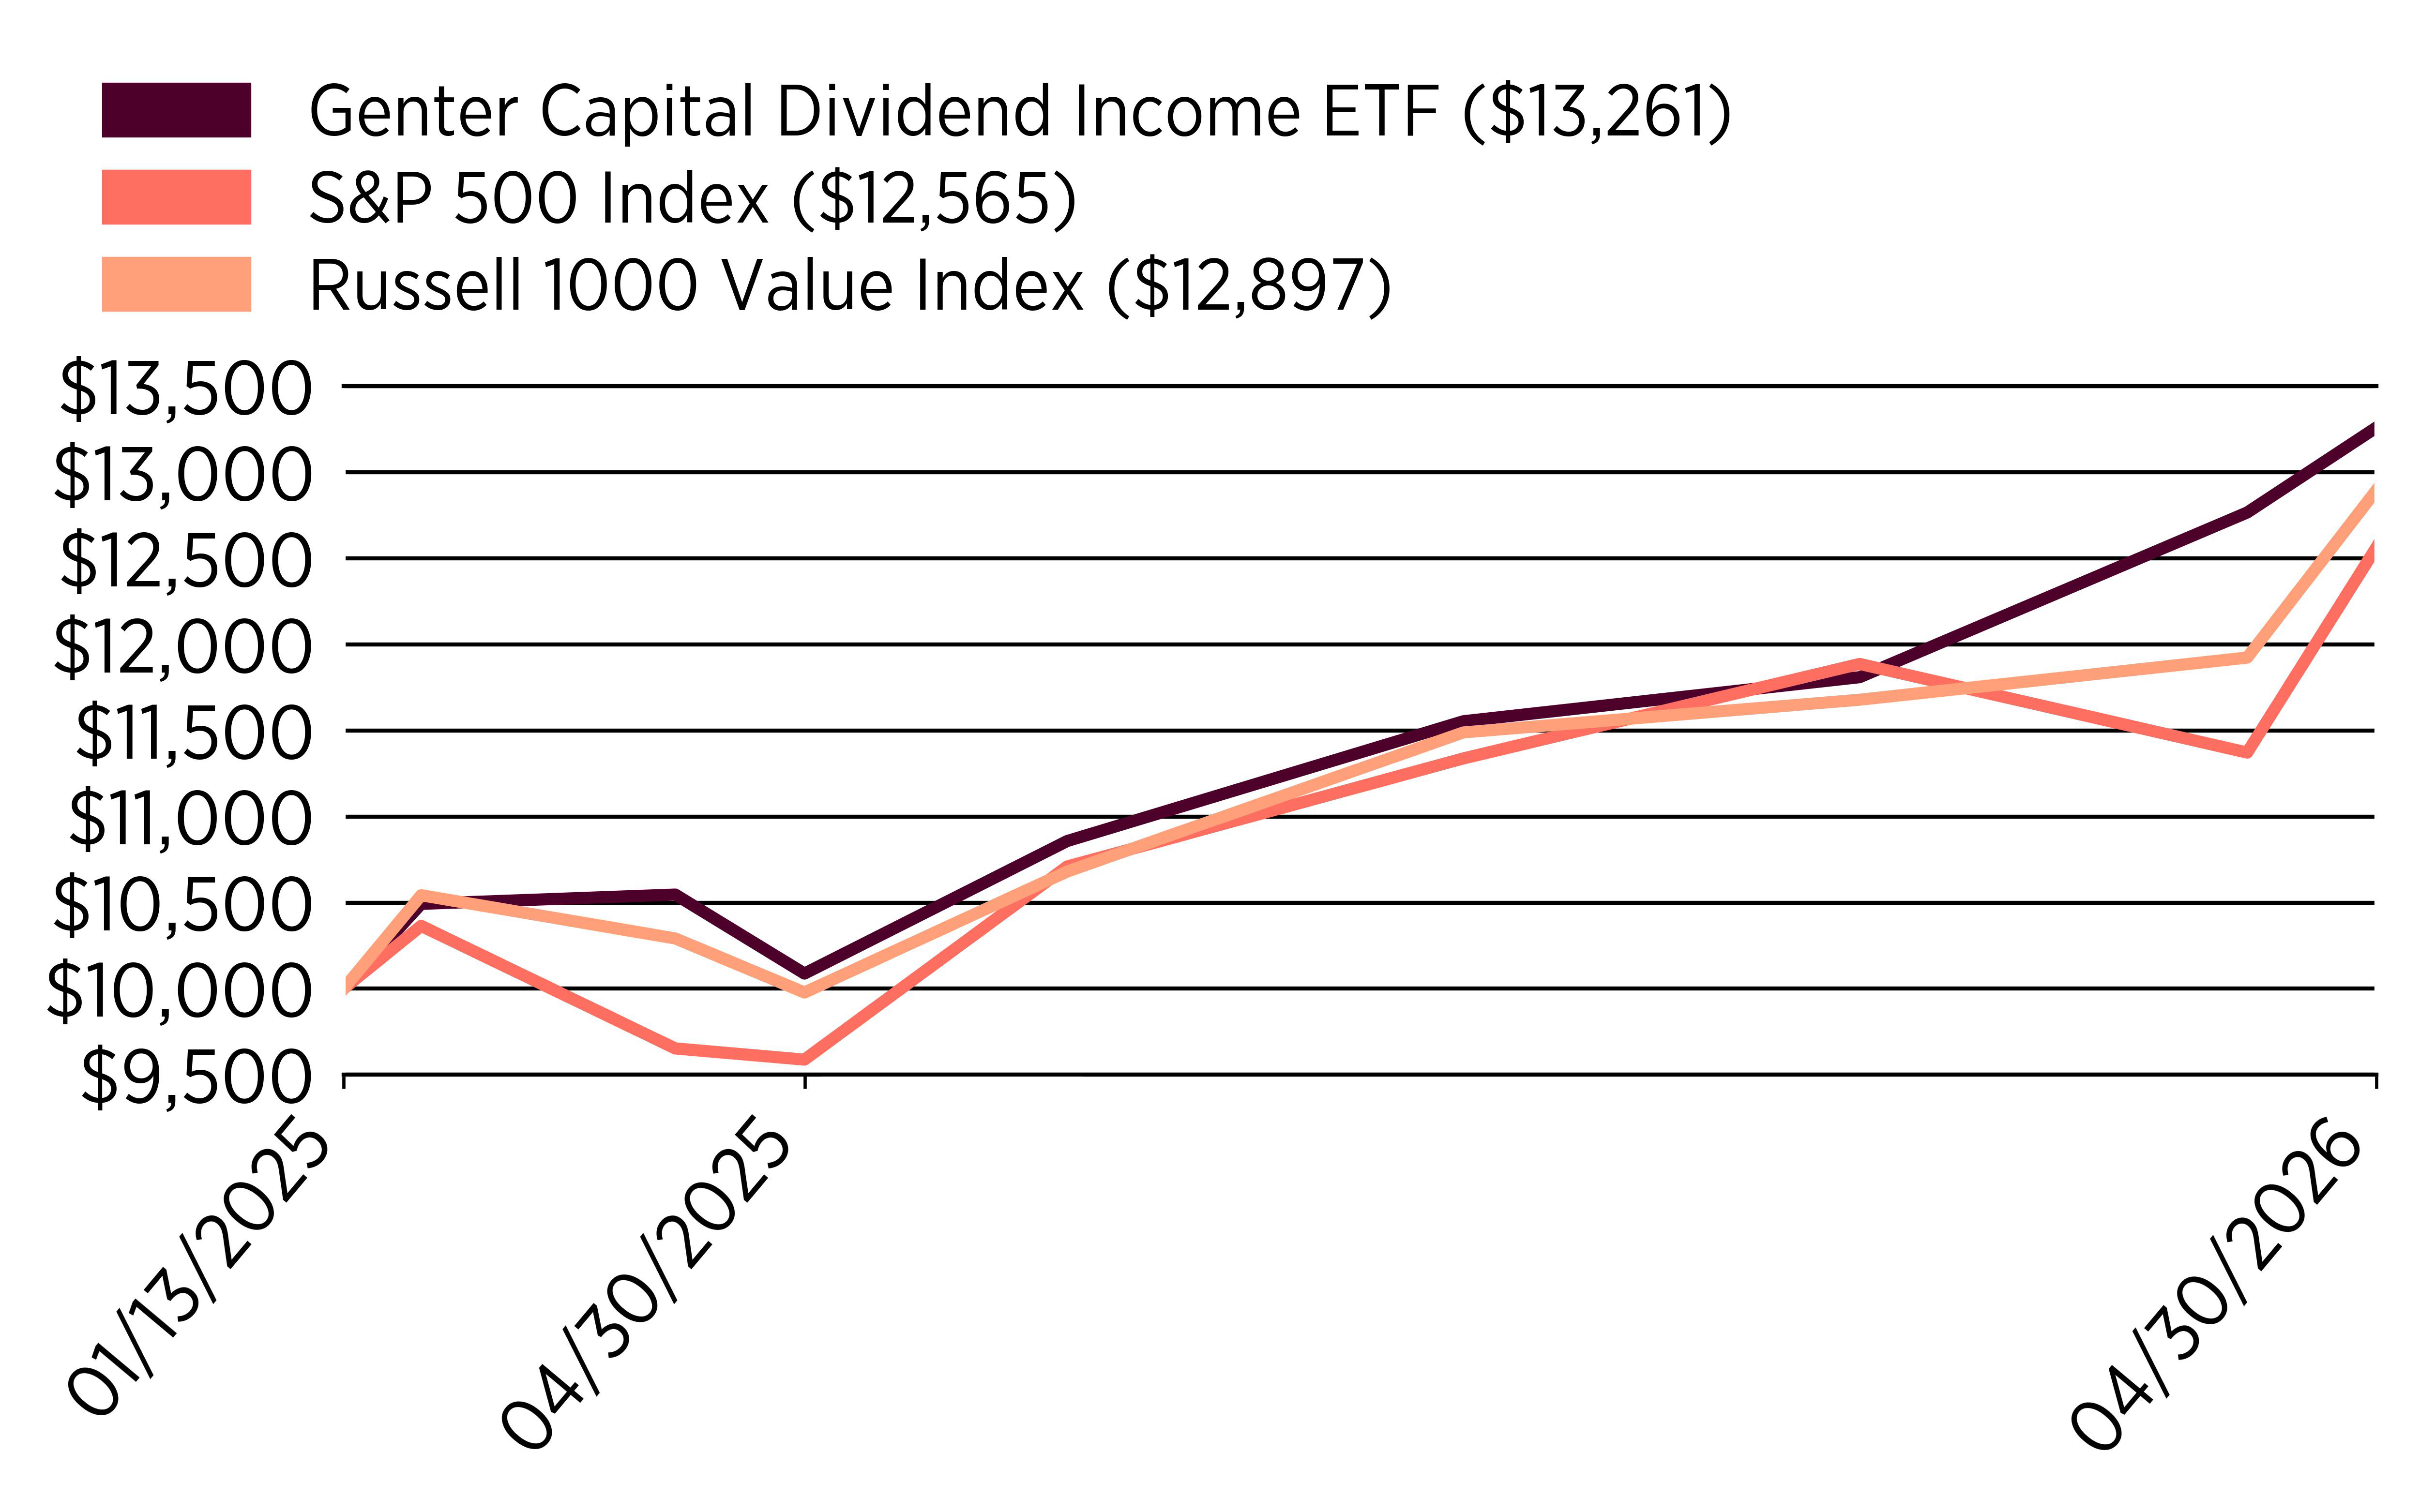
Average Annual Total Returns
(as of April 30, 2026)
|
|
1
Year
|
Since
Inception (1/13/25)
|
|---|---|---|
|
Genter
Capital Dividend Income ETF
|
31.44%
|
24.39%
|
|
S&P
500 Index
|
31.05%
|
19.36%
|
|
Russell
1000 Value Index
|
29.25%
|
21.75%
|
Key Fund Statistics
(as of April 30, 2026)
|
Net
Assets
|
$4,476,686
|
|
Number
of Holdings
|
37
|
|
Net
Advisory Fee
|
$11,973
|
|
Portfolio
Turnover Rate
|
9.34%
|
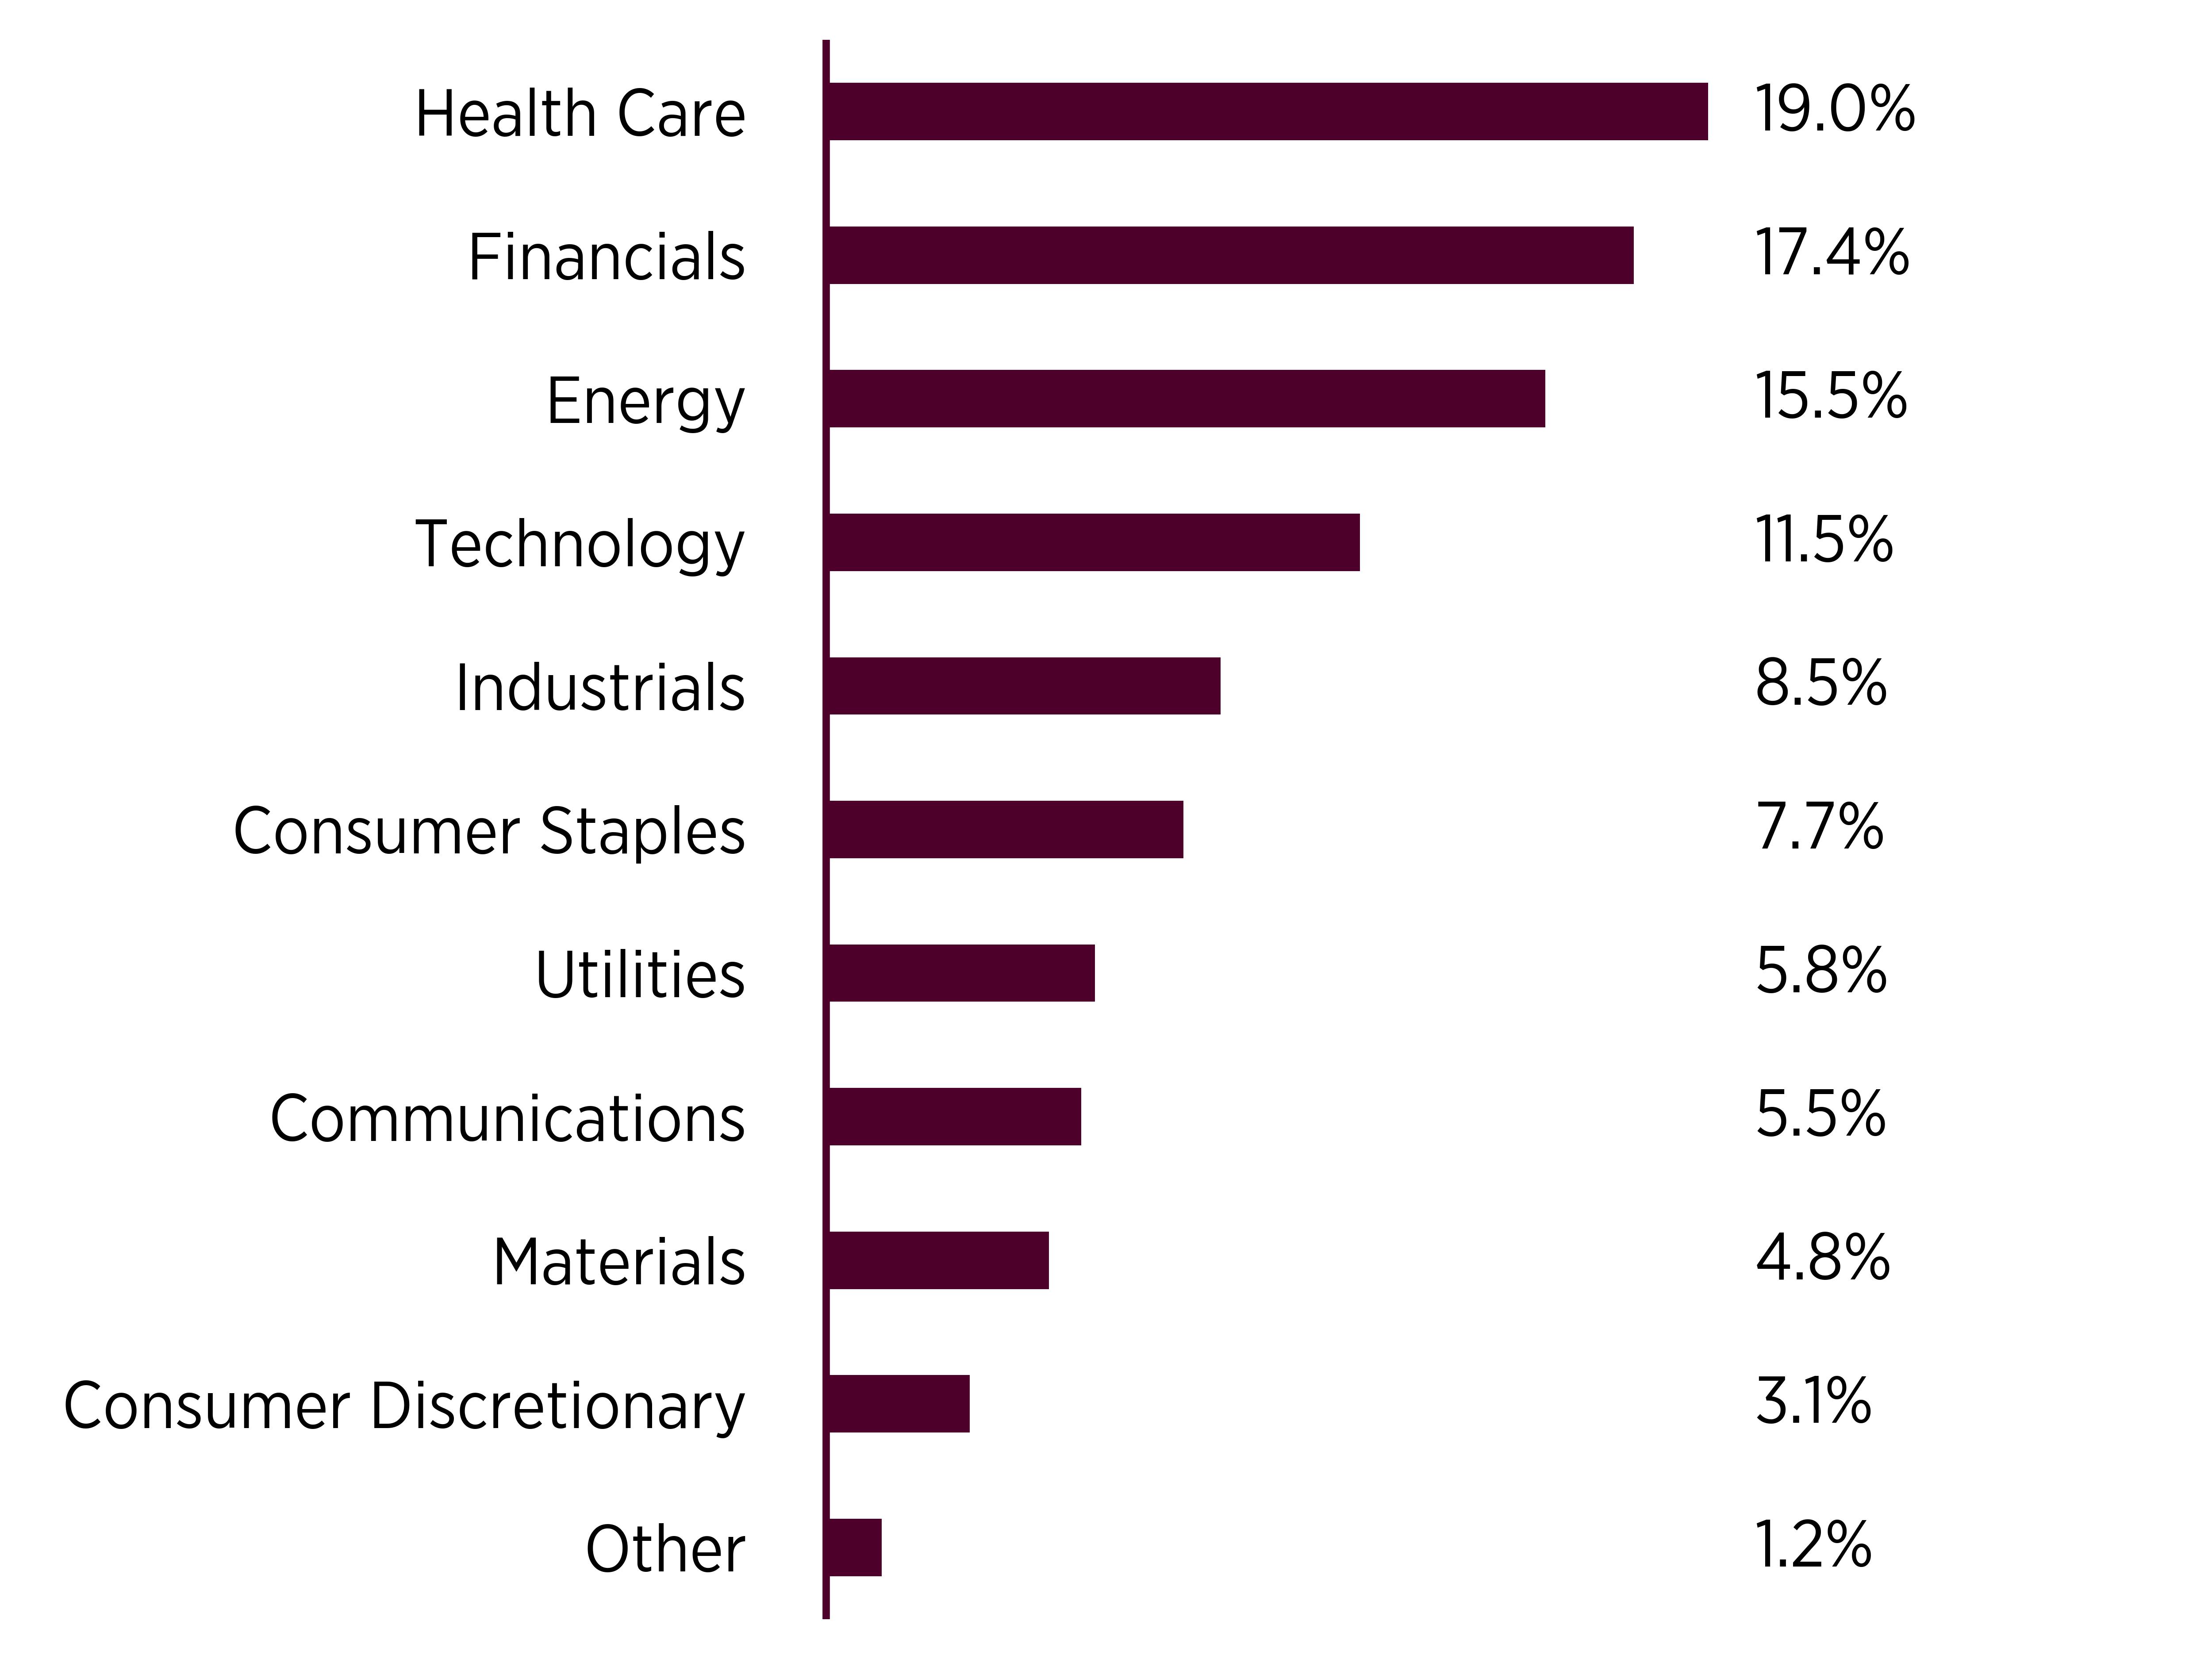
What did the Fund invest in?
(as
of April 30, 2026)
Sector Breakdown (% of net assets)
|
Top
Ten Holdings
|
(%
of net assets)
|
|---|---|
|
Cisco
Systems Inc
|
|
|
Coterra
Energy Inc
|
|
|
Northern
Trust Corp
|
|
|
Enbridge
Inc
|
|
|
Altria
Group Inc
|
|
|
M&T
Bank Corp
|
|
|
Chevron
Corp
|
|
|
JPMorgan
Chase & Co
|
|
|
CVS
Health Corp
|
|
|
PepsiCo
Inc
|
What
were the Fund costs for the past year?
(based
on a hypothetical $10,000 investment)
|
Fund
Name
|
Costs
of a $10,000 investment
|
Costs
paid as a percentage of a $10,000 investment
|
|---|---|---|
|
Genter
Capital
International
Dividend
ETF
|
$44
|
0.38%
|
How did the Fund perform last year and what affected its performance?
For the fiscal year ended April 30, 2026, the Fund returned 33.98%. It outperformed its benchmark, the S&P 500 Index, which returned 31.05% for the same period. The Fund also outperformed the MSCI EAFE Value Index, which returned 33.45% for the same period.
Factors that Impacted the Fund’s Performance
The Fund focuses on stocks that pay higher dividend yields and is underweight in large cap growth companies that historically pay little or no dividends. The Fund’s security selection in the financials sector was the leading factor in the strategy’s strong outperformance of its benchmark.
The main contributors to performance include:
• ABB LTD: The company is seeing strong demand for electrification and automation driving robust growth.
• BP: Higher oil prices, strong refining margins, and rising production boosted earnings and profitability.
• Rio Tinto: Higher commodity prices and rising production particularly in copper and iron helped to increase earnings.
The main detractors to performance include:
• DSM Firmench: Weaker growth outlook and slowing demand in vitamins along with an FX headwind all pressured shares over the past year.
• Honda Motor Company: HMC saw sharp profit declines driven by tariffs and the company experienced slowing auto sales in China.
• Sanofi: Earnings and sales missed expectations amid rising research and development spending and declining vaccine revenues.
How did the Fund perform since inception?
The following graph compares the initial and subsequent account values at the end of the most recently completed fiscal years of the Fund. It assumes a $10,000 initial investment at the inception date of the Fund in an appropriate broad-based index and a more narrowly based index that reflects the market sectors that the Fund invests in for the same period.
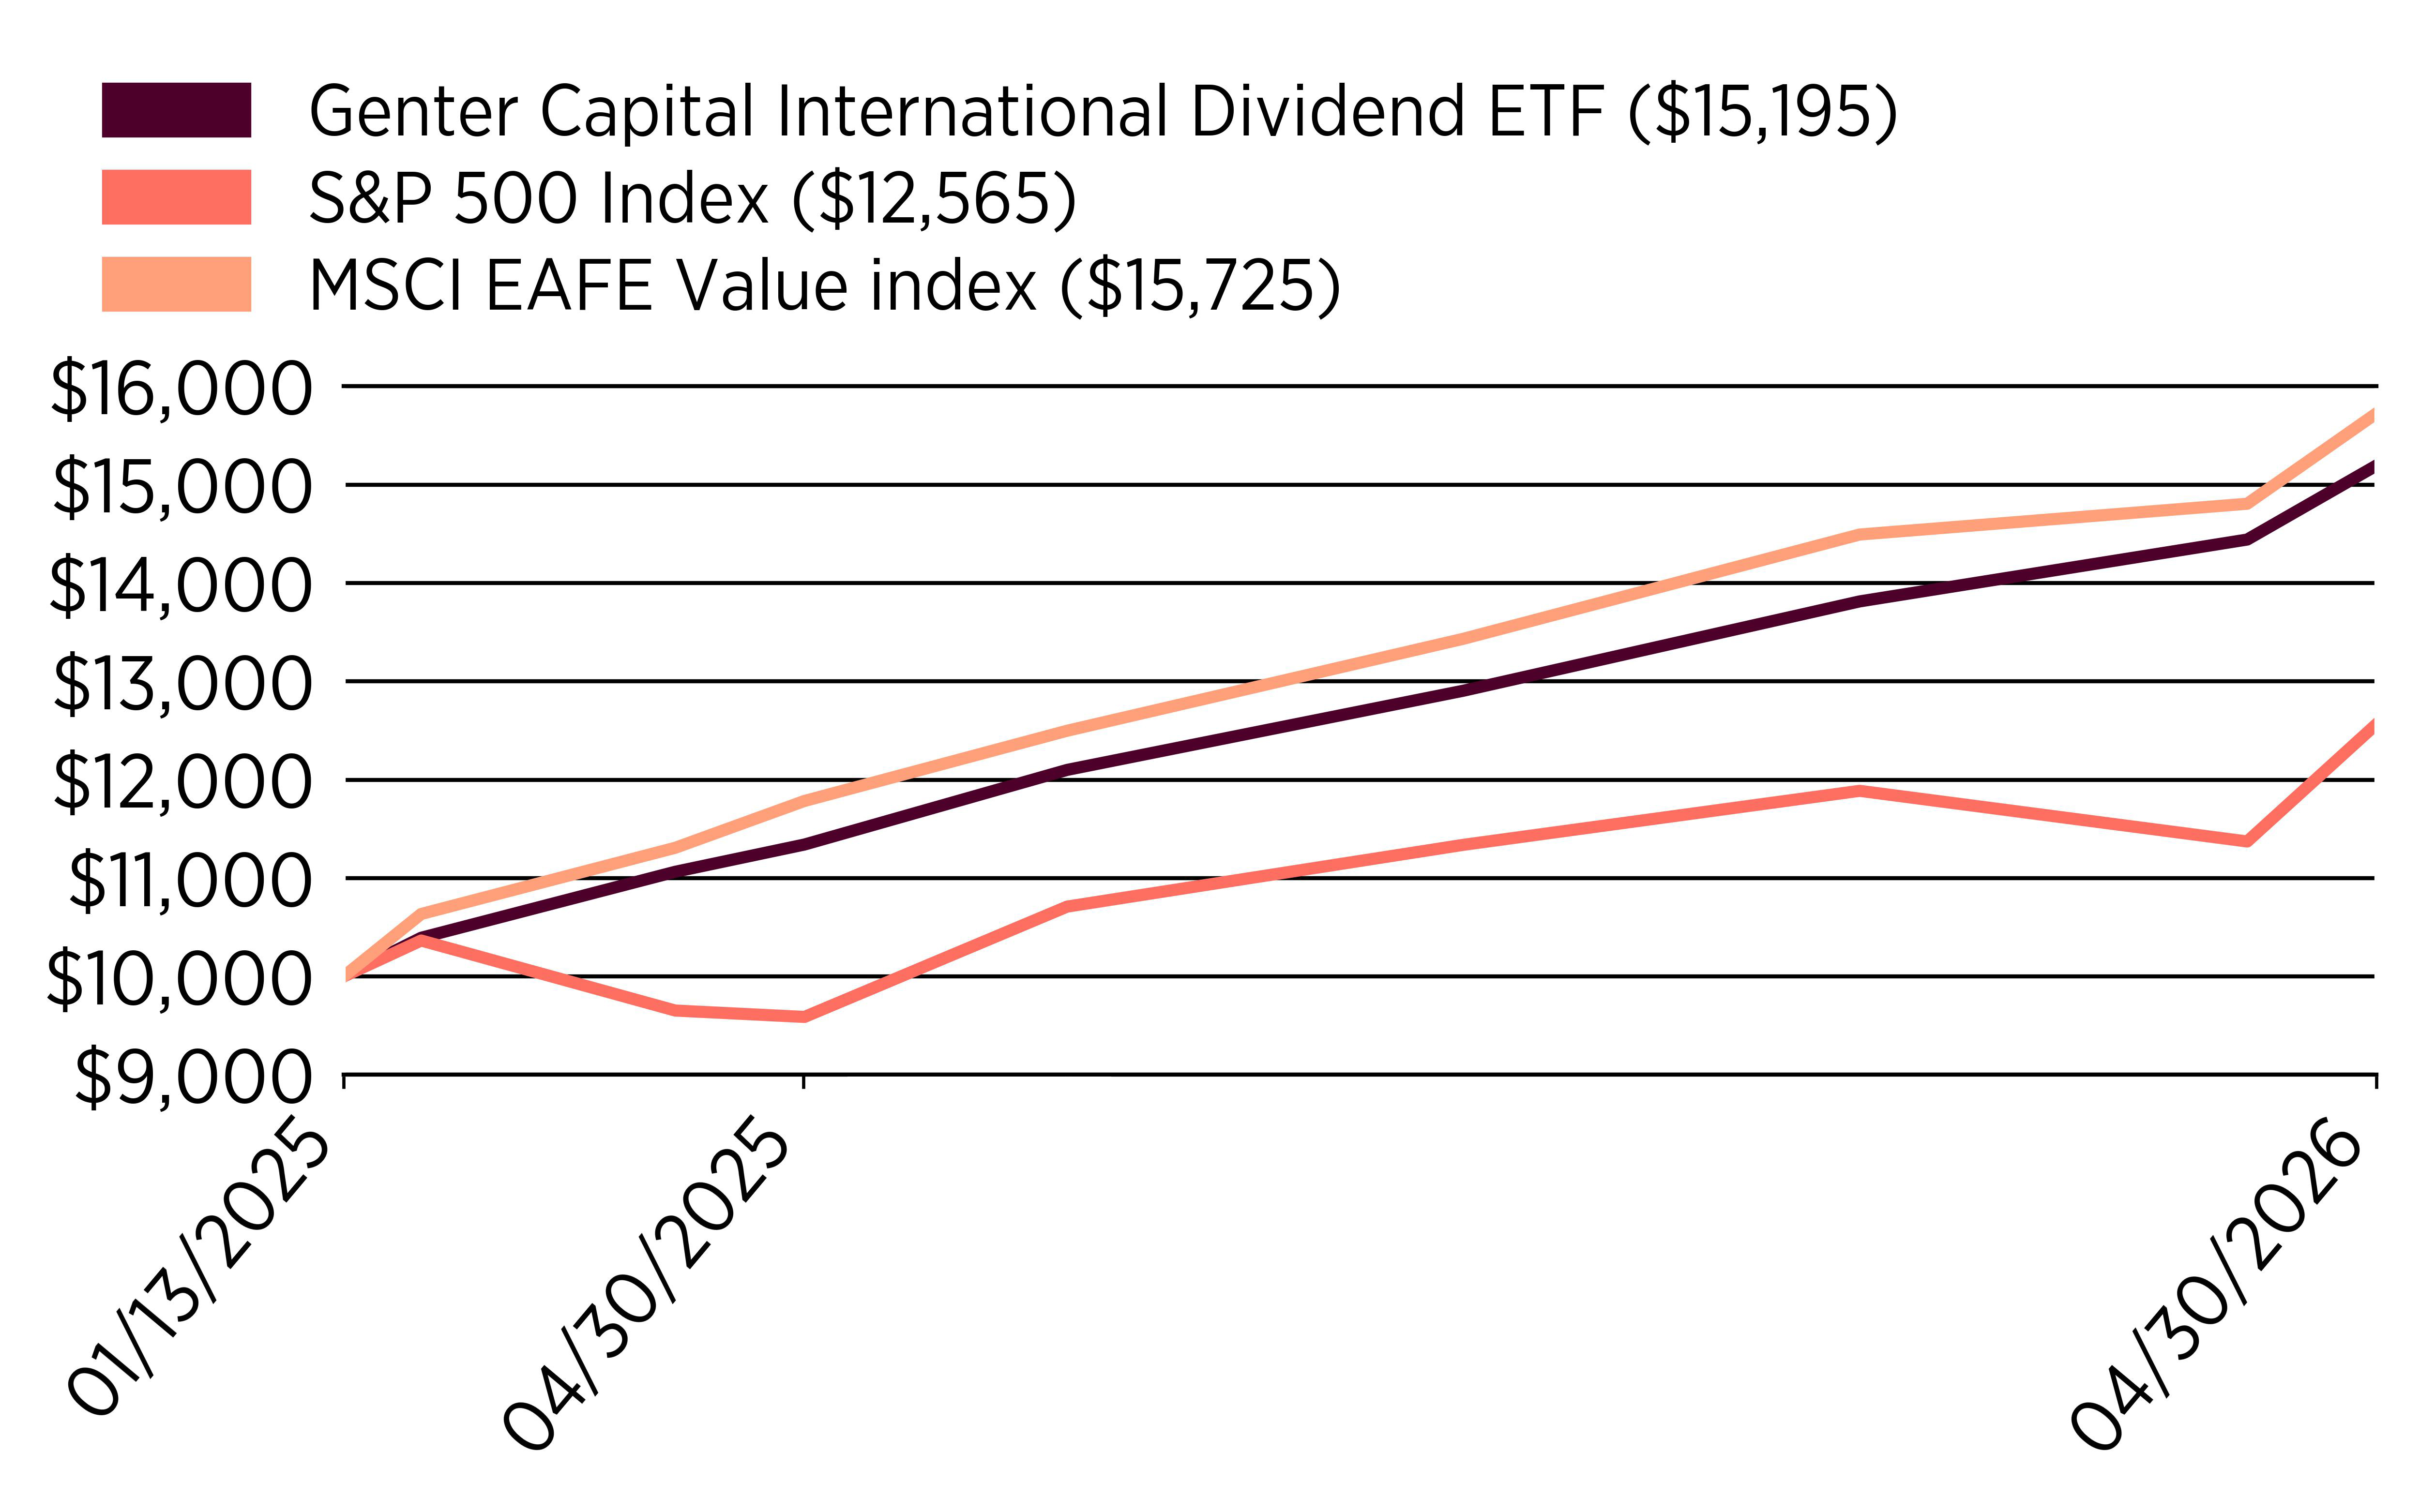
Average Annual Total Returns
(as of April 30, 2026)
|
|
1
Year
|
Since
Inception (1/13/25)
|
|---|---|---|
|
Genter
Capital International Dividend ETF
|
33.98%
|
38.20%
|
|
S&P
500 Index
|
31.05%
|
19.36%
|
|
MSCI
EAFE Value Index
|
33.45%
|
41.91%
|
Key Fund Statistics
(as of April 30, 2026)
|
Net
Assets
|
$4,841,349
|
|
Number
of Holdings
|
36
|
|
Net
Advisory Fee
|
$5,067
|
|
Portfolio
Turnover Rate
|
2.39%
|
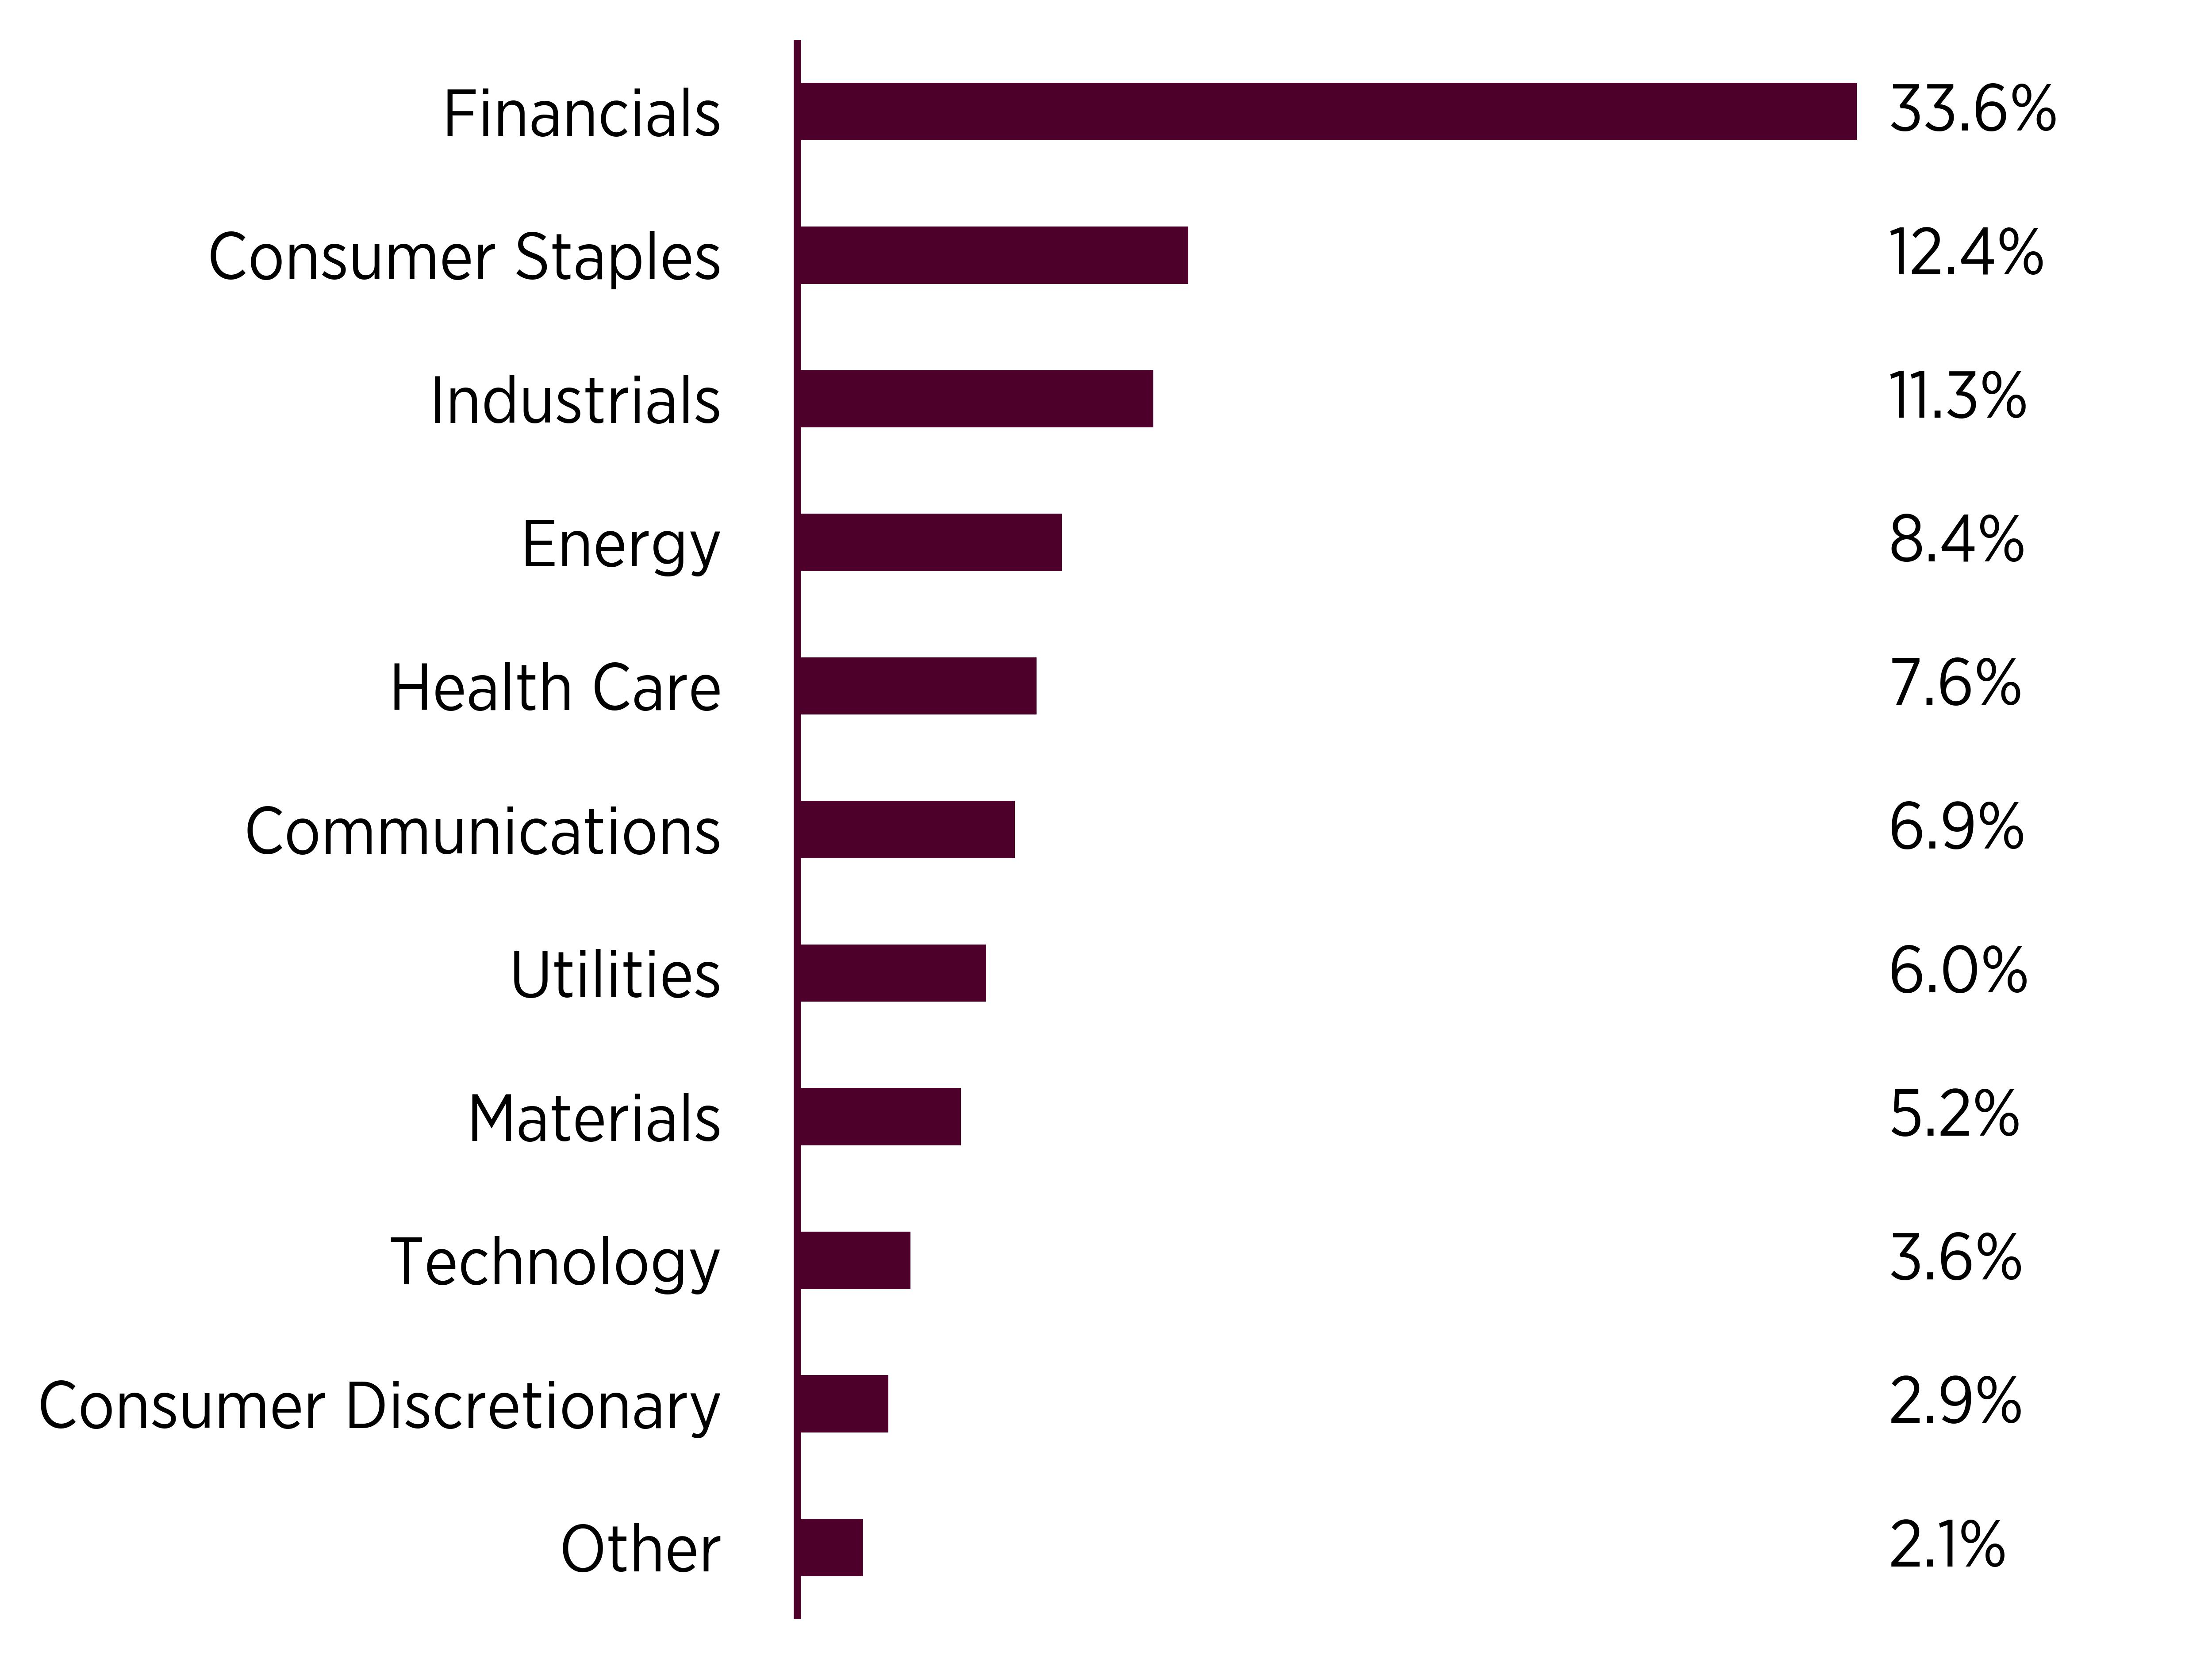
What did the Fund invest in?
(as
of April
30, 2026)
Sector Breakdown (% of net assets)
|
Top
Ten Holdings
|
(%
of net assets)
|
|---|---|
|
Sumitomo
Mitsui Financial Group Inc
|
|
|
ABB
Ltd
|
|
|
Mitsubishi
UFJ Financial Group Inc
|
|
|
Barclays
PLC
|
|
|
Banco
Bilbao Vizcaya Argentaria SA
|
|
|
Telefonaktiebolaget
LM Ericsson
|
|
|
Vodafone
Group PLC
|
|
|
Enbridge
Inc
|
|
|
Orange
SA
|
|
|
Enel
SpA
|
What
were the Fund costs for the past year?
(based
on a hypothetical $10,000 investment)
|
Fund
Name
|
Costs
of a $10,000 investment
|
Costs
paid as a percentage of a $10,000 investment
|
|---|---|---|
|
Genter
Capital
Taxable
Quality
Intermediate
ETF
|
$39
|
0.38%
|
How did the Fund perform last year and what affected its performance?
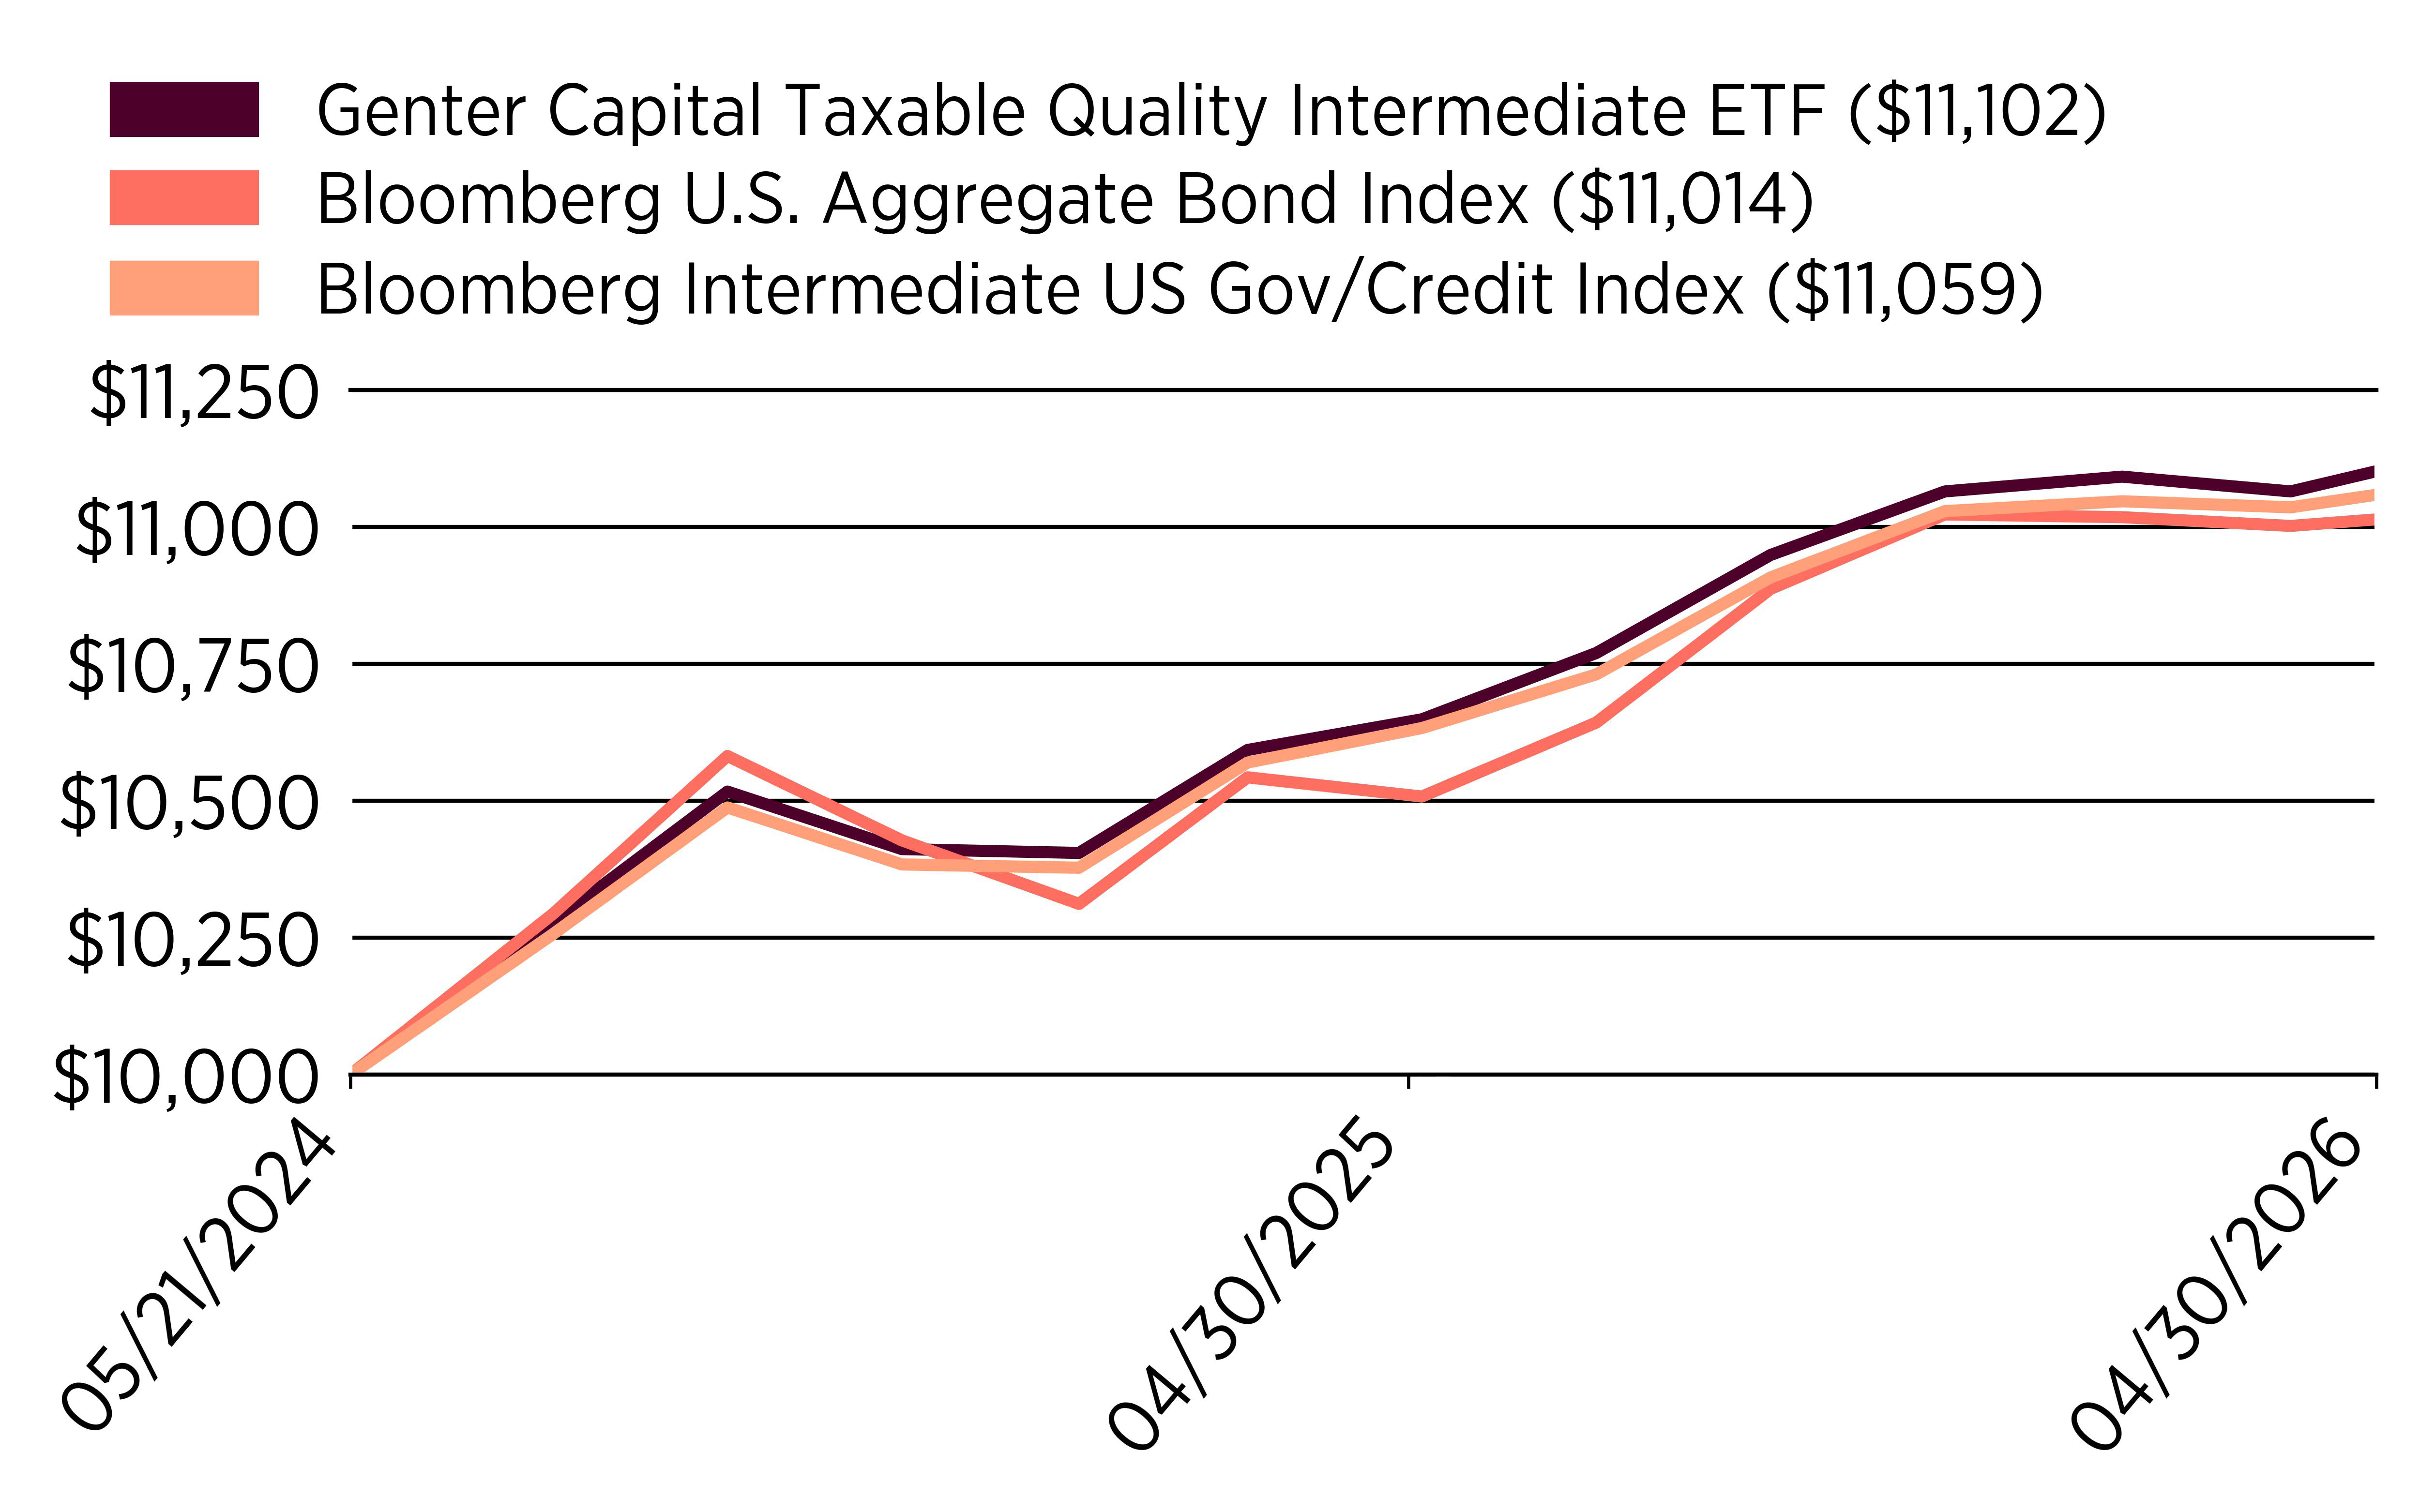
For the fiscal year ended April 30, 2026, the Fund returned 4.06%. It had the same performance as its benchmark, the Bloomberg U.S. Aggregate Bond Index, which returned 4.06% for the same period. The Fund outperformed the Bloomberg Intermediate U.S. Gov/Credit Index, which returned 3.67% for the same period.
Factors that Impacted the Fund’s Performance
A majority of the Fund's outperformance came from underweighting the 1 to 3‑year duration bucket relative to the index. Additionally, outperformance came from superior individual security selection.
Top 3 Outperforming Securities
• Ford Motor Corp 7.45% 7/16/31
• HF Sinclair 5.75% 1/15/31
• Safehold 2.50% 1/15/32
Top 3 Underperforming Securities
• Oracle 4.80% 9/26/32
• US Treasury 4.00% 1/31/31
• Glencore 5.634% 4/4/34
How did the Fund perform since inception?
The following graph compares the initial and subsequent account values at the end of the most recently completed fiscal years of the Fund. It assumes a $10,000 initial investment at the inception date of the Fund in an appropriate broad-based index and a more narrowly based index that reflects the market sectors that the Fund invests in for the same period.
Average Annual Total Returns
(as of April 30, 2026)
|
|
1
Year
|
Since
Inception
(5/21/24)
|
|---|---|---|
|
Genter
Capital Taxable Quality Intermediate ETF
|
4.06%
|
5.53%
|
|
Bloomberg
U.S. Aggregate Bond Index
|
4.06%
|
5.10%
|
|
Bloomberg
Intermediate US Gov/
Credit
Index
|
3.67%
|
5.32%
|
Key Fund Statistics
(as of April 30, 2026)
|
Net
Assets
|
$91,976,832
|
|
Number
of Holdings
|
58
|
|
Net
Advisory Fee
|
$125,810
|
|
Portfolio
Turnover Rate
|
34.90%
|
What did the Fund invest in?
(as
of April
30, 2026)
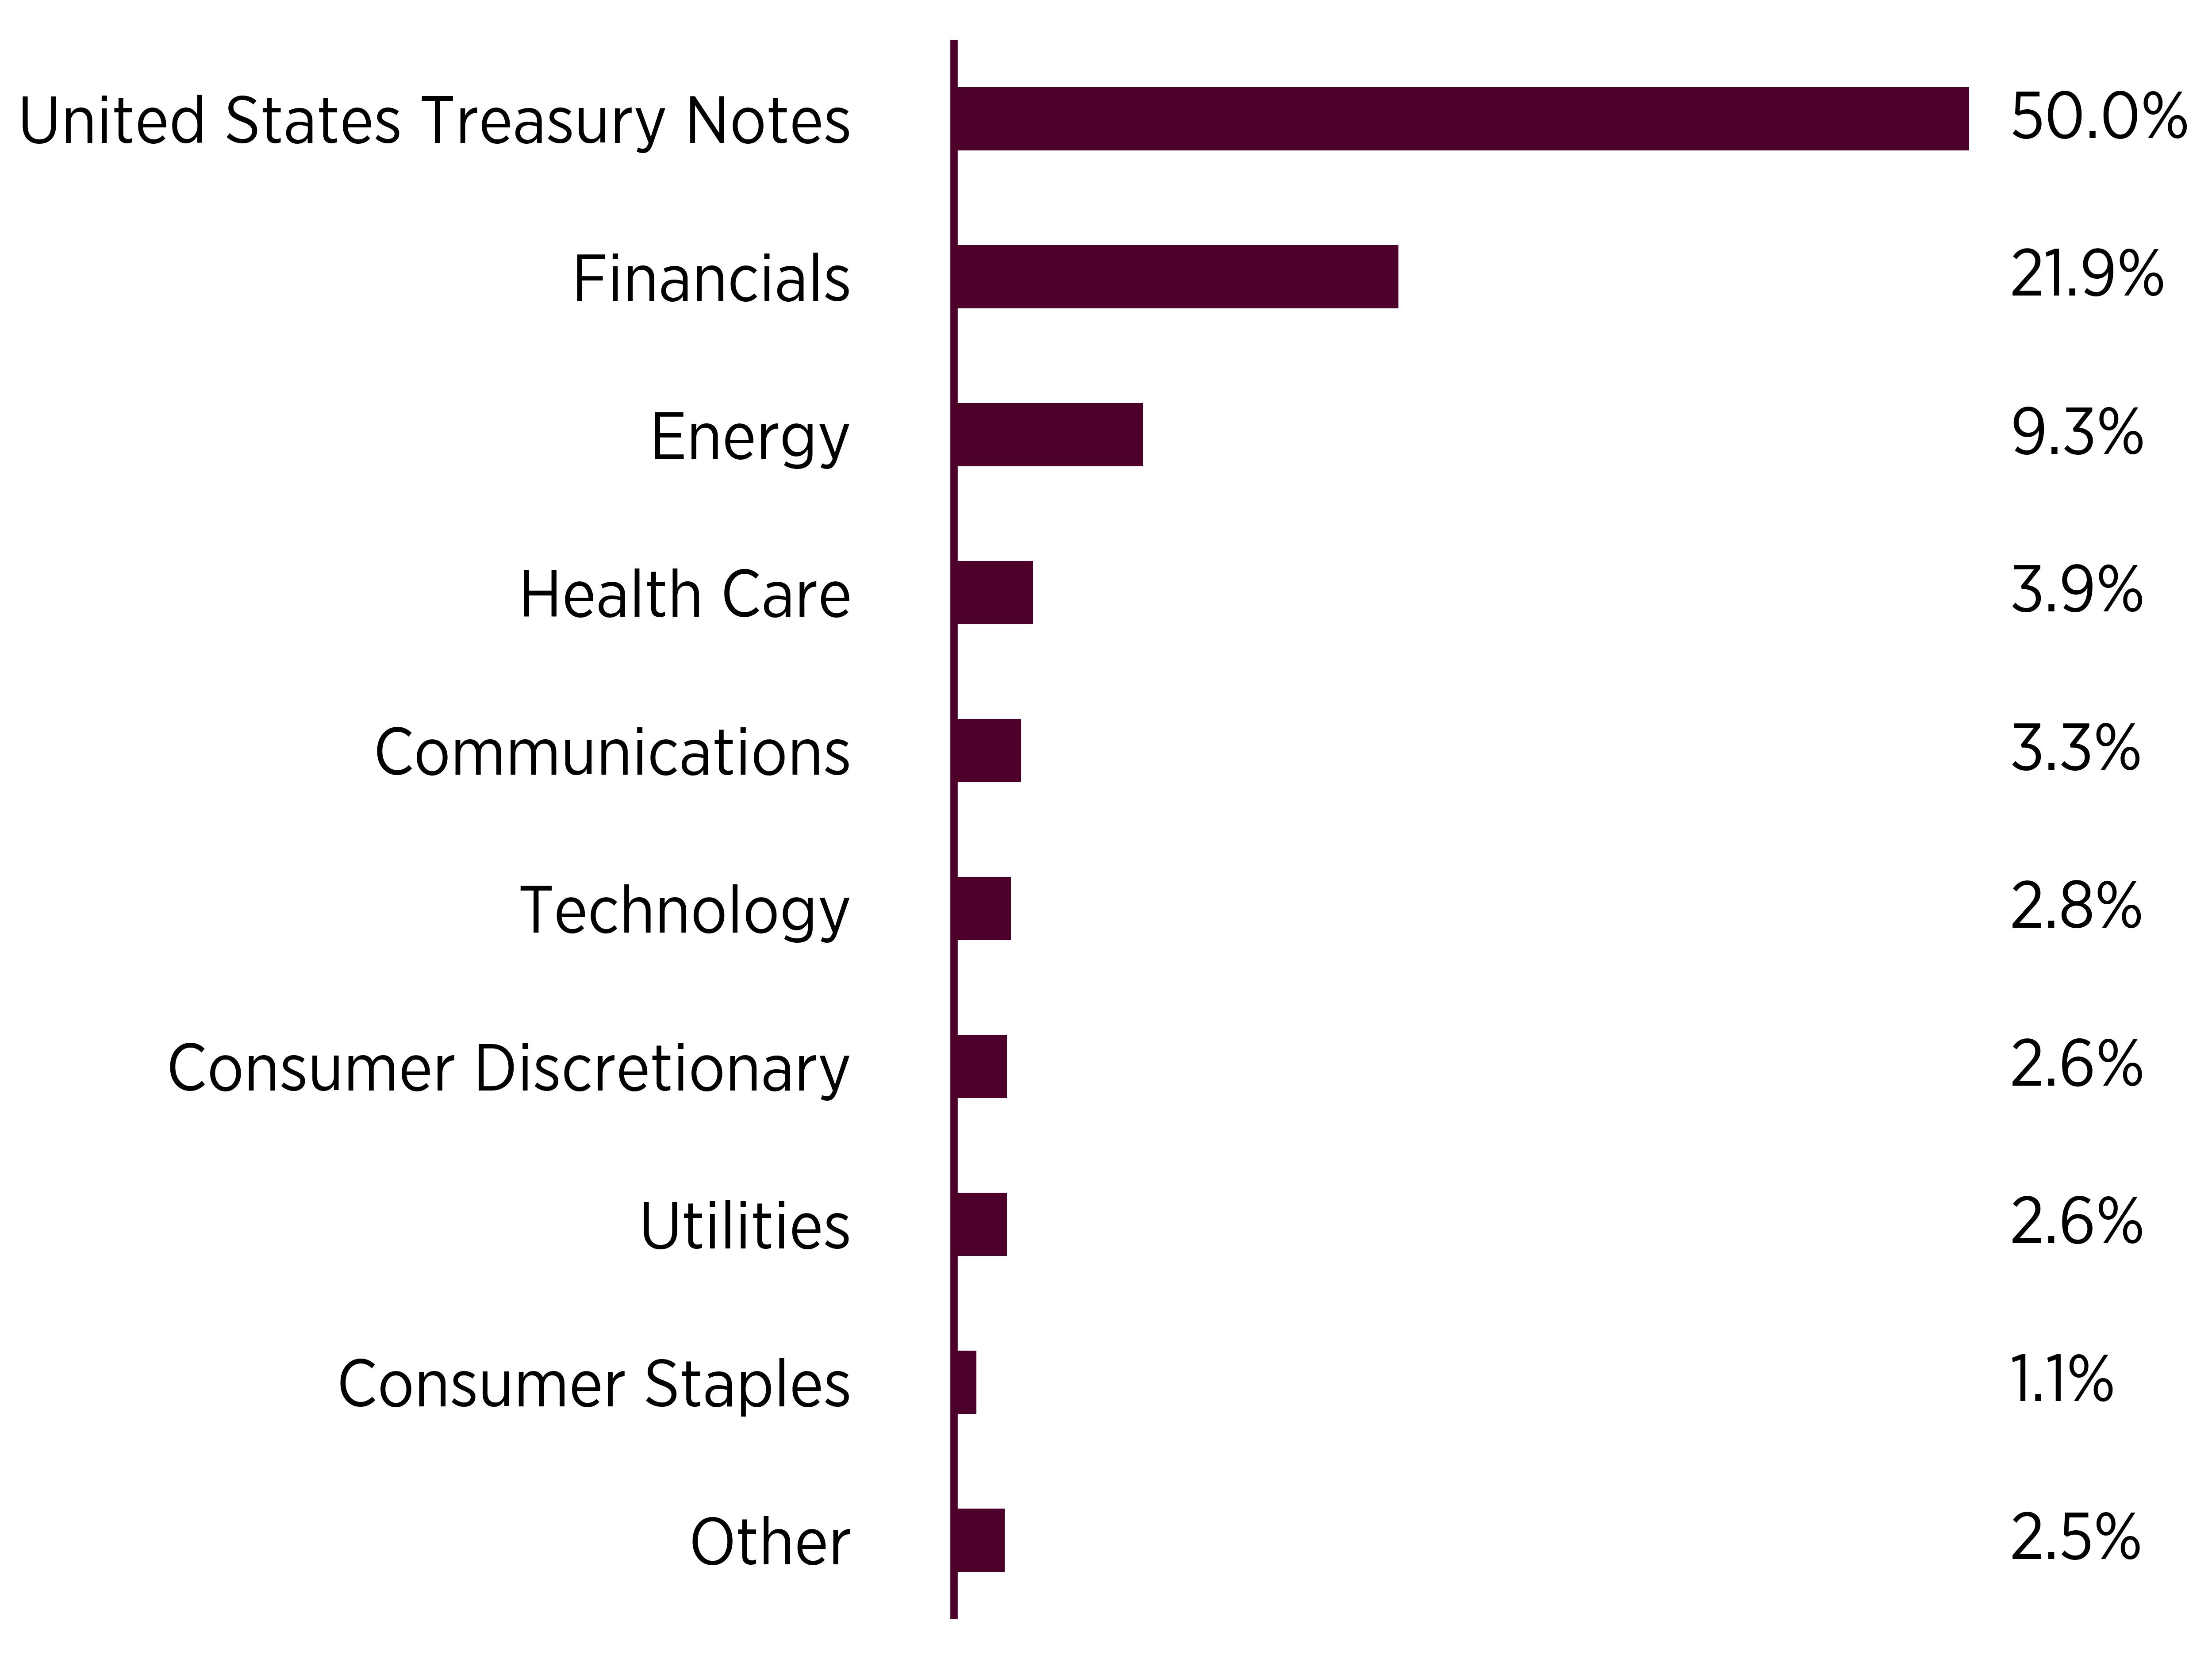
Sector Breakdown (% of net assets)
|
Top
Ten Holdings
|
(%
of net assets)
|
|---|---|
|
United
States Treasury Note, 3.875% 9/30/29
|
|
|
United
States Treasury Note, 2.875% 5/15/32
|
|
|
United
States Treasury Note, 4.625% 2/15/35
|
|
|
United
States Treasury Note, 4.125% 7/31/31
|
|
|
United
States Treasury Note, 4% 1/31/31
|
|
|
United
States Treasury Note, 3.5% 2/15/33
|
|
|
United
States Treasury Note, 4.125% 2/15/36
|
|
|
Enbridge
Inc, 6% 1/15/77
|
|
|
United
States Treasury Note, 3.5% 11/15/28
|
|
|
Utah
Acquisition Sub Inc, 3.95% 6/15/26
|
What
were the Fund costs for the past year?
(based
on a hypothetical $10,000 investment)
|
Fund
Name
|
Costs
of a $10,000 investment
|
Costs
paid as a percentage of a $10,000 investment
|
|---|---|---|
|
Genter
Capital
Municipal
Quality
Intermediate
ETF
|
$39
|
0.38%
|
How did the Fund perform last year and what affected its performance?
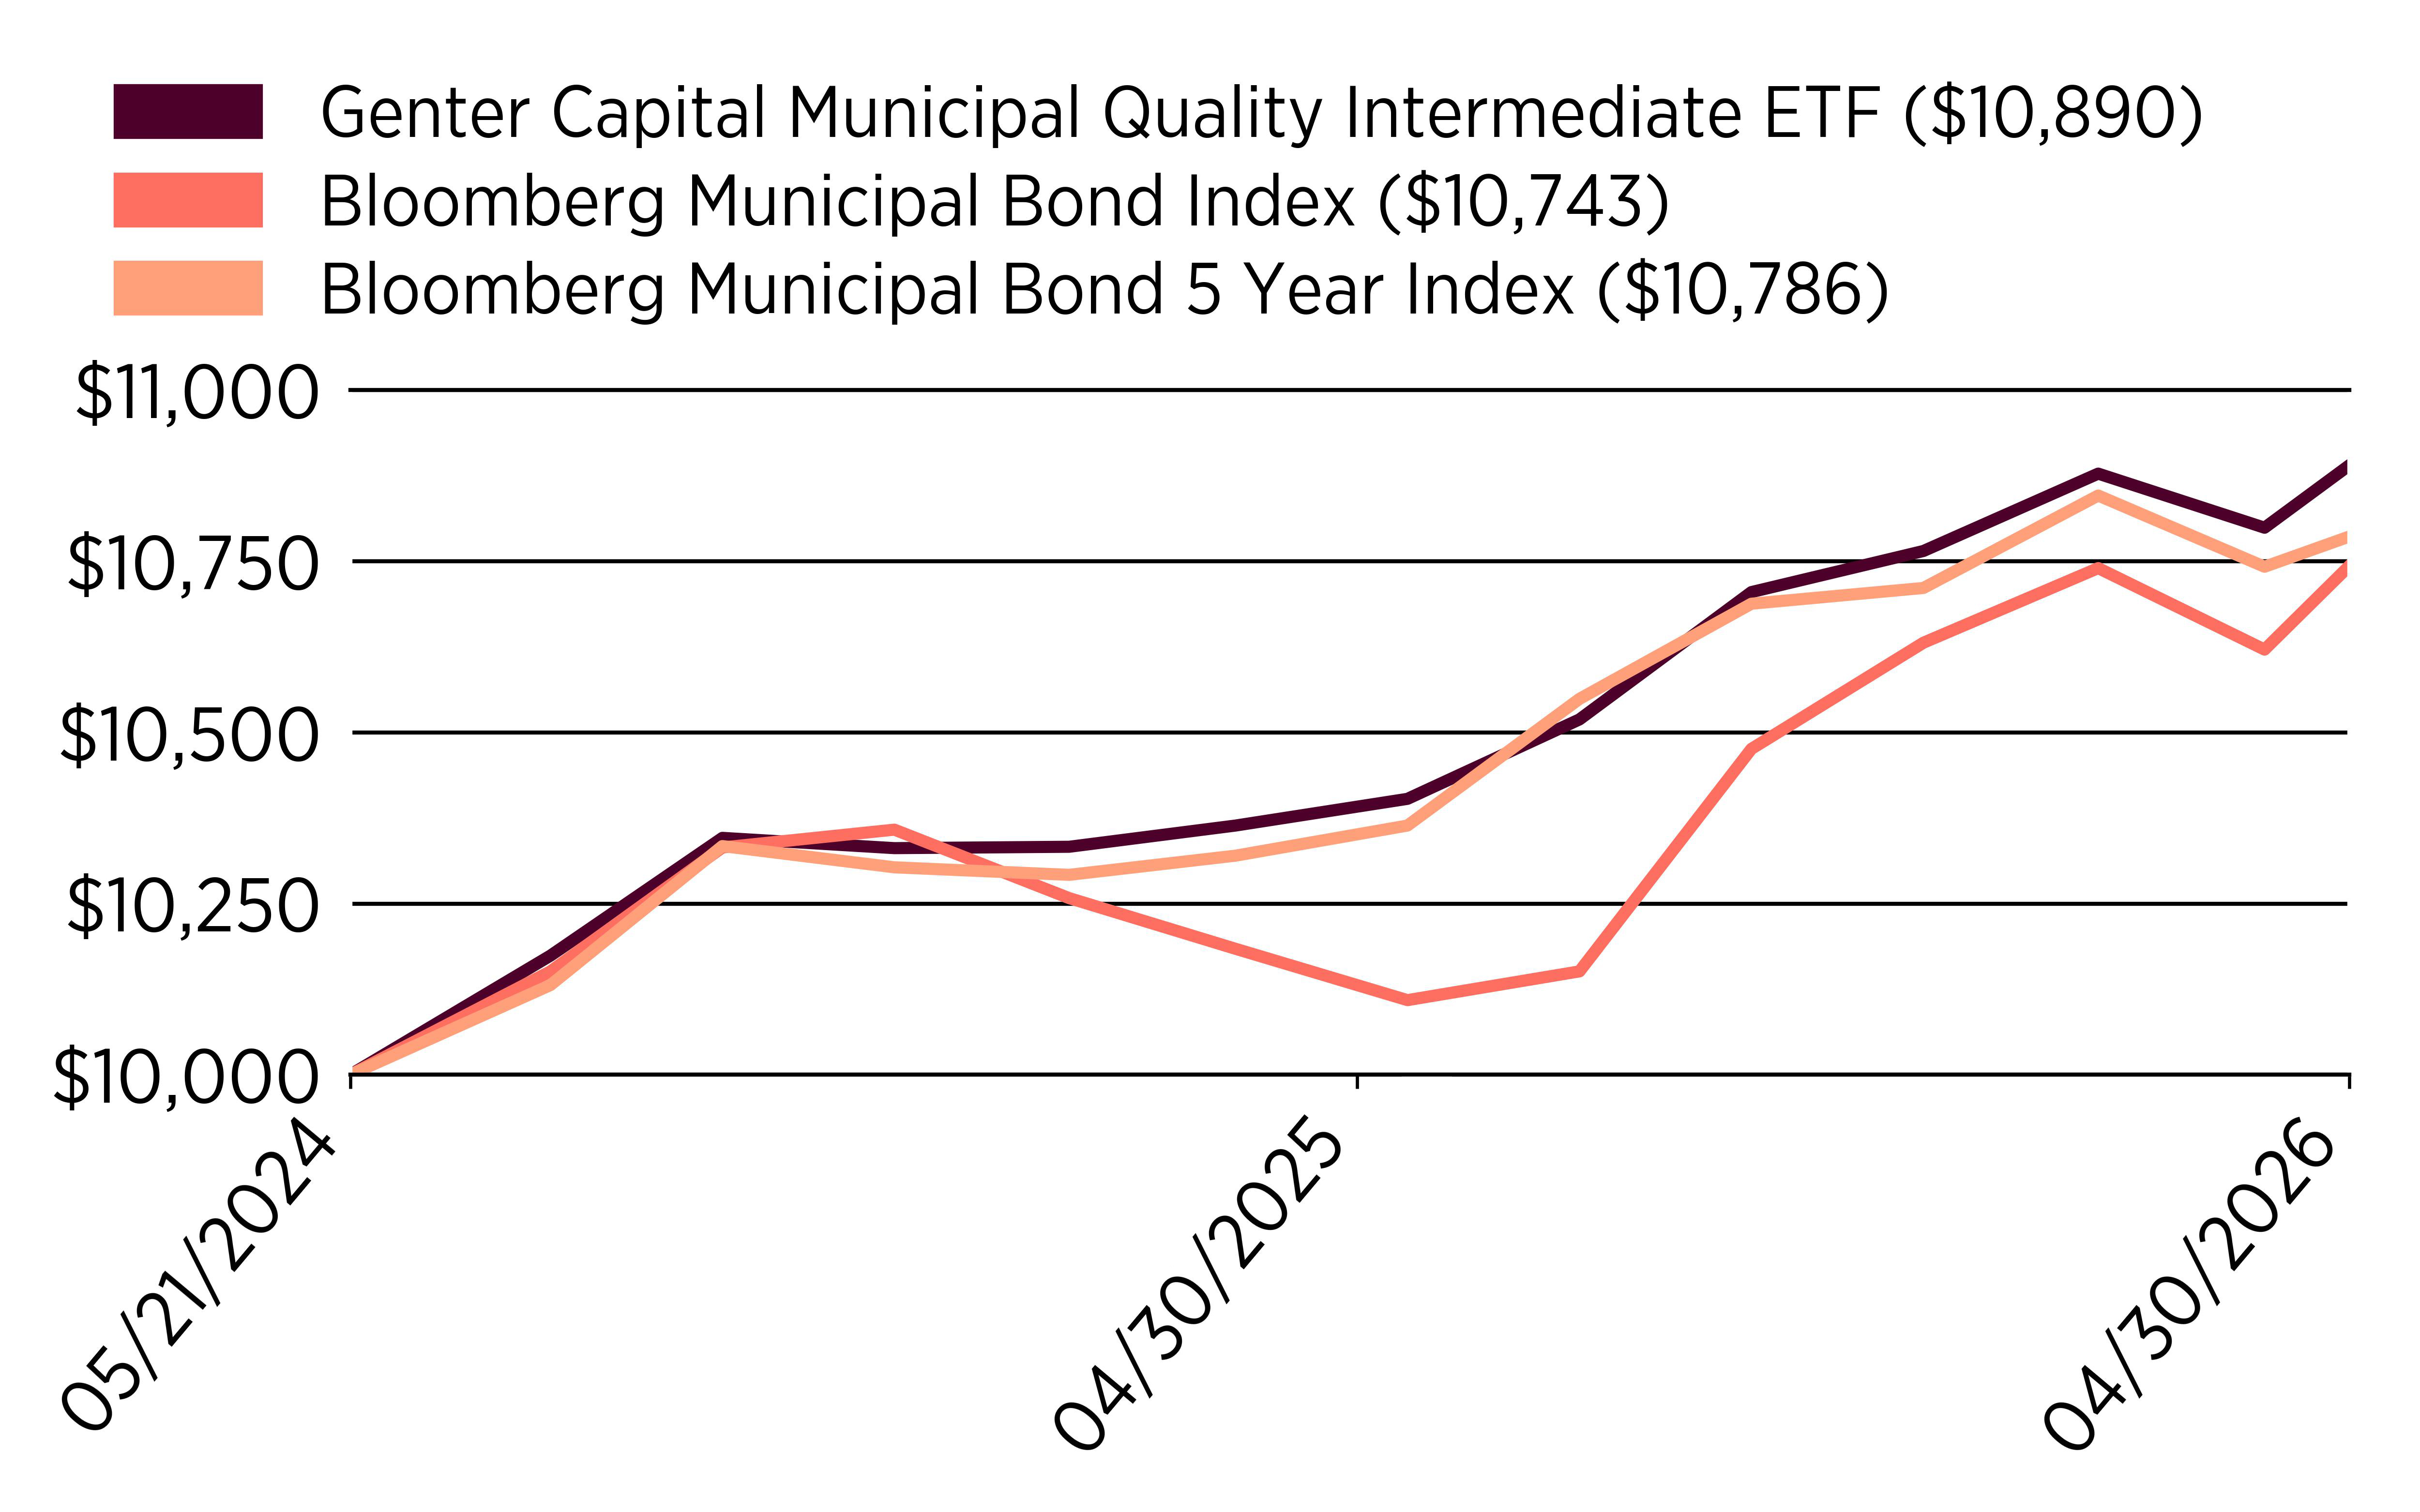
For the fiscal year ended April 30, 2026, the Fund returned 5.30%. The Fund underperformed its benchmark, the Bloomberg Municipal Bond Index, which returned 6.34% for the same period. The Fund outperformed the Bloomberg Municipal Bond 5 Year Index, which returned 5.05% for the same period.
Factors that Impacted the Fund’s Performance
Security and sector selection contributed to the Fund's performance. The Fund's significantly higher yield to worst (YTW), which is a measure of the lowest possible yield that can be received on a bond with an early retirement provision, also contributed to the Fund's performance. The Fund's positioning along the edge of the yield curve, commonly known as a "barbell strategy", did not help the Fund's performance. Among the sectors, housing, education and healthcare underperformed. Conversely, the Fund's investments in bonds backed by special taxes and local governments performed well.
Top 3 Outperforming Securities
• Hope Ark Sales & Use Tax 2025
• Fort Worth Tex Special Tax Rev 2025
• The Indianapolis Local Public Improvement Bank 2025
Top 3 Underperforming Securities
•
Scranton-Lackawanna PA Health & Welfare Auth Rev 2026
5.00%
11/1/2033
•
California Community Choice Fing Auth Clean Energy Project
Rev
2026, 5.00% 3/1/2036
• California Community Choice Fing Auth Clean Energy Project Rev 2026, 5.00%, 2/1/2031
How did the Fund perform since inception?
The following graph compares the initial and subsequent account values at the end of the most recently completed fiscal years of the Fund. It assumes a $10,000 initial investment at the inception date of the Fund in an appropriate broad-based index and a more narrowly based index that reflects the market sectors that the Fund invests in for the same period.
Average Annual Total Returns
(as of April 30, 2026)
|
|
1
Year
|
Since
Inception (5/21/24)
|
|---|---|---|
|
Genter
Capital Municipal Quality Intermediate ETF
|
5.30%
|
4.49%
|
|
Bloomberg
Municipal Bond Index
|
6.34%
|
3.76%
|
|
Bloomberg
Municipal Bond 5 Year Index
|
5.05%
|
3.97%
|
Key Fund Statistics
(as of April 30, 2026)
|
Net
Assets
|
$26,242,586
|
|
Number
of Holdings
|
81
|
|
Net
Advisory Fee
|
$28,591
|
|
Portfolio
Turnover Rate
|
47.79%
|
What did the Fund invest in?
(as
of April
30, 2026)
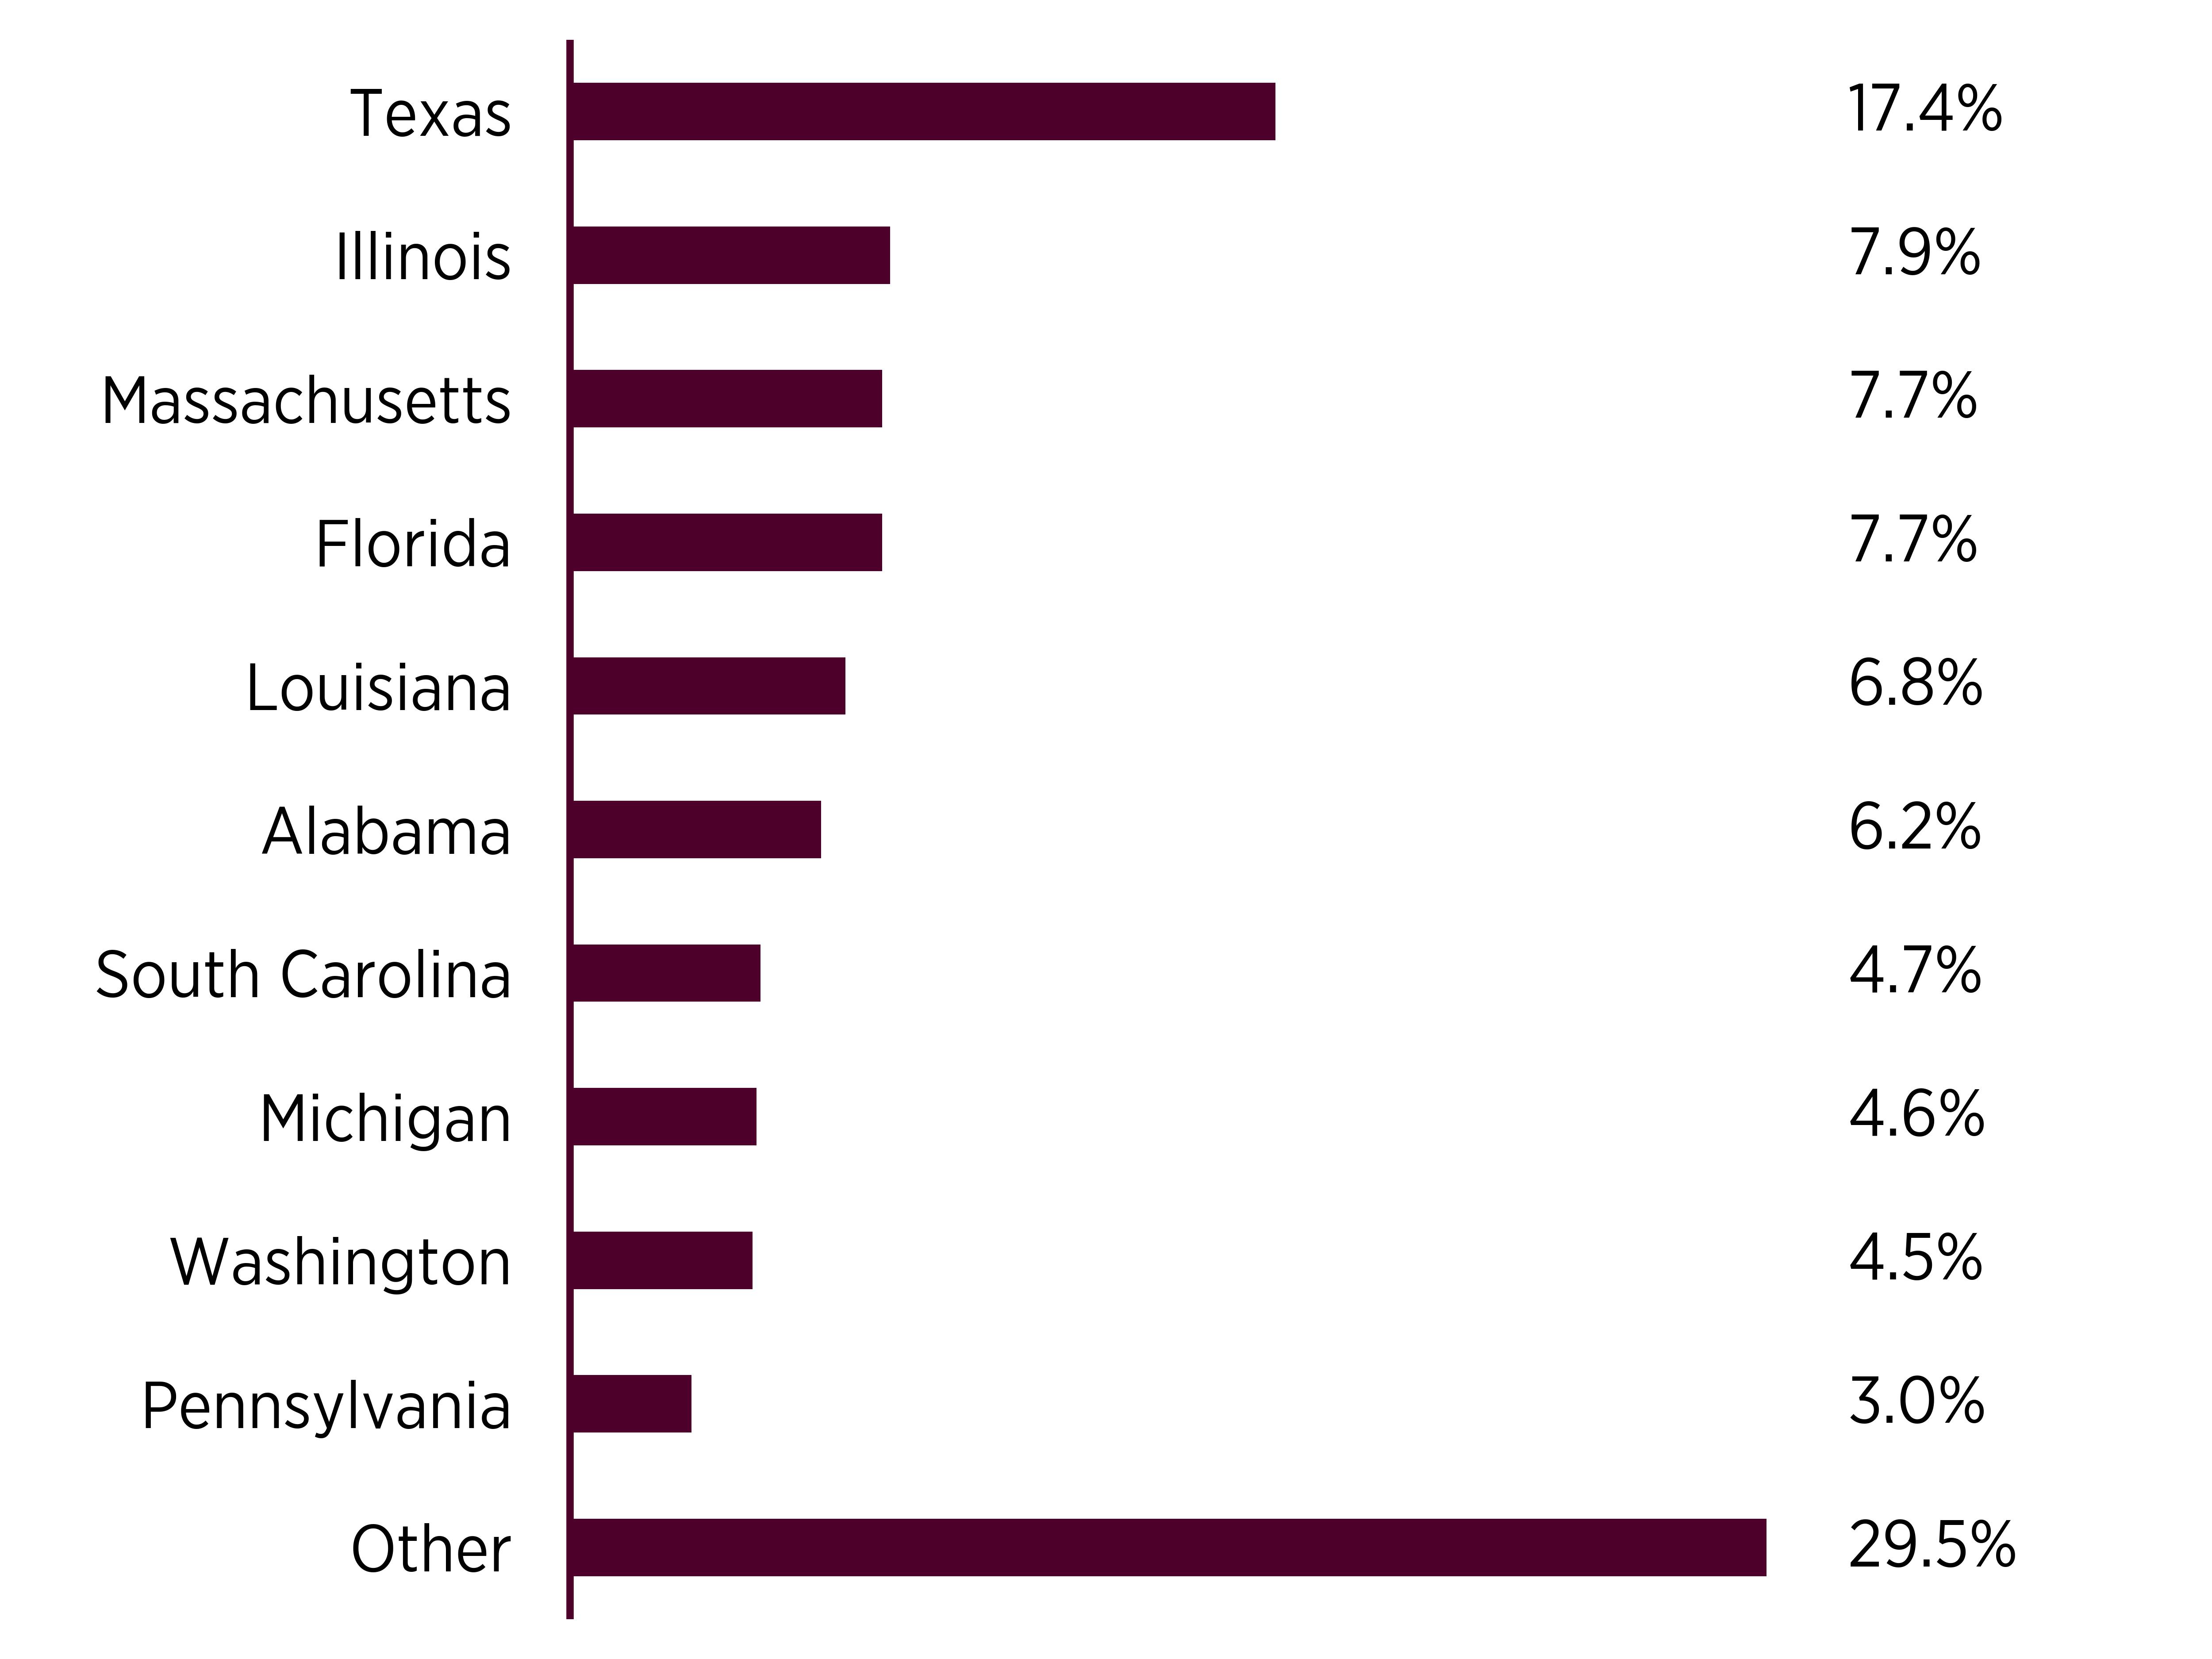
State Breakdown (% of net assets)
|
Top
Ten Holdings
|
(%
of net assets)
|
|---|---|
|
Fidelity
Government Portfolio
|
|
|
Texas
Municipal Gas Acquisition & Supply Corp IV
|
|
|
State
of Texas
|
|
|
California
Community Choice Financing Authority
|
|
|
Vancouver
Housing Authority
|
|
|
Louisiana
Housing Corp
|
|
|
Wayne
County Airport Authority
|
|
|
California
Municipal Finance Authority
|
|
|
Black
Belt Energy Gas District
|
|
|
Kentucky
Public Energy Authority
|