FORM 51-102F3
MATERIAL CHANGE REPORT
Item 1 Name and Address of Company
Integra Resources Corp. ("Integra" or the "Company")
1050 - 400 Burrard Street
Vancouver, British Columbia
Canada V6C 3A6
Item 2 Dates of Material Changes
June 25, 2026
Item 3 News Releases
A news release was disseminated through the facilities of Cision on June 25, 2026 (the "News Release"), and subsequently filed under Integra's issuer profile on SEDAR+ at www.sedarplus.ca.
Item 4 Summary of Material Changes
On June 25, 2026, Integra announced the results of its updated Feasibility Study and Life-of-Mine Plan (collectively, the "Feasibility Study") for the producing Florida Canyon Mine.
Item 5 Full Description of Material Change
Integra announced the results of its Feasibility Study for the producing Florida Canyon Mine ("Florida Canyon" or the "Project"), located in Nevada.
All references to "$" in this material change report are to U.S. dollars and metric units have been used unless otherwise stated. All capitalized terms used but not otherwise defined herein have the meanings given to such terms in the News Release.
Feasibility Study Summary
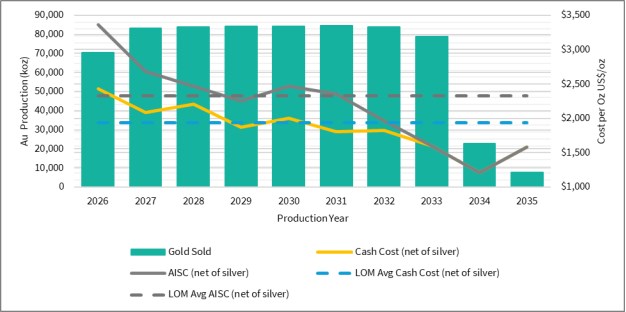
The Feasibility Study reflects the evolution of Florida Canyon from a project with limited mine life and flat annual gold production into a project with an increased production profile and an extended mine life. The enhanced mine plan utilizes existing infrastructure and the current crushing circuit to support an 8-year operating mine life with a LOM site-level AISC of $2,331/oz. Annual gold production increases 17% from 70 Koz to 82 Koz, resulting in LOM gold sold of 685 Koz.
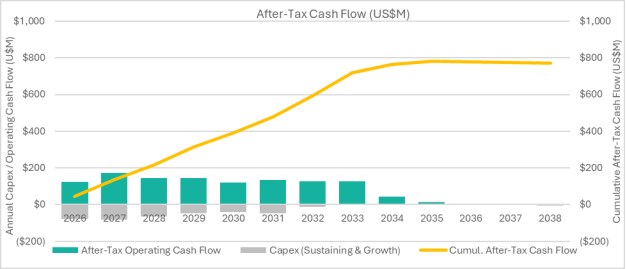
The mine plan outlined in the Feasibility Study represents a material transformation of Florida Canyon. To realize this growth, Integra plans to use its existing cash flow to invest approximately $92 M towards growth capital investments, including $55 M towards the expansion of heap leach capacity within the existing Mine Plan of Operations footprint and $37 M towards the modernization and replacement of the legacy fleet. These investments allow the Company to execute on the updated mine plan outlined in the Feasibility Study. The Feasibility Study highlights a base case after-tax NPV of $601 M (see Table 1 for base case gold price assumptions and Table 2 for after-tax NPV and LOM cumulative cash flows at various gold prices).
- 2 -
The Company retained Global Resource Engineering ("GRE") as lead consultants, along with other engineering consultants, to complete the Feasibility Study and prepare the Feasibility Study in accordance with National Instrument 43-101 Standards of Disclosure for Mineral Projects ("NI 43-101"). The Feasibility Study is derived from the updated mineral reserve estimate effective May 31, 2026. The effective date of the Feasibility Study is June 25, 2026, and a technical report prepared in accordance with NI 43-101 supporting the Feasibility Study will be made available on the Company's website and filed under its SEDAR+ profile at www.sedarplus.ca within 45 days of the date of the News Release.
Table 1: Florida Canyon Feasibility Study Highlights1
| Mining | |||
| Total Tonnage Mined (K tonnes ("Kt")) | 211,199 | ||
| Total Ore Mined (Kt) | 116,935 | ||
| Strip Ratio (Waste: Ore) | 0.81 | ||
| Mine Life (Mining Yrs) | 8.0 | ||
| Contained Gold (Koz Au) | 1,156 | ||
| Production | |||
| LOM Average Gold Recovery (%) | 56.7% | ||
| LOM Gold Recoverable Placed (Koz Au) | 656 | ||
| LOM Gold Sold (Koz Au) | 685 | ||
| Average Annual Gold Sold (Koz Au) - Mining Yrs | 81.8 | ||
| Costs per Tonne (Mining Years 2026 to 2033) | |||
| Mining Costs ($/t mined) | $3.04 | ||
| Mining Costs ($/t placed) | $5.50 | ||
| Crushing & Processing Costs ($/t placed) | $3.03 | ||
| G&A Costs ($/t placed) | $1.24 | ||
| Total Site Operating Cost ($/t placed) | $9.77 | ||
| LOM Site-Level Cash Costs ($/oz Au) | |||
| LOM Cash Cost, net-of-silver by-product | $1,940 | ||
| LOM Site-Level AISC, net-of-silver by-product 2 | $2,331 | ||
| LOM Capital Expenditure ($ M) | |||
| Sustaining Capital | $130.2 | ||
| Capitalized Stripping | $86.5 | ||
| Development Drilling | $7.9 | ||
| Financing Leases - Sustaining | $42.8 | ||
| Growth Capital | $91.8 | ||
| Financing Leases - Growth Capital | $8.6 | ||
| Salvage Value | ($16.9 | ) | |
| Reclamation Cost | $40.2 | ||
| Bonding Cash Collateral Return | ($11.4 | ) |
- 3 -
| Gold Price Assumptions ($/oz) | |||
| Gold Price 2026 | $4,344 | ||
| Gold Price 2027 | $4,414 | ||
| Gold Price 2028 | $4,169 | ||
| Gold Price 2029 | $3,824 | ||
| Gold Price 2030 to 2035 | $3,600 | ||
| Project Economics ($ M) | |||
| After-Tax NPV5% | $600.6 | ||
| Average Annual Net Free Cash Flow (Mining Yrs) | $90.0 | ||
| Total Net Free Cash Flow | $769.5 |
(1) Please refer to "Cautionary Note Regarding Non-GAAP Measures" for a description of non-GAAP financial measures included in this table.
(2) Excluding closure costs.
Figure 1: Florida Canyon Annual Production and Operating Cost Profile1
(1) Please refer to "Cautionary Note Regarding Non-GAAP Measures" for a description of non-GAAP financial measures included in this figure.
- 4 -
Figure 2: Florida Canyon LOM After-tax Free Cash Flow1
(1) Please refer to "Cautionary Note Regarding Non-GAAP Measures" for a description of non-GAAP financial measures included in this figure.
Table 2: Florida Canyon After-Tax NPV and LOM After-tax Net Cash Flow ("CF") Sensitivity to Gold Price1
| Gold Price Estimate ($/oz) | ||||||||
| Change in Gold Price |
After-Tax NPV (5%) $M |
After-Tax LOM CF $M |
2026 | 2027 | 2028 | 2029 | 2030 to 2035 |
|
| (25%) | $203.8 | $275.3 | $3,535 | $3,311 | $3,127 | $2,868 | $2,700 | |
| (20%) | $283.5 | $374.8 | $3,697 | $3,531 | $3,335 | $3,059 | $2,880 | |
| (15%) | $363.2 | $474.1 | $3,859 | $3,752 | $3,544 | $3,250 | $3,060 | |
| (10%) | $443.1 | $573.5 | $4,021 | $3,973 | $3,752 | $3,442 | $3,240 | |
| (5%) | $522.3 | $672.1 | $4,183 | $4,193 | $3,961 | $3,633 | $3,420 | |
| Base | $600.6 | $769.5 | $4,344 | $4,414 | $4,169 | $3,824 | $3,600 | |
| 5% | $676.5 | $864.2 | $4,506 | $4,635 | $4,377 | $4,015 | $3,780 | |
| 10% | $752.3 | $958.7 | $4,668 | $4,855 | $4,586 | $4,206 | $3,960 | |
| 15% | $828.0 | $1,053.2 | $4,830 | $5,076 | $4,794 | $4,398 | $4,140 | |
| 20% | $903.6 | $1,147.3 | $4,992 | $5,297 | $5,003 | $4,589 | $4,320 | |
| 25% | $978.0 | $1,239.4 | $5,154 | $5,518 | $5,211 | $4,780 | $4,500 | |
(1) Please refer to "Cautionary Note Regarding Non-GAAP Measures" for a description of non-GAAP financial measures included in this table.
- 5 -
Property Description, Location and Access
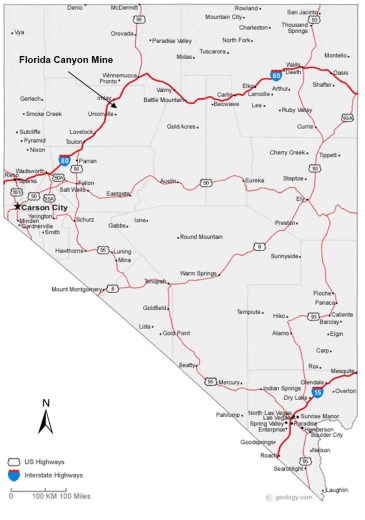
Florida Canyon is located 125 miles (~201 kilometers) east of Reno, Nevada, and immediately south of Interstate 80. The nearest towns are Winnemucca, 40 miles northeast (~64 kilometers) with a population of 8,388 (2022) and Lovelock, 33 miles southwest, with a population of 1,854 (2022). The highway exit for the Florida Canyon Mine from I-80 is at Imlay, Nevada. Access is reliable via the Interstate year-round.
Commercial mining operations at Florida Canyon began in 1986 using conventional open-pit mining and heap-leach processing methods. The mine operated continuously through 2011 before entering a period of intermittent production until 2015. Florida Canyon was subsequently restarted in mid-2016 following new investment and operational improvements and has remained in operation since. Since the restart, Florida Canyon has undergone modernization and expansion efforts, including upgrades to equipment, heap-leach infrastructure, permitting expansions, and long-term mine planning initiatives.
Figure 3: Florida Canyon Location Map
- 6 -
Updated Mineral Resource Estimate
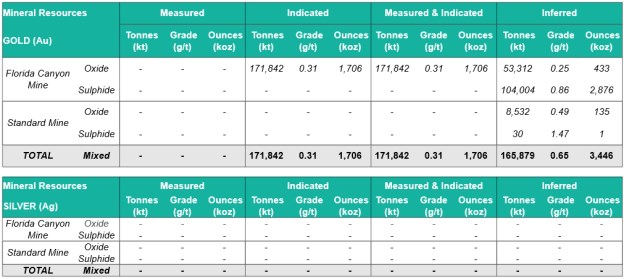
Mineral resources were re-estimated from the resource model released in 2024 and include historic waste rock stockpiles whose grade exceeds current cut-off grades for the Project. The updated Mineral Resource Estimate ("MRE") incorporates a revised geological interpretation that includes structural domains and shear controls. These changes improved grade continuity within mineralized zones and reduced dilution associated with previous estimation domains. The revised geological model includes infill, confirmatory and exploration drilling completed since 2024, together with historical drilling completed by previous operators. In total, the MRE is based on 5,454 drill holes totaling 665,423 meters ("m"). The updated MRE for Florida Canyon was modeled following industry-standard and Canadian Institute of Mining, Metallurgy & Petroleum ("CIM") compliant protocols.
Key steps included:
• Verification of the drill hole database;
• Generation of drill hole intercepts for each shear zone;
• Statistical analysis of assay data;
• Compositing of assay intervals;
• Capping of outlier composite values;
• Geostatistical analysis, including variography;
• Construction of the block model and grade interpolation;
• Classification of the Mineral Resources;
• Validation of the block model;
• Calculation of cut-off grades;
• Pit optimization;
• Confirmation that reported blocks meet the RPEEE criteria; and
• Preparation of the Mineral Resource statement.
The MRE is constrained within an optimized pit shell generated using updated metal prices, metallurgical recoveries, operating costs and slope assumptions consistent with reasonable prospects for eventual economic extraction.
- 7 -
Table 3: Florida Canyon and Standard Mine MRE
Notes for Florida Canyon Mineral Resource Estimate
(1) Mineral resources are reported, using the 2014 CIM Definition Standards, with an effective date of May 31, 2026. The qualified person as defined under NI 43-101 for the estimate is Ms. Terre Lane, MMSA QP, a Global Resource Engineering, Ltd. employee. Ms. Terre Lane is independent of the Company.
(2) Mineral resources are reported inclusive of those mineral resources converted to mineral reserves. Mineral resources that are not mineral reserves do not have demonstrated economic viability.
(3) Mineral resources are constrained within a conceptual open pit shell that uses the following assumptions: gold price of $2,650/oz; gold recoveries ranging from 43% to 67% for oxides and 80% for sulfides; reference mining cost of $2.79/t mined in-situ and $2.47/t mined fill; processing cost of $6.51/t processed for oxide crushed material and $4.23/t processed for oxide ROM material; processing cost of $26.30/t processed for sulfide material; general and administrative costs of $1.14/t processed; treatment and refining costs of 38.73/oz Au recoverable; royalty of $132.00/oz Au recoverable, and pit slope overall angles ranging from 30-36°.
(4) Mineral resources are reported at a cut-off grade ranging from 0.13 g/t to 0.14 g/t for oxides and is 0.46 g/t for sulfides.
(5) Mineral Resources include a stockpile of 1,094 kt at an average grade of 0.21 g/t and total contain gold of 6.78 Koz.
(6) Mineral Resources include Heap Leach Inventory of 6,648 kt at an average grade of 0.29 g/t and total contained gold of 56.5 Koz.
(7) Numbers have been rounded and may not sum.
(8) The estimate of mineral resources may be materially affected by geology, environment, permitting, legal, title, taxation, sociopolitical, marketing, or other relevant issues.
Notes for Standard Mine Mineral Resource Estimate
(1) Mineral Resources are reported, using the 2014 CIM Definition Standards, with an effective date of May 31, 2026. The Qualified Person for the estimate is Mr. Antoine Teixeira de Carvalho, P.Geo., an employee of BT Africa Mining Services. Mr. Antoine Teixeira de Carvalho is independent of the Company.
(2) Mineral Resources are reported inclusive of those Mineral Resources converted to Mineral Reserves. Mineral Resources that are not Mineral Reserves do not have demonstrated economic viability.
(3) Mineral Resources are constrained within a conceptual open pit shell that uses the following assumptions: gold price of US$2,650/oz; gold recoveries ranging from 43% to 66.7% for oxides and 80% for sulfides; reference mining cost of $2.79/ton mined in-situ and $2.47/ton mined fill; processing cost of $5.37/ton processed for oxide crushed material and $3.09/ton processed for oxide ROM material; processing cost of $25.16/ton processed for sulfide material; general and administrative costs of $1.14/ton processed; treatment and refining costs of $38.73/oz Au recoverable; royalty of $145.75/oz Au recoverable, and pit slope overall angles ranging from 30-43°.
(4) Mineral Resources are reported at a cut-off grade ranging from 0.0038 oz/ton to 0.0071 oz/ton for oxides and is 0.0133 oz/ton for sulfides.
(5) Numbers have been rounded and may not sum.
- 8 -
(6) The estimate of mineral resources may be materially affected by geology, environment, permitting, legal, title, taxation, sociopolitical, marketing, or other relevant issues.
Mineral Reserve Estimate
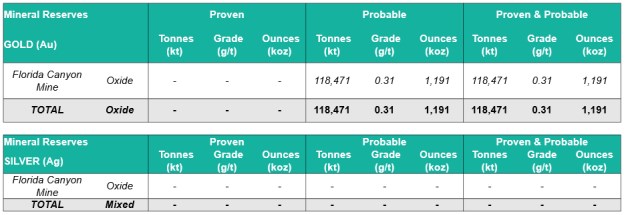
The Mineral Reserves were estimated by applying detailed mine design, production schedules, operating costs, metallurgical recoveries and economic criteria to the Measured and Indicated Mineral Resources. The engineered open pits were constrained with cut-off grades that reflect updated metal prices, metallurgical recoveries and known operating costs. Based on updated geotechnical assessment and operating experience, inter-ramp slope angles in selected areas were increased from 38 degrees to 42 degrees, resulting in additional economic pit inventory available for resource conversion. Along with confirmatory and exploration drilling, refined engineering and the inclusion of historic waste rock stockpiles, the updated mineral reserve estimate fully replaces mining depletion since the acquisition of Florida Canyon and supports an extension of active mining through 2033.
Table 4: Florida Canyon Mineral Reserve
Notes to Mineral Reserves
(1) Mineral reserves are reported at the point of delivery to the process plant, using the 2014 CIM Definition Standards, with an effective date of May 31, 2026. The qualified person as defined under NI 43-101 for the estimate is Ms. Terre Lane, MMSA QP, a Global Resource Engineering, Ltd. employee. Ms. Terre Lane is independent of the Company.
(2) Mineral reserves are constrained within an open pit design that uses the following assumptions: gold price of $2,400/oz considering only oxide material; gold recoveries varied by deposit and ore type, ranging from 43% to 67%; reference mining cost of $3.24/t mined in-situ and $2.93/t mined fill; processing cost of $6.51/t processed for oxide crushed material and $4.23/t for oxide run-of-mine ("ROM") material; G&A costs of $1.14/t ore processed; treatment and refining costs of $38.73/oz gold recoverable; royalty costs of $132.00/oz gold recoverable; and pit slope inter-ramp angles ranged from 36-42° for rock and 36° for alluvium / fill.
(3) Mineral reserves are reported at a cut-off grade ranging from 0.14 g/t to 0.15 g/t.
(4) Mineral Reserves include a stockpile of 1,094 kt at an average grade of 0.21 g/t and total contained gold of 6.78 Koz.
(5) Mineral Reserves include Heap Leach Inventory of 6,648 kt at an average grade of 0.29 g/t and total contained gold of 56.5 Koz.
(6) Numbers have been rounded and may not sum.
(7) The estimate of mineral reserves may be materially affected by geology, environment, permitting, legal, title, taxation, sociopolitical, marketing, or other relevant issues.
- 9 -
Production Profile
The Feasibility Study outlines 8-years of active mining and ore placement, followed by approximately two years of residual gold recovery from heap leaching, extending the operating mine life from 2030 in the 2024 Technical Report to 2033 in the Feasibility Study. The 8-years of active mining at Florida Canyon are followed by 2-years of residual leaching. The updated mine plan shows an increase in annual production from 70 Koz Au in the 2024 Technical Report to 82 Koz in the Feasibility Study, which represents an annual increase of 12 Koz per year.
The Company anticipated 2026 would be a cost intensive transition year as it addressed a deferred stripping campaign in the Central pit and undertook fleet replacement and upgrades. The Feasibility Study reflects these investments and outlines a more stable and sustainable operating plan, reducing production variability and supporting a more consistent and predictable production profile over an increased LOM.
Mining
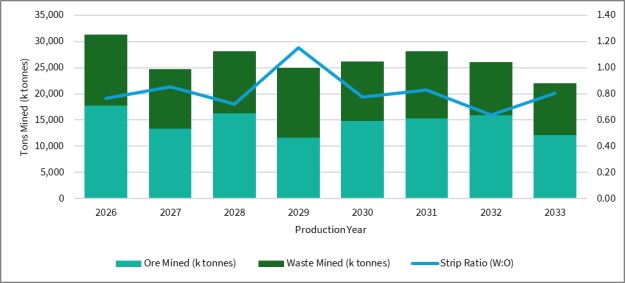
Mining is currently conducted as a conventional open-pit operation using truck-and-loader methods. The mine plan schedules 22.0 to 28.1 million tonnes ("Mt") of total material movement per year ("/yr"), which is consistent with historical mining performance and fleet capability, with an average of 14.6 Mt/yr of ore transferred to the heap leach pad. Approximately, 7.1 Mt/yr of ore is scheduled for crushing to 2.5 inches, consistent with capacity and historical operating performance of the existing crushing circuit. Crushed material will be blended with approximately 4.5 Mt to 9.3 Mt/yr of run-of-mine ("ROM") material during the 10-year LOM (8-years of active mining). The mine plan schedules 211.2 Mt of total material movement over the 8-year active mine life, including 116.9 Mt of ore with an average grade of 0.31 g/t Au, resulting in 656 Koz Au recoverable placed on the heap leach pad over LOM. The LOM average strip ratio of 0.81 waste tonnes per ore tonne is consistent with historical operating performance and supports the economic extraction of the reserve inventory.
The increased mine life and enhanced production profile are primarily driven by the expansion of the Central Pit and Radio Tower Pit. Mining is planned in the Central Pit from 2026 through 2028, followed by the Radio Tower Pit from 2028 through 2030. Mining from 2030 through 2033 will occur at the Jasperoid Pit and through the processing of historic waste rock stockpiles.
Mining assumptions were developed using recent operating performance, equipment productivity analyses, labour requirements, maintenance planning and detailed production scheduling. The Feasibility Study provides a mine plan that can be executed effectively and deliver consistent production. Through an improved geological model and detailed forward planning, the Company expects to improve operation reliability and preserve flexibility that supports multiple ore sources to unlock additional value from the Mineral Reserve base.
- 10 -
Figure 4: Florida Canyon Mining Profile
Processing and Recovery
Crushed ore at Florida Canyon passes through two stages of open circuit crushing to a final crush size of 80% minus 2.5 inches with processing capabilities of 21,000 tonnes per day ("tpd"). Crushed ore is then agglomerated with a polymer binding agent to improve solution percolation through the heap leach pad and is delivered via haul truck. The ore can also be delivered to the heap leach pad through a series of overland conveyors and mobile grasshopper conveyors, or a combination of both.
Crushed ore, representing 47% of all material transferred to the heap leach pad, is blended with ROM ore at the heap lead pad dump face. Barren solution (cyanide-bearing solution very low in gold grade) is applied selectively to different areas of the heap leach pad through drip irrigation tubing at an average application rate of 0.003 gallons per minute per square foot.
Heap leach pad expansions at Florida Canyon are planned within the existing Mine Plan of Operations at the Project. The heap leach pad expansion will take place over four total phases, with two phases completed between 2026 and 2028 and two phases completed in 2030 and 2031.
- 11 -
Figure 5: Florida Canyon Project Ounces Recoverable Placed Crushed vs. ROM
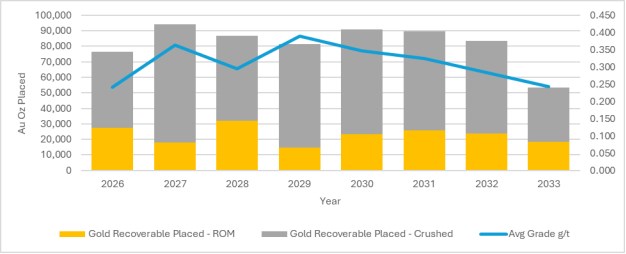
Table 5: Florida Canyon Project Mining & Processing Summary
| ROM | Crushing | Total | |||||||
| Mining | |||||||||
| Total Ore Mined (Kt) | 61,648 | 55,287 | 116,935 | ||||||
| Total Waste (Kt) | 94,264 | ||||||||
| Total Mined (Kt) | 211,199 | ||||||||
| Strip Ratio (Waste: Ore) | 0.81 | ||||||||
| Grade & Contained Metals | |||||||||
| Average Gold Grade (g/t Au) | 0.21 | 0.42 | 0.31 | ||||||
| Contained Gold (Koz Au) | 410 | 746 | 1,156 | ||||||
| Production | |||||||||
| LOM Average Gold Recovery (%) | 44.8% | 63.3% | 56.7% | ||||||
| LOM Gold Recoverable Placed (Koz Au) | 184 | 473 | 656 | ||||||
| Ounces on the Heap Leach Pad as of Dec 31, 2025 (Koz Au) | 29 | ||||||||
| LOM Gold Sold (Koz Au) | 685 | ||||||||
Operating Costs
The Feasibility Study provides a comprehensive assessment of Florida Canyon with a mine plan that reflects current and future operating realities. The Feasibility Study includes nearly two years of detailed review and analysis by Integra of operating costs, maintenance requirements, labour assumptions and long-term mine planning. The Company completed a bottom-up evaluation of all major cost categories at the Project, incorporating historical operating performance, budget variances and previously underrepresented costs to develop a more comprehensive and realistic cost structure. Assumptions have been updated to reflect current market conditions, including labour costs consistent with Nevada's competitive mining sector and expected turnover and vacancy rates.
- 12 -
The Feasibility Study also incorporates a fully integrated mine plan to support the expanded reserve base, including permitting costs and engineered plans for future heap leach pads. Equipment assumptions have been updated to reflect a more proactive maintenance strategy, integrating both planned component replacement programs and expected unplanned downtime based on historical operating performance. The Feasibility Study also includes investments in fleet modernization, including the transition to larger haul trucks and other equipment upgrades designed to improve productivity, increase reliability and reduce unit mining costs over time. Together, these investments support a more stable and predictable operating profile while providing the infrastructure and equipment capacity required to execute the mine plan.
Table 6: Florida Canyon Operating Cost Breakdown
| Mining Years (2026 to 2033) | $ Per Tonne | |||||
| Operating Costs 2026 to 2033 | Mined | Placed | ||||
| Mining | $3.04 | $5.50 | ||||
| Crushing and Conveying / Processing | $3.03 | |||||
| G&A | $1.24 | |||||
| Total Site Costs | $9.77 | |||||
Figure 6: Florida Canyon Annual Operating Cost ("Opex") per Tonne Placed
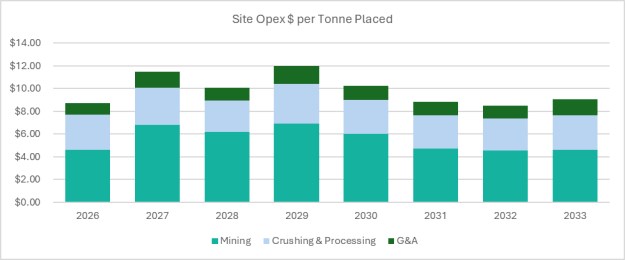
Table 7: Florida Canyon LOM Cash Costs and Site-Level AISC1
| Life Of Mine | $/oz Au |
|||||
| Site-Level Cash Costs, AISC Breakdown | By-Product | |||||
| Mining | $939 | |||||
| Crushing and Conveying / Processing | $547 | |||||
| G&A | $231 | |||||
| Total Site Costs | $1,717 | |||||
- 13 -
| Transport & Refining | $9 | |||||
| Royalties | $246 | |||||
| Total Cash Costs | $1,972 | |||||
| Silver By-Product Credits | ($32 | ) | ||||
| Total Cash Costs Net of Silver by-Product | $1,940 | |||||
| Sustaining Capital | $391 | |||||
| Site-Level All-in Sustaining Costs - Excluding Closure Costs | $2,331 | |||||
| Closure Costs Net of Residual Value | $42 | |||||
| Site-Level All-in Sustaining Costs - Including Closure Costs | $2,373 |
(1) Please refer to "Cautionary Note Regarding Non-GAAP Measures" for a description of non-GAAP financial measures included in this table.
Capital Cost Estimates
The expanded production profile outlined in the Feasibility Study is expected to be funded from Florida Canyon's existing and future cash flow. The updated mine plan at Florida Canyon will be realized through growth capital investments of $92 M that will result in a materially enhanced Project. Expanding heap leach pad capacity is a key component of the updated mine plan, supporting both the longer mine life and increased production profile at Florida Canyon. The Company has allocated $55 M to construct two heap leach pad expansions within the existing Mine Plan of Operations footprint. In addition, the Company will invest approximately $37 M in fleet modernization, replacing aging loaders and legacy 777 haul trucks approaching their operating life with larger, more productive 785 haul trucks. These upgrades are expected to increase material movement capacity, improve operating efficiency and support the expanded production profile and longer mine life outlined in the Feasibility Study.
Sustaining capital of approximately $267 M includes ~$87 M for the completion of the extensive pre-stripping campaign in the Central Pit, which commenced in 2025 and is expected to conclude in 2026, providing access to higher-grade ore and supporting future production. In addition, ~$53 M in ongoing parts replacement and preventative maintenance designed to improve reliability and reduce unplanned downtime and ~$32 M for two additional heap leach pads are included in sustaining capital.
Table 8: Florida Canyon Capital Cost Breakdown
| Yr 2026 to Yr 2035 |
Yr 2036 to Yr 2038 |
Combined LOM |
|||||||
| Sustaining Capital Costs | |||||||||
| Sustaining Capital | $130.2 | $0.0 | $130.2 | ||||||
| Capitalized Stripping | $86.5 | $0.0 | $86.5 | ||||||
| Development Drilling | $7.9 | $0.0 | $7.9 | ||||||
| Lease Payments (Financing) - Sustaining | $42.8 | $0.0 | $42.8 | ||||||
| Total Sustaining Capital & Stripping | $267.4 | $0.0 | $267.4 | ||||||
| Other Capital | |||||||||
| Lease Payments (Financing) - Growth | $8.6 | $0.0 | $8.6 |
- 14 -
| Growth Capital | $91.8 | $0.0 | $91.8 | ||||||
| Residual Value 1 | ($16.9 | ) | $0.0 | ($16.9 | ) | ||||
| Reclamation 2 | $19.9 | $20.3 | $40.2 | ||||||
| Cash collateral return 3 | $0.0 | ($11.4 | ) | ($11.4 | ) | ||||
| Total Other Capital | $103.4 | $8.9 | $112.3 | ||||||
| TOTAL SUSTAINING CAPITAL & OTHER | $370.8 | $8.9 | $379.7 |
(1) The residual value represents estimated salvage value of mobile mining equipment and process / crushing / conveying equipment.
(2) Reclamation costs include ~$6M for reclamation of Standard Mine.
(3) Current cash collateral is assumed released in final year, once the reclamation is completed.
Qualified Persons
The scientific and technical information contained in this material change report has been reviewed and approved by James Frost, P.Eng., Director, Technical Services of Integra Resources Corp., who is a Qualified Person as defined by NI 43-101.
The Company retained Global Resource Engineering as lead consultants, along with other engineering consultants, to complete the Feasibility Study. The following independent Qualified Persons with associated firms have reviewed and approved this material change report as defined by NI 43-101:
Antoine Teixeira de Carvalho, P.Geo. - BT Africa Mining Services
Dave Swanton, MSc, P. Geo, - Equity Exploration Consultants Ltd.
Hamid Samari, Ph.D, MMSA QP - Global Resource Engineering, Ltd.
Larry Breckenridge, P.E. - Global Resource Engineering, Ltd.
Maxime Lamothe, P.Eng. - Alius Mine Consulting
Terre Lane, MMSA QP - Global Resource Engineering, Ltd.
Todd Harvey, Ph.D., SME Register Member - Global Resource Engineering, Ltd.
Data Verification
The Qualified Persons responsible for the Feasibility Study have verified the data for which they are accountable, including the sampling, analytical, and test data underlying the information disclosed in this material change report. Geological, mine engineering and metallurgical reviews included, among other things, reviewing drill data and core logs, review of geotechnical and hydrological studies, environmental and community factors, the development of the life-of-mine plan, capital and operating costs, transportation, taxation and royalties, and review of existing metallurgical test work. In the opinion of the Qualified Persons, the data, assumptions, and parameters used in the sections of the Feasibility Study that they are responsible for preparing are sufficiently reliable for those purposes. The technical report supporting the Feasibility Study, when filed, will contain more detailed information concerning individual Qualified Persons responsibilities, associated quality assurance and quality control, and other data verification matters, and the key assumptions, parameters and methods used by the Company.
Sampling and QA/QC Procedure
Thorough QA/QC protocols are followed on the Project, including insertion of duplicate, blank and standard samples in the assay stream for all drill holes. The samples are submitted directly to American Assay Labs in Reno, Nevada for preparation and analysis. Analysis of gold is performed using fire assay method with atomic absorption ("AA") finish on a 1 assay ton aliquot. Gold results over 5 g/t are re-run using a gravimetric finish. Silver analysis is performed using ICP for results up to 100 g/t on a 5-acid digestion, with a fire assay, gravimetric finish for results over 100 g/t silver.
- 15 -
Additional supporting details regarding the information in this material change report will be provided in a technical report supporting the Feasibility Study which will be filed on SEDAR+ under the Company's profile at www.sedarplus.ca within 45 days of the date of the News Release, including all qualifications, assumptions and exclusions that relate to the Feasibility Study. The Feasibility Study is intended to be read as a whole, and sections should not be read or relied upon out of context.
Item 6 Reliance on subsection 7.1(2) of National Instrument 51-102
N/A
Item 7 Omitted Information
N/A
Item 8 Executive Officer
Andrée St-Germain, Chief Financial Officer
Telephone (778) 873-8190
Item 9 Date of Report
July 6, 2026
Forward Looking Statements
Certain information set forth in this material change report contains "forward‐looking statements" and "forward‐looking information" within the meaning of applicable Canadian securities legislation and in applicable United States securities law (referred to herein as forward‐looking statements). Forward-looking statements are often identified by the use of words such as "may", "will", "could", "would", "anticipate", "believe", "expect", "intend", "potential", "estimate", "budget", "scheduled", "plans", "planned", "forecasts", "goals" and similar expressions. Except for statements of historical fact, certain information contained herein constitutes forward‐looking statements which includes, but is not limited to, statements with respect to: the future financial or operating performance of the Company, the Project and its mineral properties; the Company's updated 2026 guidance; the estimation of mineral resources and reserves; the realization of mineral resource and reserve estimates; the development, operational and economic results of the Feasibility Study for the Project, including cash flows, revenue potential, development, expenditures, and timing thereof, extraction rates, life-of-mine projections and cost estimates; timing of completion of a technical report supporting the Feasibility Study and the filing thereof; magnitude or quality of mineral deposits; anticipated advancement of the Project mine plan, including, without limitation, the expansion of heap leach pad capacity and continued modernization of the Company's mining fleet; exploration expenditures, costs and timing of the development of new deposits; costs and timing of future exploration; permitting; construction and optimization planning, including, without limitation, timing of the Final Environmental Impact Statement and Record of Decision; estimates of metallurgical recovery rates; anticipated advancement and further exploration of the Project and surrounding areas, future prospects and prospective inclusion of Mineral Resources in future mining activities; requirements for additional capital; the future price of metals; government regulation of mining operations; environmental risks; the timing and possible outcome of pending regulatory matters; the realization of the expected economics of the Project; future growth potential of the Project; future development plans; and the date and timing of the conference call and webcast to discuss the Feasibility Study. Forward-looking statements are based on a number of factors and assumptions made by management and considered reasonable at the time such statement was made. Assumptions and factors include: the Company's ability to complete its planned exploration and development programs; the absence of adverse conditions at the Project and the Company's mineral properties; satisfying ongoing covenants under the Company's loan facilities; no unforeseen operational delays; no material delays in obtaining necessary permits; results of independent engineer technical reviews; the possibility of cost overruns and unanticipated costs and expenses; the price of gold remaining at levels that continue to render the Project and the Company's mineral properties economic; the Company's ability to continue raising necessary capital to finance operations; and the ability to realize on the mineral resource and reserve estimates. Forward‐looking statements necessarily involve known and unknown risks and uncertainties, which may cause actual performance and financial results in future periods to differ materially from any projections of future performance or result expressed or implied by such forward‐looking statements. These risks and uncertainties include, but are not limited to: general business, economic and competitive uncertainties; the actual results of current and future exploration activities; conclusions of economic evaluations; meeting various expected cost estimates; benefits of certain technology usage; changes in project parameters and/or economic assessments as plans continue to be refined; future prices of metals; possible variations of mineral grade or recovery rates; the risk that actual costs may exceed estimated costs; geological, mining and exploration technical problems; failure of plant, equipment or processes to operate as anticipated; accidents, labor disputes and other risks of the mining industry; delays in obtaining governmental approvals or financing; risks related to local communities; the speculative nature of mineral exploration and development (including the risks of obtaining necessary licenses, permits and approvals from government authorities); title to properties; and other factors beyond the Company's control and as well as those factors included herein and elsewhere in the Company's public disclosure. Although the Company has attempted to identify important factors that could cause actual actions, events or results to differ materially from those described in the forward-looking statements, there may be other factors that cause actions, events or results not to be as anticipated, estimated or intended. Readers are advised to study and consider risk factors disclosed in Integra's Annual Information Form dated March 24, 2026 for the fiscal year ended December 31, 2025, which is available on the SEDAR+ issuer profile for the Company at www.sedarplus.ca and available as Exhibit 99.1 to Integra's Form 40-F, which is available on the EDGAR profile for the Company at www.sec.gov.
- 16 -
Investors are cautioned not to put undue reliance on forward-looking statements. The forward-looking statements contained herein are made as of the date of this material change report and, accordingly, are subject to change after such date. The Company disclaims any intent or obligation to update publicly or otherwise revise any forward-looking statements or the foregoing list of assumptions or factors, whether as a result of new information, future events or otherwise, except in accordance with applicable securities laws. Investors are urged to read the Company's filings with Canadian securities regulatory agencies, which can be viewed online under the Company's profile on SEDAR+ at www.sedarplus.ca.
Cautionary Note Regarding Non-GAAP Financial Measures
Alternative performance measures in this material change report such as "cash cost", "AISC", "free cash flow" and "sustaining capital costs" are furnished to provide additional information. These non-GAAP performance measures are included in this material change report because these statistics are used as key performance measures that management uses to monitor and assess performance of Florida Canyon, and to plan and assess the overall effectiveness and efficiency of mining operations. These performance measures do not have a standardized meaning within International Financial Reporting Standards ("IFRS") and, therefore, amounts presented may not be comparable to similar data presented by other mining companies. These performance measures should not be considered in isolation as a substitute for measures of performance in accordance with IFRS.
- 17 -
Cash Costs
Cash costs include site operating costs (mining, processing, site G&A), refinery costs and royalties, but excludes head office G&A and exploration expenses. While there is no standardized meaning of the measure across the industry, the Company believes that this measure is useful to external users in assessing operating performance.
Site-Level All-In Sustaining Cost
Site-level AISC includes cash costs and sustaining capital, but excludes head office G&A and exploration expenses. The Company believes that this measure is useful to external users in assessing operating performance and the Company's ability to generate free cash flow from potential operations.
Free Cash Flow
Free cash flows are revenues net of operating costs, royalties, capital expenditures and cash taxes. The Company believes that this measure is useful to the external users in assessing the Company's ability to generate cash flows from the Project.
Cautionary Note for U.S. Investors Concerning Mineral Resources and Reserves
NI 43-101 is a rule of the Canadian Securities Administrators which establishes standards for all public disclosure an issuer makes of scientific and technical information concerning mineral projects. Technical disclosure contained in this material change report has been prepared in accordance with NI 43-101 and the Canadian Institute of Mining, Metallurgy and Petroleum Classification System. These standards differ from the requirements of the U.S. Securities and Exchange Commission ("SEC") and resource and reserve information contained in this material change report may not be comparable to similar information disclosed by domestic United States companies subject to the SEC's reporting and disclosure requirements.