Pay vs Performance Disclosure - USD ($)
Mar. 31, 2026
Mar. 31, 2026
Mar. 31, 2025
Mar. 31, 2024
Mar. 31, 2023
Mar. 31, 2022
Mar. 31, 2021
May 22, 2025
Pay Versus Performance
In accordance with rules adopted by the Securities and Exchange Commission pursuant to the Dodd-Frank Wall Street Reform and Consumer Protection Act of 2010, we provide the following disclosure regarding executive compensation for our principal executive officer (“PEO”) and
non-PEO
NEOs and Company performance for the fiscal years listed below. The Compensation Committee did not consider the pay versus performance disclosure below in making its pay decisions for any of the years shown. Year |
Summary Compensation Table Total for Shawn O’Connell (1) ($) |
Compensation Actually Paid to Shawn O’Connell (1)(2)(3) ($) |
Summary Compensation Table Total for David M. Shaffer (1) ($) |
Compensation Actually Paid to David M. Shaffer (1)(2)(3) ($) |
Average Summary Compensation Table Total for Non-PEO NEOs (1) ($) |
Average Compensation Actually Paid to Non-PEO NEOs (1)(2)(3) ($) |
Value of Initial Fixed $100 Investment Based on: (4) | |||||||||||||||||||||||||||||||||||||||||||
TSR ($) |
Peer Group TSR ($) |
Net Income ($ Millions) |
Adjusted Operating Earnings ($ Thousands) (5) | |||||||||||||||||||||||||||||||||||||||||||||||
2026 |
7,118,612 |
15,756,172 |
14,288,481 |
9,349,346 |
2,894,254 |
6,546,395 |
200.27 |
251.37 |
293.6 |
547,318 |
||||||||||||||||||||||||||||||||||||||||
2025 |
— |
— |
8,476,396 |
7,095,324 |
2,544,738 |
2,088,454 |
104.67 |
139.47 |
363.7 |
498,400 |
||||||||||||||||||||||||||||||||||||||||
2024 |
— |
— |
7,931,249 |
9,572,220 |
1,846,876 |
2,099,458 |
106.92 |
139.87 |
269.1 |
325,639 |
||||||||||||||||||||||||||||||||||||||||
2023 |
— |
— |
7,888,918 |
10,402,205 |
2,124,010 |
2,609,038 |
97.49 |
104.91 |
175.8 |
324,241 |
||||||||||||||||||||||||||||||||||||||||
2022 |
— |
— |
6,852,166 |
2,053,729 |
1,771,200 |
799,102 |
82.85 |
98.80 |
143.9 |
318,243 |
||||||||||||||||||||||||||||||||||||||||
| (1) | Shawn O’Connell started as PEO on May 23, 2025. Prior to May 23, 2025, David M. Shaffer was our PEO each year until May 22, 2025. The individuals comprising the non-PEO NEOs for each fiscal year are listed below. |
2022 |
2023 |
2024 |
2025 |
2026 | ||||
Michael J. Schmidtlein |
Andrea J. Funk | Andrea J. Funk | Andrea J. Funk | Andrea J. Funk | ||||
Shawn O’Connell |
Shawn O’Connell | Shawn O’Connell | Shawn O’Connell | Mark Matthews | ||||
Joern Tinnemeyer |
Joern Tinnemeyer | Joern Tinnemeyer | Joern Tinnemeyer | Chad C. Uplinger | ||||
Andrew M. Zogby |
Andrew M. Zogby | Chad C. Uplinger | Chad C. Uplinger | Keith Fisher | ||||
| Andrew M. Zogby | Keith Fisher | |||||||
| (2) | The amounts shown for Compensation Actually Paid have been calculated in accordance with Item 402(v) of Regulation S-K and do not reflect compensation actually earned, realized, or received by the Company’s NEOs. These amounts reflect the Summary Compensation Table Total. |
| (3) | Compensation Actually Paid reflects the exclusions and inclusions of certain amounts for the PEOs and the non-PEO NEOs as set forth below. Equity values are calculated in accordance with FASB ASC Topic 718. Amounts in the Exclusion of Stock Awards and Option Awards column are the totals from the Stock Awards and Option Awards columns of our 2026 Summary Compensation Table on page 44. |
Year |
Summary Compensation Table Total for Shawn O’Connell ($) |
Exclusion of Stock Awards and Option Awards for Shawn O ’Connell ($) |
Inclusion of Equity Values for Shawn O’Connell ($) |
Compensation Actually Paid to Shawn O’Connell ($) | ||||||||||||||||
2026 |
7,118,612 |
(4,500,000 |
) |
13,137,560 |
15,756,172 |
|||||||||||||||
Year |
Summary Compensation Table Total for David M. Shaffer ($) |
Exclusion of Stock Awards and Option Awards for David M. Shaffer ($) |
Inclusion of Equity Values for David M. Shaffer ($) |
Compensation Actually Paid to David M. Shaffer ($) | ||||||||||||||||
2026 |
14,288,481 |
(13,693,694 |
) |
8,754,559 |
9,349,346 |
|||||||||||||||
Year |
Average Summary Compensation Table Total for Non-PEO NEOs ($) |
Average Exclusion of Stock Awards and Option Awards for Non- PEO NEOs ($) |
Average Inclusion of Equity Values for Non- PEO NEOs ($) |
Average Compensation Actually Paid to Non-PEO NEOs($) | ||||||||||||||||
2026 |
2,894,254 |
(1,625,000 |
) |
5,277,141 |
6,546,395 |
|||||||||||||||
The amounts in the Inclusion of Equity Values in the tables above are derived from the amounts set forth in the following tables:
Year |
Year-End Fair Value of Equity Awards Granted During Year That Remained Unvested as of Last Day of Fiscal Year for Shawn O’ Connell ($) |
Change in Fair Value from Last Day of Prior Fiscal Year to Last Day of Fiscal Year of Unvested Equity Awards for Shawn O’ Connell ($) |
Vesting-Date Fair Value of Equity Awards Granted During Year that Vested During Year for Shawn O’ Connell ($) |
Change in Fair Value from Last Day of Prior Fiscal Year to Vesting Date of Unvested Equity Awards that Vested During Fiscal Year for Shawn O’ Connell ($) |
Fair Value at Last Day of Prior Year of Equity Awards Forfeited During Year for Shawn O’ Connell ($) |
Value of Dividends or Other Earnings Paid on Equity Awards Not Otherwise Included for Shawn O’ Connell ($) |
Total— Inclusion of Equity Values for Shawn O’ Connell ($) | ||||||||||||||||||||||||||||
2026 |
10,189,852 |
2,788,240 |
— |
159,468 |
— |
— |
13,137,560 |
||||||||||||||||||||||||||||
Year |
Year-End Fair Value of Equity Awards Granted During Year That Remained Unvested as of Last Day of Fiscal Year for David M. Shaffer ($) |
Change in Fair Value from Last Day of Prior Fiscal Year to Last Day of Fiscal Year of Unvested Equity Awards for David M. Shaffer ($) |
Vesting-Date Fair Value of Equity Awards Granted During Year that Vested During Year for David M. Shaffer ($) |
Change in Fair Value from Last Day of Prior Fiscal Year to Vesting Date of Unvested Equity Awards that Vested During Fiscal Year for David M. Shaffer ($) |
Fair Value at Last Day of Prior Year of Equity Awards Forfeited During Year for David M. Shaffer ($) |
Value of Dividends or Other Earnings Paid on Equity Awards Not Otherwise Included for David M. Shaffer ($) |
Total— Inclusion of Equity Values for David M. Shaffer ($) | ||||||||||||||||||||||||||||
2026 |
— |
8,648,095 |
— |
106,464 |
— |
— |
8,754,559 |
||||||||||||||||||||||||||||
Year |
Average Year-End Fair Value of Equity Awards Granted During Fiscal Year That Remained Unvested as of Last Day of Fiscal Year for Non- PEO NEOs ($) |
Average Change in Fair Value from Last Day of Prior Fiscal Year to Last Day of Fiscal Year of Unvested Equity Awards for Non-PEO NEOs($) |
Average Change in Fair Value from Last Day of Prior Fiscal Year to Vesting Date of Unvested Equity Awards That Vested During Fiscal Year for Non-PEO NEOs ($) |
Average Fair Value at Last Day of Prior Year of Equity Awards Forfeited During Year for Non-PEO NEOs($) |
Total—Average Inclusion of Equity Values for Non-PEO NEOs($) | ||||||||||||||||||||
2026 |
3,649,152 |
1,404,135 |
223,854 |
— |
5,277,141 |
||||||||||||||||||||
| (4) | The Peer Group TSR set forth in the table below utilizes the Dow Jones US Electrical Components & Equipment Index, which we also utilize in the stock performance graph required by Item 201(e) of Regulation S-K included in our Annual Report for the fiscal year ended March 31, 2026. The comparison assumes $100 was invested for the period starting March 31, 2021, through the end of the listed fiscal year in the Company and in the Dow Jones US Electrical Components & Equipment Index, respectively. Historical stock performance is not necessarily indicative of future stock performance. |
| (5) | We determined Adjusted Operating Earnings to be the most important financial performance measure used to link Company performance to Compensation Actually Paid to our PEOs and Non-PEO NEOs in fiscal year 2026. Adjusted Operating Earnings is a non-GAAP measure that adjusts Operating Earnings for charges that the Company incurs as a result of restructuring activities, impairment of goodwill and indefinite-lived intangibles and other assets, acquisition activities and those charges and credits that are not directly related to operating unit performance. Please see “Fiscal Year 2026 MIP Targets and Payout” on page 36 for a description of the adjustments to operating earnings for fiscal year 2026, please see “Fiscal Year 2025 MIP Targets and Payout” on page 36 of our 2025 proxy statement, “Fiscal Year 2024 MIP Targets and Payout” on page 41 of our 2024 Proxy Statement, “Fiscal Year 2023 MIP Targets and Payout” on page 44 of our 2023 Proxy Statement, and “Fiscal Year 2022 MIP Targets and Payout” on page 33 of our 2022 Proxy Statement for a description of the adjustments to operating earnings for each fiscal year. |
| (1) | Shawn O’Connell started as PEO on May 23, 2025. Prior to May 23, 2025, David M. Shaffer was our PEO each year until May 22, 2025. The individuals comprising the non-PEO NEOs for each fiscal year are listed below. |
2022 |
2023 |
2024 |
2025 |
2026 | ||||
Michael J. Schmidtlein |
Andrea J. Funk | Andrea J. Funk | Andrea J. Funk | Andrea J. Funk | ||||
Shawn O’Connell |
Shawn O’Connell | Shawn O’Connell | Shawn O’Connell | Mark Matthews | ||||
Joern Tinnemeyer |
Joern Tinnemeyer | Joern Tinnemeyer | Joern Tinnemeyer | Chad C. Uplinger | ||||
Andrew M. Zogby |
Andrew M. Zogby | Chad C. Uplinger | Chad C. Uplinger | Keith Fisher | ||||
| Andrew M. Zogby | Keith Fisher | |||||||
S-K
included in our Annual Report for the fiscal year ended March 31, 2026. The comparison assumes $100 was invested for the period starting March 31, 2021, through the end of the listed fiscal year in the Company and in the Dow Jones US Electrical Components & Equipment Index, respectively. Historical stock performance is not necessarily indicative of future stock performance.
| (3) | Compensation Actually Paid reflects the exclusions and inclusions of certain amounts for the PEOs and the non-PEO NEOs as set forth below. Equity values are calculated in accordance with FASB ASC Topic 718. Amounts in the Exclusion of Stock Awards and Option Awards column are the totals from the Stock Awards and Option Awards columns of our 2026 Summary Compensation Table on page 44. |
Year |
Summary Compensation Table Total for Shawn O’Connell ($) |
Exclusion of Stock Awards and Option Awards for Shawn O ’Connell ($) |
Inclusion of Equity Values for Shawn O’Connell ($) |
Compensation Actually Paid to Shawn O’Connell ($) | ||||||||||||||||
2026 |
7,118,612 |
(4,500,000 |
) |
13,137,560 |
15,756,172 |
|||||||||||||||
Year |
Summary Compensation Table Total for David M. Shaffer ($) |
Exclusion of Stock Awards and Option Awards for David M. Shaffer ($) |
Inclusion of Equity Values for David M. Shaffer ($) |
Compensation Actually Paid to David M. Shaffer ($) | ||||||||||||||||
2026 |
14,288,481 |
(13,693,694 |
) |
8,754,559 |
9,349,346 |
|||||||||||||||
The amounts in the Inclusion of Equity Values in the tables above are derived from the amounts set forth in the following tables:
Year |
Year-End Fair Value of Equity Awards Granted During Year That Remained Unvested as of Last Day of Fiscal Year for Shawn O’ Connell ($) |
Change in Fair Value from Last Day of Prior Fiscal Year to Last Day of Fiscal Year of Unvested Equity Awards for Shawn O’ Connell ($) |
Vesting-Date Fair Value of Equity Awards Granted During Year that Vested During Year for Shawn O’ Connell ($) |
Change in Fair Value from Last Day of Prior Fiscal Year to Vesting Date of Unvested Equity Awards that Vested During Fiscal Year for Shawn O’ Connell ($) |
Fair Value at Last Day of Prior Year of Equity Awards Forfeited During Year for Shawn O’ Connell ($) |
Value of Dividends or Other Earnings Paid on Equity Awards Not Otherwise Included for Shawn O’ Connell ($) |
Total— Inclusion of Equity Values for Shawn O’ Connell ($) | ||||||||||||||||||||||||||||
2026 |
10,189,852 |
2,788,240 |
— |
159,468 |
— |
— |
13,137,560 |
||||||||||||||||||||||||||||
Year |
Year-End Fair Value of Equity Awards Granted During Year That Remained Unvested as of Last Day of Fiscal Year for David M. Shaffer ($) |
Change in Fair Value from Last Day of Prior Fiscal Year to Last Day of Fiscal Year of Unvested Equity Awards for David M. Shaffer ($) |
Vesting-Date Fair Value of Equity Awards Granted During Year that Vested During Year for David M. Shaffer ($) |
Change in Fair Value from Last Day of Prior Fiscal Year to Vesting Date of Unvested Equity Awards that Vested During Fiscal Year for David M. Shaffer ($) |
Fair Value at Last Day of Prior Year of Equity Awards Forfeited During Year for David M. Shaffer ($) |
Value of Dividends or Other Earnings Paid on Equity Awards Not Otherwise Included for David M. Shaffer ($) |
Total— Inclusion of Equity Values for David M. Shaffer ($) | ||||||||||||||||||||||||||||
2026 |
— |
8,648,095 |
— |
106,464 |
— |
— |
8,754,559 |
||||||||||||||||||||||||||||
Year |
Average Summary Compensation Table Total for Non-PEO NEOs ($) |
Average Exclusion of Stock Awards and Option Awards for Non- PEO NEOs ($) |
Average Inclusion of Equity Values for Non- PEO NEOs ($) |
Average Compensation Actually Paid to Non-PEO NEOs($) | ||||||||||||||||
2026 |
2,894,254 |
(1,625,000 |
) |
5,277,141 |
6,546,395 |
|||||||||||||||
Year |
Average Year-End Fair Value of Equity Awards Granted During Fiscal Year That Remained Unvested as of Last Day of Fiscal Year for Non- PEO NEOs ($) |
Average Change in Fair Value from Last Day of Prior Fiscal Year to Last Day of Fiscal Year of Unvested Equity Awards for Non-PEO NEOs($) |
Average Change in Fair Value from Last Day of Prior Fiscal Year to Vesting Date of Unvested Equity Awards That Vested During Fiscal Year for Non-PEO NEOs ($) |
Average Fair Value at Last Day of Prior Year of Equity Awards Forfeited During Year for Non-PEO NEOs($) |
Total—Average Inclusion of Equity Values for Non-PEO NEOs($) | ||||||||||||||||||||
2026 |
3,649,152 |
1,404,135 |
223,854 |
— |
5,277,141 |
||||||||||||||||||||
Relationship Between PEOs and
Non-PEO
NEO Compensation Actually Paid, Company Total Shareholder Return (“TSR”) and Peer Group TSR The following chart sets forth the relationship between Compensation Actually Paid to our PEOs, the average of Compensation Actually Paid to our
Non-PEO
NEOs, the cumulative TSR over the five most recently completed fiscal years for the Company, and the Dow Jones US Electrical Components & Equipment Index TSR over the same period. 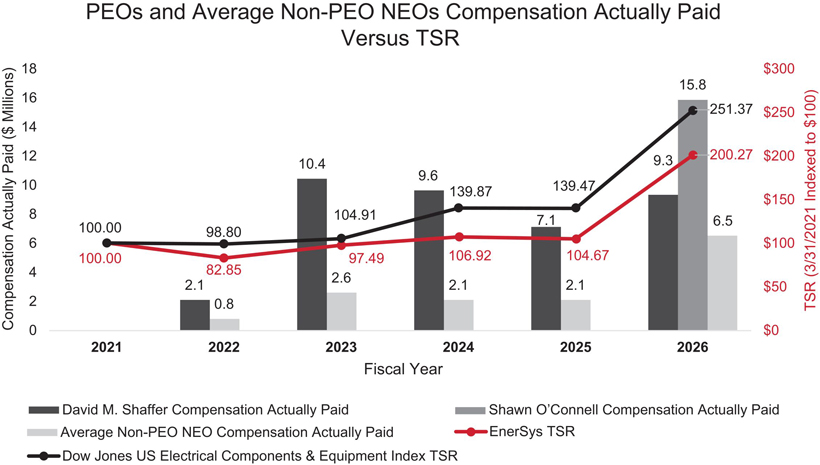
Relationship Between PEOs and
Non-PEO
NEO Compensation Actually Paid and Net Income The following chart sets forth the relationship between Compensation Actually Paid to our PEOs, the average of Compensation Actually Paid to our
Non-PEO
NEOs, and our Net Income during the five most recently completed fiscal years. 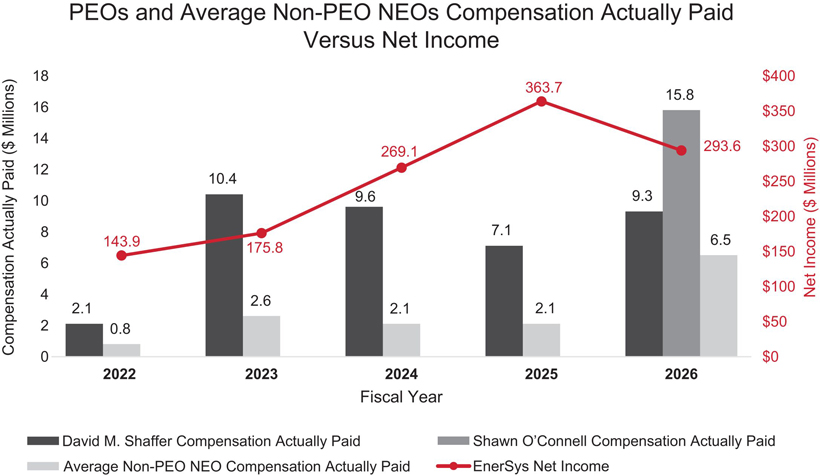
Relationship Between PEOs and
Non-PEO
NEO Compensation Actually Paid and Adjusted Operating Earnings The following chart sets forth the relationship between Compensation Actually Paid to our PEOs, the average of Compensation Actually Paid to our
Non-PEO
NEOs, and our Adjusted Operating Earnings during the five most recently completed fiscal years. 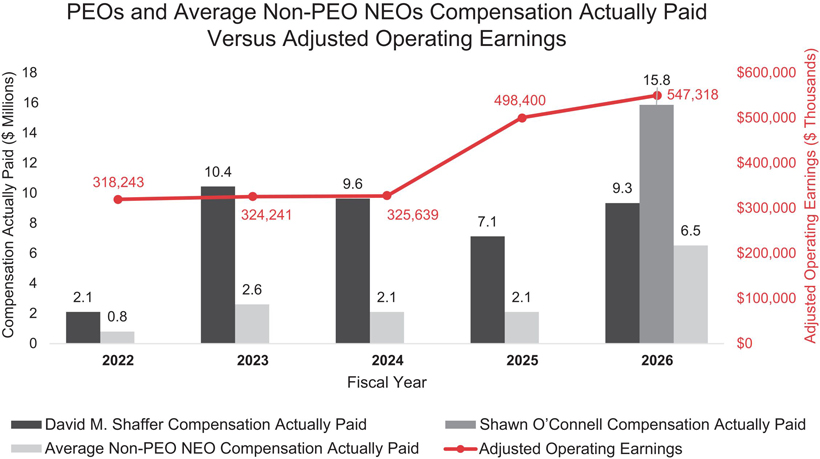
Relationship Between PEOs and
Non-PEO
NEO Compensation Actually Paid, Company Total Shareholder Return (“TSR”) and Peer Group TSR The following chart sets forth the relationship between Compensation Actually Paid to our PEOs, the average of Compensation Actually Paid to our
Non-PEO
NEOs, the cumulative TSR over the five most recently completed fiscal years for the Company, and the Dow Jones US Electrical Components & Equipment Index TSR over the same period. Tabular List of Most Important Financial Performance Measures
The following table presents the financial performance measures that the Company considers to have been the most important in linking Compensation Actually Paid to our PEOs and
Non-PEO
NEOs for 2026 to Company performance. The measures in this table are not ranked. Most Important Performance Measures |
Adjusted Operating Earnings | |
| Primary Operating Capital |
Non-PEO
NEOs in fiscal year 2026. Adjusted Operating Earnings is a non-GAAP
measure that adjusts Operating Earnings for charges that the Company incurs as a result of restructuring activities, impairment of goodwill and indefinite-lived intangibles and other assets, acquisition activities and those charges and credits that are not directly related to operating unit performance. Please see “Fiscal Year 2026 MIP Targets and Payout” on page 36 for a description of the adjustments to operating earnings for fiscal year 2026, please see “Fiscal Year 2025 MIP Targets and Payout” on page 36 of our 2025 proxy statement, “Fiscal Year 2024 MIP Targets and Payout” on page 41 of our 2024 Proxy Statement, “Fiscal Year 2023 MIP Targets and Payout” on page 44 of our 2023 Proxy Statement, and “Fiscal Year 2022 MIP Targets and Payout” on page 33 of our 2022 Proxy Statement for a description of the adjustments to operating earnings for each fiscal year.