Shareholder Report
|
6 Months Ended |
|
Apr. 30, 2026
USD ($)
Holding
|
|---|
| Shareholder Report [Line Items] |
|
|
| Document Type |
N-CSRS
|
|
| Amendment Flag |
false
|
|
| Registrant Name |
CRM Mutual Fund Trust
|
|
| Entity Central Index Key |
0001322252
|
|
| Entity Investment Company Type |
N-1A
|
|
| Document Period End Date |
Apr. 30, 2026
|
|
| Shareholder Report Annual or Semi-Annual |
Semi-Annual Shareholder Report
|
|
| C000037909 |
|
|
| Shareholder Report [Line Items] |
|
|
| Class Name |
Institutional Class
|
|
| Trading Symbol |
CRIEX
|
|
| Annual or Semi-Annual Statement [Text Block] |
This semi-annual shareholder report contains important information about CRM All Cap Value Fund for the period of November 1, 2025 to April 30, 2026.
|
|
| Additional Information [Text Block] |
You can find additional information about the Fund at http://www.crmfunds.com/funds-overview/shareholder-resources/documents/. You can also request this information by contacting us at 800-CRM-2883.
|
|
| Additional Information Phone Number |
800-CRM-2883
|
|
| Additional Information Website |
http://www.crmfunds.com/funds-overview/shareholder-resources/documents/
|
|
| Expenses [Text Block] |
What were the Fund’s costs for the last six months?(based on a hypothetical $10,000 investment) Table SummaryClass Name | Costs of a $10,000 investment | Costs paid as a percentage of a $10,000 investment |
|---|
Institutional | $65 | 1.20%Footnote Reference* |
|---|
| Footnote | Description | Footnote* | Annualized |
|
|
| Expenses Paid, Amount |
$ 65
|
|
| Expense Ratio, Percent |
1.20%
|
[1] |
| AssetsNet |
$ 19,629,680
|
|
| Holdings Count | Holding |
49
|
|
| Advisory Fees Paid, Amount |
$ 59,949
|
|
| InvestmentCompanyPortfolioTurnover |
42.00%
|
|
| Additional Fund Statistics [Text Block] |
Table SummaryNet Assets | $19,629,680 |
|---|
Number of Portfolio Holdings | 49 |
|---|
Advisory Fee (net of waivers) | $59,949 |
|---|
Portfolio Turnover | 42% |
|---|
|
|
| Holdings [Text Block] |
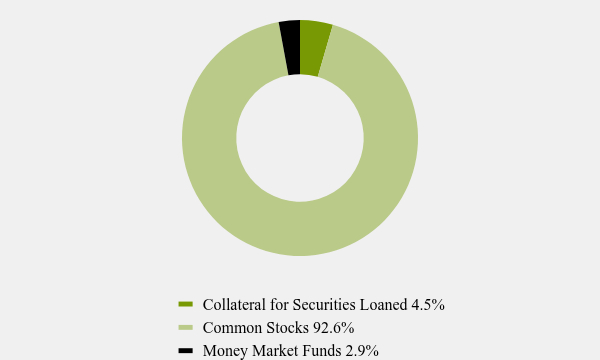
Asset Weighting (% of total investments)Table SummaryValue | Value |
|---|
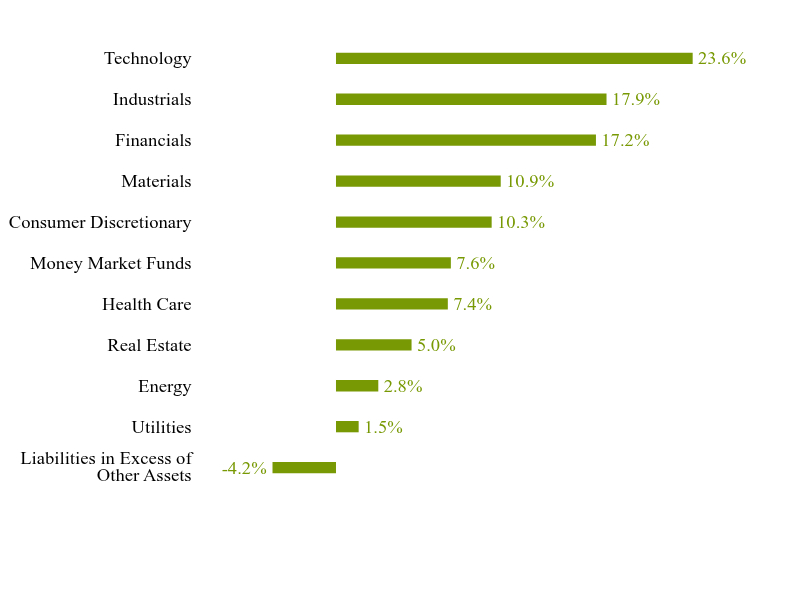
Collateral for Securities Loaned | 4.5% | Common Stocks | 92.6% | Money Market Funds | 2.9% | What did the Fund invest in? Sector Weighting (% of net assets)Table SummaryValue | Value |
|---|
Liabilities in Excess of Other Assets | -4.2% | Utilities | 1.5% | Energy | 2.8% | Real Estate | 5.0% | Health Care | 7.4% | Money Market Funds | 7.6% | Consumer Discretionary | 10.3% | Materials | 10.9% | Financials | 17.2% | Industrials | 17.9% | Technology | 23.6% | |
|
| Largest Holdings [Text Block] |
Top 10 Holdings (% of net assets)Table SummaryHolding Name | % of Net Assets |
|---|
Invesco Government & Agency Portfolio, Institutional Shares | 4.6% |
|---|
Regal Rexnord Corporation | 4.1% |
|---|
Microchip Technology, Inc. | 3.4% |
|---|
Champion Homes, Inc. | 3.4% |
|---|
Broadcom, Inc. | 3.4% |
|---|
Qnity Electronics, Inc. | 3.2% |
|---|
Global Payments, Inc. | 3.1% |
|---|
Woodward, Inc. | 2.9% |
|---|
WillScot Holdings Corporation | 2.7% |
|---|
Concentra Group Holdings Parent, Inc. | 2.7% |
|---|
|
|
| Material Fund Change [Text Block] |
No material changes occurred during the period ended April 30, 2026. |
|
| C000037908 |
|
|
| Shareholder Report [Line Items] |
|
|
| Class Name |
Investor Class
|
|
| Trading Symbol |
CRMEX
|
|
| Annual or Semi-Annual Statement [Text Block] |
This semi-annual shareholder report contains important information about CRM All Cap Value Fund for the period of November 1, 2025 to April 30, 2026.
|
|
| Additional Information [Text Block] |
You can find additional information about the Fund at http://www.crmfunds.com/funds-overview/shareholder-resources/documents/. You can also request this information by contacting us at 800-CRM-2883.
|
|
| Additional Information Phone Number |
800-CRM-2883
|
|
| Additional Information Website |
http://www.crmfunds.com/funds-overview/shareholder-resources/documents/
|
|
| Expenses [Text Block] |
What were the Fund’s costs for the last six months?(based on a hypothetical $10,000 investment) Table SummaryClass Name | Costs of a $10,000 investment | Costs paid as a percentage of a $10,000 investment |
|---|
Investor | $78 | 1.45%Footnote Reference* |
|---|
| Footnote | Description | Footnote* | Annualized |
|
|
| Expenses Paid, Amount |
$ 78
|
|
| Expense Ratio, Percent |
1.45%
|
[2] |
| AssetsNet |
$ 19,629,680
|
|
| Holdings Count | Holding |
49
|
|
| Advisory Fees Paid, Amount |
$ 59,949
|
|
| InvestmentCompanyPortfolioTurnover |
42.00%
|
|
| Additional Fund Statistics [Text Block] |
Table SummaryNet Assets | $19,629,680 |
|---|
Number of Portfolio Holdings | 49 |
|---|
Advisory Fee (net of waivers) | $59,949 |
|---|
Portfolio Turnover | 42% |
|---|
|
|
| Holdings [Text Block] |
Asset Weighting (% of total investments)Table SummaryValue | Value |
|---|
Collateral for Securities Loaned | 4.5% | Common Stocks | 92.6% | Money Market Funds | 2.9% | What did the Fund invest in? Sector Weighting (% of net assets)Table SummaryValue | Value |
|---|
Liabilities in Excess of Other Assets | -4.2% | Utilities | 1.5% | Energy | 2.8% | Real Estate | 5.0% | Health Care | 7.4% | Money Market Funds | 7.6% | Consumer Discretionary | 10.3% | Materials | 10.9% | Financials | 17.2% | Industrials | 17.9% | Technology | 23.6% | |
|
| Largest Holdings [Text Block] |
Top 10 Holdings (% of net assets)Table SummaryHolding Name | % of Net Assets |
|---|
Invesco Government & Agency Portfolio, Institutional Shares | 4.6% |
|---|
Regal Rexnord Corporation | 4.1% |
|---|
Microchip Technology, Inc. | 3.4% |
|---|
Champion Homes, Inc. | 3.4% |
|---|
Broadcom, Inc. | 3.4% |
|---|
Qnity Electronics, Inc. | 3.2% |
|---|
Global Payments, Inc. | 3.1% |
|---|
Woodward, Inc. | 2.9% |
|---|
WillScot Holdings Corporation | 2.7% |
|---|
Concentra Group Holdings Parent, Inc. | 2.7% |
|---|
|
|
| Material Fund Change [Text Block] |
No material changes occurred during the period ended April 30, 2026. |
|
| C000171454 |
|
|
| Shareholder Report [Line Items] |
|
|
| Class Name |
Institutional Class
|
|
| Trading Symbol |
CRIHX
|
|
| Annual or Semi-Annual Statement [Text Block] |
This semi-annual shareholder report contains important information about CRM Long/Short Opportunities Fund for the period of November 1, 2025 to April 30, 2026.
|
|
| Additional Information [Text Block] |
You can find additional information about the Fund at http://www.crmfunds.com/funds-overview/shareholder-resources/documents/. You can also request this information by contacting us at 800-CRM-2883.
|
|
| Additional Information Phone Number |
800-CRM-2883
|
|
| Additional Information Website |
http://www.crmfunds.com/funds-overview/shareholder-resources/documents/
|
|
| Expenses [Text Block] |
What were the Fund’s costs for the last six months?(based on a hypothetical $10,000 investment) Table SummaryClass Name | Costs of a $10,000 investment | Costs paid as a percentage of a $10,000 investment |
|---|
Institutional | $98 | 1.91%Footnote Reference* |
|---|
| Footnote | Description | Footnote* | Annualized |
|
|
| Expenses Paid, Amount |
$ 98
|
|
| Expense Ratio, Percent |
1.91%
|
[3] |
| AssetsNet |
$ 455,821,940
|
|
| Holdings Count | Holding |
91
|
|
| Advisory Fees Paid, Amount |
$ 2,689,887
|
|
| InvestmentCompanyPortfolioTurnover |
134.00%
|
|
| Additional Fund Statistics [Text Block] |
Table SummaryNet Assets | $455,821,940 |
|---|
Number of Portfolio Holdings | 91 |
|---|
Advisory Fee (net of waivers) | $2,689,887 |
|---|
Portfolio Turnover | 134% |
|---|
|
|
| Holdings [Text Block] |
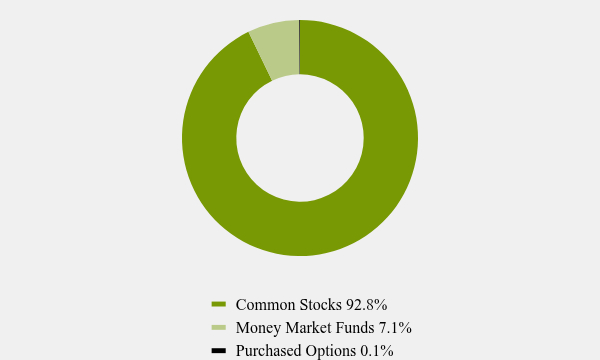
Asset Weighting (% of total investments)Table SummaryValue | Value |
|---|
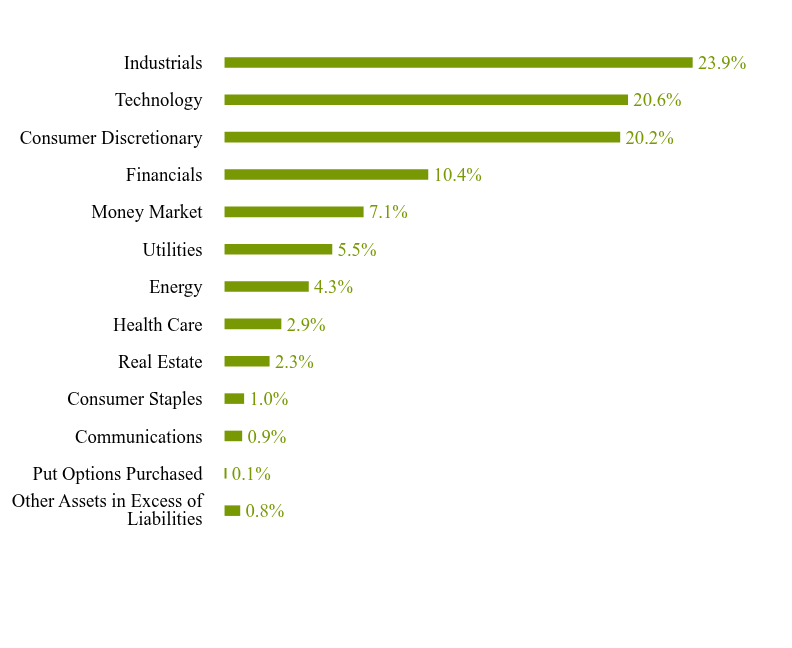
Common Stocks | 92.8% | Money Market Funds | 7.1% | Purchased Options | 0.1% | What did the Fund invest in? Sector Weighting (% of net assets)Table SummaryValue | Value |
|---|
Other Assets in Excess of Liabilities | 0.8% | Put Options Purchased | 0.1% | Communications | 0.9% | Consumer Staples | 1.0% | Real Estate | 2.3% | Health Care | 2.9% | Energy | 4.3% | Utilities | 5.5% | Money Market | 7.1% | Financials | 10.4% | Consumer Discretionary | 20.2% | Technology | 20.6% | Industrials | 23.9% | |
|
| Largest Holdings [Text Block] |
Top 10 Holdings (% of net assets)Table SummaryHolding Name | % of Net Assets |
|---|
Semtech Corporation | 4.8% |
|---|
BankUnited, Inc. | 4.6% |
|---|
Regal Rexnord Corporation | 4.3% |
|---|
Hub Group, Inc., Class A | 4.0% |
|---|
Champion Homes, Inc. | 3.9% |
|---|
Canadian Pacific Kansas City Ltd. | 3.6% |
|---|
Federated Hermes Treasury Obligations Fund, Institutional Shares | 3.5% |
|---|
Blackrock Liquidity Funds T-Fund, Institutional Shares | 3.5% |
|---|
WillScot Holdings Corporation | 3.4% |
|---|
Knowles Corporation | 3.3% |
|---|
|
|
| Material Fund Change [Text Block] |
No material changes occurred during the period ended April 30, 2026. |
|
| C000003538 |
|
|
| Shareholder Report [Line Items] |
|
|
| Class Name |
Institutional Class
|
|
| Trading Symbol |
CRIMX
|
|
| Annual or Semi-Annual Statement [Text Block] |
This semi-annual shareholder report contains important information about CRM Mid Cap Value Fund for the period of November 1, 2025 to April 30, 2026.
|
|
| Additional Information [Text Block] |
You can find additional information about the Fund at http://www.crmfunds.com/funds-overview/shareholder-resources/documents/. You can also request this information by contacting us at 800-CRM-2883.
|
|
| Additional Information Phone Number |
800-CRM-2883
|
|
| Additional Information Website |
http://www.crmfunds.com/funds-overview/shareholder-resources/documents/
|
|
| Expenses [Text Block] |
What were the Fund’s costs for the last six months?(based on a hypothetical $10,000 investment) Table SummaryClass Name | Costs of a $10,000 investment | Costs paid as a percentage of a $10,000 investment |
|---|
Institutional | $54 | 1.01%Footnote Reference* |
|---|
| Footnote | Description | Footnote* | Annualized |
|
|
| Expenses Paid, Amount |
$ 54
|
|
| Expense Ratio, Percent |
1.01%
|
[4] |
| AssetsNet |
$ 264,409,524
|
|
| Holdings Count | Holding |
51
|
|
| Advisory Fees Paid, Amount |
$ 978,652
|
|
| InvestmentCompanyPortfolioTurnover |
29.00%
|
|
| Additional Fund Statistics [Text Block] |
Table SummaryNet Assets | $264,409,524 |
|---|
Number of Portfolio Holdings | 51 |
|---|
Advisory Fee | $978,652 |
|---|
Portfolio Turnover | 29% |
|---|
|
|
| Holdings [Text Block] |
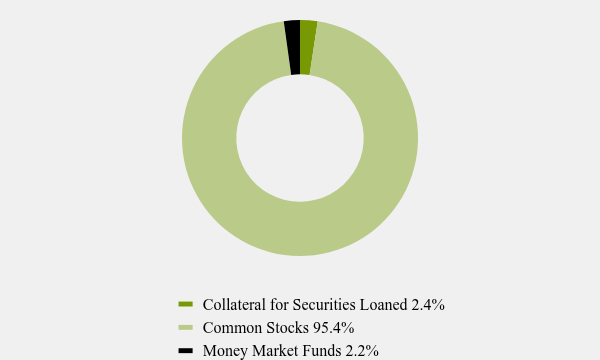
Asset Weighting (% of total investments)Table SummaryValue | Value |
|---|
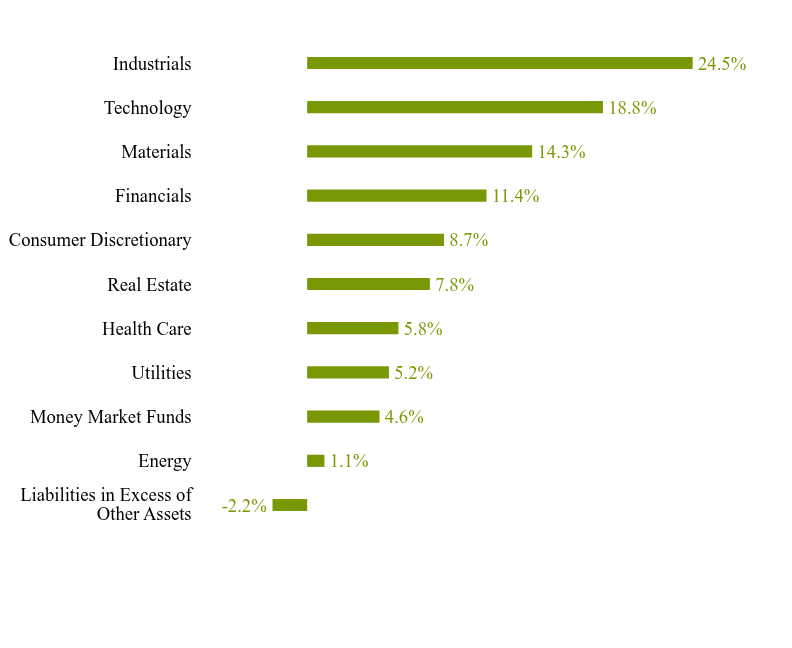
Collateral for Securities Loaned | 2.4% | Common Stocks | 95.4% | Money Market Funds | 2.2% | What did the Fund invest in? Sector Weighting (% of net assets)Table SummaryValue | Value |
|---|
Liabilities in Excess of Other Assets | -2.2% | Energy | 1.1% | Money Market Funds | 4.6% | Utilities | 5.2% | Health Care | 5.8% | Real Estate | 7.8% | Consumer Discretionary | 8.7% | Financials | 11.4% | Materials | 14.3% | Technology | 18.8% | Industrials | 24.5% | |
|
| Largest Holdings [Text Block] |
Top 10 Holdings (% of net assets)Table SummaryHolding Name | % of Net Assets |
|---|
Regal Rexnord Corporation | 3.8% |
|---|
Teledyne Technologies, Inc. | 3.4% |
|---|
Champion Homes, Inc. | 3.3% |
|---|
Microchip Technology, Inc. | 3.3% |
|---|
Atmos Energy Corporation | 3.1% |
|---|
Woodward, Inc. | 3.1% |
|---|
AMETEK, Inc. | 2.9% |
|---|
Vontier Corporation | 2.9% |
|---|
BankUnited, Inc. | 2.7% |
|---|
Ashland, Inc. | 2.7% |
|---|
|
|
| Material Fund Change [Text Block] |
No material changes occurred during the period ended April 30, 2026. |
|
| C000003539 |
|
|
| Shareholder Report [Line Items] |
|
|
| Class Name |
Investor Class
|
|
| Trading Symbol |
CRMMX
|
|
| Annual or Semi-Annual Statement [Text Block] |
This semi-annual shareholder report contains important information about CRM Mid Cap Value Fund for the period of November 1, 2025 to April 30, 2026.
|
|
| Additional Information [Text Block] |
You can find additional information about the Fund at http://www.crmfunds.com/funds-overview/shareholder-resources/documents/. You can also request this information by contacting us at 800-CRM-2883.
|
|
| Additional Information Phone Number |
800-CRM-2883
|
|
| Additional Information Website |
http://www.crmfunds.com/funds-overview/shareholder-resources/documents/
|
|
| Expenses [Text Block] |
What were the Fund’s costs for the last six months?(based on a hypothetical $10,000 investment) Table SummaryClass Name | Costs of a $10,000 investment | Costs paid as a percentage of a $10,000 investment |
|---|
Investor | $63 | 1.18%Footnote Reference* |
|---|
| Footnote | Description | Footnote* | Annualized |
|
|
| Expenses Paid, Amount |
$ 63
|
|
| Expense Ratio, Percent |
1.18%
|
[5] |
| AssetsNet |
$ 264,409,524
|
|
| Holdings Count | Holding |
51
|
|
| Advisory Fees Paid, Amount |
$ 978,652
|
|
| InvestmentCompanyPortfolioTurnover |
29.00%
|
|
| Additional Fund Statistics [Text Block] |
Table SummaryNet Assets | $264,409,524 |
|---|
Number of Portfolio Holdings | 51 |
|---|
Advisory Fee | $978,652 |
|---|
Portfolio Turnover | 29% |
|---|
|
|
| Holdings [Text Block] |
Asset Weighting (% of total investments)Table SummaryValue | Value |
|---|
Collateral for Securities Loaned | 2.4% | Common Stocks | 95.4% | Money Market Funds | 2.2% | What did the Fund invest in? Sector Weighting (% of net assets)Table SummaryValue | Value |
|---|
Liabilities in Excess of Other Assets | -2.2% | Energy | 1.1% | Money Market Funds | 4.6% | Utilities | 5.2% | Health Care | 5.8% | Real Estate | 7.8% | Consumer Discretionary | 8.7% | Financials | 11.4% | Materials | 14.3% | Technology | 18.8% | Industrials | 24.5% | |
|
| Largest Holdings [Text Block] |
Top 10 Holdings (% of net assets)Table SummaryHolding Name | % of Net Assets |
|---|
Regal Rexnord Corporation | 3.8% |
|---|
Teledyne Technologies, Inc. | 3.4% |
|---|
Champion Homes, Inc. | 3.3% |
|---|
Microchip Technology, Inc. | 3.3% |
|---|
Atmos Energy Corporation | 3.1% |
|---|
Woodward, Inc. | 3.1% |
|---|
AMETEK, Inc. | 2.9% |
|---|
Vontier Corporation | 2.9% |
|---|
BankUnited, Inc. | 2.7% |
|---|
Ashland, Inc. | 2.7% |
|---|
|
|
| Material Fund Change [Text Block] |
No material changes occurred during the period ended April 30, 2026. |
|
| C000003540 |
|
|
| Shareholder Report [Line Items] |
|
|
| Class Name |
Institutional Class
|
|
| Trading Symbol |
CRISX
|
|
| Annual or Semi-Annual Statement [Text Block] |
This semi-annual shareholder report contains important information about CRM Small Cap Value Fund for the period of November 1, 2025 to April 30, 2026.
|
|
| Additional Information [Text Block] |
You can find additional information about the Fund at http://www.crmfunds.com/funds-overview/shareholder-resources/documents/. You can also request this information by contacting us at 800-CRM-2883.
|
|
| Additional Information Phone Number |
800-CRM-2883
|
|
| Additional Information Website |
http://www.crmfunds.com/funds-overview/shareholder-resources/documents/
|
|
| Expenses [Text Block] |
What were the Fund’s costs for the last six months?(based on a hypothetical $10,000 investment) Table SummaryClass Name | Costs of a $10,000 investment | Costs paid as a percentage of a $10,000 investment |
|---|
Institutional | $54 | 1.02%Footnote Reference* |
|---|
| Footnote | Description | Footnote* | Annualized |
|
|
| Expenses Paid, Amount |
$ 54
|
|
| Expense Ratio, Percent |
1.02%
|
[6] |
| AssetsNet |
$ 70,847,339
|
|
| Holdings Count | Holding |
46
|
|
| Advisory Fees Paid, Amount |
$ 252,470
|
|
| InvestmentCompanyPortfolioTurnover |
51.00%
|
|
| Additional Fund Statistics [Text Block] |
Table SummaryNet Assets | $70,847,339 |
|---|
Number of Portfolio Holdings | 46 |
|---|
Advisory Fee | $252,470 |
|---|
Portfolio Turnover | 51% |
|---|
|
|
| Holdings [Text Block] |
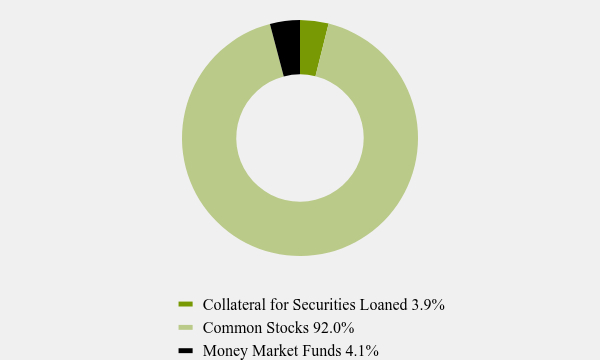
Asset Weighting (% of total investments)Table SummaryValue | Value |
|---|
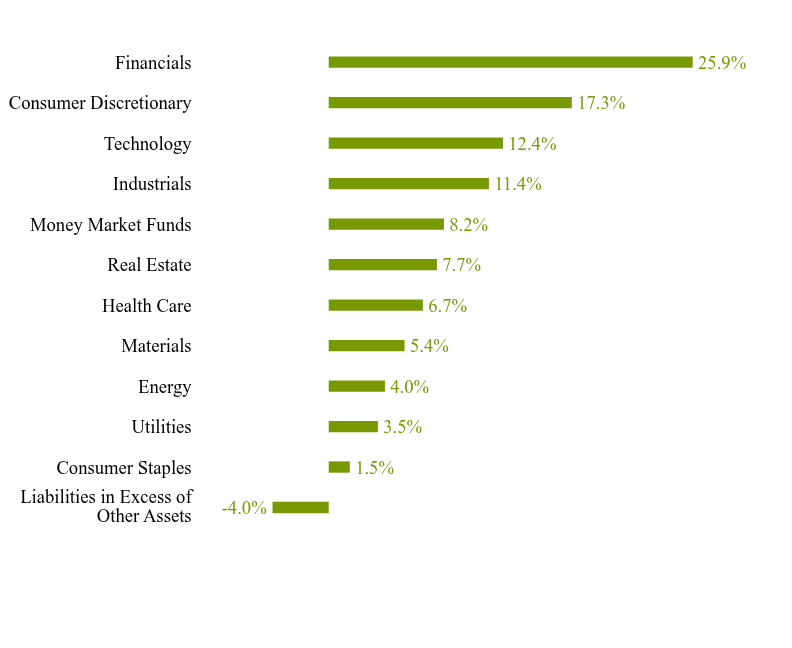
Collateral for Securities Loaned | 3.9% | Common Stocks | 92.0% | Money Market Funds | 4.1% | What did the Fund invest in? Sector Weighting (% of net assets)Table SummaryValue | Value |
|---|
Liabilities in Excess of Other Assets | -4.0% | Consumer Staples | 1.5% | Utilities | 3.5% | Energy | 4.0% | Materials | 5.4% | Health Care | 6.7% | Real Estate | 7.7% | Money Market Funds | 8.2% | Industrials | 11.4% | Technology | 12.4% | Consumer Discretionary | 17.3% | Financials | 25.9% | |
|
| Largest Holdings [Text Block] |
Top 10 Holdings (% of net assets)Table SummaryHolding Name | % of Net Assets |
|---|
Invesco Government & Agency Portfolio, Institutional Shares | 4.1% |
|---|
Capitol Federal Financial, Inc. | 4.0% |
|---|
BankUnited, Inc. | 3.8% |
|---|
Champion Homes, Inc. | 3.5% |
|---|
Knowles Corporation | 3.4% |
|---|
Xenia Hotels & Resorts, Inc. | 3.2% |
|---|
LendingClub Corporation | 3.2% |
|---|
Moelis & Company, Class A | 3.0% |
|---|
BJ's Restaurants, Inc. | 2.9% |
|---|
Steven Madden Ltd. | 2.9% |
|---|
|
|
| Material Fund Change [Text Block] |
No material changes occurred during the period ended April 30, 2026. |
|
| C000003541 |
|
|
| Shareholder Report [Line Items] |
|
|
| Class Name |
Investor Class
|
|
| Trading Symbol |
CRMSX
|
|
| Annual or Semi-Annual Statement [Text Block] |
This semi-annual shareholder report contains important information about CRM Small Cap Value Fund for the period of November 1, 2025 to April 30, 2026.
|
|
| Additional Information [Text Block] |
You can find additional information about the Fund at http://www.crmfunds.com/funds-overview/shareholder-resources/documents/. You can also request this information by contacting us at 800-CRM-2883.
|
|
| Additional Information Phone Number |
800-CRM-2883
|
|
| Additional Information Website |
http://www.crmfunds.com/funds-overview/shareholder-resources/documents/
|
|
| Expenses [Text Block] |
What were the Fund’s costs for the last six months?(based on a hypothetical $10,000 investment) Table SummaryClass Name | Costs of a $10,000 investment | Costs paid as a percentage of a $10,000 investment |
|---|
Investor | $66 | 1.23%Footnote Reference* |
|---|
| Footnote | Description | Footnote* | Annualized |
|
|
| Expenses Paid, Amount |
$ 66
|
|
| Expense Ratio, Percent |
1.23%
|
[7] |
| AssetsNet |
$ 70,847,339
|
|
| Holdings Count | Holding |
46
|
|
| Advisory Fees Paid, Amount |
$ 252,470
|
|
| InvestmentCompanyPortfolioTurnover |
51.00%
|
|
| Additional Fund Statistics [Text Block] |
Table SummaryNet Assets | $70,847,339 |
|---|
Number of Portfolio Holdings | 46 |
|---|
Advisory Fee | $252,470 |
|---|
Portfolio Turnover | 51% |
|---|
|
|
| Holdings [Text Block] |
Asset Weighting (% of total investments)Table SummaryValue | Value |
|---|
Collateral for Securities Loaned | 3.9% | Common Stocks | 92.0% | Money Market Funds | 4.1% | What did the Fund invest in? Sector Weighting (% of net assets)Table SummaryValue | Value |
|---|
Liabilities in Excess of Other Assets | -4.0% | Consumer Staples | 1.5% | Utilities | 3.5% | Energy | 4.0% | Materials | 5.4% | Health Care | 6.7% | Real Estate | 7.7% | Money Market Funds | 8.2% | Industrials | 11.4% | Technology | 12.4% | Consumer Discretionary | 17.3% | Financials | 25.9% | |
|
| Largest Holdings [Text Block] |
Top 10 Holdings (% of net assets)Table SummaryHolding Name | % of Net Assets |
|---|
Invesco Government & Agency Portfolio, Institutional Shares | 4.1% |
|---|
Capitol Federal Financial, Inc. | 4.0% |
|---|
BankUnited, Inc. | 3.8% |
|---|
Champion Homes, Inc. | 3.5% |
|---|
Knowles Corporation | 3.4% |
|---|
Xenia Hotels & Resorts, Inc. | 3.2% |
|---|
LendingClub Corporation | 3.2% |
|---|
Moelis & Company, Class A | 3.0% |
|---|
BJ's Restaurants, Inc. | 2.9% |
|---|
Steven Madden Ltd. | 2.9% |
|---|
|
|
| Material Fund Change [Text Block] |
No material changes occurred during the period ended April 30, 2026. |
|
| C000003543 |
|
|
| Shareholder Report [Line Items] |
|
|
| Class Name |
Institutional Class
|
|
| Trading Symbol |
CRIAX
|
|
| Annual or Semi-Annual Statement [Text Block] |
This semi-annual shareholder report contains important information about CRM Small/Mid Cap Value Fund for the period of November 1, 2025 to April 30, 2026.
|
|
| Additional Information [Text Block] |
You can find additional information about the Fund at http://www.crmfunds.com/funds-overview/shareholder-resources/documents/. You can also request this information by contacting us at 800-CRM-2883.
|
|
| Additional Information Phone Number |
800-CRM-2883
|
|
| Additional Information Website |
http://www.crmfunds.com/funds-overview/shareholder-resources/documents/
|
|
| Expenses [Text Block] |
What were the Fund’s costs for the last six months?(based on a hypothetical $10,000 investment) Table SummaryClass Name | Costs of a $10,000 investment | Costs paid as a percentage of a $10,000 investment |
|---|
Institutional | $55 | 1.02%Footnote Reference* |
|---|
| Footnote | Description | Footnote* | Annualized |
|
|
| Expenses Paid, Amount |
$ 55
|
|
| Expense Ratio, Percent |
1.02%
|
[8] |
| AssetsNet |
$ 156,378,298
|
|
| Holdings Count | Holding |
45
|
|
| Advisory Fees Paid, Amount |
$ 522,783
|
|
| InvestmentCompanyPortfolioTurnover |
61.00%
|
|
| Additional Fund Statistics [Text Block] |
Table SummaryNet Assets | $156,378,298 |
|---|
Number of Portfolio Holdings | 45 |
|---|
Advisory Fee | $522,783 |
|---|
Portfolio Turnover | 61% |
|---|
|
|
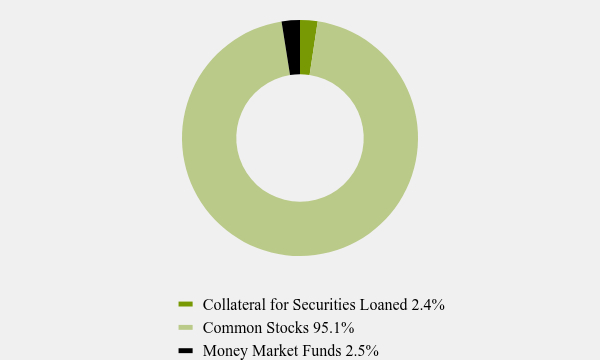
| Holdings [Text Block] |
Asset Weighting (% of total investments)Table SummaryValue | Value |
|---|
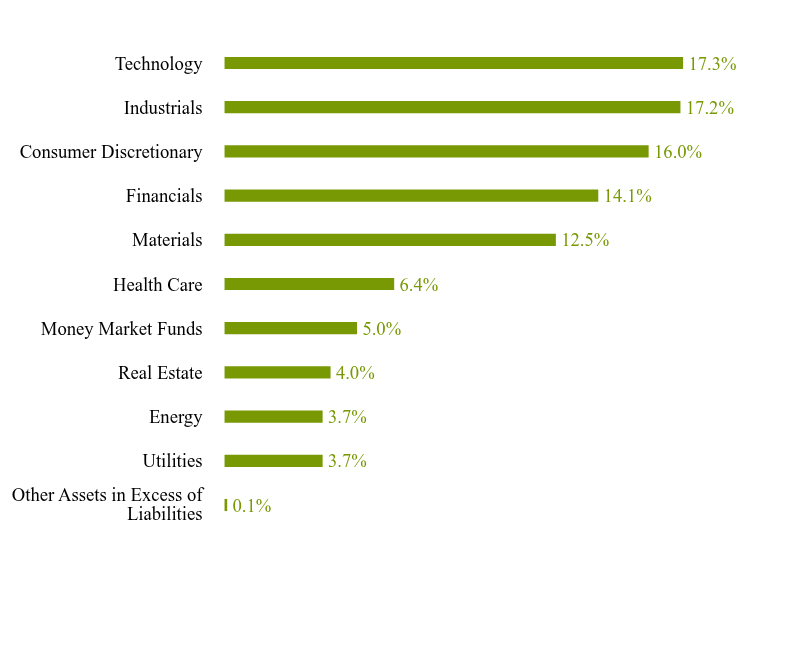
Collateral for Securities Loaned | 2.4% | Common Stocks | 95.1% | Money Market Funds | 2.5% | What did the Fund invest in? Sector Weighting (% of net assets)Table SummaryValue | Value |
|---|
Other Assets in Excess of Liabilities | 0.1% | Utilities | 3.7% | Energy | 3.7% | Real Estate | 4.0% | Money Market Funds | 5.0% | Health Care | 6.4% | Materials | 12.5% | Financials | 14.1% | Consumer Discretionary | 16.0% | Industrials | 17.2% | Technology | 17.3% | |
|
| Largest Holdings [Text Block] |
Top 10 Holdings (% of net assets)Table SummaryHolding Name | % of Net Assets |
|---|
Regal Rexnord Corporation | 4.2% |
|---|
BankUnited, Inc. | 4.1% |
|---|
Hub Group, Inc., Class A | 4.1% |
|---|
Semtech Corporation | 3.8% |
|---|
MKS, Inc. | 3.6% |
|---|
Champion Homes, Inc. | 3.5% |
|---|
Knowles Corporation | 3.3% |
|---|
Teledyne Technologies, Inc. | 3.0% |
|---|
First Interstate BancSystem, Inc., Class A | 2.9% |
|---|
HB Fuller Company | 2.9% |
|---|
|
|
| Material Fund Change [Text Block] |
No material changes occurred during the period ended April 30, 2026. |
|
| C000003544 |
|
|
| Shareholder Report [Line Items] |
|
|
| Class Name |
Investor Class
|
|
| Trading Symbol |
CRMAX
|
|
| Annual or Semi-Annual Statement [Text Block] |
This semi-annual shareholder report contains important information about CRM Small/Mid Cap Value Fund for the period of November 1, 2025 to April 30, 2026.
|
|
| Additional Information [Text Block] |
You can find additional information about the Fund at http://www.crmfunds.com/funds-overview/shareholder-resources/documents/. You can also request this information by contacting us at 800-CRM-2883.
|
|
| Additional Information Phone Number |
800-CRM-2883
|
|
| Additional Information Website |
http://www.crmfunds.com/funds-overview/shareholder-resources/documents/
|
|
| Expenses [Text Block] |
What were the Fund’s costs for the last six months?(based on a hypothetical $10,000 investment) Table SummaryClass Name | Costs of a $10,000 investment | Costs paid as a percentage of a $10,000 investment |
|---|
Investor | $64 | 1.20%Footnote Reference* |
|---|
| Footnote | Description | Footnote* | Annualized |
|
|
| Expenses Paid, Amount |
$ 64
|
|
| Expense Ratio, Percent |
1.20%
|
[9] |
| AssetsNet |
$ 156,378,298
|
|
| Holdings Count | Holding |
45
|
|
| Advisory Fees Paid, Amount |
$ 522,783
|
|
| InvestmentCompanyPortfolioTurnover |
61.00%
|
|
| Additional Fund Statistics [Text Block] |
Table SummaryNet Assets | $156,378,298 |
|---|
Number of Portfolio Holdings | 45 |
|---|
Advisory Fee | $522,783 |
|---|
Portfolio Turnover | 61% |
|---|
|
|
| Holdings [Text Block] |
Asset Weighting (% of total investments)Table SummaryValue | Value |
|---|
Collateral for Securities Loaned | 2.4% | Common Stocks | 95.1% | Money Market Funds | 2.5% | What did the Fund invest in? Sector Weighting (% of net assets)Table SummaryValue | Value |
|---|
Other Assets in Excess of Liabilities | 0.1% | Utilities | 3.7% | Energy | 3.7% | Real Estate | 4.0% | Money Market Funds | 5.0% | Health Care | 6.4% | Materials | 12.5% | Financials | 14.1% | Consumer Discretionary | 16.0% | Industrials | 17.2% | Technology | 17.3% | |
|
| Largest Holdings [Text Block] |
Top 10 Holdings (% of net assets)Table SummaryHolding Name | % of Net Assets |
|---|
Regal Rexnord Corporation | 4.2% |
|---|
BankUnited, Inc. | 4.1% |
|---|
Hub Group, Inc., Class A | 4.1% |
|---|
Semtech Corporation | 3.8% |
|---|
MKS, Inc. | 3.6% |
|---|
Champion Homes, Inc. | 3.5% |
|---|
Knowles Corporation | 3.3% |
|---|
Teledyne Technologies, Inc. | 3.0% |
|---|
First Interstate BancSystem, Inc., Class A | 2.9% |
|---|
HB Fuller Company | 2.9% |
|---|
|
|
| Material Fund Change [Text Block] |
No material changes occurred during the period ended April 30, 2026. |
|
|
|