Shareholder Report
|
6 Months Ended |
|
Apr. 30, 2026
USD ($)
Holding
|
|---|
| Shareholder Report [Line Items] |
|
|
| Document Type |
N-CSRS
|
|
| Amendment Flag |
false
|
|
| Registrant Name |
Two Roads Shared Trust
|
|
| Entity Central Index Key |
0001552947
|
|
| Entity Investment Company Type |
N-1A
|
|
| Document Period End Date |
Apr. 30, 2026
|
|
| Shareholder Report Annual or Semi-Annual |
Semi-Annual Shareholder Report
|
|
| C000195030 |
|
|
| Shareholder Report [Line Items] |
|
|
| Fund Name |
Redwood AlphaFactor<sup style="inset: 1.5px 0px 4px; box-sizing: border-box; color: rgb(0, 0, 0); display: inline; flex-wrap: nowrap; font-size: 12px; font-weight: 700; grid-area: auto; line-height: 0px; margin: 0px; overflow: visible; position: relative; text-align: left; text-align-last: auto; white-space-collapse: preserve-breaks;">®</sup> Tactical International Fund
|
|
| Class Name |
Class I
|
|
| Trading Symbol |
RWIIX
|
|
| Annual or Semi-Annual Statement [Text Block] |
This semi-annual shareholder report contains important information about Redwood AlphaFactor® Tactical International Fund for the period of November 1, 2025 to April 30, 2026.
|
|
| Additional Information [Text Block] |
You can find additional information about the Fund at https://www.redwoodmutualfunds.com/funds/alphafactor-international. You can also request this information by contacting us at 855-733-3863.
|
|
| Additional Information Phone Number |
855-733-3863
|
|
| Additional Information Website |
https://www.redwoodmutualfunds.com/funds/alphafactor-international
|
|
| Expenses [Text Block] |
What were the Fund’s costs for the last six months?(based on a hypothetical $10,000 investment) Table SummaryClass Name | Costs of a $10,000 investment | Costs paid as a percentage of a $10,000 investment |
|---|
Class I | $62 | 1.20%Footnote Reference* |
|---|
| Footnote | Description | Footnote* | Annualized |
|
|
| Expenses Paid, Amount |
$ 62
|
|
| Expense Ratio, Percent |
1.20%
|
[1] |
| AssetsNet |
$ 91,688,419
|
|
| Holdings Count | Holding |
78
|
|
| Advisory Fees Paid, Amount |
$ 221,003
|
|
| InvestmentCompanyPortfolioTurnover |
97.00%
|
|
| Additional Fund Statistics [Text Block] |
Table SummaryNet Assets | $91,688,419 |
|---|
Number of Portfolio Holdings | 78 |
|---|
Advisory Fee (net of waivers) | $221,003 |
|---|
Portfolio Turnover | 97% |
|---|
|
|
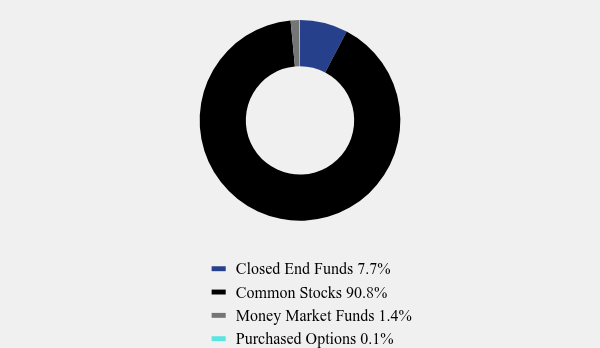
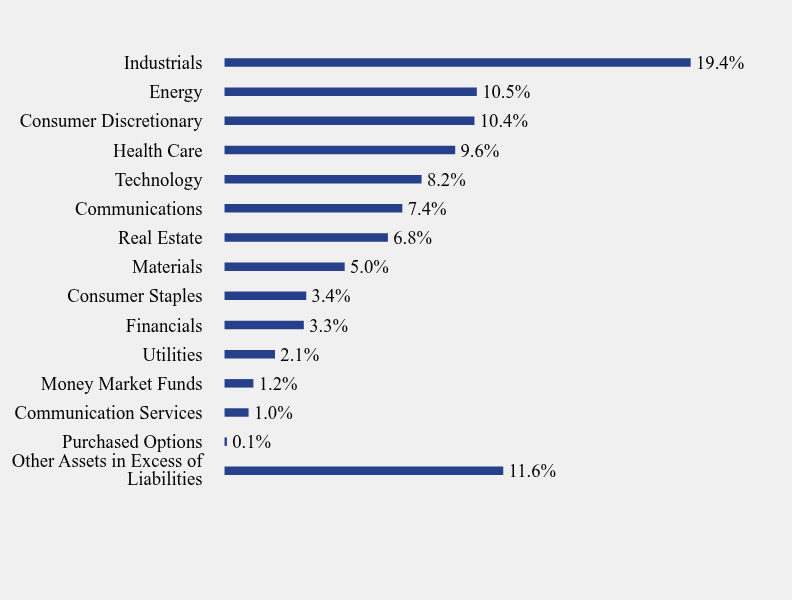
| Holdings [Text Block] |
Asset Weighting (% of total investments)Table SummaryValue | Value |
|---|
Closed End Funds | 7.7% | Common Stocks | 90.8% | Money Market Funds | 1.4% | Purchased Options | 0.1% | Sector Weighting (% of net assets)Table SummaryValue | Value |
|---|
Other Assets in Excess of Liabilities | 11.6% | Purchased Options | 0.1% | Communication Services | 1.0% | Money Market Funds | 1.2% | Utilities | 2.1% | Financials | 3.3% | Consumer Staples | 3.4% | Materials | 5.0% | Real Estate | 6.8% | Communications | 7.4% | Technology | 8.2% | Health Care | 9.6% | Consumer Discretionary | 10.4% | Energy | 10.5% | Industrials | 19.4% | Top 10 Holdings (% of net assets)Table SummaryHolding Name | % of Net Assets |
|---|
Redwood Real Estate Income Fund, Class I | 6.8% |
|---|
TFI International, Inc. | 1.7% |
|---|
SCREEN Holdings Company Ltd. | 1.6% |
|---|
Suncor Energy, Inc. | 1.5% |
|---|
Canadian Natural Resources Ltd. | 1.5% |
|---|
Yara International ASA | 1.4% |
|---|
Kinross Gold Corporation | 1.4% |
|---|
Makita Corporation | 1.3% |
|---|
Knorr-Bremse A.G. | 1.3% |
|---|
ENEOS Holdings, Inc. | 1.3% |
|---|
|
|
| C000178523 |
|
|
| Shareholder Report [Line Items] |
|
|
| Fund Name |
Redwood Managed Municipal Income Fund
|
|
| Class Name |
Class I
|
|
| Trading Symbol |
RWMIX
|
|
| Annual or Semi-Annual Statement [Text Block] |
This semi-annual shareholder report contains important information about Redwood Managed Municipal Income Fund for the period of November 1, 2025 to April 30, 2026.
|
|
| Additional Information [Text Block] |
You can find additional information about the Fund at https://www.redwoodmutualfunds.com/funds/managed-muni-fund. You can also request this information by contacting us at 855-733-3863.
|
|
| Additional Information Phone Number |
855-733-3863
|
|
| Additional Information Website |
https://www.redwoodmutualfunds.com/funds/managed-muni-fund
|
|
| Expenses [Text Block] |
What were the Fund’s costs for the last six months?(based on a hypothetical $10,000 investment) Table SummaryClass Name | Costs of a $10,000 investment | Costs paid as a percentage of a $10,000 investment |
|---|
Class I | $50 | 1.00%Footnote Reference* |
|---|
| Footnote | Description | Footnote* | Annualized |
|
|
| Expenses Paid, Amount |
$ 50
|
|
| Expense Ratio, Percent |
1.00%
|
[2] |
| AssetsNet |
$ 80,076,804
|
|
| Holdings Count | Holding |
19
|
|
| Advisory Fees Paid, Amount |
$ 205,245
|
|
| InvestmentCompanyPortfolioTurnover |
94.00%
|
|
| Additional Fund Statistics [Text Block] |
Table SummaryNet Assets | $80,076,804 |
|---|
Number of Portfolio Holdings | 19 |
|---|
Advisory Fee (net of waivers) | $205,245 |
|---|
Portfolio Turnover | 94% |
|---|
|
|
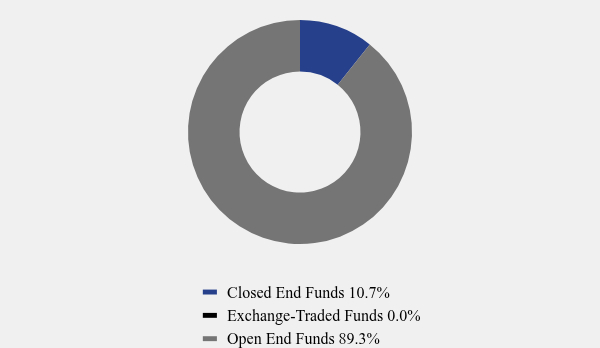
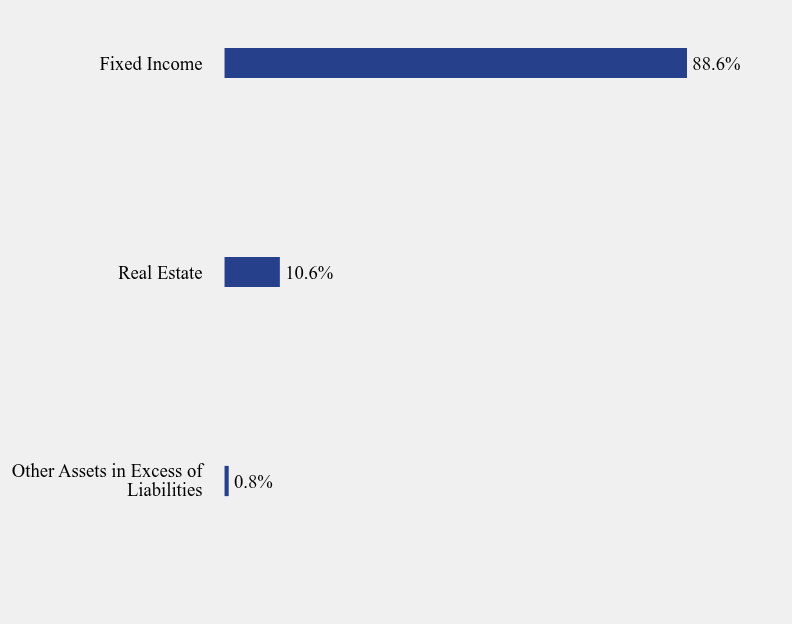
| Holdings [Text Block] |
Asset Weighting (% of total investments)Table SummaryValue | Value |
|---|
Closed End Funds | 10.7% | Exchange-Traded Funds | 0.0% | Open End Funds | 89.3% | Sector Weighting (% of net assets)Table SummaryValue | Value |
|---|
Other Assets in Excess of Liabilities | 0.8% | Real Estate | 10.6% | Fixed Income | 88.6% | Top 10 Holdings (% of net assets)Table SummaryHolding Name | % of Net Assets |
|---|
Goldman Sachs High Yield Municipal Fund, Institutional Class | 15.7% |
|---|
First Eagle Funds - First Eagle High Income Fund, Class I | 12.6% |
|---|
Delaware National High-Yield Municipal Bond Fund, Institutional Class | 12.6% |
|---|
Franklin High Yield Tax-Free Income Fund | 12.6% |
|---|
Lord Abbett High Yield Municipal Bond Fund, Class I | 12.6% |
|---|
PIMCO High Yield Municipal Bond Fund, Institutional Class | 12.6% |
|---|
Redwood Real Estate Income Fund, Class I | 10.6% |
|---|
Nuveen High Yield Municipal Bond Fund, Class I | 3.3% |
|---|
Invesco Rochester Municipal Opportunities Fund, Class Y | 3.3% |
|---|
Invesco High Yield Municipal Fund, Class Y | 3.3% |
|---|
|
|
| C000131991 |
|
|
| Shareholder Report [Line Items] |
|
|
| Fund Name |
Redwood Managed Volatility Fund
|
|
| Class Name |
Class I
|
|
| Trading Symbol |
RWDIX
|
|
| Annual or Semi-Annual Statement [Text Block] |
This semi-annual shareholder report contains important information about Redwood Managed Volatility Fund for the period of November 1, 2025 to April 30, 2026.
|
|
| Additional Information [Text Block] |
You can find additional information about the Fund at https://www.redwoodmutualfunds.com/funds/managed-volatility-fund. You can also request this information by contacting us at 855-733-3863.
|
|
| Additional Information Phone Number |
855-733-3863
|
|
| Additional Information Website |
https://www.redwoodmutualfunds.com/funds/managed-volatility-fund
|
|
| Expenses [Text Block] |
What were the Fund’s costs for the last six months?(based on a hypothetical $10,000 investment) Table SummaryClass Name | Costs of a $10,000 investment | Costs paid as a percentage of a $10,000 investment |
|---|
Class I | $84 | 1.67%Footnote Reference* |
|---|
| Footnote | Description | Footnote* | Annualized |
|
|
| Expenses Paid, Amount |
$ 84
|
|
| Expense Ratio, Percent |
1.67%
|
[3] |
| AssetsNet |
$ 75,090,765
|
|
| Holdings Count | Holding |
12
|
|
| Advisory Fees Paid, Amount |
$ 427,832
|
|
| InvestmentCompanyPortfolioTurnover |
3.00%
|
|
| Additional Fund Statistics [Text Block] |
Table SummaryNet Assets | $75,090,765 |
|---|
Number of Portfolio Holdings | 12 |
|---|
Advisory Fee (net of waivers) | $427,832 |
|---|
Portfolio Turnover | 3% |
|---|
|
|
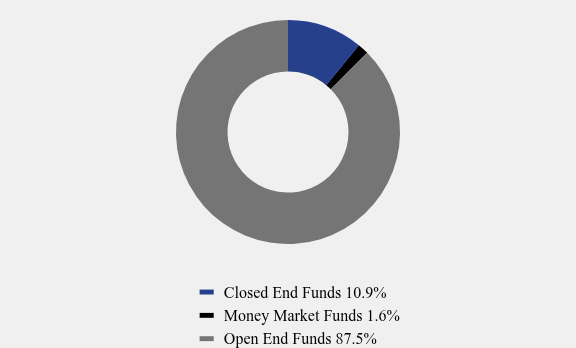
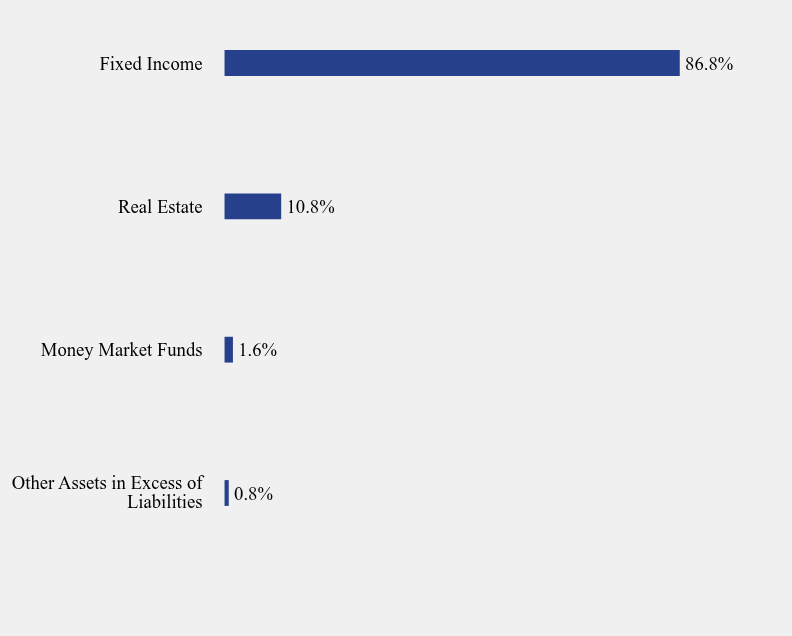
| Holdings [Text Block] |
Asset Weighting (% of total investments)Table SummaryValue | Value |
|---|
Closed End Funds | 10.9% | Money Market Funds | 1.6% | Open End Funds | 87.5% | Sector Weighting (% of net assets)Table SummaryValue | Value |
|---|
Other Assets in Excess of Liabilities | 0.8% | Money Market Funds | 1.6% | Real Estate | 10.8% | Fixed Income | 86.8% | Top 10 Holdings (% of net assets)Table SummaryHolding Name | % of Net Assets |
|---|
Blackrock Series Fund V-BlackRock High Yield Portfolio, Institutional Class | 19.2% |
|---|
American High-Income Trust, Class F-3 | 19.1% |
|---|
Lord Abbett High Yield Fund, Class I | 19.1% |
|---|
JPMorgan High Yield Fund, Class I | 18.9% |
|---|
Redwood Real Estate Income Fund, Class I | 10.8% |
|---|
Goldman Sachs High Yield Fund, Institutional Class | 10.4% |
|---|
Goldman Sachs Financial Square Government Fund, Administration Class | 1.6% |
|---|
Vanguard High-Yield Corporate Fund, Admiral Class | 0.1% |
|---|
Principal High Yield Fund, Institutional Class | 0.0% |
|---|
MainStay MacKay High Yield Corporate Bond Fund, Class I | 0.0% |
|---|
|
|
| C000131992 |
|
|
| Shareholder Report [Line Items] |
|
|
| Fund Name |
Redwood Managed Volatility Fund
|
|
| Class Name |
Class N
|
|
| Trading Symbol |
RWDNX
|
|
| Annual or Semi-Annual Statement [Text Block] |
This semi-annual shareholder report contains important information about Redwood Managed Volatility Fund for the period of November 1, 2025 to April 30, 2026.
|
|
| Additional Information [Text Block] |
You can find additional information about the Fund at https://www.redwoodmutualfunds.com/funds/managed-volatility-fund. You can also request this information by contacting us at 855-733-3863.
|
|
| Additional Information Phone Number |
855-733-3863
|
|
| Additional Information Website |
https://www.redwoodmutualfunds.com/funds/managed-volatility-fund
|
|
| Expenses [Text Block] |
What were the Fund’s costs for the last six months?(based on a hypothetical $10,000 investment) Table SummaryClass Name | Costs of a $10,000 investment | Costs paid as a percentage of a $10,000 investment |
|---|
Class N | $96 | 1.92%Footnote Reference* |
|---|
| Footnote | Description | Footnote* | Annualized |
|
|
| Expenses Paid, Amount |
$ 96
|
|
| Expense Ratio, Percent |
1.92%
|
[4] |
| AssetsNet |
$ 75,090,765
|
|
| Holdings Count | Holding |
12
|
|
| Advisory Fees Paid, Amount |
$ 427,832
|
|
| InvestmentCompanyPortfolioTurnover |
3.00%
|
|
| Additional Fund Statistics [Text Block] |
Table SummaryNet Assets | $75,090,765 |
|---|
Number of Portfolio Holdings | 12 |
|---|
Advisory Fee (net of waivers) | $427,832 |
|---|
Portfolio Turnover | 3% |
|---|
|
|
| Holdings [Text Block] |
Asset Weighting (% of total investments)Table SummaryValue | Value |
|---|
Closed End Funds | 10.9% | Money Market Funds | 1.6% | Open End Funds | 87.5% | Sector Weighting (% of net assets)Table SummaryValue | Value |
|---|
Other Assets in Excess of Liabilities | 0.8% | Money Market Funds | 1.6% | Real Estate | 10.8% | Fixed Income | 86.8% | Top 10 Holdings (% of net assets)Table SummaryHolding Name | % of Net Assets |
|---|
Blackrock Series Fund V-BlackRock High Yield Portfolio, Institutional Class | 19.2% |
|---|
American High-Income Trust, Class F-3 | 19.1% |
|---|
Lord Abbett High Yield Fund, Class I | 19.1% |
|---|
JPMorgan High Yield Fund, Class I | 18.9% |
|---|
Redwood Real Estate Income Fund, Class I | 10.8% |
|---|
Goldman Sachs High Yield Fund, Institutional Class | 10.4% |
|---|
Goldman Sachs Financial Square Government Fund, Administration Class | 1.6% |
|---|
Vanguard High-Yield Corporate Fund, Admiral Class | 0.1% |
|---|
Principal High Yield Fund, Institutional Class | 0.0% |
|---|
MainStay MacKay High Yield Corporate Bond Fund, Class I | 0.0% |
|---|
|
|
| C000131993 |
|
|
| Shareholder Report [Line Items] |
|
|
| Fund Name |
Redwood Managed Volatility Fund
|
|
| Class Name |
Class Y
|
|
| Trading Symbol |
RWDYX
|
|
| Annual or Semi-Annual Statement [Text Block] |
This semi-annual shareholder report contains important information about Redwood Managed Volatility Fund for the period of November 1, 2025 to April 30, 2026.
|
|
| Additional Information [Text Block] |
You can find additional information about the Fund at https://www.redwoodmutualfunds.com/funds/managed-volatility-fund. You can also request this information by contacting us at 855-733-3863.
|
|
| Additional Information Phone Number |
855-733-3863
|
|
| Additional Information Website |
https://www.redwoodmutualfunds.com/funds/managed-volatility-fund
|
|
| Expenses [Text Block] |
What were the Fund’s costs for the last six months?(based on a hypothetical $10,000 investment) Table SummaryClass Name | Costs of a $10,000 investment | Costs paid as a percentage of a $10,000 investment |
|---|
Class Y | $87 | 1.74%Footnote Reference* |
|---|
| Footnote | Description | Footnote* | Annualized |
|
|
| Expenses Paid, Amount |
$ 87
|
|
| Expense Ratio, Percent |
1.74%
|
[5] |
| AssetsNet |
$ 75,090,765
|
|
| Holdings Count | Holding |
12
|
|
| Advisory Fees Paid, Amount |
$ 427,832
|
|
| InvestmentCompanyPortfolioTurnover |
3.00%
|
|
| Additional Fund Statistics [Text Block] |
Table SummaryNet Assets | $75,090,765 |
|---|
Number of Portfolio Holdings | 12 |
|---|
Advisory Fee (net of waivers) | $427,832 |
|---|
Portfolio Turnover | 3% |
|---|
|
|
| Holdings [Text Block] |
Asset Weighting (% of total investments)Table SummaryValue | Value |
|---|
Closed End Funds | 10.9% | Money Market Funds | 1.6% | Open End Funds | 87.5% | Sector Weighting (% of net assets)Table SummaryValue | Value |
|---|
Other Assets in Excess of Liabilities | 0.8% | Money Market Funds | 1.6% | Real Estate | 10.8% | Fixed Income | 86.8% | Top 10 Holdings (% of net assets)Table SummaryHolding Name | % of Net Assets |
|---|
Blackrock Series Fund V-BlackRock High Yield Portfolio, Institutional Class | 19.2% |
|---|
American High-Income Trust, Class F-3 | 19.1% |
|---|
Lord Abbett High Yield Fund, Class I | 19.1% |
|---|
JPMorgan High Yield Fund, Class I | 18.9% |
|---|
Redwood Real Estate Income Fund, Class I | 10.8% |
|---|
Goldman Sachs High Yield Fund, Institutional Class | 10.4% |
|---|
Goldman Sachs Financial Square Government Fund, Administration Class | 1.6% |
|---|
Vanguard High-Yield Corporate Fund, Admiral Class | 0.1% |
|---|
Principal High Yield Fund, Institutional Class | 0.0% |
|---|
MainStay MacKay High Yield Corporate Bond Fund, Class I | 0.0% |
|---|
|
|
| C000195032 |
|
|
| Shareholder Report [Line Items] |
|
|
| Fund Name |
Redwood Systematic Macro Trend Fund
|
|
| Class Name |
Class I
|
|
| Trading Symbol |
RWSIX
|
|
| Annual or Semi-Annual Statement [Text Block] |
This semi-annual shareholder report contains important information about Redwood Systematic Macro Trend Fund for the period of November 1, 2025 to April 30, 2026.
|
|
| Additional Information [Text Block] |
You can find additional information about the Fund at https://www.redwoodmutualfunds.com/funds/systematic-macro-trend. You can also request this information by contacting us at 855-733-3863.
|
|
| Additional Information Phone Number |
855-733-3863
|
|
| Additional Information Website |
https://www.redwoodmutualfunds.com/funds/systematic-macro-trend
|
|
| Expenses [Text Block] |
What were the Fund’s costs for the last six months?(based on a hypothetical $10,000 investment) Table SummaryClass Name | Costs of a $10,000 investment | Costs paid as a percentage of a $10,000 investment |
|---|
Class I | $67 | 1.30%Footnote Reference* |
|---|
| Footnote | Description | Footnote* | Annualized |
|
|
| Expenses Paid, Amount |
$ 67
|
|
| Expense Ratio, Percent |
1.30%
|
[6] |
| AssetsNet |
$ 117,112,592
|
|
| Holdings Count | Holding |
65
|
|
| Advisory Fees Paid, Amount |
$ 518,689
|
|
| InvestmentCompanyPortfolioTurnover |
27.00%
|
|
| Additional Fund Statistics [Text Block] |
Table SummaryNet Assets | $117,112,592 |
|---|
Number of Portfolio Holdings | 65 |
|---|
Advisory Fee (net of waivers) | $518,689 |
|---|
Portfolio Turnover | 27% |
|---|
|
|
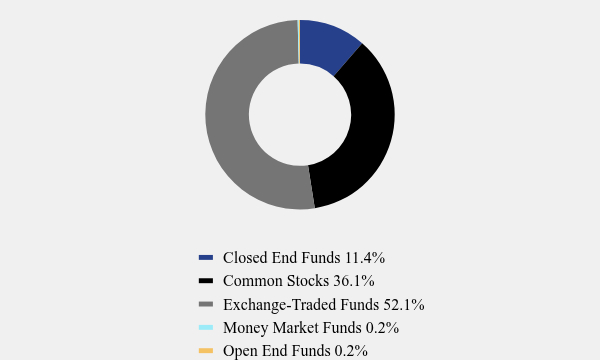
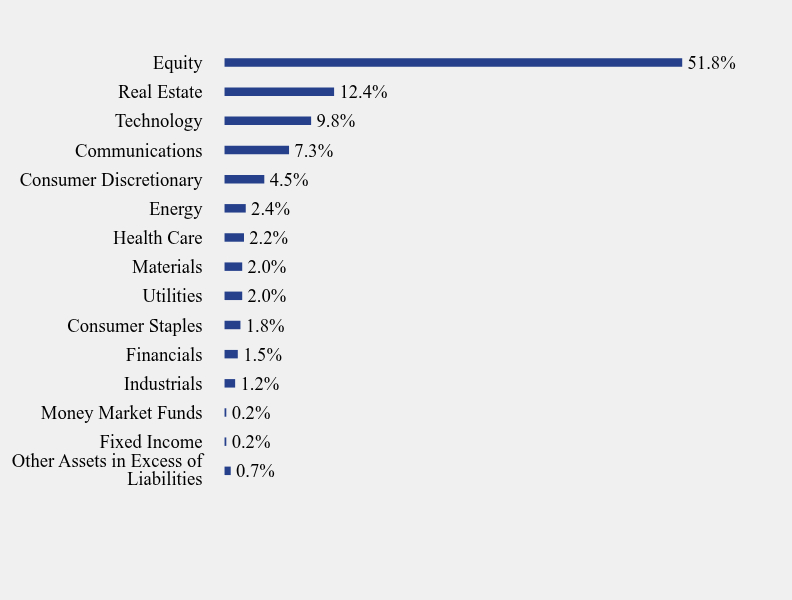
| Holdings [Text Block] |
Asset Weighting (% of total investments)Table SummaryValue | Value |
|---|
Closed End Funds | 11.4% | Common Stocks | 36.1% | Exchange-Traded Funds | 52.1% | Money Market Funds | 0.2% | Open End Funds | 0.2% | Sector Weighting (% of net assets)Table SummaryValue | Value |
|---|
Other Assets in Excess of Liabilities | 0.7% | Fixed Income | 0.2% | Money Market Funds | 0.2% | Industrials | 1.2% | Financials | 1.5% | Consumer Staples | 1.8% | Utilities | 2.0% | Materials | 2.0% | Health Care | 2.2% | Energy | 2.4% | Consumer Discretionary | 4.5% | Communications | 7.3% | Technology | 9.8% | Real Estate | 12.4% | Equity | 51.8% | Top 10 Holdings (% of net assets)Table SummaryHolding Name | % of Net Assets |
|---|
iShares MSCI EAFE ETF | 24.7% |
|---|
Schwab International Small-Cap Equity ETF | 13.6% |
|---|
Vanguard FTSE All World ex-US Small-Cap ETF | 13.5% |
|---|
Redwood Real Estate Income Fund, Class I | 11.3% |
|---|
Alphabet, Inc., Class A | 4.3% |
|---|
Apple, Inc. | 2.9% |
|---|
Microsoft Corporation | 2.2% |
|---|
Amazon.com, Inc. | 1.9% |
|---|
Broadcom, Inc. | 1.3% |
|---|
Meta Platforms, Inc., Class A | 0.9% |
|---|
|
|
| C000195033 |
|
|
| Shareholder Report [Line Items] |
|
|
| Fund Name |
Redwood Systematic Macro Trend Fund
|
|
| Class Name |
Class N
|
|
| Trading Symbol |
RWSNX
|
|
| Annual or Semi-Annual Statement [Text Block] |
This semi-annual shareholder report contains important information about Redwood Systematic Macro Trend Fund for the period of November 1, 2025 to April 30, 2026.
|
|
| Additional Information [Text Block] |
You can find additional information about the Fund at https://www.redwoodmutualfunds.com/funds/systematic-macro-trend. You can also request this information by contacting us at 855-733-3863.
|
|
| Additional Information Phone Number |
855-733-3863
|
|
| Additional Information Website |
https://www.redwoodmutualfunds.com/funds/systematic-macro-trend
|
|
| Expenses [Text Block] |
What were the Fund’s costs for the last six months?(based on a hypothetical $10,000 investment) Table SummaryClass Name | Costs of a $10,000 investment | Costs paid as a percentage of a $10,000 investment |
|---|
Class N | $80 | 1.55%Footnote Reference* |
|---|
| Footnote | Description | Footnote* | Annualized |
|
|
| Expenses Paid, Amount |
$ 80
|
|
| Expense Ratio, Percent |
1.55%
|
[7] |
| AssetsNet |
$ 117,112,592
|
|
| Holdings Count | Holding |
65
|
|
| Advisory Fees Paid, Amount |
$ 518,689
|
|
| InvestmentCompanyPortfolioTurnover |
27.00%
|
|
| Additional Fund Statistics [Text Block] |
Table SummaryNet Assets | $117,112,592 |
|---|
Number of Portfolio Holdings | 65 |
|---|
Advisory Fee (net of waivers) | $518,689 |
|---|
Portfolio Turnover | 27% |
|---|
|
|
| Holdings [Text Block] |
Asset Weighting (% of total investments)Table SummaryValue | Value |
|---|
Closed End Funds | 11.4% | Common Stocks | 36.1% | Exchange-Traded Funds | 52.1% | Money Market Funds | 0.2% | Open End Funds | 0.2% | Sector Weighting (% of net assets)Table SummaryValue | Value |
|---|
Other Assets in Excess of Liabilities | 0.7% | Fixed Income | 0.2% | Money Market Funds | 0.2% | Industrials | 1.2% | Financials | 1.5% | Consumer Staples | 1.8% | Utilities | 2.0% | Materials | 2.0% | Health Care | 2.2% | Energy | 2.4% | Consumer Discretionary | 4.5% | Communications | 7.3% | Technology | 9.8% | Real Estate | 12.4% | Equity | 51.8% | Top 10 Holdings (% of net assets)Table SummaryHolding Name | % of Net Assets |
|---|
iShares MSCI EAFE ETF | 24.7% |
|---|
Schwab International Small-Cap Equity ETF | 13.6% |
|---|
Vanguard FTSE All World ex-US Small-Cap ETF | 13.5% |
|---|
Redwood Real Estate Income Fund, Class I | 11.3% |
|---|
Alphabet, Inc., Class A | 4.3% |
|---|
Apple, Inc. | 2.9% |
|---|
Microsoft Corporation | 2.2% |
|---|
Amazon.com, Inc. | 1.9% |
|---|
Broadcom, Inc. | 1.3% |
|---|
Meta Platforms, Inc., Class A | 0.9% |
|---|
|
|
|
|