Shareholder Report
Apr. 30, 2026
USD ($)
Holding
| [1] | Annualized |
| [2] | Annualized |
| [3] | Annualized |
Shareholder Report |
6 Months Ended | |||||||
|---|---|---|---|---|---|---|---|---|
|
Apr. 30, 2026
USD ($)
Holding
| ||||||||
| Shareholder Report [Line Items] | ||||||||
| Document Type | N-CSRS | |||||||
| Amendment Flag | false | |||||||
| Registrant Name | Two Roads Shared Trust | |||||||
| Entity Central Index Key | 0001552947 | |||||||
| Entity Investment Company Type | N-1A | |||||||
| Document Period End Date | Apr. 30, 2026 | |||||||
| Shareholder Report Annual or Semi-Annual | Semi-Annual Shareholder Report | |||||||
| C000218404 | ||||||||
| Shareholder Report [Line Items] | ||||||||
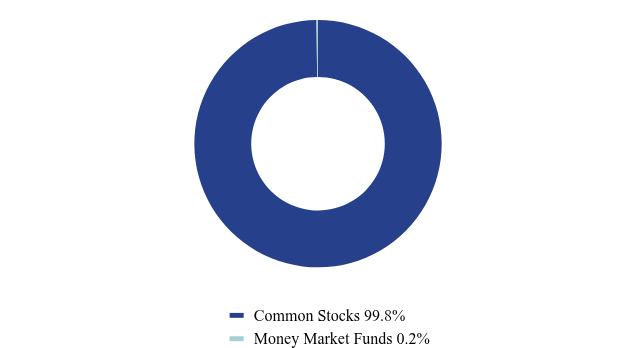
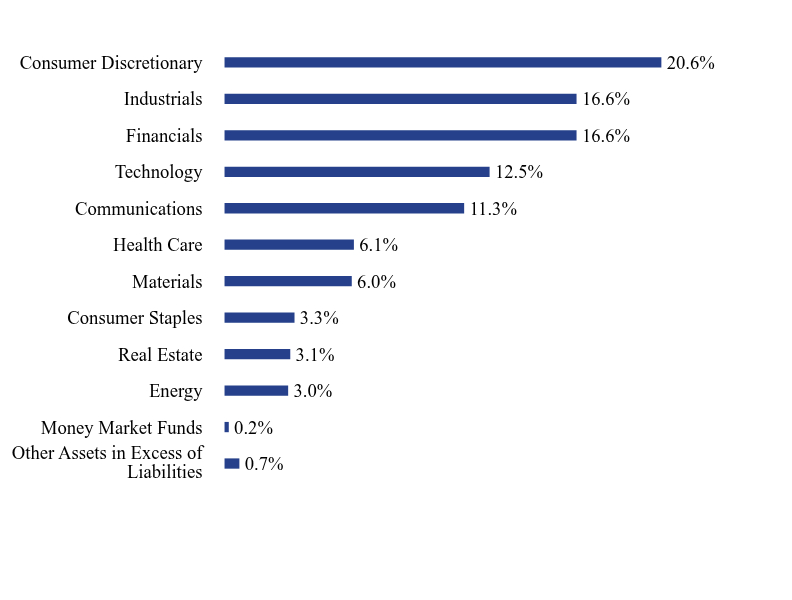
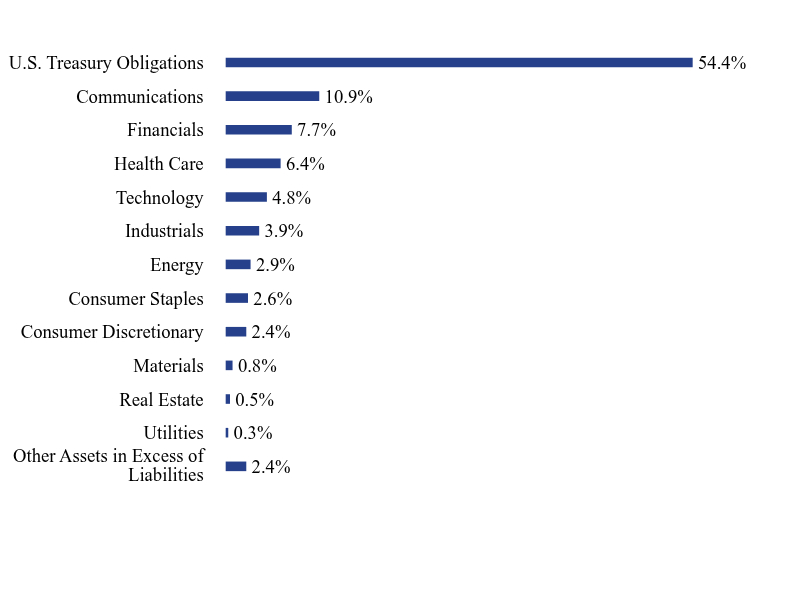
| Fund Name | LeaderShares AlphaFactor Tactical Focused ETF | |||||||
| Trading Symbol | LSAT | |||||||
| Security Exchange Name | NYSEArca | |||||||
| Annual or Semi-Annual Statement [Text Block] | This semi-annual shareholder report contains important information about LeaderShares AlphaFactor Tactical Focused ETF for the period of November 1, 2025 to April 30, 2026. | |||||||
| Additional Information [Text Block] | You can find additional information about the Fund at https://www.leadersharesetfs.com/funds/leadershares-tactical-focused-etf. You can also request this information by contacting us at 1-888-617-1444. | |||||||
| Additional Information Phone Number | 1-888-617-1444 | |||||||
| Additional Information Website | https://www.leadersharesetfs.com/funds/leadershares-tactical-focused-etf | |||||||
| Expenses [Text Block] | ||||||||
| Expenses Paid, Amount | $ 51 | |||||||
| Expense Ratio, Percent | 0.99% | [1] | ||||||
| AssetsNet | $ 60,382,667 | |||||||
| Holdings Count | Holding | 31 | |||||||
| Advisory Fees Paid, Amount | $ 330,116 | |||||||
| InvestmentCompanyPortfolioTurnover | 88.00% | |||||||
| Additional Fund Statistics [Text Block] | ||||||||
| Holdings [Text Block] | ||||||||
| C000200720 | ||||||||
| Shareholder Report [Line Items] | ||||||||
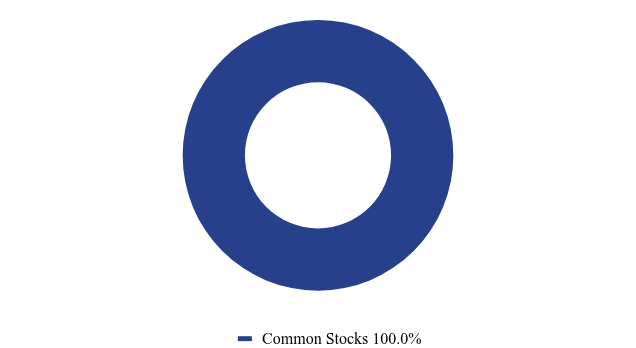
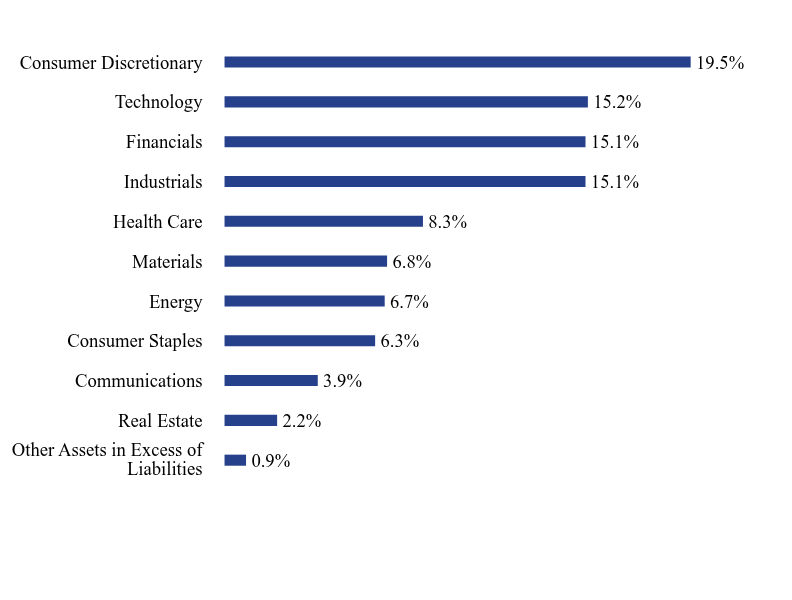
| Fund Name | LeaderShares AlphaFactor US Core Equity ETF | |||||||
| Trading Symbol | LSAF | |||||||
| Security Exchange Name | NYSEArca | |||||||
| Annual or Semi-Annual Statement [Text Block] | This semi-annual shareholder report contains important information about LeaderShares AlphaFactor US Core Equity ETF for the period of November 1, 2025 to April 30, 2026. | |||||||
| Additional Information [Text Block] | You can find additional information about the Fund at https://www.leadersharesetfs.com/funds/leadershares-alphafactor-core-etf. You can also request this information by contacting us at 1-888-617-1444. | |||||||
| Additional Information Phone Number | 1-888-617-1444 | |||||||
| Additional Information Website | https://www.leadersharesetfs.com/funds/leadershares-alphafactor-core-etf | |||||||
| Expenses [Text Block] | ||||||||
| Expenses Paid, Amount | $ 40 | |||||||
| Expense Ratio, Percent | 0.75% | [2] | ||||||
| AssetsNet | $ 113,290,469 | |||||||
| Holdings Count | Holding | 100 | |||||||
| Advisory Fees Paid, Amount | $ 412,080 | |||||||
| InvestmentCompanyPortfolioTurnover | 91.00% | |||||||
| Additional Fund Statistics [Text Block] | ||||||||
| Holdings [Text Block] | ||||||||
| C000228396 | ||||||||
| Shareholder Report [Line Items] | ||||||||
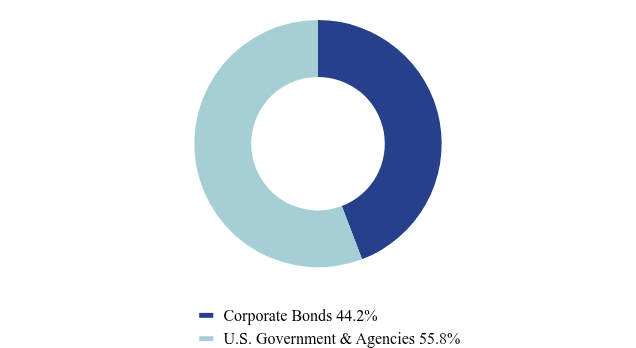
| Fund Name | LeaderShares Dynamic Yield ETF | |||||||
| Trading Symbol | DYLD | |||||||
| Security Exchange Name | NYSEArca | |||||||
| Annual or Semi-Annual Statement [Text Block] | This semi-annual shareholder report contains important information about LeaderShares Dynamic Yield ETF for the period of November 1, 2025 to April 30, 2026. | |||||||
| Additional Information [Text Block] | You can find additional information about the Fund at https://www.leadersharesetfs.com/funds/leadershares-dynamic-yield-etf. You can also request this information by contacting us at 1-888-617-1444. | |||||||
| Additional Information Phone Number | 1-888-617-1444 | |||||||
| Additional Information Website | https://www.leadersharesetfs.com/funds/leadershares-dynamic-yield-etf | |||||||
| Expenses [Text Block] | ||||||||
| Expenses Paid, Amount | $ 37 | |||||||
| Expense Ratio, Percent | 0.75% | [3] | ||||||
| AssetsNet | $ 40,396,506 | |||||||
| Holdings Count | Holding | 179 | |||||||
| Advisory Fees Paid, Amount | $ 156,422 | |||||||
| InvestmentCompanyPortfolioTurnover | 0.00% | |||||||
| Additional Fund Statistics [Text Block] | ||||||||
| Holdings [Text Block] | ||||||||
| ||||||||