Shareholder Report
|
6 Months Ended |
|
Apr. 30, 2026
USD ($)
Holding
|
|---|
| Shareholder Report [Line Items] |
|
| Document Type |
N-CSRS
|
| Amendment Flag |
false
|
| Registrant Name |
Voya Mutual Funds
|
| Entity Central Index Key |
0000895430
|
| Entity Investment Company Type |
N-1A
|
| Document Period End Date |
Apr. 30, 2026
|
| Shareholder Report Annual or Semi-Annual |
Semi-Annual Shareholder Report
|
| C000034078 |
|
| Shareholder Report [Line Items] |
|
| Fund Name |
Voya Global Bond Fund
|
| Class Name |
Class A
|
| Trading Symbol |
INGBX
|
| Annual or Semi-Annual Statement [Text Block] |
This semi-annual shareholder report contains important information about Voya Global Bond Fund for the period of November 1, 2025 to April 30, 2026.
|
| Additional Information Phone Number |
1-800-992-0180
|
| Expenses Paid, Amount |
$ 45
|
| Expense Ratio, Percent |
0.90%
|
| AssetsNet |
$ 80,367,733
|
| Holdings Count | Holding |
925
|
| InvestmentCompanyPortfolioTurnover |
67.00%
|
| C000034080 |
|
| Shareholder Report [Line Items] |
|
| Fund Name |
Voya Global Bond Fund
|
| Class Name |
Class C
|
| Trading Symbol |
IGBCX
|
| Annual or Semi-Annual Statement [Text Block] |
This semi-annual shareholder report contains important information about Voya Global Bond Fund for the period of November 1, 2025 to April 30, 2026.
|
| Additional Information Phone Number |
1-800-992-0180
|
| Expenses Paid, Amount |
$ 82
|
| Expense Ratio, Percent |
1.65%
|
| AssetsNet |
$ 80,367,733
|
| Holdings Count | Holding |
925
|
| InvestmentCompanyPortfolioTurnover |
67.00%
|
| C000034081 |
|
| Shareholder Report [Line Items] |
|
| Fund Name |
Voya Global Bond Fund
|
| Class Name |
Class I
|
| Trading Symbol |
IGBIX
|
| Annual or Semi-Annual Statement [Text Block] |
This semi-annual shareholder report contains important information about Voya Global Bond Fund for the period of November 1, 2025 to April 30, 2026.
|
| Additional Information Phone Number |
1-800-992-0180
|
| Expenses Paid, Amount |
$ 32
|
| Expense Ratio, Percent |
0.65%
|
| AssetsNet |
$ 80,367,733
|
| Holdings Count | Holding |
925
|
| InvestmentCompanyPortfolioTurnover |
67.00%
|
| C000105408 |
|
| Shareholder Report [Line Items] |
|
| Fund Name |
Voya Global Bond Fund
|
| Class Name |
Class R
|
| Trading Symbol |
IGBRX
|
| Annual or Semi-Annual Statement [Text Block] |
This semi-annual shareholder report contains important information about Voya Global Bond Fund for the period of November 1, 2025 to April 30, 2026.
|
| Additional Information Phone Number |
1-800-992-0180
|
| Expenses Paid, Amount |
$ 57
|
| Expense Ratio, Percent |
1.15%
|
| AssetsNet |
$ 80,367,733
|
| Holdings Count | Holding |
925
|
| InvestmentCompanyPortfolioTurnover |
67.00%
|
| C000122013 |
|
| Shareholder Report [Line Items] |
|
| Fund Name |
Voya Global Bond Fund
|
| Class Name |
Class R6
|
| Trading Symbol |
IGBZX
|
| Annual or Semi-Annual Statement [Text Block] |
This semi-annual shareholder report contains important information about Voya Global Bond Fund for the period of November 1, 2025 to April 30, 2026.
|
| Additional Information Phone Number |
1-800-992-0180
|
| Expenses Paid, Amount |
$ 32
|
| Expense Ratio, Percent |
0.65%
|
| AssetsNet |
$ 80,367,733
|
| Holdings Count | Holding |
925
|
| InvestmentCompanyPortfolioTurnover |
67.00%
|
| C000079030 |
|
| Shareholder Report [Line Items] |
|
| Fund Name |
Voya Global Bond Fund
|
| Class Name |
Class W
|
| Trading Symbol |
IGBWX
|
| Annual or Semi-Annual Statement [Text Block] |
This semi-annual shareholder report contains important information about Voya Global Bond Fund for the period of November 1, 2025 to April 30, 2026.
|
| Additional Information Phone Number |
1-800-992-0180
|
| Expenses Paid, Amount |
$ 32
|
| Expense Ratio, Percent |
0.65%
|
| AssetsNet |
$ 80,367,733
|
| Holdings Count | Holding |
925
|
| InvestmentCompanyPortfolioTurnover |
67.00%
|
| C000023406 |
|
| Shareholder Report [Line Items] |
|
| Fund Name |
Voya Global High Dividend Low Volatility Fund
|
| Class Name |
Class A
|
| Trading Symbol |
NAWGX
|
| Annual or Semi-Annual Statement [Text Block] |
This semi-annual shareholder report contains important information about Voya Global High Dividend Low Volatility Fund for the period of November 1, 2025 to April 30, 2026.
|
| Additional Information Phone Number |
1-800-992-0180
|
| Expenses [Text Block] |
What were the Fund’s costs for the last six months? (based on a hypothetical $10,000 investment)Table SummaryClass Name | Costs of $10K investment | Costs paid as % of $10K investment (Annualized) |
|---|
Class A | $45 | 0.87% |
|---|
|
| Expenses Paid, Amount |
$ 45
|
| Expense Ratio, Percent |
0.87%
|
| AssetsNet |
$ 277,560,220
|
| Holdings Count | Holding |
242
|
| InvestmentCompanyPortfolioTurnover |
33.00%
|
| Additional Fund Statistics [Text Block] |
- Total Net Assets$277,560,220
- # of Portfolio Holdings242
- Portfolio Turnover Rate33%
|
| Holdings [Text Block] |
Table SummaryValue | Value |
|---|
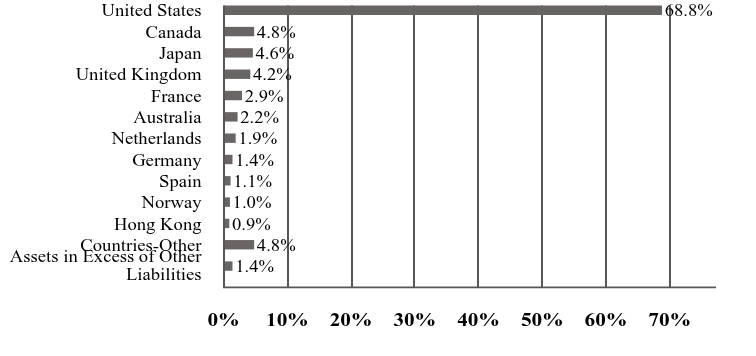
Assets in Excess of Other Liabilities | 1.4% | Countries-Other | 4.8% | Hong Kong | 0.9% | Norway | 1.0% | Spain | 1.1% | Germany | 1.4% | Netherlands | 1.9% | Australia | 2.2% | France | 2.9% | United Kingdom | 4.2% | Japan | 4.6% | Canada | 4.8% | United States | 68.8% | Table SummaryValue | Value |
|---|
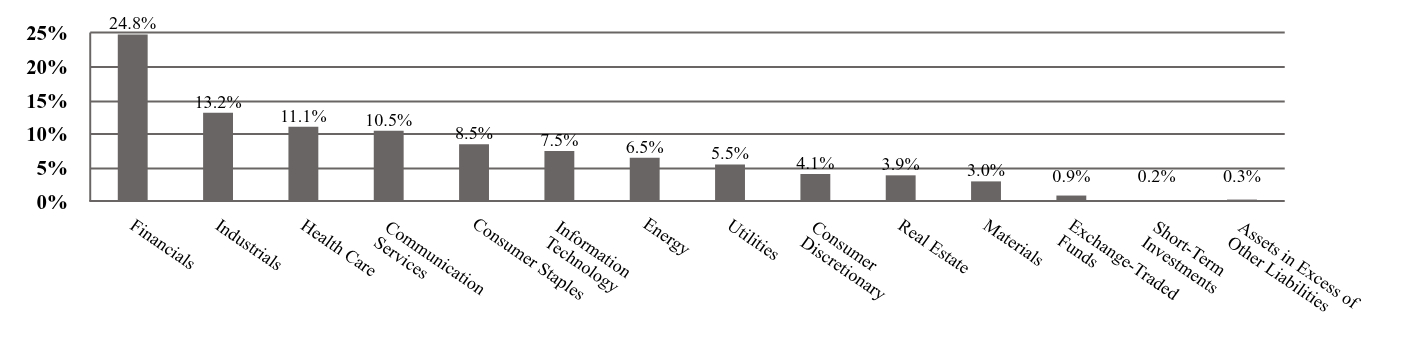
Financials | 24.8% | Industrials | 13.2% | Health Care | 11.1% | Communication Services | 10.5% | Consumer Staples | 8.5% | Information Technology | 7.5% | Energy | 6.5% | Utilities | 5.5% | Consumer Discretionary | 4.1% | Real Estate | 3.9% | Materials | 3.0% | Exchange-Traded Funds | 0.9% | Short-Term Investments | 0.2% | Assets in Excess of Other Liabilities | 0.3% | |
| Largest Holdings [Text Block] |
Table SummaryAlphabet, Inc. - Class A | 3.9% |
|---|
Johnson & Johnson | 1.8% |
|---|
Meta Platforms, Inc. - Class A | 1.5% |
|---|
Cisco Systems, Inc. | 1.4% |
|---|
AbbVie, Inc. | 1.3% |
|---|
Coca-Cola Co. | 1.3% |
|---|
PepsiCo, Inc. | 1.0% |
|---|
Toronto-Dominion Bank | 1.0% |
|---|
Pfizer, Inc. | 0.9% |
|---|
TJX Cos., Inc. | 0.9% |
|---|
|
| C000023408 |
|
| Shareholder Report [Line Items] |
|
| Fund Name |
Voya Global High Dividend Low Volatility Fund
|
| Class Name |
Class C
|
| Trading Symbol |
NAWCX
|
| Annual or Semi-Annual Statement [Text Block] |
This semi-annual shareholder report contains important information about Voya Global High Dividend Low Volatility Fund for the period of November 1, 2025 to April 30, 2026.
|
| Additional Information Phone Number |
1-800-992-0180
|
| Expenses [Text Block] |
What were the Fund’s costs for the last six months? (based on a hypothetical $10,000 investment)Table SummaryClass Name | Costs of $10K investment | Costs paid as % of $10K investment (Annualized) |
|---|
Class C | $84 | 1.62% |
|---|
|
| Expenses Paid, Amount |
$ 84
|
| Expense Ratio, Percent |
1.62%
|
| AssetsNet |
$ 277,560,220
|
| Holdings Count | Holding |
242
|
| InvestmentCompanyPortfolioTurnover |
33.00%
|
| Additional Fund Statistics [Text Block] |
- Total Net Assets$277,560,220
- # of Portfolio Holdings242
- Portfolio Turnover Rate33%
|
| Holdings [Text Block] |
Table SummaryValue | Value |
|---|
Assets in Excess of Other Liabilities | 1.4% | Countries-Other | 4.8% | Hong Kong | 0.9% | Norway | 1.0% | Spain | 1.1% | Germany | 1.4% | Netherlands | 1.9% | Australia | 2.2% | France | 2.9% | United Kingdom | 4.2% | Japan | 4.6% | Canada | 4.8% | United States | 68.8% | Table SummaryValue | Value |
|---|
Financials | 24.8% | Industrials | 13.2% | Health Care | 11.1% | Communication Services | 10.5% | Consumer Staples | 8.5% | Information Technology | 7.5% | Energy | 6.5% | Utilities | 5.5% | Consumer Discretionary | 4.1% | Real Estate | 3.9% | Materials | 3.0% | Exchange-Traded Funds | 0.9% | Short-Term Investments | 0.2% | Assets in Excess of Other Liabilities | 0.3% | |
| Largest Holdings [Text Block] |
Table SummaryAlphabet, Inc. - Class A | 3.9% |
|---|
Johnson & Johnson | 1.8% |
|---|
Meta Platforms, Inc. - Class A | 1.5% |
|---|
Cisco Systems, Inc. | 1.4% |
|---|
AbbVie, Inc. | 1.3% |
|---|
Coca-Cola Co. | 1.3% |
|---|
PepsiCo, Inc. | 1.0% |
|---|
Toronto-Dominion Bank | 1.0% |
|---|
Pfizer, Inc. | 0.9% |
|---|
TJX Cos., Inc. | 0.9% |
|---|
|
| C000023409 |
|
| Shareholder Report [Line Items] |
|
| Fund Name |
Voya Global High Dividend Low Volatility Fund
|
| Class Name |
Class I
|
| Trading Symbol |
NAWIX
|
| Annual or Semi-Annual Statement [Text Block] |
This semi-annual shareholder report contains important information about Voya Global High Dividend Low Volatility Fund for the period of November 1, 2025 to April 30, 2026.
|
| Additional Information Phone Number |
1-800-992-0180
|
| Expenses [Text Block] |
What were the Fund’s costs for the last six months? (based on a hypothetical $10,000 investment)Table SummaryClass Name | Costs of $10K investment | Costs paid as % of $10K investment (Annualized) |
|---|
Class I | $32 | 0.62% |
|---|
|
| Expenses Paid, Amount |
$ 32
|
| Expense Ratio, Percent |
0.62%
|
| AssetsNet |
$ 277,560,220
|
| Holdings Count | Holding |
242
|
| InvestmentCompanyPortfolioTurnover |
33.00%
|
| Additional Fund Statistics [Text Block] |
- Total Net Assets$277,560,220
- # of Portfolio Holdings242
- Portfolio Turnover Rate33%
|
| Holdings [Text Block] |
Table SummaryValue | Value |
|---|
Assets in Excess of Other Liabilities | 1.4% | Countries-Other | 4.8% | Hong Kong | 0.9% | Norway | 1.0% | Spain | 1.1% | Germany | 1.4% | Netherlands | 1.9% | Australia | 2.2% | France | 2.9% | United Kingdom | 4.2% | Japan | 4.6% | Canada | 4.8% | United States | 68.8% | Table SummaryValue | Value |
|---|
Financials | 24.8% | Industrials | 13.2% | Health Care | 11.1% | Communication Services | 10.5% | Consumer Staples | 8.5% | Information Technology | 7.5% | Energy | 6.5% | Utilities | 5.5% | Consumer Discretionary | 4.1% | Real Estate | 3.9% | Materials | 3.0% | Exchange-Traded Funds | 0.9% | Short-Term Investments | 0.2% | Assets in Excess of Other Liabilities | 0.3% | |
| Largest Holdings [Text Block] |
Table SummaryAlphabet, Inc. - Class A | 3.9% |
|---|
Johnson & Johnson | 1.8% |
|---|
Meta Platforms, Inc. - Class A | 1.5% |
|---|
Cisco Systems, Inc. | 1.4% |
|---|
AbbVie, Inc. | 1.3% |
|---|
Coca-Cola Co. | 1.3% |
|---|
PepsiCo, Inc. | 1.0% |
|---|
Toronto-Dominion Bank | 1.0% |
|---|
Pfizer, Inc. | 0.9% |
|---|
TJX Cos., Inc. | 0.9% |
|---|
|
| C000218334 |
|
| Shareholder Report [Line Items] |
|
| Fund Name |
Voya Global High Dividend Low Volatility Fund
|
| Class Name |
Class R6
|
| Trading Symbol |
VGHRX
|
| Annual or Semi-Annual Statement [Text Block] |
This semi-annual shareholder report contains important information about Voya Global High Dividend Low Volatility Fund for the period of November 1, 2025 to April 30, 2026.
|
| Additional Information Phone Number |
1-800-992-0180
|
| Expenses [Text Block] |
What were the Fund’s costs for the last six months? (based on a hypothetical $10,000 investment)Table SummaryClass Name | Costs of $10K investment | Costs paid as % of $10K investment (Annualized) |
|---|
Class R6 | $31 | 0.59% |
|---|
|
| Expenses Paid, Amount |
$ 31
|
| Expense Ratio, Percent |
0.59%
|
| AssetsNet |
$ 277,560,220
|
| Holdings Count | Holding |
242
|
| InvestmentCompanyPortfolioTurnover |
33.00%
|
| Additional Fund Statistics [Text Block] |
- Total Net Assets$277,560,220
- # of Portfolio Holdings242
- Portfolio Turnover Rate33%
|
| Holdings [Text Block] |
Table SummaryValue | Value |
|---|
Assets in Excess of Other Liabilities | 1.4% | Countries-Other | 4.8% | Hong Kong | 0.9% | Norway | 1.0% | Spain | 1.1% | Germany | 1.4% | Netherlands | 1.9% | Australia | 2.2% | France | 2.9% | United Kingdom | 4.2% | Japan | 4.6% | Canada | 4.8% | United States | 68.8% | Table SummaryValue | Value |
|---|
Financials | 24.8% | Industrials | 13.2% | Health Care | 11.1% | Communication Services | 10.5% | Consumer Staples | 8.5% | Information Technology | 7.5% | Energy | 6.5% | Utilities | 5.5% | Consumer Discretionary | 4.1% | Real Estate | 3.9% | Materials | 3.0% | Exchange-Traded Funds | 0.9% | Short-Term Investments | 0.2% | Assets in Excess of Other Liabilities | 0.3% | |
| Largest Holdings [Text Block] |
Table SummaryAlphabet, Inc. - Class A | 3.9% |
|---|
Johnson & Johnson | 1.8% |
|---|
Meta Platforms, Inc. - Class A | 1.5% |
|---|
Cisco Systems, Inc. | 1.4% |
|---|
AbbVie, Inc. | 1.3% |
|---|
Coca-Cola Co. | 1.3% |
|---|
PepsiCo, Inc. | 1.0% |
|---|
Toronto-Dominion Bank | 1.0% |
|---|
Pfizer, Inc. | 0.9% |
|---|
TJX Cos., Inc. | 0.9% |
|---|
|
| C000079029 |
|
| Shareholder Report [Line Items] |
|
| Fund Name |
Voya Global High Dividend Low Volatility Fund
|
| Class Name |
Class W
|
| Trading Symbol |
IGVWX
|
| Annual or Semi-Annual Statement [Text Block] |
This semi-annual shareholder report contains important information about Voya Global High Dividend Low Volatility Fund for the period of November 1, 2025 to April 30, 2026.
|
| Additional Information Phone Number |
1-800-992-0180
|
| Expenses [Text Block] |
What were the Fund’s costs for the last six months? (based on a hypothetical $10,000 investment)Table SummaryClass Name | Costs of $10K investment | Costs paid as % of $10K investment (Annualized) |
|---|
Class W | $32 | 0.62% |
|---|
|
| Expenses Paid, Amount |
$ 32
|
| Expense Ratio, Percent |
0.62%
|
| AssetsNet |
$ 277,560,220
|
| Holdings Count | Holding |
242
|
| InvestmentCompanyPortfolioTurnover |
33.00%
|
| Additional Fund Statistics [Text Block] |
- Total Net Assets$277,560,220
- # of Portfolio Holdings242
- Portfolio Turnover Rate33%
|
| Holdings [Text Block] |
Table SummaryValue | Value |
|---|
Assets in Excess of Other Liabilities | 1.4% | Countries-Other | 4.8% | Hong Kong | 0.9% | Norway | 1.0% | Spain | 1.1% | Germany | 1.4% | Netherlands | 1.9% | Australia | 2.2% | France | 2.9% | United Kingdom | 4.2% | Japan | 4.6% | Canada | 4.8% | United States | 68.8% | Table SummaryValue | Value |
|---|
Financials | 24.8% | Industrials | 13.2% | Health Care | 11.1% | Communication Services | 10.5% | Consumer Staples | 8.5% | Information Technology | 7.5% | Energy | 6.5% | Utilities | 5.5% | Consumer Discretionary | 4.1% | Real Estate | 3.9% | Materials | 3.0% | Exchange-Traded Funds | 0.9% | Short-Term Investments | 0.2% | Assets in Excess of Other Liabilities | 0.3% | |
| Largest Holdings [Text Block] |
Table SummaryAlphabet, Inc. - Class A | 3.9% |
|---|
Johnson & Johnson | 1.8% |
|---|
Meta Platforms, Inc. - Class A | 1.5% |
|---|
Cisco Systems, Inc. | 1.4% |
|---|
AbbVie, Inc. | 1.3% |
|---|
Coca-Cola Co. | 1.3% |
|---|
PepsiCo, Inc. | 1.0% |
|---|
Toronto-Dominion Bank | 1.0% |
|---|
Pfizer, Inc. | 0.9% |
|---|
TJX Cos., Inc. | 0.9% |
|---|
|
| C000107874 |
|
| Shareholder Report [Line Items] |
|
| Fund Name |
Voya Multi-Manager Emerging Markets Equity Fund
|
| Class Name |
Class A
|
| Trading Symbol |
IEMHX
|
| Annual or Semi-Annual Statement [Text Block] |
This semi-annual shareholder report contains important information about Voya Multi-Manager Emerging Markets Equity Fund for the period of November 1, 2025 to April 30, 2026.
|
| Additional Information Phone Number |
1-800-992-0180
|
| Expenses [Text Block] |
What were the Fund’s costs for the last six months? (based on a hypothetical $10,000 investment)Table SummaryClass Name | Costs of $10K investment | Costs paid as % of $10K investment (Annualized) |
|---|
Class A | $82 | 1.48% |
|---|
|
| Expenses Paid, Amount |
$ 82
|
| Expense Ratio, Percent |
1.48%
|
| AssetsNet |
$ 241,656,015
|
| Holdings Count | Holding |
355
|
| InvestmentCompanyPortfolioTurnover |
39.00%
|
| Additional Fund Statistics [Text Block] |
- Total Net Assets$241,656,015
- # of Portfolio Holdings355
- Portfolio Turnover Rate39%
|
| Holdings [Text Block] |
Table SummaryValue | Value |
|---|
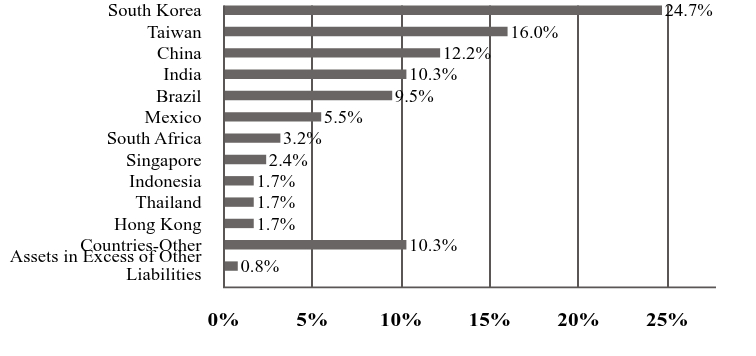
Assets in Excess of Other Liabilities | 0.8% | Countries-Other | 10.3% | Hong Kong | 1.7% | Thailand | 1.7% | Indonesia | 1.7% | Singapore | 2.4% | South Africa | 3.2% | Mexico | 5.5% | Brazil | 9.5% | India | 10.3% | China | 12.2% | Taiwan | 16.0% | South Korea | 24.7% | Table SummaryValue | Value |
|---|
Information Technology | 30.7% | Financials | 15.6% | Industrials | 13.1% | Consumer Discretionary | 12.0% | Communication Services | 7.1% | Consumer Staples | 6.8% | Energy | 5.3% | Materials | 3.3% | Utilities | 2.6% | Health Care | 1.4% | Real Estate | 1.3% | Exchange-Traded Funds | 0.2% | Short-Term Investments | 0.8% | Liabilities in Excess of Other Assets | (0.2)% | |
| Largest Holdings [Text Block] |
Table SummaryTaiwan Semiconductor Manufacturing Co. Ltd. | 11.1% |
|---|
SK Square Co. Ltd. | 6.7% |
|---|
SK Hynix, Inc. | 5.8% |
|---|
Samsung Electronics Co. Ltd. | 4.1% |
|---|
Tencent Holdings Ltd. | 2.7% |
|---|
Alibaba Group Holding Ltd. | 2.4% |
|---|
HDFC Bank Ltd. | 1.8% |
|---|
Yum China Holdings, Inc. | 1.7% |
|---|
AIA Group Ltd. | 1.7% |
|---|
Reliance Industries Ltd. | 1.6% |
|---|
|
| C000107875 |
|
| Shareholder Report [Line Items] |
|
| Fund Name |
Voya Multi-Manager Emerging Markets Equity Fund
|
| Class Name |
Class C
|
| Trading Symbol |
IEMJX
|
| Annual or Semi-Annual Statement [Text Block] |
This semi-annual shareholder report contains important information about Voya Multi-Manager Emerging Markets Equity Fund for the period of November 1, 2025 to April 30, 2026.
|
| Additional Information Phone Number |
1-800-992-0180
|
| Expenses [Text Block] |
What were the Fund’s costs for the last six months? (based on a hypothetical $10,000 investment)Table SummaryClass Name | Costs of $10K investment | Costs paid as % of $10K investment (Annualized) |
|---|
Class C | $124 | 2.23% |
|---|
|
| Expenses Paid, Amount |
$ 124
|
| Expense Ratio, Percent |
2.23%
|
| AssetsNet |
$ 241,656,015
|
| Holdings Count | Holding |
355
|
| InvestmentCompanyPortfolioTurnover |
39.00%
|
| Additional Fund Statistics [Text Block] |
- Total Net Assets$241,656,015
- # of Portfolio Holdings355
- Portfolio Turnover Rate39%
|
| Holdings [Text Block] |
Table SummaryValue | Value |
|---|
Assets in Excess of Other Liabilities | 0.8% | Countries-Other | 10.3% | Hong Kong | 1.7% | Thailand | 1.7% | Indonesia | 1.7% | Singapore | 2.4% | South Africa | 3.2% | Mexico | 5.5% | Brazil | 9.5% | India | 10.3% | China | 12.2% | Taiwan | 16.0% | South Korea | 24.7% | Table SummaryValue | Value |
|---|
Information Technology | 30.7% | Financials | 15.6% | Industrials | 13.1% | Consumer Discretionary | 12.0% | Communication Services | 7.1% | Consumer Staples | 6.8% | Energy | 5.3% | Materials | 3.3% | Utilities | 2.6% | Health Care | 1.4% | Real Estate | 1.3% | Exchange-Traded Funds | 0.2% | Short-Term Investments | 0.8% | Liabilities in Excess of Other Assets | (0.2)% | |
| Largest Holdings [Text Block] |
Table SummaryTaiwan Semiconductor Manufacturing Co. Ltd. | 11.1% |
|---|
SK Square Co. Ltd. | 6.7% |
|---|
SK Hynix, Inc. | 5.8% |
|---|
Samsung Electronics Co. Ltd. | 4.1% |
|---|
Tencent Holdings Ltd. | 2.7% |
|---|
Alibaba Group Holding Ltd. | 2.4% |
|---|
HDFC Bank Ltd. | 1.8% |
|---|
Yum China Holdings, Inc. | 1.7% |
|---|
AIA Group Ltd. | 1.7% |
|---|
Reliance Industries Ltd. | 1.6% |
|---|
|
| C000105125 |
|
| Shareholder Report [Line Items] |
|
| Fund Name |
Voya Multi-Manager Emerging Markets Equity Fund
|
| Class Name |
Class I
|
| Trading Symbol |
IEMGX
|
| Annual or Semi-Annual Statement [Text Block] |
This semi-annual shareholder report contains important information about Voya Multi-Manager Emerging Markets Equity Fund for the period of November 1, 2025 to April 30, 2026.
|
| Additional Information Phone Number |
1-800-992-0180
|
| Expenses [Text Block] |
What were the Fund’s costs for the last six months? (based on a hypothetical $10,000 investment)Table SummaryClass Name | Costs of $10K investment | Costs paid as % of $10K investment (Annualized) |
|---|
Class I | $63 | 1.13% |
|---|
|
| Expenses Paid, Amount |
$ 63
|
| Expense Ratio, Percent |
1.13%
|
| AssetsNet |
$ 241,656,015
|
| Holdings Count | Holding |
355
|
| InvestmentCompanyPortfolioTurnover |
39.00%
|
| Additional Fund Statistics [Text Block] |
- Total Net Assets$241,656,015
- # of Portfolio Holdings355
- Portfolio Turnover Rate39%
|
| Holdings [Text Block] |
Table SummaryValue | Value |
|---|
Assets in Excess of Other Liabilities | 0.8% | Countries-Other | 10.3% | Hong Kong | 1.7% | Thailand | 1.7% | Indonesia | 1.7% | Singapore | 2.4% | South Africa | 3.2% | Mexico | 5.5% | Brazil | 9.5% | India | 10.3% | China | 12.2% | Taiwan | 16.0% | South Korea | 24.7% | Table SummaryValue | Value |
|---|
Information Technology | 30.7% | Financials | 15.6% | Industrials | 13.1% | Consumer Discretionary | 12.0% | Communication Services | 7.1% | Consumer Staples | 6.8% | Energy | 5.3% | Materials | 3.3% | Utilities | 2.6% | Health Care | 1.4% | Real Estate | 1.3% | Exchange-Traded Funds | 0.2% | Short-Term Investments | 0.8% | Liabilities in Excess of Other Assets | (0.2)% | |
| Largest Holdings [Text Block] |
Table SummaryTaiwan Semiconductor Manufacturing Co. Ltd. | 11.1% |
|---|
SK Square Co. Ltd. | 6.7% |
|---|
SK Hynix, Inc. | 5.8% |
|---|
Samsung Electronics Co. Ltd. | 4.1% |
|---|
Tencent Holdings Ltd. | 2.7% |
|---|
Alibaba Group Holding Ltd. | 2.4% |
|---|
HDFC Bank Ltd. | 1.8% |
|---|
Yum China Holdings, Inc. | 1.7% |
|---|
AIA Group Ltd. | 1.7% |
|---|
Reliance Industries Ltd. | 1.6% |
|---|
|
| C000107876 |
|
| Shareholder Report [Line Items] |
|
| Fund Name |
Voya Multi-Manager Emerging Markets Equity Fund
|
| Class Name |
Class R
|
| Trading Symbol |
IEMKX
|
| Annual or Semi-Annual Statement [Text Block] |
This semi-annual shareholder report contains important information about Voya Multi-Manager Emerging Markets Equity Fund for the period of November 1, 2025 to April 30, 2026.
|
| Additional Information Phone Number |
1-800-992-0180
|
| Expenses [Text Block] |
What were the Fund’s costs for the last six months? (based on a hypothetical $10,000 investment)Table SummaryClass Name | Costs of $10K investment | Costs paid as % of $10K investment (Annualized) |
|---|
Class R | $96 | 1.73% |
|---|
|
| Expenses Paid, Amount |
$ 96
|
| Expense Ratio, Percent |
1.73%
|
| AssetsNet |
$ 241,656,015
|
| Holdings Count | Holding |
355
|
| InvestmentCompanyPortfolioTurnover |
39.00%
|
| Additional Fund Statistics [Text Block] |
- Total Net Assets$241,656,015
- # of Portfolio Holdings355
- Portfolio Turnover Rate39%
|
| Holdings [Text Block] |
Table SummaryValue | Value |
|---|
Assets in Excess of Other Liabilities | 0.8% | Countries-Other | 10.3% | Hong Kong | 1.7% | Thailand | 1.7% | Indonesia | 1.7% | Singapore | 2.4% | South Africa | 3.2% | Mexico | 5.5% | Brazil | 9.5% | India | 10.3% | China | 12.2% | Taiwan | 16.0% | South Korea | 24.7% | Table SummaryValue | Value |
|---|
Information Technology | 30.7% | Financials | 15.6% | Industrials | 13.1% | Consumer Discretionary | 12.0% | Communication Services | 7.1% | Consumer Staples | 6.8% | Energy | 5.3% | Materials | 3.3% | Utilities | 2.6% | Health Care | 1.4% | Real Estate | 1.3% | Exchange-Traded Funds | 0.2% | Short-Term Investments | 0.8% | Liabilities in Excess of Other Assets | (0.2)% | |
| Largest Holdings [Text Block] |
Table SummaryTaiwan Semiconductor Manufacturing Co. Ltd. | 11.1% |
|---|
SK Square Co. Ltd. | 6.7% |
|---|
SK Hynix, Inc. | 5.8% |
|---|
Samsung Electronics Co. Ltd. | 4.1% |
|---|
Tencent Holdings Ltd. | 2.7% |
|---|
Alibaba Group Holding Ltd. | 2.4% |
|---|
HDFC Bank Ltd. | 1.8% |
|---|
Yum China Holdings, Inc. | 1.7% |
|---|
AIA Group Ltd. | 1.7% |
|---|
Reliance Industries Ltd. | 1.6% |
|---|
|
| C000107877 |
|
| Shareholder Report [Line Items] |
|
| Fund Name |
Voya Multi-Manager Emerging Markets Equity Fund
|
| Class Name |
Class W
|
| Trading Symbol |
IEMLX
|
| Annual or Semi-Annual Statement [Text Block] |
This semi-annual shareholder report contains important information about Voya Multi-Manager Emerging Markets Equity Fund for the period of November 1, 2025 to April 30, 2026.
|
| Additional Information Phone Number |
1-800-992-0180
|
| Expenses [Text Block] |
What were the Fund’s costs for the last six months? (based on a hypothetical $10,000 investment)Table SummaryClass Name | Costs of $10K investment | Costs paid as % of $10K investment (Annualized) |
|---|
Class W | $68 | 1.23% |
|---|
|
| Expenses Paid, Amount |
$ 68
|
| Expense Ratio, Percent |
1.23%
|
| AssetsNet |
$ 241,656,015
|
| Holdings Count | Holding |
355
|
| InvestmentCompanyPortfolioTurnover |
39.00%
|
| Additional Fund Statistics [Text Block] |
- Total Net Assets$241,656,015
- # of Portfolio Holdings355
- Portfolio Turnover Rate39%
|
| Holdings [Text Block] |
Table SummaryValue | Value |
|---|
Assets in Excess of Other Liabilities | 0.8% | Countries-Other | 10.3% | Hong Kong | 1.7% | Thailand | 1.7% | Indonesia | 1.7% | Singapore | 2.4% | South Africa | 3.2% | Mexico | 5.5% | Brazil | 9.5% | India | 10.3% | China | 12.2% | Taiwan | 16.0% | South Korea | 24.7% | Table SummaryValue | Value |
|---|
Information Technology | 30.7% | Financials | 15.6% | Industrials | 13.1% | Consumer Discretionary | 12.0% | Communication Services | 7.1% | Consumer Staples | 6.8% | Energy | 5.3% | Materials | 3.3% | Utilities | 2.6% | Health Care | 1.4% | Real Estate | 1.3% | Exchange-Traded Funds | 0.2% | Short-Term Investments | 0.8% | Liabilities in Excess of Other Assets | (0.2)% | |
| Largest Holdings [Text Block] |
Table SummaryTaiwan Semiconductor Manufacturing Co. Ltd. | 11.1% |
|---|
SK Square Co. Ltd. | 6.7% |
|---|
SK Hynix, Inc. | 5.8% |
|---|
Samsung Electronics Co. Ltd. | 4.1% |
|---|
Tencent Holdings Ltd. | 2.7% |
|---|
Alibaba Group Holding Ltd. | 2.4% |
|---|
HDFC Bank Ltd. | 1.8% |
|---|
Yum China Holdings, Inc. | 1.7% |
|---|
AIA Group Ltd. | 1.7% |
|---|
Reliance Industries Ltd. | 1.6% |
|---|
|
| C000094856 |
|
| Shareholder Report [Line Items] |
|
| Fund Name |
Voya Multi-Manager International Equity Fund
|
| Class Name |
Class I
|
| Trading Symbol |
IIGIX
|
| Annual or Semi-Annual Statement [Text Block] |
This semi-annual shareholder report contains important information about Voya Multi-Manager International Equity Fund for the period of November 1, 2025 to April 30, 2026.
|
| Additional Information Phone Number |
1-800-992-0180
|
| Expenses [Text Block] |
What were the Fund’s costs for the last six months? (based on a hypothetical $10,000 investment)Table SummaryClass Name | Costs of $10K investment | Costs paid as % of $10K investment (Annualized) |
|---|
Class I | $46 | 0.88% |
|---|
|
| Expenses Paid, Amount |
$ 46
|
| Expense Ratio, Percent |
0.88%
|
| AssetsNet |
$ 642,315,453
|
| Holdings Count | Holding |
587
|
| InvestmentCompanyPortfolioTurnover |
40.00%
|
| Additional Fund Statistics [Text Block] |
- Total Net Assets$642,315,453
- # of Portfolio Holdings587
- Portfolio Turnover Rate40%
|
| Holdings [Text Block] |
Table SummaryValue | Value |
|---|
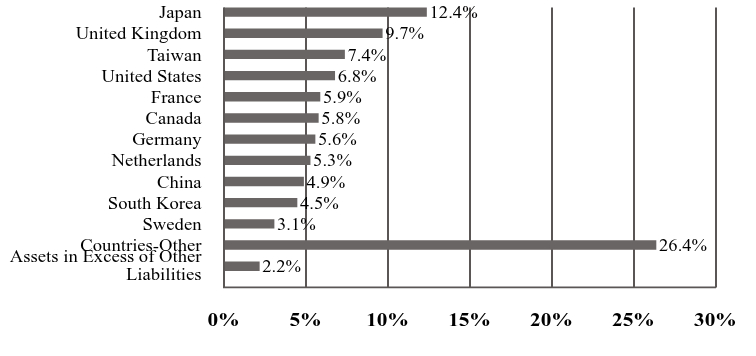
Assets in Excess of Other Liabilities | 2.2% | Countries-Other | 26.4% | Sweden | 3.1% | South Korea | 4.5% | China | 4.9% | Netherlands | 5.3% | Germany | 5.6% | Canada | 5.8% | France | 5.9% | United States | 6.8% | Taiwan | 7.4% | United Kingdom | 9.7% | Japan | 12.4% | Table SummaryValue | Value |
|---|
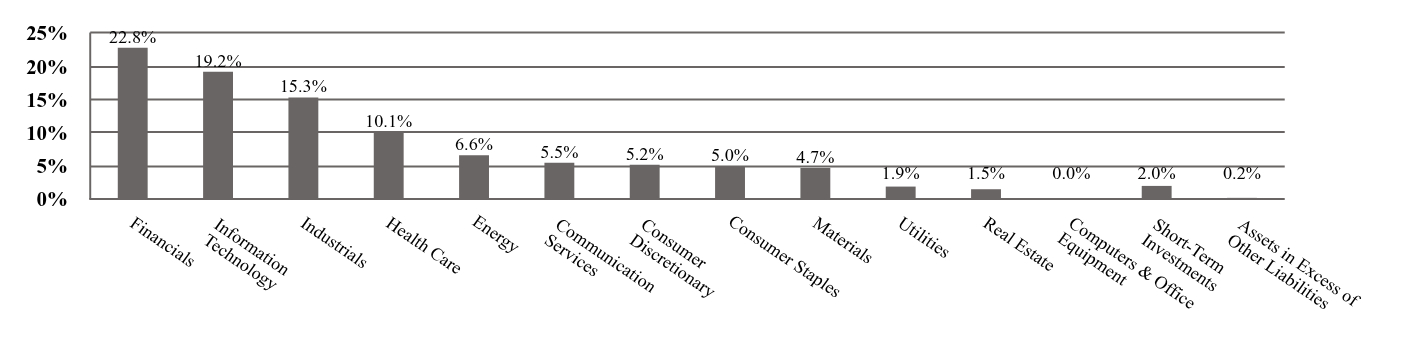
Financials | 22.8% | Information Technology | 19.2% | Industrials | 15.3% | Health Care | 10.1% | Energy | 6.6% | Communication Services | 5.5% | Consumer Discretionary | 5.2% | Consumer Staples | 5.0% | Materials | 4.7% | Utilities | 1.9% | Real Estate | 1.5% | Computers & Office Equipment | 0.0% | Short-Term Investments | 2.0% | Assets in Excess of Other Liabilities | 0.2% | |
| Largest Holdings [Text Block] |
Table SummaryTaiwan Semiconductor Manufacturing Co. Ltd. | 3.5% |
|---|
ASML Holding NV | 1.7% |
|---|
Samsung Electronics Co. Ltd. | 1.7% |
|---|
Tencent Holdings Ltd. | 1.3% |
|---|
GSK PLC | 1.2% |
|---|
Roche Holding AG | 1.2% |
|---|
London Stock Exchange Group PLC | 1.0% |
|---|
SK Hynix, Inc. | 1.0% |
|---|
Novo Nordisk A/S - Class B | 0.9% |
|---|
AIA Group Ltd. | 0.9% |
|---|
|
| C000023423 |
|
| Shareholder Report [Line Items] |
|
| Fund Name |
Voya Multi-Manager International Small Cap Fund
|
| Class Name |
Class A
|
| Trading Symbol |
NTKLX
|
| Annual or Semi-Annual Statement [Text Block] |
This semi-annual shareholder report contains important information about Voya Multi-Manager International Small Cap Fund for the period of November 1, 2025 to April 30, 2026.
|
| Additional Information Phone Number |
1-800-992-0180
|
| Expenses [Text Block] |
What were the Fund’s costs for the last six months? (based on a hypothetical $10,000 investment)Table SummaryClass Name | Costs of $10K investment | Costs paid as % of $10K investment (Annualized) |
|---|
Class A | $78 | 1.46% |
|---|
|
| Expenses Paid, Amount |
$ 78
|
| Expense Ratio, Percent |
1.46%
|
| AssetsNet |
$ 584,537,341
|
| Holdings Count | Holding |
1,429
|
| InvestmentCompanyPortfolioTurnover |
39.00%
|
| Additional Fund Statistics [Text Block] |
- Total Net Assets$584,537,341
- # of Portfolio Holdings1,429
- Portfolio Turnover Rate39%
|
| Holdings [Text Block] |
Table SummaryValue | Value |
|---|
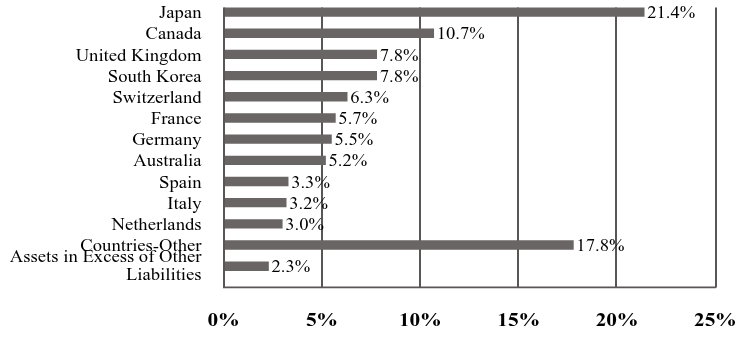
Assets in Excess of Other Liabilities | 2.3% | Countries-Other | 17.8% | Netherlands | 3.0% | Italy | 3.2% | Spain | 3.3% | Australia | 5.2% | Germany | 5.5% | France | 5.7% | Switzerland | 6.3% | South Korea | 7.8% | United Kingdom | 7.8% | Canada | 10.7% | Japan | 21.4% | Table SummaryValue | Value |
|---|
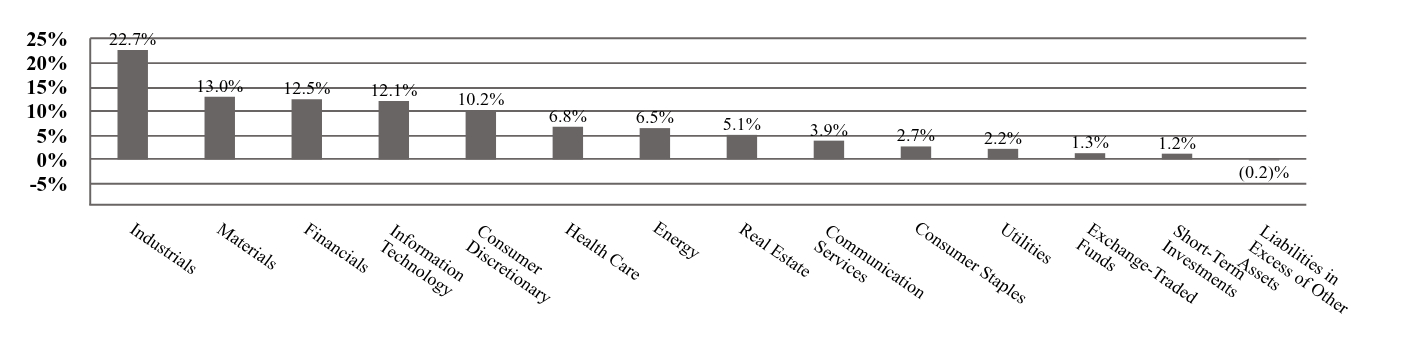
Industrials | 22.7% | Materials | 13.0% | Financials | 12.5% | Information Technology | 12.1% | Consumer Discretionary | 10.2% | Health Care | 6.8% | Energy | 6.5% | Real Estate | 5.1% | Communication Services | 3.9% | Consumer Staples | 2.7% | Utilities | 2.2% | Exchange-Traded Funds | 1.3% | Short-Term Investments | 1.2% | Liabilities in Excess of Other Assets | (0.2)% | |
| Largest Holdings [Text Block] |
Table SummaryKlepierre SA | 1.1% |
|---|
Vanguard FTSE Developed Markets ETF | 1.0% |
|---|
Hudbay Minerals, Inc. | 0.8% |
|---|
OceanaGold Corp. | 0.8% |
|---|
Mitsui Mining & Smelting Co. Ltd. | 0.8% |
|---|
Dufry AG | 0.8% |
|---|
Bankinter SA | 0.8% |
|---|
Accelleron Industries AG | 0.7% |
|---|
Nordex SE | 0.7% |
|---|
Eiffage SA | 0.7% |
|---|
|
| C000023425 |
|
| Shareholder Report [Line Items] |
|
| Fund Name |
Voya Multi-Manager International Small Cap Fund
|
| Class Name |
Class C
|
| Trading Symbol |
NARCX
|
| Annual or Semi-Annual Statement [Text Block] |
This semi-annual shareholder report contains important information about Voya Multi-Manager International Small Cap Fund for the period of November 1, 2025 to April 30, 2026.
|
| Additional Information Phone Number |
1-800-992-0180
|
| Expenses [Text Block] |
What were the Fund’s costs for the last six months? (based on a hypothetical $10,000 investment)Table SummaryClass Name | Costs of $10K investment | Costs paid as % of $10K investment (Annualized) |
|---|
Class C | $118 | 2.21% |
|---|
|
| Expenses Paid, Amount |
$ 118
|
| Expense Ratio, Percent |
2.21%
|
| AssetsNet |
$ 584,537,341
|
| Holdings Count | Holding |
1,429
|
| InvestmentCompanyPortfolioTurnover |
39.00%
|
| Additional Fund Statistics [Text Block] |
- Total Net Assets$584,537,341
- # of Portfolio Holdings1,429
- Portfolio Turnover Rate39%
|
| Holdings [Text Block] |
Table SummaryValue | Value |
|---|
Assets in Excess of Other Liabilities | 2.3% | Countries-Other | 17.8% | Netherlands | 3.0% | Italy | 3.2% | Spain | 3.3% | Australia | 5.2% | Germany | 5.5% | France | 5.7% | Switzerland | 6.3% | South Korea | 7.8% | United Kingdom | 7.8% | Canada | 10.7% | Japan | 21.4% | Table SummaryValue | Value |
|---|
Industrials | 22.7% | Materials | 13.0% | Financials | 12.5% | Information Technology | 12.1% | Consumer Discretionary | 10.2% | Health Care | 6.8% | Energy | 6.5% | Real Estate | 5.1% | Communication Services | 3.9% | Consumer Staples | 2.7% | Utilities | 2.2% | Exchange-Traded Funds | 1.3% | Short-Term Investments | 1.2% | Liabilities in Excess of Other Assets | (0.2)% | |
| Largest Holdings [Text Block] |
Table SummaryKlepierre SA | 1.1% |
|---|
Vanguard FTSE Developed Markets ETF | 1.0% |
|---|
Hudbay Minerals, Inc. | 0.8% |
|---|
OceanaGold Corp. | 0.8% |
|---|
Mitsui Mining & Smelting Co. Ltd. | 0.8% |
|---|
Dufry AG | 0.8% |
|---|
Bankinter SA | 0.8% |
|---|
Accelleron Industries AG | 0.7% |
|---|
Nordex SE | 0.7% |
|---|
Eiffage SA | 0.7% |
|---|
|
| C000023426 |
|
| Shareholder Report [Line Items] |
|
| Fund Name |
Voya Multi-Manager International Small Cap Fund
|
| Class Name |
Class I
|
| Trading Symbol |
NAPIX
|
| Annual or Semi-Annual Statement [Text Block] |
This semi-annual shareholder report contains important information about Voya Multi-Manager International Small Cap Fund for the period of November 1, 2025 to April 30, 2026.
|
| Additional Information Phone Number |
1-800-992-0180
|
| Expenses [Text Block] |
What were the Fund’s costs for the last six months? (based on a hypothetical $10,000 investment)Table SummaryClass Name | Costs of $10K investment | Costs paid as % of $10K investment (Annualized) |
|---|
Class I | $63 | 1.18% |
|---|
|
| Expenses Paid, Amount |
$ 63
|
| Expense Ratio, Percent |
1.18%
|
| AssetsNet |
$ 584,537,341
|
| Holdings Count | Holding |
1,429
|
| InvestmentCompanyPortfolioTurnover |
39.00%
|
| Additional Fund Statistics [Text Block] |
- Total Net Assets$584,537,341
- # of Portfolio Holdings1,429
- Portfolio Turnover Rate39%
|
| Holdings [Text Block] |
Table SummaryValue | Value |
|---|
Assets in Excess of Other Liabilities | 2.3% | Countries-Other | 17.8% | Netherlands | 3.0% | Italy | 3.2% | Spain | 3.3% | Australia | 5.2% | Germany | 5.5% | France | 5.7% | Switzerland | 6.3% | South Korea | 7.8% | United Kingdom | 7.8% | Canada | 10.7% | Japan | 21.4% | Table SummaryValue | Value |
|---|
Industrials | 22.7% | Materials | 13.0% | Financials | 12.5% | Information Technology | 12.1% | Consumer Discretionary | 10.2% | Health Care | 6.8% | Energy | 6.5% | Real Estate | 5.1% | Communication Services | 3.9% | Consumer Staples | 2.7% | Utilities | 2.2% | Exchange-Traded Funds | 1.3% | Short-Term Investments | 1.2% | Liabilities in Excess of Other Assets | (0.2)% | |
| Largest Holdings [Text Block] |
Table SummaryKlepierre SA | 1.1% |
|---|
Vanguard FTSE Developed Markets ETF | 1.0% |
|---|
Hudbay Minerals, Inc. | 0.8% |
|---|
OceanaGold Corp. | 0.8% |
|---|
Mitsui Mining & Smelting Co. Ltd. | 0.8% |
|---|
Dufry AG | 0.8% |
|---|
Bankinter SA | 0.8% |
|---|
Accelleron Industries AG | 0.7% |
|---|
Nordex SE | 0.7% |
|---|
Eiffage SA | 0.7% |
|---|
|
| C000241253 |
|
| Shareholder Report [Line Items] |
|
| Fund Name |
Voya Multi-Manager International Small Cap Fund
|
| Class Name |
Class R6
|
| Trading Symbol |
VVJFX
|
| Annual or Semi-Annual Statement [Text Block] |
This semi-annual shareholder report contains important information about Voya Multi-Manager International Small Cap Fund for the period of November 1, 2025 to April 30, 2026.
|
| Additional Information Phone Number |
1-800-992-0180
|
| Expenses [Text Block] |
What were the Fund’s costs for the last six months? (based on a hypothetical $10,000 investment)Table SummaryClass Name | Costs of $10K investment | Costs paid as % of $10K investment (Annualized) |
|---|
Class R6 | $60 | 1.11% |
|---|
|
| Expenses Paid, Amount |
$ 60
|
| Expense Ratio, Percent |
1.11%
|
| AssetsNet |
$ 584,537,341
|
| Holdings Count | Holding |
1,429
|
| InvestmentCompanyPortfolioTurnover |
39.00%
|
| Additional Fund Statistics [Text Block] |
- Total Net Assets$584,537,341
- # of Portfolio Holdings1,429
- Portfolio Turnover Rate39%
|
| Holdings [Text Block] |
Table SummaryValue | Value |
|---|
Assets in Excess of Other Liabilities | 2.3% | Countries-Other | 17.8% | Netherlands | 3.0% | Italy | 3.2% | Spain | 3.3% | Australia | 5.2% | Germany | 5.5% | France | 5.7% | Switzerland | 6.3% | South Korea | 7.8% | United Kingdom | 7.8% | Canada | 10.7% | Japan | 21.4% | Table SummaryValue | Value |
|---|
Industrials | 22.7% | Materials | 13.0% | Financials | 12.5% | Information Technology | 12.1% | Consumer Discretionary | 10.2% | Health Care | 6.8% | Energy | 6.5% | Real Estate | 5.1% | Communication Services | 3.9% | Consumer Staples | 2.7% | Utilities | 2.2% | Exchange-Traded Funds | 1.3% | Short-Term Investments | 1.2% | Liabilities in Excess of Other Assets | (0.2)% | |
| Largest Holdings [Text Block] |
Table SummaryKlepierre SA | 1.1% |
|---|
Vanguard FTSE Developed Markets ETF | 1.0% |
|---|
Hudbay Minerals, Inc. | 0.8% |
|---|
OceanaGold Corp. | 0.8% |
|---|
Mitsui Mining & Smelting Co. Ltd. | 0.8% |
|---|
Dufry AG | 0.8% |
|---|
Bankinter SA | 0.8% |
|---|
Accelleron Industries AG | 0.7% |
|---|
Nordex SE | 0.7% |
|---|
Eiffage SA | 0.7% |
|---|
|
| C000059862 |
|
| Shareholder Report [Line Items] |
|
| Fund Name |
Voya Multi-Manager International Small Cap Fund
|
| Class Name |
Class W
|
| Trading Symbol |
ISCWX
|
| Annual or Semi-Annual Statement [Text Block] |
This semi-annual shareholder report contains important information about Voya Multi-Manager International Small Cap Fund for the period of November 1, 2025 to April 30, 2026.
|
| Additional Information Phone Number |
1-800-992-0180
|
| Expenses [Text Block] |
What were the Fund’s costs for the last six months? (based on a hypothetical $10,000 investment)Table SummaryClass Name | Costs of $10K investment | Costs paid as % of $10K investment (Annualized) |
|---|
Class W | $65 | 1.21% |
|---|
|
| Expenses Paid, Amount |
$ 65
|
| Expense Ratio, Percent |
1.21%
|
| AssetsNet |
$ 584,537,341
|
| Holdings Count | Holding |
1,429
|
| InvestmentCompanyPortfolioTurnover |
39.00%
|
| Additional Fund Statistics [Text Block] |
- Total Net Assets$584,537,341
- # of Portfolio Holdings1,429
- Portfolio Turnover Rate39%
|
| Holdings [Text Block] |
Table SummaryValue | Value |
|---|
Assets in Excess of Other Liabilities | 2.3% | Countries-Other | 17.8% | Netherlands | 3.0% | Italy | 3.2% | Spain | 3.3% | Australia | 5.2% | Germany | 5.5% | France | 5.7% | Switzerland | 6.3% | South Korea | 7.8% | United Kingdom | 7.8% | Canada | 10.7% | Japan | 21.4% | Table SummaryValue | Value |
|---|
Industrials | 22.7% | Materials | 13.0% | Financials | 12.5% | Information Technology | 12.1% | Consumer Discretionary | 10.2% | Health Care | 6.8% | Energy | 6.5% | Real Estate | 5.1% | Communication Services | 3.9% | Consumer Staples | 2.7% | Utilities | 2.2% | Exchange-Traded Funds | 1.3% | Short-Term Investments | 1.2% | Liabilities in Excess of Other Assets | (0.2)% | |
| Largest Holdings [Text Block] |
Table SummaryKlepierre SA | 1.1% |
|---|
Vanguard FTSE Developed Markets ETF | 1.0% |
|---|
Hudbay Minerals, Inc. | 0.8% |
|---|
OceanaGold Corp. | 0.8% |
|---|
Mitsui Mining & Smelting Co. Ltd. | 0.8% |
|---|
Dufry AG | 0.8% |
|---|
Bankinter SA | 0.8% |
|---|
Accelleron Industries AG | 0.7% |
|---|
Nordex SE | 0.7% |
|---|
Eiffage SA | 0.7% |
|---|
|
| C000240818 |
|
| Shareholder Report [Line Items] |
|
| Fund Name |
Voya VACS Series EME Fund
|
| Class Name |
Portfolio
|
| Trading Symbol |
VVIFX
|
| Annual or Semi-Annual Statement [Text Block] |
This semi-annual shareholder report contains important information about Voya VACS Series EME Fund for the period of November 1, 2025 to April 30, 2026.
|
| Additional Information Phone Number |
1-800-992-0180
|
| Expenses [Text Block] |
What were the Fund’s costs for the last six months? (based on a hypothetical $10,000 investment)Table SummaryClass Name | Costs of $10K investment | Costs paid as % of $10K investment (Annualized) |
|---|
VACS Series | $9 | 0.16% |
|---|
|
| Expenses Paid, Amount |
$ 9
|
| Expense Ratio, Percent |
0.16%
|
| AssetsNet |
$ 344,137,445
|
| Holdings Count | Holding |
333
|
| InvestmentCompanyPortfolioTurnover |
50.00%
|
| Additional Fund Statistics [Text Block] |
- Total Net Assets$344,137,445
- # of Portfolio Holdings333
- Portfolio Turnover Rate50%
|
| Holdings [Text Block] |
Table SummaryValue | Value |
|---|
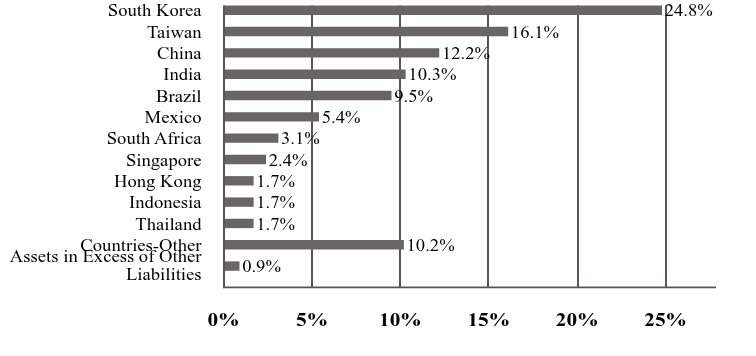
Assets in Excess of Other Liabilities | 0.9% | Countries-Other | 10.2% | Thailand | 1.7% | Indonesia | 1.7% | Hong Kong | 1.7% | Singapore | 2.4% | South Africa | 3.1% | Mexico | 5.4% | Brazil | 9.5% | India | 10.3% | China | 12.2% | Taiwan | 16.1% | South Korea | 24.8% | Table SummaryValue | Value |
|---|
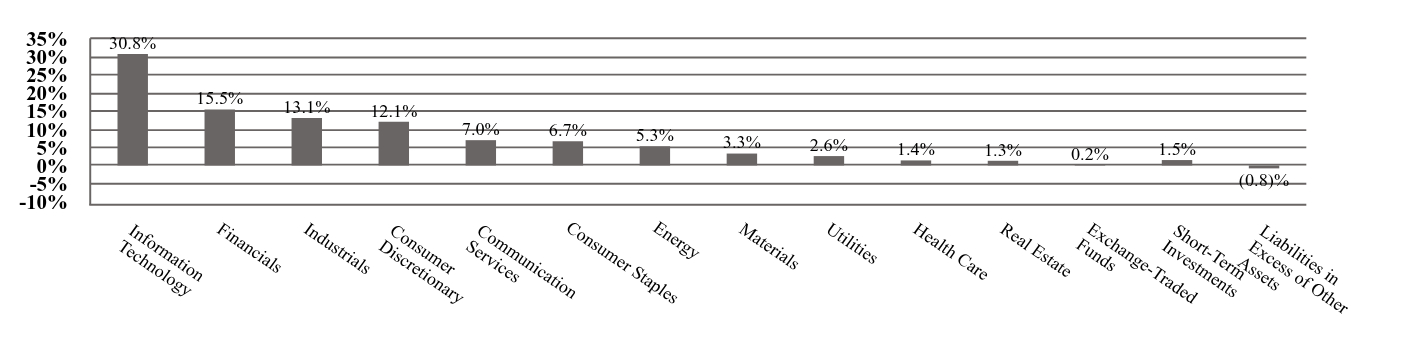
Information Technology | 30.8% | Financials | 15.5% | Industrials | 13.1% | Consumer Discretionary | 12.1% | Communication Services | 7.0% | Consumer Staples | 6.7% | Energy | 5.3% | Materials | 3.3% | Utilities | 2.6% | Health Care | 1.4% | Real Estate | 1.3% | Exchange-Traded Funds | 0.2% | Short-Term Investments | 1.5% | Liabilities in Excess of Other Assets | (0.8)% | |
| Largest Holdings [Text Block] |
Table SummaryTaiwan Semiconductor Manufacturing Co. Ltd. | 11.1% |
|---|
SK Square Co. Ltd. | 6.8% |
|---|
SK Hynix, Inc. | 5.8% |
|---|
Samsung Electronics Co. Ltd. | 4.2% |
|---|
Tencent Holdings Ltd. | 2.7% |
|---|
Alibaba Group Holding Ltd. | 2.4% |
|---|
HDFC Bank Ltd. | 1.8% |
|---|
Yum China Holdings, Inc. | 1.7% |
|---|
AIA Group Ltd. | 1.7% |
|---|
Reliance Industries Ltd. | 1.6% |
|---|
|