| Class name | Costs of a $10,000 investment | Costs paid as a percentage of a $10,000 investment |
|---|---|---|
| Class A | $94 | 0.91% |
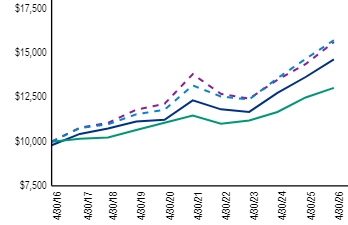
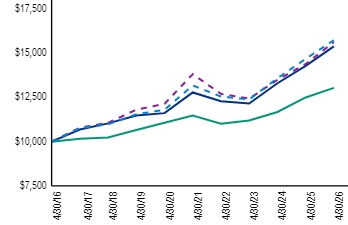
The share class had a 7.27% total return in the 12 months ended April 30, 2026, compared with the ICE BofA 1-3 Year U.S. Corporate Index, which returned 4.33%, and the ICE BofA U.S. All Capital Securities Index, which returned 8.64%.
The Fund's benchmark, the ICE BofA 1–3 Year U.S. Corporate Index, focuses on investment-grade corporate bonds with maturities of one to three years. The Fund's primary objective is to seek to provide high current income, and its secondary objective is to provide capital preservation; we believe this is consistent with the benchmark over time. However, to meet its objectives, the Fund invests in low-duration preferred securities as well as shorter-term corporate bonds.
The Fund's allocations to over-the-counter fixed-to-reset preferred securities with six months to five years of call protection contributed to relative performance versus the ICE BofA 1–3 Year U.S. Corporate Index. Allocations to contingent capital securities (CoCos) with two to five years of call protection also contributed to relative performance.
The Fund's allocations to interest rate swaps and total return swaps, used to hedge and manage interest rate and credit risk modestly detracted from relative performance. While these hedges modestly detracted from performance, the portfolio's securities' returns more than offset the associated hedging costs. Allocations to exchange-traded fixed-to-float preferreds with more than five years of call protection also modestly detracted from relative performance.
By sector, the Fund's allocations to preferred securities in the banking, utilities and insurance sectors contributed the most to relative performance. No sectors detracted from relative performance.
Top contributors |
Top detractors |
|---|---|
Banking |
Total Return Swaps |
Utilities |
Interest Rate Swaps |
Insurance |
(as of April 30, 2026)
| 1 Year | 5 Years | 10 Years | |
|---|---|---|---|
| With sales charge2 | 5.12% | 3.08% | 3.90% |
| Without sales charge | 7.27% | 3.50% | 4.11% |
| ICE BofA U.S. All Capital Securities Index | 8.64% | 2.50% | 4.58% |
| ICE BofA 1-3 Year U.S. Corporate Index | 4.33% | 2.59% | 2.70% |
| Blended Benchmark1 | 7.21% | 3.62% | 4.65% |
| Net assets | $1,935,098,596 |
|---|---|
| Number of portfolio holdings (excluding derivatives) | |
| Portfolio turnover rate | 46% |
| Net advisory fees paid | $8,065,915 |
| Top ten holdings3,4 | (%) |
|---|---|
| Truist Financial Corp., 6.669%, Series N | |
| Citigroup, Inc., 6.875%, Series GG | |
| UBS Group AG, 6.625%, (Switzerland) | |
| Royal Bank of Canada, 6.75%, due 8/24/85 (Canada) |
|
| Transcanada Trust, 5.875%, due 8/15/76, Series 16-A (Canada) |
|
| Enbridge, Inc., 8.25%, due 1/15/84, Series NC5 (Canada) |
|
| HSBC Holdings PLC, 7.05% (United Kingdom) | |
| Citigroup, Inc., 7.625%, Series AA | |
| BNP Paribas SA, 8.00% (France) | |
| Emera, Inc., 6.75%, due 6/15/76, Series 16-A (Canada) |
| Sector diversification3,5 | (%) |
|---|---|
| Banking | |
| Utilities | |
| Pipelines | |
| Insurance | |
| Real Estate | |
| Telecommunications | |
| Financial Services | |
| Health Care | |
| Consumer Discretionary Products | |
| Other (includes short-term investments) |
| Country diversification3,5 | (%) |
|---|---|
| United States | |
| Canada | |
| United Kingdom | |
| France | |
| Switzerland | |
| Spain | |
| Japan | |
| Germany | |
| Netherlands | |
| Other (includes short-term investments) |
| Top ten holdings3,4 | (%) |
|---|---|
| Truist Financial Corp., 6.669%, Series N | |
| Citigroup, Inc., 6.875%, Series GG | |
| UBS Group AG, 6.625%, (Switzerland) | |
| Royal Bank of Canada, 6.75%, due 8/24/85 (Canada) |
|
| Transcanada Trust, 5.875%, due 8/15/76, Series 16-A (Canada) |
|
| Enbridge, Inc., 8.25%, due 1/15/84, Series NC5 (Canada) |
|
| HSBC Holdings PLC, 7.05% (United Kingdom) | |
| Citigroup, Inc., 7.625%, Series AA | |
| BNP Paribas SA, 8.00% (France) | |
| Emera, Inc., 6.75%, due 6/15/76, Series 16-A (Canada) |
This is a summary of certain upcoming material changes to the Fund. For more complete information, you may review the Fund's current prospectus, which is available upon request by calling 1-800-330-7348.
How will the Fund change?
Fund name change
On June 16, 2026, the Fund's Board of Directors approved changing the Fund's name to "Cohen & Steers Short Duration Preferred and Income Fund, Inc." effective August 28, 2026. There will be no changes to the Fund's investment policies, principal investment strategies or principal risks in connection with this change.
| Class name | Costs of a $10,000 investment | Costs paid as a percentage of a $10,000 investment |
|---|---|---|
| Class C | $165 | 1.60% |
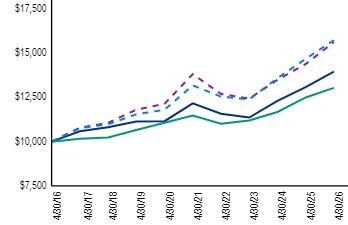
The share class had a 6.65% total return in the 12 months ended April 30, 2026, compared with the ICE BofA 1-3 Year U.S. Corporate Index, which returned 4.33%, and the ICE BofA U.S. All Capital Securities Index, which returned 8.64%.
The Fund's benchmark, the ICE BofA 1–3 Year U.S. Corporate Index, focuses on investment-grade corporate bonds with maturities of one to three years. The Fund's primary objective is to seek to provide high current income, and its secondary objective is to provide capital preservation; we believe this is consistent with the benchmark over time. However, to meet its objectives, the Fund invests in low-duration preferred securities as well as shorter-term corporate bonds.
The Fund's allocations to over-the-counter fixed-to-reset preferred securities with six months to five years of call protection contributed to relative performance versus the ICE BofA 1–3 Year U.S. Corporate Index. Allocations to contingent capital securities (CoCos) with two to five years of call protection also contributed to relative performance.
The Fund's allocations to interest rate swaps and total return swaps, used to hedge and manage interest rate and credit risk modestly detracted from relative performance. While these hedges modestly detracted from performance, the portfolio's securities' returns more than offset the associated hedging costs. Allocations to exchange-traded fixed-to-float preferreds with more than five years of call protection also modestly detracted from relative performance.
By sector, the Fund's allocations to preferred securities in the banking, utilities and insurance sectors contributed the most to relative performance. No sectors detracted from relative performance.
Top contributors |
Top detractors |
|---|---|
Banking |
Total Return Swaps |
Utilities |
Interest Rate Swaps |
Insurance |
(as of April 30, 2026)
| 1 Year | 5 Years | 10 Years | |
|---|---|---|---|
| With sales charge | 5.65%2 | 2.78% | 3.39% |
| Without sales charge | 6.65% | 2.78% | 3.39% |
| ICE BofA U.S. All Capital Securities Index | 8.64% | 2.50% | 4.58% |
| ICE BofA 1-3 Year U.S. Corporate Index | 4.33% | 2.59% | 2.70% |
| Blended Benchmark1 | 7.21% | 3.62% | 4.65% |
| Net assets | $1,935,098,596 |
|---|---|
| Number of portfolio holdings (excluding derivatives) | |
| Portfolio turnover rate | 46% |
| Net advisory fees paid | $8,065,915 |
| Top ten holdings3,4 | (%) |
|---|---|
| Truist Financial Corp., 6.669%, Series N | |
| Citigroup, Inc., 6.875%, Series GG | |
| UBS Group AG, 6.625%, (Switzerland) | |
| Royal Bank of Canada, 6.75%, due 8/24/85 (Canada) |
|
| Transcanada Trust, 5.875%, due 8/15/76, Series 16-A (Canada) |
|
| Enbridge, Inc., 8.25%, due 1/15/84, Series NC5 (Canada) |
|
| HSBC Holdings PLC, 7.05% (United Kingdom) | |
| Citigroup, Inc., 7.625%, Series AA | |
| BNP Paribas SA, 8.00% (France) | |
| Emera, Inc., 6.75%, due 6/15/76, Series 16-A (Canada) |
| Sector diversification3,5 | (%) |
|---|---|
| Banking | |
| Utilities | |
| Pipelines | |
| Insurance | |
| Real Estate | |
| Telecommunications | |
| Financial Services | |
| Health Care | |
| Consumer Discretionary Products | |
| Other (includes short-term investments) |
| Country diversification3,5 | (%) |
|---|---|
| United States | |
| Canada | |
| United Kingdom | |
| France | |
| Switzerland | |
| Spain | |
| Japan | |
| Germany | |
| Netherlands | |
| Other (includes short-term investments) |
| Top ten holdings3,4 | (%) |
|---|---|
| Truist Financial Corp., 6.669%, Series N | |
| Citigroup, Inc., 6.875%, Series GG | |
| UBS Group AG, 6.625%, (Switzerland) | |
| Royal Bank of Canada, 6.75%, due 8/24/85 (Canada) |
|
| Transcanada Trust, 5.875%, due 8/15/76, Series 16-A (Canada) |
|
| Enbridge, Inc., 8.25%, due 1/15/84, Series NC5 (Canada) |
|
| HSBC Holdings PLC, 7.05% (United Kingdom) | |
| Citigroup, Inc., 7.625%, Series AA | |
| BNP Paribas SA, 8.00% (France) | |
| Emera, Inc., 6.75%, due 6/15/76, Series 16-A (Canada) |
This is a summary of certain upcoming material changes to the Fund. For more complete information, you may review the Fund's current prospectus, which is available upon request by calling 1-800-330-7348.
How will the Fund change?
Fund name change
On June 16, 2026, the Fund's Board of Directors approved changing the Fund's name to "Cohen & Steers Short Duration Preferred and Income Fund, Inc." effective August 28, 2026. There will be no changes to the Fund's investment policies, principal investment strategies or principal risks in connection with this change.
| Class name | Costs of a $10,000 investment | Costs paid as a percentage of a $10,000 investment |
|---|---|---|
| Class F | $62 | 0.60% |
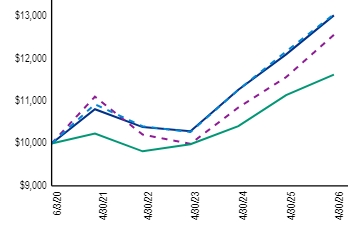
The share class had a 7.60% total return in the 12 months ended April 30, 2026, compared with the ICE BofA 1-3 Year U.S. Corporate Index, which returned 4.33%, and the ICE BofA U.S. All Capital Securities Index, which returned 8.64%.
The Fund's benchmark, the ICE BofA 1–3 Year U.S. Corporate Index, focuses on investment-grade corporate bonds with maturities of one to three years. The Fund's primary objective is to seek to provide high current income, and its secondary objective is to provide capital preservation; we believe this is consistent with the benchmark over time. However, to meet its objectives, the Fund invests in low-duration preferred securities as well as shorter-term corporate bonds.
The Fund's allocations to over-the-counter fixed-to-reset preferred securities with six months to five years of call protection contributed to relative performance versus the ICE BofA 1–3 Year U.S. Corporate Index. Allocations to contingent capital securities (CoCos) with two to five years of call protection also contributed to relative performance.
The Fund's allocations to interest rate swaps and total return swaps, used to hedge and manage interest rate and credit risk modestly detracted from relative performance. While these hedges modestly detracted from performance, the portfolio's securities' returns more than offset the associated hedging costs. Allocations to exchange-traded fixed-to-float preferreds with more than five years of call protection also modestly detracted from relative performance.
By sector, the Fund's allocations to preferred securities in the banking, utilities and insurance sectors contributed the most to relative performance. No sectors detracted from relative performance.
Top contributors |
Top detractors |
|---|---|
Banking |
Total Return Swaps |
Utilities |
Interest Rate Swaps |
Insurance |
(as of April 30, 2026)
| 1 Year | 5 Years | Since inception (6/3/20) | |
|---|---|---|---|
| Class F2 | 7.60% | 3.80% | 4.58% |
| ICE BofA U.S. All Capital Securities Index | 8.64% | 2.50% | 3.94% |
| ICE BofA 1-3 Year U.S. Corporate Index | 4.33% | 2.59% | 2.59% |
| Blended Benchmark1 | 7.21% | 3.62% | 4.61% |
| Net assets | $1,935,098,596 |
|---|---|
| Number of portfolio holdings (excluding derivatives) | |
| Portfolio turnover rate | 46% |
| Net advisory fees paid | $8,065,915 |
| Top ten holdings3,4 | (%) |
|---|---|
| Truist Financial Corp., 6.669%, Series N | |
| Citigroup, Inc., 6.875%, Series GG | |
| UBS Group AG, 6.625%, (Switzerland) | |
| Royal Bank of Canada, 6.75%, due 8/24/85 (Canada) |
|
| Transcanada Trust, 5.875%, due 8/15/76, Series 16-A (Canada) |
|
| Enbridge, Inc., 8.25%, due 1/15/84, Series NC5 (Canada) |
|
| HSBC Holdings PLC, 7.05% (United Kingdom) | |
| Citigroup, Inc., 7.625%, Series AA | |
| BNP Paribas SA, 8.00% (France) | |
| Emera, Inc., 6.75%, due 6/15/76, Series 16-A (Canada) |
| Sector diversification3,5 | (%) |
|---|---|
| Banking | |
| Utilities | |
| Pipelines | |
| Insurance | |
| Real Estate | |
| Telecommunications | |
| Financial Services | |
| Health Care | |
| Consumer Discretionary Products | |
| Other (includes short-term investments) |
| Country diversification3,5 | (%) |
|---|---|
| United States | |
| Canada | |
| United Kingdom | |
| France | |
| Switzerland | |
| Spain | |
| Japan | |
| Germany | |
| Netherlands | |
| Other (includes short-term investments) |
| Top ten holdings3,4 | (%) |
|---|---|
| Truist Financial Corp., 6.669%, Series N | |
| Citigroup, Inc., 6.875%, Series GG | |
| UBS Group AG, 6.625%, (Switzerland) | |
| Royal Bank of Canada, 6.75%, due 8/24/85 (Canada) |
|
| Transcanada Trust, 5.875%, due 8/15/76, Series 16-A (Canada) |
|
| Enbridge, Inc., 8.25%, due 1/15/84, Series NC5 (Canada) |
|
| HSBC Holdings PLC, 7.05% (United Kingdom) | |
| Citigroup, Inc., 7.625%, Series AA | |
| BNP Paribas SA, 8.00% (France) | |
| Emera, Inc., 6.75%, due 6/15/76, Series 16-A (Canada) |
This is a summary of certain upcoming material changes to the Fund. For more complete information, you may review the Fund's current prospectus, which is available upon request by calling 1-800-330-7348.
How will the Fund change?
Fund name change
On June 16, 2026, the Fund's Board of Directors approved changing the Fund's name to "Cohen & Steers Short Duration Preferred and Income Fund, Inc." effective August 28, 2026. There will be no changes to the Fund's investment policies, principal investment strategies or principal risks in connection with this change.
| Class name | Costs of a $10,000 investment | Costs paid as a percentage of a $10,000 investment |
|---|---|---|
| Class I | $62 | 0.60% |
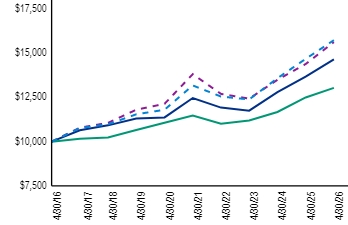
The share class had a 7.71% total return in the 12 months ended April 30, 2026, compared with the ICE BofA 1-3 Year U.S. Corporate Index, which returned 4.33%, and the ICE BofA U.S. All Capital Securities Index, which returned 8.64%.
The Fund's benchmark, the ICE BofA 1–3 Year U.S. Corporate Index, focuses on investment-grade corporate bonds with maturities of one to three years. The Fund's primary objective is to seek to provide high current income, and its secondary objective is to provide capital preservation; we believe this is consistent with the benchmark over time. However, to meet its objectives, the Fund invests in low-duration preferred securities as well as shorter-term corporate bonds.
The Fund's allocations to over-the-counter fixed-to-reset preferred securities with six months to five years of call protection contributed to relative performance versus the ICE BofA 1–3 Year U.S. Corporate Index. Allocations to contingent capital securities (CoCos) with two to five years of call protection also contributed to relative performance.
The Fund's allocations to interest rate swaps and total return swaps, used to hedge and manage interest rate and credit risk modestly detracted from relative performance. While these hedges modestly detracted from performance, the portfolio's securities' returns more than offset the associated hedging costs. Allocations to exchange-traded fixed-to-float preferreds with more than five years of call protection also modestly detracted from relative performance.
By sector, the Fund's allocations to preferred securities in the banking, utilities and insurance sectors contributed the most to relative performance. No sectors detracted from relative performance.
Top contributors |
Top detractors |
|---|---|
Banking |
Total Return Swaps |
Utilities |
Interest Rate Swaps |
Insurance |

(as of April 30, 2026)
| 1 Year | 5 Years | 10 Years | |
|---|---|---|---|
| Class I2 | 7.71% | 3.82% | 4.43% |
| ICE BofA U.S. All Capital Securities Index | 8.64% | 2.50% | 4.58% |
| ICE BofA 1-3 Year U.S. Corporate Index | 4.33% | 2.59% | 2.70% |
| Blended Benchmark1 | 7.21% | 3.62% | 4.65% |
| Net assets | $1,935,098,596 |
|---|---|
| Number of portfolio holdings (excluding derivatives) | |
| Portfolio turnover rate | 46% |
| Net advisory fees paid | $8,065,915 |
| Top ten holdings3,4 | (%) |
|---|---|
| Truist Financial Corp., 6.669%, Series N | |
| Citigroup, Inc., 6.875%, Series GG | |
| UBS Group AG, 6.625%, (Switzerland) | |
| Royal Bank of Canada, 6.75%, due 8/24/85 (Canada) |
|
| Transcanada Trust, 5.875%, due 8/15/76, Series 16-A (Canada) |
|
| Enbridge, Inc., 8.25%, due 1/15/84, Series NC5 (Canada) |
|
| HSBC Holdings PLC, 7.05% (United Kingdom) | |
| Citigroup, Inc., 7.625%, Series AA | |
| BNP Paribas SA, 8.00% (France) | |
| Emera, Inc., 6.75%, due 6/15/76, Series 16-A (Canada) |
| Sector diversification3,5 | (%) |
|---|---|
| Banking | |
| Utilities | |
| Pipelines | |
| Insurance | |
| Real Estate | |
| Telecommunications | |
| Financial Services | |
| Health Care | |
| Consumer Discretionary Products | |
| Other (includes short-term investments) |
| Country diversification3,5 | (%) |
|---|---|
| United States | |
| Canada | |
| United Kingdom | |
| France | |
| Switzerland | |
| Spain | |
| Japan | |
| Germany | |
| Netherlands | |
| Other (includes short-term investments) |
| Top ten holdings3,4 | (%) |
|---|---|
| Truist Financial Corp., 6.669%, Series N | |
| Citigroup, Inc., 6.875%, Series GG | |
| UBS Group AG, 6.625%, (Switzerland) | |
| Royal Bank of Canada, 6.75%, due 8/24/85 (Canada) |
|
| Transcanada Trust, 5.875%, due 8/15/76, Series 16-A (Canada) |
|
| Enbridge, Inc., 8.25%, due 1/15/84, Series NC5 (Canada) |
|
| HSBC Holdings PLC, 7.05% (United Kingdom) | |
| Citigroup, Inc., 7.625%, Series AA | |
| BNP Paribas SA, 8.00% (France) | |
| Emera, Inc., 6.75%, due 6/15/76, Series 16-A (Canada) |
This is a summary of certain upcoming material changes to the Fund. For more complete information, you may review the Fund's current prospectus, which is available upon request by calling 1-800-330-7348.
How will the Fund change?
Fund name change
On June 16, 2026, the Fund's Board of Directors approved changing the Fund's name to "Cohen & Steers Short Duration Preferred and Income Fund, Inc." effective August 28, 2026. There will be no changes to the Fund's investment policies, principal investment strategies or principal risks in connection with this change.
| Class name | Costs of a $10,000 investment | Costs paid as a percentage of a $10,000 investment |
|---|---|---|
| Class R | $114 | 1.10% |
The share class had a 7.17% total return in the 12 months ended April 30, 2026, compared with the ICE BofA 1-3 Year U.S. Corporate Index, which returned 4.33%, and the ICE BofA U.S. All Capital Securities Index, which returned 8.64%.
The Fund's benchmark, the ICE BofA 1–3 Year U.S. Corporate Index, focuses on investment-grade corporate bonds with maturities of one to three years. The Fund's primary objective is to seek to provide high current income, and its secondary objective is to provide capital preservation; we believe this is consistent with the benchmark over time. However, to meet its objectives, the Fund invests in low-duration preferred securities as well as shorter-term corporate bonds.
The Fund's allocations to over-the-counter fixed-to-reset preferred securities with six months to five years of call protection contributed to relative performance versus the ICE BofA 1–3 Year U.S. Corporate Index. Allocations to contingent capital securities (CoCos) with two to five years of call protection also contributed to relative performance.
The Fund's allocations to interest rate swaps and total return swaps, used to hedge and manage interest rate and credit risk modestly detracted from relative performance. While these hedges modestly detracted from performance, the portfolio's securities' returns more than offset the associated hedging costs. Allocations to exchange-traded fixed-to-float preferreds with more than five years of call protection also modestly detracted from relative performance.
By sector, the Fund's allocations to preferred securities in the banking, utilities and insurance sectors contributed the most to relative performance. No sectors detracted from relative performance.
Top contributors |
Top detractors |
|---|---|
Banking |
Total Return Swaps |
Utilities |
Interest Rate Swaps |
Insurance |
(as of April 30, 2026)
| 1 Year | 5 Years | 10 Years | |
|---|---|---|---|
| Class R2 | 7.17% | 3.29% | 3.90% |
| ICE BofA U.S. All Capital Securities Index | 8.64% | 2.50% | 4.58% |
| ICE BofA 1-3 Year U.S. Corporate Index | 4.33% | 2.59% | 2.70% |
| Blended Benchmark1 | 7.21% | 3.62% | 4.65% |
| Net assets | $1,935,098,596 |
|---|---|
| Number of portfolio holdings (excluding derivatives) | |
| Portfolio turnover rate | 46% |
| Net advisory fees paid | $8,065,915 |
| Top ten holdings3,4 | (%) |
|---|---|
| Truist Financial Corp., 6.669%, Series N | |
| Citigroup, Inc., 6.875%, Series GG | |
| UBS Group AG, 6.625%, (Switzerland) | |
| Royal Bank of Canada, 6.75%, due 8/24/85 (Canada) |
|
| Transcanada Trust, 5.875%, due 8/15/76, Series 16-A (Canada) |
|
| Enbridge, Inc., 8.25%, due 1/15/84, Series NC5 (Canada) |
|
| HSBC Holdings PLC, 7.05% (United Kingdom) | |
| Citigroup, Inc., 7.625%, Series AA | |
| BNP Paribas SA, 8.00% (France) | |
| Emera, Inc., 6.75%, due 6/15/76, Series 16-A (Canada) |
| Sector diversification3,5 | (%) |
|---|---|
| Banking | |
| Utilities | |
| Pipelines | |
| Insurance | |
| Real Estate | |
| Telecommunications | |
| Financial Services | |
| Health Care | |
| Consumer Discretionary Products | |
| Other (includes short-term investments) |
| Country diversification3,5 | (%) |
|---|---|
| United States | |
| Canada | |
| United Kingdom | |
| France | |
| Switzerland | |
| Spain | |
| Japan | |
| Germany | |
| Netherlands | |
| Other (includes short-term investments) |
| Top ten holdings3,4 | (%) |
|---|---|
| Truist Financial Corp., 6.669%, Series N | |
| Citigroup, Inc., 6.875%, Series GG | |
| UBS Group AG, 6.625%, (Switzerland) | |
| Royal Bank of Canada, 6.75%, due 8/24/85 (Canada) |
|
| Transcanada Trust, 5.875%, due 8/15/76, Series 16-A (Canada) |
|
| Enbridge, Inc., 8.25%, due 1/15/84, Series NC5 (Canada) |
|
| HSBC Holdings PLC, 7.05% (United Kingdom) | |
| Citigroup, Inc., 7.625%, Series AA | |
| BNP Paribas SA, 8.00% (France) | |
| Emera, Inc., 6.75%, due 6/15/76, Series 16-A (Canada) |
This is a summary of certain upcoming material changes to the Fund. For more complete information, you may review the Fund's current prospectus, which is available upon request by calling 1-800-330-7348.
How will the Fund change?
Fund name change
On June 16, 2026, the Fund's Board of Directors approved changing the Fund's name to "Cohen & Steers Short Duration Preferred and Income Fund, Inc." effective August 28, 2026. There will be no changes to the Fund's investment policies, principal investment strategies or principal risks in connection with this change.
| Class name | Costs of a $10,000 investment | Costs paid as a percentage of a $10,000 investment |
|---|---|---|
| Class Z | $62 | 0.60% |
The share class had a 7.73% total return in the 12 months ended April 30, 2026, compared with the ICE BofA 1-3 Year U.S. Corporate Index, which returned 4.33%, and the ICE BofA U.S. All Capital Securities Index, which returned 8.64%.
The Fund's benchmark, the ICE BofA 1–3 Year U.S. Corporate Index, focuses on investment-grade corporate bonds with maturities of one to three years. The Fund's primary objective is to seek to provide high current income, and its secondary objective is to provide capital preservation; we believe this is consistent with the benchmark over time. However, to meet its objectives, the Fund invests in low-duration preferred securities as well as shorter-term corporate bonds.
The Fund's allocations to over-the-counter fixed-to-reset preferred securities with six months to five years of call protection contributed to relative performance versus the ICE BofA 1–3 Year U.S. Corporate Index. Allocations to contingent capital securities (CoCos) with two to five years of call protection also contributed to relative performance.
The Fund's allocations to interest rate swaps and total return swaps, used to hedge and manage interest rate and credit risk modestly detracted from relative performance. While these hedges modestly detracted from performance, the portfolio's securities' returns more than offset the associated hedging costs. Allocations to exchange-traded fixed-to-float preferreds with more than five years of call protection also modestly detracted from relative performance.
By sector, the Fund's allocations to preferred securities in the banking, utilities and insurance sectors contributed the most to relative performance. No sectors detracted from relative performance.
Top contributors |
Top detractors |
|---|---|
Banking |
Total Return Swaps |
Utilities |
Interest Rate Swaps |
Insurance |
(as of April 30, 2026)
| 1 Year | 5 Years | 10 Years | |
|---|---|---|---|
| Class Z2 | 7.73% | 3.79% | 4.41% |
| ICE BofA U.S. All Capital Securities Index | 8.64% | 2.50% | 4.58% |
| ICE BofA 1-3 Year U.S. Corporate Index | 4.33% | 2.59% | 2.70% |
| Blended Benchmark1 | 7.21% | 3.62% | 4.65% |
| Net assets | $1,935,098,596 |
|---|---|
| Number of portfolio holdings (excluding derivatives) | |
| Portfolio turnover rate | 46% |
| Net advisory fees paid | $8,065,915 |
| Top ten holdings3,4 | (%) |
|---|---|
| Truist Financial Corp., 6.669%, Series N | |
| Citigroup, Inc., 6.875%, Series GG | |
| UBS Group AG, 6.625%, (Switzerland) | |
| Royal Bank of Canada, 6.75%, due 8/24/85 (Canada) |
|
| Transcanada Trust, 5.875%, due 8/15/76, Series 16-A (Canada) |
|
| Enbridge, Inc., 8.25%, due 1/15/84, Series NC5 (Canada) |
|
| HSBC Holdings PLC, 7.05% (United Kingdom) | |
| Citigroup, Inc., 7.625%, Series AA | |
| BNP Paribas SA, 8.00% (France) | |
| Emera, Inc., 6.75%, due 6/15/76, Series 16-A (Canada) |
| Sector diversification3,5 | (%) |
|---|---|
| Banking | |
| Utilities | |
| Pipelines | |
| Insurance | |
| Real Estate | |
| Telecommunications | |
| Financial Services | |
| Health Care | |
| Consumer Discretionary Products | |
| Other (includes short-term investments) |
| Country diversification3,5 | (%) |
|---|---|
| United States | |
| Canada | |
| United Kingdom | |
| France | |
| Switzerland | |
| Spain | |
| Japan | |
| Germany | |
| Netherlands | |
| Other (includes short-term investments) |
| Top ten holdings3,4 | (%) |
|---|---|
| Truist Financial Corp., 6.669%, Series N | |
| Citigroup, Inc., 6.875%, Series GG | |
| UBS Group AG, 6.625%, (Switzerland) | |
| Royal Bank of Canada, 6.75%, due 8/24/85 (Canada) |
|
| Transcanada Trust, 5.875%, due 8/15/76, Series 16-A (Canada) |
|
| Enbridge, Inc., 8.25%, due 1/15/84, Series NC5 (Canada) |
|
| HSBC Holdings PLC, 7.05% (United Kingdom) | |
| Citigroup, Inc., 7.625%, Series AA | |
| BNP Paribas SA, 8.00% (France) | |
| Emera, Inc., 6.75%, due 6/15/76, Series 16-A (Canada) |
This is a summary of certain upcoming material changes to the Fund. For more complete information, you may review the Fund's current prospectus, which is available upon request by calling 1-800-330-7348.
How will the Fund change?
Fund name change
On June 16, 2026, the Fund's Board of Directors approved changing the Fund's name to "Cohen & Steers Short Duration Preferred and Income Fund, Inc." effective August 28, 2026. There will be no changes to the Fund's investment policies, principal investment strategies or principal risks in connection with this change.