Shareholder Report
Apr. 30, 2026
USD ($)
Holding
What were the Fund expenses for the last year?
(Based on a hypothetical $10,000 investment)
| Fund (Class) | Costs of $10,000 Investment |
Costs paid as a percentage of a $10,000 investment |
| Wilmington Enhanced Dividend Income Strategy Fund (Class I) |
$58 | 0.50% |
How did the Fund perform last year?
- For the reporting period ended April 30, 2026, the Fund’s Class I shares returned 30.68%.
- U.S. Equities posted strong returns as underlying economic growth remained robust.
- The U.S. Federal Reserve (the “Fed”) lowered its target fed-funds rate, albeit modestly, as it balanced the potential for slowing economy against the possibility of lingering inflation.
- Higher dividend yielding stocks lagged with investors favoring pro-cyclical areas of the market.
What contributed to performance?
Stock selection was the biggest positive contributor to relative performance. Individual stock selection within the Financials sector accounted for the majority of the positive impact. Morgan Stanley (MS), Bank of America (BAC), and JPMorgan (JPM) appreciated during the period as the prospects for reduced regulation along with the expectation for a lower rate environment boosted returns.
What detracted from performance?
The biggest individual factor detractor was dividend yield. Dividend yield is the Fund’s largest active factor exposure. Given the income focus of the Fund, we would expect to maintain an overweight allocation to the dividend yield factor. Holdings within the Communications Services sector also negatively impacted relative performance.
The preceding information is the opinion of portfolio management only through the end of the period stated. Any such opinions are subject to change at any time based upon market or other conditions and should not be relied upon as investment advice. Past performance is no guarantee of future results, and there is no guarantee that market forecasts will be realized.
How has the Fund historically performed?
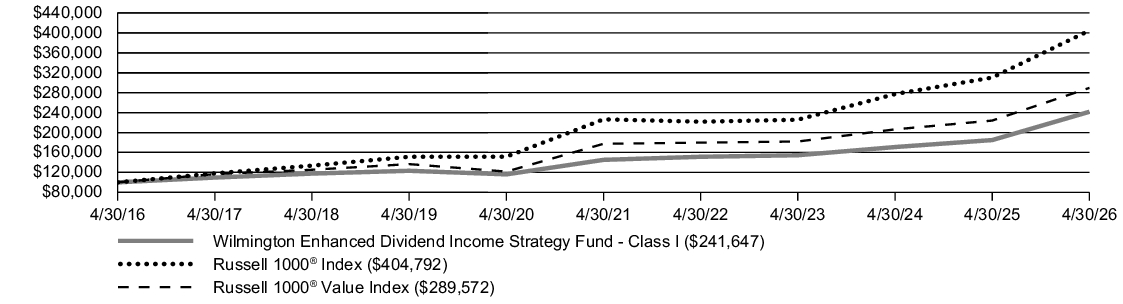
The graph below illustrates a hypothetical investment of $100,000 in Class I of the Wilmington Enhanced Dividend Income Strategy Fund from April 30, 2016 to April 30, 2026, compared to the Russell 1000® Index (broad-based securities market index) and Russell 1000® Value Index.
GROWTH OF $100,000
| AVERAGE ANNUAL TOTAL RETURN | 1 Year | 5 Year | 10 Years |
| Wilmington Enhanced Dividend Income Strategy Fund — Class I | 30.68% | 10.73% | 9.22% |
| Russell 1000® Index | 30.42% | 12.32% | 15.01% |
| Russell 1000® Value Index | 29.25% | 10.29% | 11.22% |
Key Fund Statistics
| Fund net assets | $93,738,371 |
| Total number of portfolio holdings | 46 |
| Total advisory fees paid | $41,015 |
| Portfolio turnover rate as of the end of the reporting period | 12% |
What Did the Fund Invest In?
(as of April 30, 2026)
PORTFOLIO COMPOSITION
(as a % of Total Investments)
(as a % of Total Investments)
| Common Stocks | 98.9% |
| Money Market Fund | 1.1% |
SECTOR CLASSIFICATION
(as a % of Total Investments)
(as a % of Total Investments)
| Financials | 22.5% |
| Information Technology | 15.1% |
| Health Care | 13.5% |
| Industrials | 11.2% |
| Energy | 9.4% |
| Consumer Staples | 7.3% |
| Utilities | 5.9% |
| Communication Services | 4.7% |
| Consumer Discretionary | 4.1% |
| Real Estate | 3.7% |
| Materials | 1.5% |
What were the Fund expenses for the last year?
(Based on a hypothetical $10,000 investment)
| Fund (Class) | Costs of $10,000 Investment |
Costs paid as a percentage of a $10,000 investment |
| Wilmington Enhanced Dividend Income Strategy Fund (Class A) |
$86 | 0.75% |
How did the Fund perform last year?
- For the reporting period ended April 30, 2026, the Fund’s Class A shares (excluding sales load) returned 30.37%. The fund posted similar returns to its index.
- U.S. Equities posted strong returns as underlying economic growth remained robust.
- The U.S. Federal Reserve (the “Fed”) lowered its target fed-funds rate, albeit modestly, as it balanced the potential for slowing economy against the possibility of lingering inflation.
- Higher dividend yielding stocks lagged with investors favoring pro-cyclical areas of the market.
What contributed to performance?
Stock selection was the biggest positive contributor to relative performance. Individual stock selection within the Financials sector accounted for the majority of the positive impact. Morgan Stanley (MS), Bank of America (BAC), and JPMorgan (JPM) appreciated during the period as the prospects for reduced regulation along with the expectation for a lower rate environment boosted returns.
What detracted from performance?
The biggest individual factor detractor was dividend yield. Dividend yield is the Fund’s largest active factor exposure. Given the income focus of the Fund, we would expect to maintain an overweight allocation to the dividend yield factor. Holdings within the Communications Services sector also negatively impacted relative performance.
The preceding information is the opinion of portfolio management only through the end of the period stated. Any such opinions are subject to change at any time based upon market or other conditions and should not be relied upon as investment advice. Past performance is no guarantee of future results, and there is no guarantee that market forecasts will be realized.
How has the Fund historically performed?
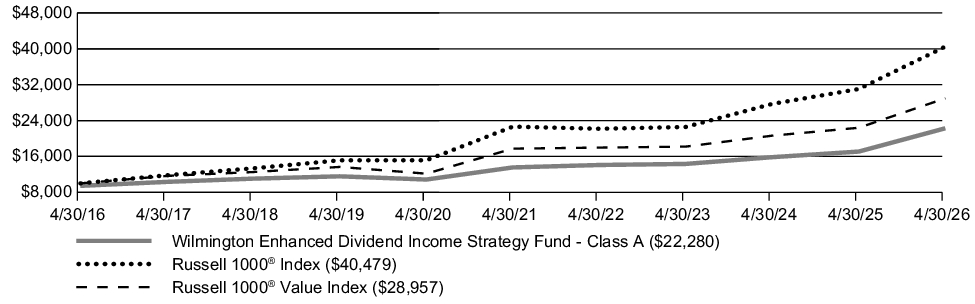
The graph below illustrates a hypothetical investment of $10,000 in Class A of the Wilmington Enhanced Dividend Income Strategy Fund, assuming the maximum sales load of 5.5%, from April 30, 2016 to April 30, 2026, compared to the Russell 1000® Index (broad-based securities market index) and Russell 1000® Value Index.
GROWTH OF $10,000
| AVERAGE ANNUAL TOTAL RETURN | 1 Year | 5 Year | 10 Years |
| Wilmington Enhanced Dividend Income Strategy Fund — Class A (including 5.5% maximum sales load) | 23.21% | 9.21% | 8.34% |
| Wilmington Enhanced Dividend Income Strategy Fund — Class A (excluding sales load) | 30.37% | 10.45% | 8.96% |
| Russell 1000® Index | 30.42% | 12.32% | 15.01% |
| Russell 1000® Value Index | 29.25% | 10.29% | 11.22% |
Key Fund Statistics
| Fund net assets | $93,738,371 |
| Total number of portfolio holdings | 46 |
| Total advisory fees paid | $41,015 |
| Portfolio turnover rate as of the end of the reporting period | 12% |
What Did the Fund Invest In?
(as of April 30, 2026)
PORTFOLIO COMPOSITION
(as a % of Total Investments)
(as a % of Total Investments)
| Common Stocks | 98.9% |
| Money Market Fund | 1.1% |
SECTOR CLASSIFICATION
(as a % of Total Investments)
(as a % of Total Investments)
| Financials | 22.5% |
| Information Technology | 15.1% |
| Health Care | 13.5% |
| Industrials | 11.2% |
| Energy | 9.4% |
| Consumer Staples | 7.3% |
| Utilities | 5.9% |
| Communication Services | 4.7% |
| Consumer Discretionary | 4.1% |
| Real Estate | 3.7% |
| Materials | 1.5% |
This report describes changes to the Fund that occurred during the reporting period.
What were the Fund expenses for the last year?
(Based on a hypothetical $10,000 investment)
| Fund (Class) | Costs of $10,000 Investment |
Costs paid as a percentage of a $10,000 investment |
| Wilmington Broad Market Bond Fund (Class A) |
$63 | 0.62% |
How did the Fund perform last year?
- For the reporting period ended April 30, 2026, the Fund’s A shares (excluding sales load) returned 3.32%.
- For the same period, the Bloomberg U.S. Aggregate Bond Index (the “Index”) returned 4.06%.
What contributed to performance?
The Fund’s increased allocation to corporate securities as well as a slight overweight allocation to agency mortgage-backed securities contributed positively towards our relative performance for the annual period.
What detracted from performance?
The Fund’s slightly lower average corporate maturity profile versus the Index detracted from relative performance as 20+ year corporates outperformed over the annual period.
The preceding information is the opinion of portfolio management only through the end of the period stated. Any such opinions are subject to change at any time based upon market or other conditions and should not be relied upon as investment advice. Past performance is no guarantee of future results, and there is no guarantee that market forecasts will be realized.
How has the Fund historically performed?
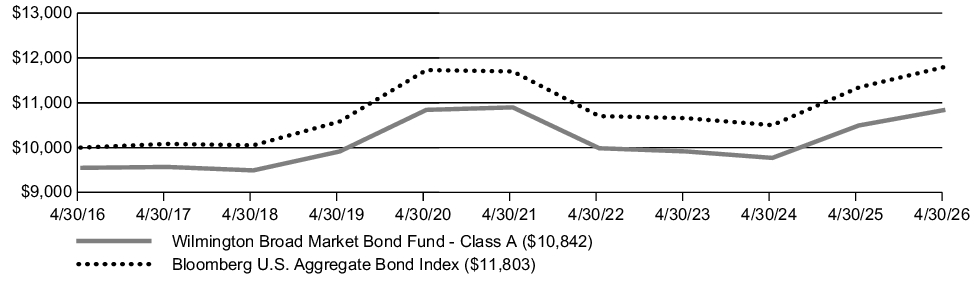
The graph below illustrates a hypothetical investment of $10,000 in Class A of the Wilmington Broad Market Bond Fund, assuming the maximum sales load of 4.5%, from April 30, 2016 to April 30, 2026, compared to the Bloomberg U.S. Aggregate Bond Index.
GROWTH OF $10,000
| AVERAGE ANNUAL TOTAL RETURN | 1 Year | 5 Year | 10 Years |
| Wilmington Broad Market Bond Fund — Class A (including 4.5% maximum sales load) | (1.32)% | (1.01)% | 0.81% |
| Wilmington Broad Market Bond Fund — Class A (excluding sales load) | 3.32% | (0.10)% | 1.28% |
| Bloomberg U.S. Aggregate Bond Index | 4.06% | 0.18% | 1.67% |
Key Fund Statistics
| Fund net assets | $698,938,724 |
| Total number of portfolio holdings | 426 |
| Total advisory fees paid | $2,226,420 |
| Portfolio turnover rate as of the end of the reporting period | 26% |
What Did the Fund Invest In?
(as of April 30, 2026)
PORTFOLIO COMPOSITION
(as a % of Total Investments)
(as a % of Total Investments)
| Corporate Bonds | 37.0% |
| U.S. Treasury Obligations | 33.8% |
| Mortgage-Backed Securities | 27.0% |
| Cash Collateral Invested for Securities on Loan | 1.4% |
| Government Agencies | 0.8% |
CREDIT QUALITY DIVERSIFICATION
(as a % of Total Investments)
(as a % of Total Investments)
| U.S. Government Agency Securities | 27.0% |
| U.S. Treasury Obligations | 33.8% |
| AA / Aa | 1.4% |
| A | 11.1% |
| BBB / Baa | 24.5% |
| BB / Ba | 0.8% |
| Not Rated | 1.4% |
| The Credit Quality Diversification table reflects the lowest rating assigned by either Moody’s Investors Service or Standard and Poor’s if the ratings differ. These rating agencies are independent, nationally recognized statistical rating organizations and are widely used. Investment grade ratings are credit ratings of BBB/Baa or higher. Below investment grade ratings are credit ratings of BB/Ba or lower. Investments designated as “Not Rated” are not rated by either rating agency and do not necessarily indicate low credit quality. Credit quality ratings are subject to change. |
This report describes changes to the Fund that occurred during the reporting period.
What were the Fund expenses for the last year?
(Based on a hypothetical $10,000 investment)
| Fund (Class) | Costs of $10,000 Investment |
Costs paid as a percentage of a $10,000 investment |
| Wilmington Broad Market Bond Fund (Class I) |
$44 | 0.43% |
How did the Fund perform last year?
- For the reporting period ended April 30, 2026, the Fund's Class I shares returned 3.60%.
- For the same period, the Bloomberg U.S. Aggregate Bond Index (the “Index”) returned 4.06%.
What contributed to performance?
The Fund’s increased allocation to corporate securities as well as a slight overweight allocation to agency mortgage-backed securities contributed positively towards our relative performance for the annual period.
What detracted from performance?
The Fund’s slightly lower average corporate maturity profile versus the Index detracted from relative performance as 20+ year corporates outperformed over the annual period.
The preceding information is the opinion of portfolio management only through the end of the period stated. Any such opinions are subject to change at any time based upon market or other conditions and should not be relied upon as investment advice. Past performance is no guarantee of future results, and there is no guarantee that market forecasts will be realized.
How has the Fund historically performed?
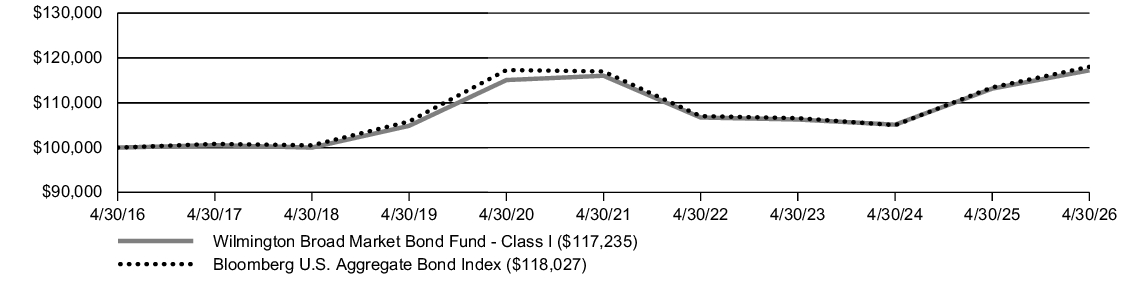
The graph below illustrates a hypothetical investment of $100,000 in Class I of the Wilmington Broad Market Bond Fund from April 30, 2016 to April 30, 2026, compared to the Bloomberg U.S. Aggregate Bond Index.
GROWTH OF $100,000
| AVERAGE ANNUAL TOTAL RETURN | 1 Year | 5 Year | 10 Years |
| Wilmington Broad Market Bond Fund — Class I | 3.60% | 0.21% | 1.60% |
| Bloomberg U.S. Aggregate Bond Index | 4.06% | 0.18% | 1.67% |
Key Fund Statistics
| Fund net assets | $698,938,724 |
| Total number of portfolio holdings | 426 |
| Total advisory fees paid | $2,226,420 |
| Portfolio turnover rate as of the end of the reporting period | 26% |
What Did the Fund Invest In?
(as of April 30, 2026)
PORTFOLIO COMPOSITION
(as a % of Total Investments)
(as a % of Total Investments)
| Corporate Bonds | 37.0% |
| U.S. Treasury Obligations | 33.8% |
| Mortgage-Backed Securities | 27.0% |
| Cash Collateral Invested for Securities on Loan | 1.4% |
| Government Agencies | 0.8% |
CREDIT QUALITY DIVERSIFICATION
(as a % of Total Investments)
(as a % of Total Investments)
| U.S. Government Agency Securities | 27.0% |
| U.S. Treasury Obligations | 33.8% |
| AA / Aa | 1.4% |
| A | 11.1% |
| BBB / Baa | 24.5% |
| BB / Ba | 0.8% |
| Not Rated | 1.4% |
| The Credit Quality Diversification table reflects the lowest rating assigned by either Moody’s Investors Service or Standard and Poor’s if the ratings differ. These rating agencies are independent, nationally recognized statistical rating organizations and are widely used. Investment grade ratings are credit ratings of BBB/Baa or higher. Below investment grade ratings are credit ratings of BB/Ba or lower. Investments designated as “Not Rated” are not rated by either rating agency and do not necessarily indicate low credit quality. Credit quality ratings are subject to change. |
This report describes changes to the Fund that occurred during the reporting period.
What were the Fund expenses for the last year?
(Based on a hypothetical $10,000 investment)
| Fund (Class) | Costs of $10,000 Investment |
Costs paid as a percentage of a $10,000 investment |
| Wilmington International Fund (Class I) |
$97 | 0.83% |
How did the Fund perform last year?
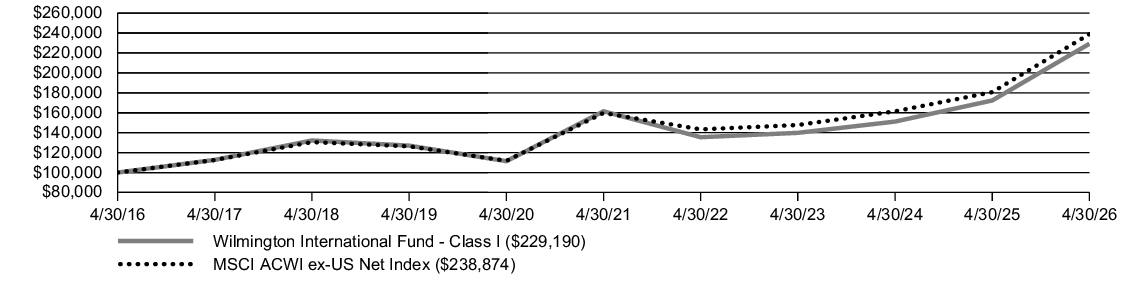
- For the reporting period ended April 30, 2026, the Fund’s Class I shares returned 33.02%.
- The Wilmington International Fund had positive performance and outperformed the benchmark, the MSCI All Country World ex-US Index, during the year.
- The portfolio’s European growth manager and Emerging Markets manager outperformed their respective regional benchmarks, while the European value manager underperformed its regional benchmark.
- The market environment was marked by trade negotiations between nations, continued strength in AI infrastructure spending, easing rates by the Fed, and increased geopolitical risk with the onset of the Iran conflict in the later part of the period.
What contributed to performance?
Relative to the benchmark, the Fund had strong selection across several sectors, most notably technology (Aspeed Technoloy, SK Hynix). Selection was also strong in health care (Galderma Group, Roche Holdings) and financials (Bawag Group). Modest underweighting to consumer discretionary also contributed to performance. From a region/country perspective, the Fund had its strongest selection in South Korea, Taiwan, and Switzerland. Modest underweighting to China and Saudi Arabia also contributed to performance.
What detracted from performance?
Relative to the benchmark, selection in industrials (Genuit Group, DiDi Global) and, to a lesser extent, consumer staples (Tate & Lyle) detracted from performance. Modest underweighting to energy and overweighting to consumer staples also detracted from performance. From a region/country perspective, selection in the UK and China detracted from performance. An underweight to South Korea also detracted. The Fund’s overweighting to smaller cap stocks also detracted from performance during the period.
The preceding information is the opinion of portfolio management only through the end of the period stated. Any such opinions are subject to change at any time based upon market or other conditions and should not be relied upon as investment advice. Past performance is no guarantee of future results, and there is no guarantee that market forecasts will be realized.
How has the Fund historically performed?
The graph below illustrates a hypothetical investment of $100,000 in Class I of the Wilmington International Fund from April 30, 2016 to April 30, 2026, compared to the MSCI ACWI ex-US Net Index.
GROWTH OF $100,000
| AVERAGE ANNUAL TOTAL RETURN | 1 Year | 5 Year | 10 Years |
| Wilmington International Fund — Class I | 33.02% | 7.26% | 8.65% |
| MSCI ACWI ex-US Net Index | 32.20% | 8.38% | 9.10% |
Key Fund Statistics
| Fund net assets | $572,064,771 |
| Total number of portfolio holdings | 364 |
| Total advisory fees paid | $3,481,950 |
| Portfolio turnover rate as of the end of the reporting period | 34% |
What Did the Fund Invest In?
(as of April 30, 2026)
PORTFOLIO COMPOSITION
(as a % of Total Investments)
(as a % of Total Investments)
| Common Stocks | 91.2% |
| Cash Collateral Invested for Securities on Loan | 3.7% |
| Exchange-Traded Funds | 2.9% |
| Money Market Fund | 2.2% |
| Long Equity Index Futures (Notional Value) | 2.3% |
SECTOR CLASSIFICATION
(as a % of Total Investments)
(as a % of Total Investments)
| Financials | 22.1% |
| Information Technology | 18.1% |
| Industrials | 13.2% |
| Consumer Discretionary | 7.8% |
| Health Care | 6.8% |
| Consumer Staples | 5.7% |
| Materials | 5.0% |
| Communication Services | 4.7% |
| Energy | 4.1% |
| Utilities | 2.2% |
| Real Estate | 1.5% |
COUNTRY ALLOCATION
(as a % of Total Investments)
(as a % of Total Investments)
| Japan | 13.1% |
| United Kingdom | 9.2% |
| Taiwan | 8.0% |
| United States | 7.9% |
| Canada | 7.0% |
| China | 6.5% |
| South Korea | 5.7% |
| France | 4.8% |
| Germany | 4.4% |
| Netherlands | 2.8% |
| Australia | 2.1% |
| Hong Kong | 2.1% |
| Brazil | 1.6% |
| South Africa | 1.5% |
| Spain | 1.5% |
| Sweden | 1.4% |
| Mexico | 1.4% |
| Austria | 1.2% |
| Norway | 1.2% |
| Switzerland | 1.2% |
| India | 1.1% |
| Other Countries | 8.4% |
This report describes changes to the Fund that occurred during the reporting period.
What were the Fund expenses for the last year?
(Based on a hypothetical $10,000 investment)
| Fund (Class) | Costs of $10,000 Investment |
Costs paid as a percentage of a $10,000 investment |
| Wilmington International Fund (Class A) |
$126 | 1.08% |
How did the Fund perform last year?
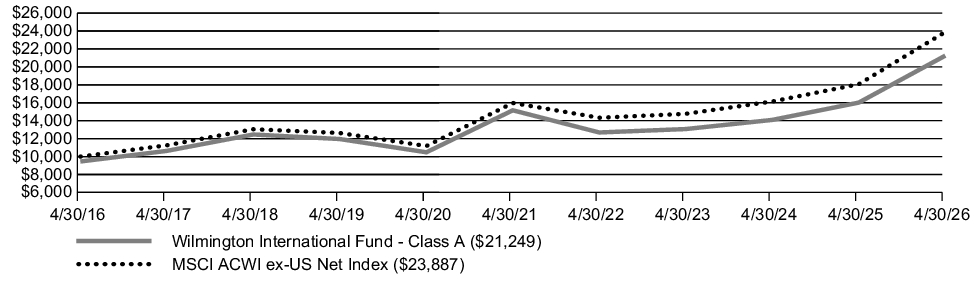
- For the reporting period ended April 30, 2026, the Fund’s Class A shares (excluding sales load) returned 32.64%.
- The Wilmington International Fund had positive performance and outperformed the benchmark, the MSCI All Country World ex-US Index, during the year.
- The portfolio’s European growth manager and Emerging Markets manager outperformed their respective regional benchmarks, while the European value manager underperformed its regional benchmark.
- The market environment was marked by trade negotiations between nations, continued strength in AI infrastructure spending, easing rates by the Fed, and increased geopolitical risk with the onset of the Iran conflict in the later part of the period.
What contributed to performance?
Relative to the benchmark, the Fund had strong selection across several sectors, most notably technology (Aspeed Technoloy, SK Hynix). Selection was also strong in health care (Galderma Group, Roche Holdings) and financials (Bawag Group). Modest underweighting to consumer discretionary also contributed to performance. From a region/country perspective, the Fund had its strongest selection in South Korea, Taiwan, and Switzerland. Modest underweighting to China and Saudi Arabia also contributed to performance.
What detracted from performance?
Relative to the benchmark, selection in industrials (Genuit Group, DiDi Global) and, to a lesser extent, consumer staples (Tate & Lyle) detracted from performance. Modest underweighting to energy and overweighting to consumer staples also detracted from performance. From a region/country perspective, selection in the UK and China detracted from performance. An underweight to South Korea also detracted. The Fund’s overweighting to smaller cap stocks also detracted from performance during the period.
The preceding information is the opinion of portfolio management only through the end of the period stated. Any such opinions are subject to change at any time based upon market or other conditions and should not be relied upon as investment advice. Past performance is no guarantee of future results, and there is no guarantee that market forecasts will be realized.
How has the Fund historically performed?
The graph below illustrates a hypothetical investment of $10,000 in Class A of the Wilmington International Fund, assuming the maximum sales load of 5.5%, from April 30, 2016 to April 30, 2026, compared to the MSCI ACWI ex-US Net Index.
GROWTH OF $10,000
| AVERAGE ANNUAL TOTAL RETURN | 1 Year | 5 Year | 10 Years |
| Wilmington International Fund — Class A (including 5.5% maximum sales load) | 25.32% | 5.78% | 7.83% |
| Wilmington International Fund — Class A (excluding sales load) | 32.64% | 6.98% | 8.44% |
| MSCI ACWI ex-US Net Index | 32.20% | 8.38% | 9.10% |
Key Fund Statistics
| Fund net assets | $572,064,771 |
| Total number of portfolio holdings | 364 |
| Total advisory fees paid | $3,481,950 |
| Portfolio turnover rate as of the end of the reporting period | 34% |
What Did the Fund Invest In?
(as of April 30, 2026)
PORTFOLIO COMPOSITION
(as a % of Total Investments)
(as a % of Total Investments)
| Common Stocks | 91.2% |
| Cash Collateral Invested for Securities on Loan | 3.7% |
| Exchange-Traded Funds | 2.9% |
| Money Market Fund | 2.2% |
| Long Equity Index Futures (Notional Value) | 2.3% |
SECTOR CLASSIFICATION
(as a % of Total Investments)
(as a % of Total Investments)
| Financials | 22.1% |
| Information Technology | 18.1% |
| Industrials | 13.2% |
| Consumer Discretionary | 7.8% |
| Health Care | 6.8% |
| Consumer Staples | 5.7% |
| Materials | 5.0% |
| Communication Services | 4.7% |
| Energy | 4.1% |
| Utilities | 2.2% |
| Real Estate | 1.5% |
COUNTRY ALLOCATION
(as a % of Total Investments)
(as a % of Total Investments)
| Japan | 13.1% |
| United Kingdom | 9.2% |
| Taiwan | 8.0% |
| United States | 7.9% |
| Canada | 7.0% |
| China | 6.5% |
| South Korea | 5.7% |
| France | 4.8% |
| Germany | 4.4% |
| Netherlands | 2.8% |
| Australia | 2.1% |
| Hong Kong | 2.1% |
| Brazil | 1.6% |
| South Africa | 1.5% |
| Spain | 1.5% |
| Sweden | 1.4% |
| Mexico | 1.4% |
| Austria | 1.2% |
| Norway | 1.2% |
| Switzerland | 1.2% |
| India | 1.1% |
| Other Countries | 8.4% |
This report describes changes to the Fund that occurred during the reporting period.
What were the Fund expenses for the last year?
(Based on a hypothetical $10,000 investment)
| Fund (Class) | Costs of $10,000 Investment |
Costs paid as a percentage of a $10,000 investment |
| Wilmington New York Municipal Bond Fund (Class A) |
$83 | 0.81% |
How did the Fund perform last year?
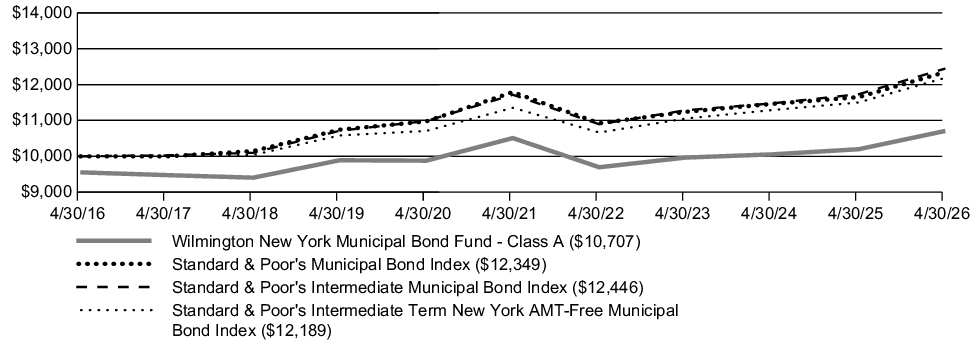
- For the reporting period ended April 30, 2026, the Fund’s Class A shares (excluding sales load) returned 4.98%.
- For the same period, the S&P Intermediate Municipal Bond Index (the “Index”) returned 6.09%.
What contributed to performance?
The Fund’s allocation to IDR/PCR and Port securities contributed positively towards our relative performance for the annual period.
What detracted from performance?
The Fund’s allocation to Higher Education securities contributed negatively towards our relative performance for the annual period.
The preceding information is the opinion of portfolio management only through the end of the period stated. Any such opinions are subject to change at any time based upon market or other conditions and should not be relied upon as investment advice. Past performance is no guarantee of future results, and there is no guarantee that market forecasts will be realized.
How has the Fund historically performed?
The graph below illustrates a hypothetical investment of $10,000 in Class A of the Wilmington New York Municipal Bond Fund, assuming the maximum sales load of 4.5%, from April 30, 2016 to April 30, 2026, compared to the Standard & Poor’s Municipal Bond Index (broad-based securities market index), Standard & Poor’s Intermediate Municipal Bond Index and Standard & Poor’s Intermediate Term New York AMT-Free Municipal Bond Index.
GROWTH OF $10,000
| AVERAGE ANNUAL TOTAL RETURN | 1 Year | 5 Year | 10 Years |
| Wilmington New York Municipal Bond Fund — Class A (including 4.5% maximum sales load) | 0.22% | (0.54)% | 0.69% |
| Wilmington New York Municipal Bond Fund — Class A (excluding sales load) | 4.98% | 0.38% | 1.15% |
| Standard & Poor's Municipal Bond Index | 5.99% | 0.93% | 2.13% |
| Standard & Poor’s Intermediate Municipal Bond Index | 6.09% | 1.22% | 2.21% |
| Standard & Poor’s Intermediate Term New York AMT-Free Municipal Bond Index | 5.96% | 1.43% | 2.00% |
Key Fund Statistics
| Fund net assets | $42,855,527 |
| Total number of portfolio holdings | 58 |
| Total advisory fees paid | $- |
| Portfolio turnover rate as of the end of the reporting period | 8% |
What Did the Fund Invest In?
(as of April 30, 2026)
PORTFOLIO COMPOSITION
(as a % of Total Investments)
(as a % of Total Investments)
| General | 21.6% |
| General Obligations | 17.6% |
| Higher Education | 10.7% |
| Education | 10.6% |
| Airport | 7.7% |
| Medical | 6.6% |
| School District | 6.0% |
| Transportation | 4.3% |
| Development | 4.3% |
| Water | 3.8% |
| Utilities | 2.9% |
| Power | 2.5% |
| Money Market Fund | 1.4% |
CREDIT QUALITY DIVERSIFICATION
(as a % of Total Investments)
(as a % of Total Investments)
| AAA / Aaa | 6.6% |
| AA / Aa | 50.1% |
| A | 24.2% |
| BBB / Baa | 17.7% |
| Not Rated | 1.4% |
| The Credit Quality Diversification table reflects the lowest rating assigned by either Moody’s Investors Service or Standard and Poor’s if the ratings differ. These rating agencies are independent, nationally recognized statistical rating organizations and are widely used. Investment grade ratings are credit ratings of BBB/Baa or higher. Below investment grade ratings are credit ratings of BB/Ba or lower. Investments designated as “Not Rated” are not rated by either rating agency and do not necessarily indicate low credit quality. Credit quality ratings are subject to change. |
| The Credit Quality Diversification table reflects the lowest rating assigned by either Moody’s Investors Service or Standard and Poor’s if the ratings differ. These rating agencies are independent, nationally recognized statistical rating organizations and are widely used. Investment grade ratings are credit ratings of BBB/Baa or higher. Below investment grade ratings are credit ratings of BB/Ba or lower. Investments designated as “Not Rated” are not rated by either rating agency and do not necessarily indicate low credit quality. Credit quality ratings are subject to change. |
This report describes changes to the Fund that occurred during the reporting period.
What were the Fund expenses for the last year?
(Based on a hypothetical $10,000 investment)
| Fund (Class) | Costs of $10,000 Investment |
Costs paid as a percentage of a $10,000 investment |
| Wilmington New York Municipal Bond Fund (Class I) |
$57 | 0.56% |
How did the Fund perform last year?
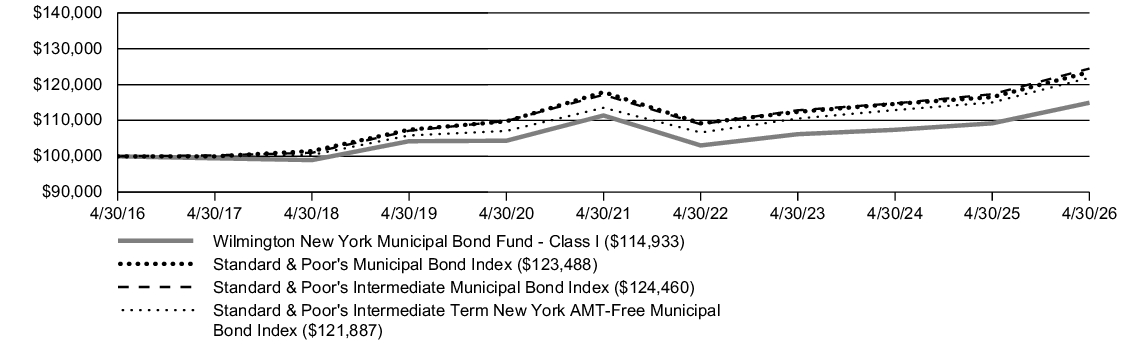
- For the reporting period ended April 30, 2026, the Fund’s Class I shares returned 5.25%.
- For the same period, the S&P Intermediate Municipal Bond Index (the “Index”) returned 6.09%.
What contributed to performance?
The Fund’s allocation to IDR/PCR and Port securities contributed positively towards our relative performance for the annual period.
What detracted from performance?
The Fund’s allocation to Higher Education securities contributed negatively towards our relative performance for the annual period.
The preceding information is the opinion of portfolio management only through the end of the period stated. Any such opinions are subject to change at any time based upon market or other conditions and should not be relied upon as investment advice. Past performance is no guarantee of future results, and there is no guarantee that market forecasts will be realized.
How has the Fund historically performed?
The graph below illustrates a hypothetical investment of $100,000 in Class I of the Wilmington New York Municipal Bond Fund from April 30, 2016 to April 30, 2026, compared to the Standard & Poor’s Municipal Bond Index (broad-based securities market index), Standard & Poor’s Intermediate Municipal Bond Index and Standard & Poor’s Intermediate Term New York AMT-Free Municipal Bond Index.
GROWTH OF $100,000
| AVERAGE ANNUAL TOTAL RETURN | 1 Year | 5 Year | 10 Years |
| Wilmington New York Municipal Bond Fund — Class I | 5.25% | 0.63% | 1.40% |
| Standard & Poor's Municipal Bond Index | 5.99% | 0.93% | 2.13% |
| Standard & Poor’s Intermediate Municipal Bond Index | 6.09% | 1.22% | 2.21% |
| Standard & Poor’s Intermediate Term New York AMT-Free Municipal Bond Index | 5.96% | 1.43% | 2.00% |
Key Fund Statistics
| Fund net assets | $42,855,527 |
| Total number of portfolio holdings | 58 |
| Total advisory fees paid | $- |
| Portfolio turnover rate as of the end of the reporting period | 8% |
What Did the Fund Invest In?
(as of April 30, 2026)
PORTFOLIO COMPOSITION
(as a % of Total Investments)
(as a % of Total Investments)
| General | 21.6% |
| General Obligations | 17.6% |
| Higher Education | 10.7% |
| Education | 10.6% |
| Airport | 7.7% |
| Medical | 6.6% |
| School District | 6.0% |
| Transportation | 4.3% |
| Development | 4.3% |
| Water | 3.8% |
| Utilities | 2.9% |
| Power | 2.5% |
| Money Market Fund | 1.4% |
CREDIT QUALITY DIVERSIFICATION
(as a % of Total Investments)
(as a % of Total Investments)
| AAA / Aaa | 6.6% |
| AA / Aa | 50.1% |
| A | 24.2% |
| BBB / Baa | 17.7% |
| Not Rated | 1.4% |
| The Credit Quality Diversification table reflects the lowest rating assigned by either Moody’s Investors Service or Standard and Poor’s if the ratings differ. These rating agencies are independent, nationally recognized statistical rating organizations and are widely used. Investment grade ratings are credit ratings of BBB/Baa or higher. Below investment grade ratings are credit ratings of BB/Ba or lower. Investments designated as “Not Rated” are not rated by either rating agency and do not necessarily indicate low credit quality. Credit quality ratings are subject to change. |
| The Credit Quality Diversification table reflects the lowest rating assigned by either Moody’s Investors Service or Standard and Poor’s if the ratings differ. These rating agencies are independent, nationally recognized statistical rating organizations and are widely used. Investment grade ratings are credit ratings of BBB/Baa or higher. Below investment grade ratings are credit ratings of BB/Ba or lower. Investments designated as “Not Rated” are not rated by either rating agency and do not necessarily indicate low credit quality. Credit quality ratings are subject to change. |
What were the Fund expenses for the last year?
(Based on a hypothetical $10,000 investment)
| Fund (Class) | Costs of $10,000 Investment |
Costs paid as a percentage of a $10,000 investment |
| Wilmington U.S. Treasury Money Market Fund (Preferred Institutional Class) |
$16 | 0.16% |
Key Fund Statistics
| Fund net assets | $2,310,025,037 |
| Total number of portfolio holdings | 26 |
| Total advisory fees paid | $2,091,034 |
What Did the Fund Invest In?
(as of April 30, 2026)
PORTFOLIO COMPOSITION
(as a % of Total Investments)
(as a % of Total Investments)
| U.S. Treasury Obligations | 58.8% |
| Repurchase Agreements | 40.2% |
| Money Market Fund | 1.0% |
What were the Fund expenses for the last year?
(Based on a hypothetical $10,000 investment)
| Fund (Class) | Costs of $10,000 Investment |
Costs paid as a percentage of a $10,000 investment |
| Wilmington U.S. Treasury Money Market Fund (Service Class) |
$47 | 0.46% |
Key Fund Statistics
| Fund net assets | $2,310,025,037 |
| Total number of portfolio holdings | 26 |
| Total advisory fees paid | $2,091,034 |
What Did the Fund Invest In?
(as of April 30, 2026)
PORTFOLIO COMPOSITION
(as a % of Total Investments)
(as a % of Total Investments)
| U.S. Treasury Obligations | 58.8% |
| Repurchase Agreements | 40.2% |
| Money Market Fund | 1.0% |
What were the Fund expenses for the last year?
(Based on a hypothetical $10,000 investment)
| Fund (Class) | Costs of $10,000 Investment |
Costs paid as a percentage of a $10,000 investment |
| Wilmington U.S. Treasury Money Market Fund (Select Class) |
$33 | 0.32% |
Key Fund Statistics
| Fund net assets | $2,310,025,037 |
| Total number of portfolio holdings | 26 |
| Total advisory fees paid | $2,091,034 |
What Did the Fund Invest In?
(as of April 30, 2026)
PORTFOLIO COMPOSITION
(as a % of Total Investments)
(as a % of Total Investments)
| U.S. Treasury Obligations | 58.8% |
| Repurchase Agreements | 40.2% |
| Money Market Fund | 1.0% |
What were the Fund expenses for the last year?
(Based on a hypothetical $10,000 investment)
| Fund (Class) | Costs of $10,000 Investment |
Costs paid as a percentage of a $10,000 investment |
| Wilmington U.S. Treasury Money Market Fund (Institutional Class) |
$25 | 0.25% |
Key Fund Statistics
| Fund net assets | $2,310,025,037 |
| Total number of portfolio holdings | 26 |
| Total advisory fees paid | $2,091,034 |
What Did the Fund Invest In?
(as of April 30, 2026)
PORTFOLIO COMPOSITION
(as a % of Total Investments)
(as a % of Total Investments)
| U.S. Treasury Obligations | 58.8% |
| Repurchase Agreements | 40.2% |
| Money Market Fund | 1.0% |
What were the Fund expenses for the last year?
(Based on a hypothetical $10,000 investment)
| Fund (Class) | Costs of $10,000 Investment |
Costs paid as a percentage of a $10,000 investment |
| Wilmington U.S. Treasury Money Market Fund (Administrative Class) |
$61 | 0.60% |
Key Fund Statistics
| Fund net assets | $2,310,025,037 |
| Total number of portfolio holdings | 26 |
| Total advisory fees paid | $2,091,034 |
What Did the Fund Invest In?
(as of April 30, 2026)
PORTFOLIO COMPOSITION
(as a % of Total Investments)
(as a % of Total Investments)
| U.S. Treasury Obligations | 58.8% |
| Repurchase Agreements | 40.2% |
| Money Market Fund | 1.0% |
What were the Fund expenses for the last year?
(Based on a hypothetical $10,000 investment)
| Fund (Class) | Costs of $10,000 Investment |
Costs paid as a percentage of a $10,000 investment |
| Wilmington U.S. Government Money Market Fund (Administrative Class) |
$61 | 0.60% |
Key Fund Statistics
| Fund net assets | $10,904,821,079 |
| Total number of portfolio holdings | 58 |
| Total advisory fees paid | $10,546,781 |
What Did the Fund Invest In?
(as of April 30, 2026)
PORTFOLIO COMPOSITION
(as a % of Total Investments)
(as a % of Total Investments)
| Repurchase Agreements | 40.3% |
| U.S. Treasury Obligations | 37.3% |
| U.S. Government Agency Obligations | 21.4% |
| Money Market Funds | 1.0% |
What were the Fund expenses for the last year?
(Based on a hypothetical $10,000 investment)
| Fund (Class) | Costs of $10,000 Investment |
Costs paid as a percentage of a $10,000 investment |
| Wilmington U.S. Government Money Market Fund (Institutional Class) |
$25 | 0.25% |
Key Fund Statistics
| Fund net assets | $10,904,821,079 |
| Total number of portfolio holdings | 58 |
| Total advisory fees paid | $10,546,781 |
What Did the Fund Invest In?
(as of April 30, 2026)
PORTFOLIO COMPOSITION
(as a % of Total Investments)
(as a % of Total Investments)
| Repurchase Agreements | 40.3% |
| U.S. Treasury Obligations | 37.3% |
| U.S. Government Agency Obligations | 21.4% |
| Money Market Funds | 1.0% |
What were the Fund expenses for the last year?
(Based on a hypothetical $10,000 investment)
| Fund (Class) | Costs of $10,000 Investment |
Costs paid as a percentage of a $10,000 investment |
| Wilmington U.S. Government Money Market Fund (Select Class) |
$33 | 0.32% |
Key Fund Statistics
| Fund net assets | $10,904,821,079 |
| Total number of portfolio holdings | 58 |
| Total advisory fees paid | $10,546,781 |
What Did the Fund Invest In?
(as of April 30, 2026)
PORTFOLIO COMPOSITION
(as a % of Total Investments)
(as a % of Total Investments)
| Repurchase Agreements | 40.3% |
| U.S. Treasury Obligations | 37.3% |
| U.S. Government Agency Obligations | 21.4% |
| Money Market Funds | 1.0% |
What were the Fund expenses for the last year?
(Based on a hypothetical $10,000 investment)
| Fund (Class) | Costs of $10,000 Investment |
Costs paid as a percentage of a $10,000 investment |
| Wilmington U.S. Government Money Market Fund (Service Class) |
$65 | 0.64% |
Key Fund Statistics
| Fund net assets | $10,904,821,079 |
| Total number of portfolio holdings | 58 |
| Total advisory fees paid | $10,546,781 |
What Did the Fund Invest In?
(as of April 30, 2026)
PORTFOLIO COMPOSITION
(as a % of Total Investments)
(as a % of Total Investments)
| Repurchase Agreements | 40.3% |
| U.S. Treasury Obligations | 37.3% |
| U.S. Government Agency Obligations | 21.4% |
| Money Market Funds | 1.0% |
What were the Fund expenses for the last year?
(Based on a hypothetical $10,000 investment)
| Fund (Class) | Costs of $10,000 Investment |
Costs paid as a percentage of a $10,000 investment |
| Wilmington U.S. Government Money Market Fund (Preferred Institutional Class) |
$16 | 0.16% |
Key Fund Statistics
| Fund net assets | $10,904,821,079 |
| Total number of portfolio holdings | 58 |
| Total advisory fees paid | $10,546,781 |
What Did the Fund Invest In?
(as of April 30, 2026)
PORTFOLIO COMPOSITION
(as a % of Total Investments)
(as a % of Total Investments)
| Repurchase Agreements | 40.3% |
| U.S. Treasury Obligations | 37.3% |
| U.S. Government Agency Obligations | 21.4% |
| Money Market Funds | 1.0% |
This report describes changes to the Fund that occurred during the reporting period.
What were the Fund expenses for the last year?
(Based on a hypothetical $10,000 investment)
| Fund (Class) | Costs of $10,000 Investment |
Costs paid as a percentage of a $10,000 investment |
| Wilmington Municipal Bond Fund (Class I) |
$48 | 0.47% |
How did the Fund perform last year?
- For the reporting period ended April 30, 2026, the Fund’s Class I shares returned 5.62%.
- For the same period, the S&P Intermediate Municipal Bond Index (the “Index”) returned 6.09%.
What contributed to performance?
The Fund’s allocation to State-level General Obligation and Airport securities as well as a slight overweight to index duration contributed positively towards our relative performance for the annual period.
What detracted from performance?
The Fund’s allocation to Higher Education securities contributed negatively towards our relative performance for the annual period.
The preceding information is the opinion of portfolio management only through the end of the period stated. Any such opinions are subject to change at any time based upon market or other conditions and should not be relied upon as investment advice. Past performance is no guarantee of future results, and there is no guarantee that market forecasts will be realized.
How has the Fund historically performed?
The graph below illustrates a hypothetical investment of $100,000 in Class I of the Wilmington Municipal Bond Fund from April 30, 2016 to April 30, 2026, compared to the Standard & Poor's Municipal Bond Index (broad-based securities market index), Standard & Poor’s Intermediate Municipal Bond Index and Standard & Poor’s Investment Grade Intermediate Municipal Bond Index.
GROWTH OF $100,000
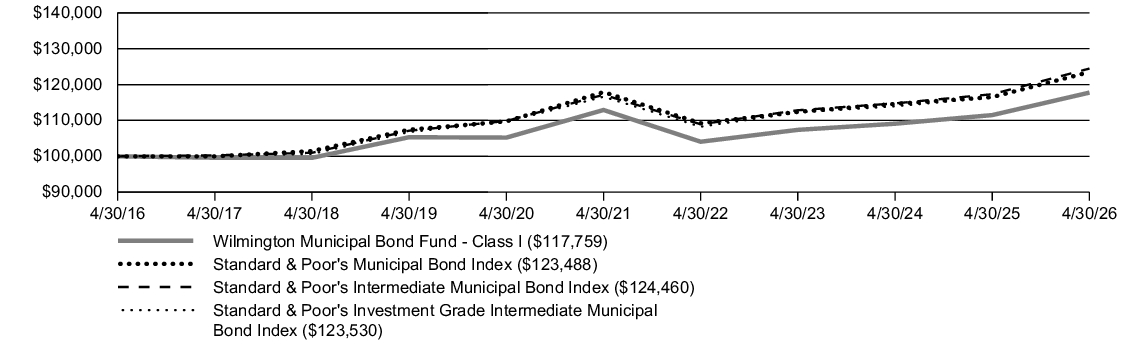
| AVERAGE ANNUAL TOTAL RETURN | 1 Year | 5 Year | 10 Years |
| Wilmington Municipal Bond Fund — Class I | 5.62% | 0.84% | 1.65% |
| Standard & Poor's Municipal Bond Index | 5.99% | 0.93% | 2.13% |
| Standard & Poor’s Intermediate Municipal Bond Index | 6.09% | 1.22% | 2.21% |
| Standard & Poor’s Investment Grade Intermediate Municipal Bond Index | 6.12% | 1.16% | 2.14% |
Key Fund Statistics
| Fund net assets | $365,925,155 |
| Total number of portfolio holdings | 202 |
| Total advisory fees paid | $1,147,843 |
| Portfolio turnover rate as of the end of the reporting period | 12% |
What Did the Fund Invest In?
(as of April 30, 2026)
PORTFOLIO COMPOSITION
(as a % of Total Investments)
(as a % of Total Investments)
| General | 22.1% |
| General Obligations | 13.0% |
| Medical | 12.9% |
| Airport | 12.0% |
| Transportation | 8.7% |
| Higher Education | 7.3% |
| Power | 6.8% |
| School District | 6.4% |
| Water | 3.7% |
| Education | 2.8% |
| Utilities | 1.7% |
| Student Loan | 1.2% |
| Development | 0.8% |
| Tobacco Settlement | 0.3% |
| Money Market Fund | 0.3% |
CREDIT QUALITY DIVERSIFICATION
(as a % of Total Investments)
(as a % of Total Investments)
| AAA / Aaa | 9.4% |
| AA / Aa | 28.4% |
| A | 47.8% |
| BBB / Baa | 11.6% |
| Not Rated | 2.8% |
| The Credit Quality Diversification table reflects the lowest rating assigned by either Moody’s Investors Service or Standard and Poor’s if the ratings differ. These rating agencies are independent, nationally recognized statistical rating organizations and are widely used. Investment grade ratings are credit ratings of BBB/Baa or higher. Below investment grade ratings are credit ratings of BB/Ba or lower. Investments designated as “Not Rated” are not rated by either rating agency and do not necessarily indicate low credit quality. Credit quality ratings are subject to change. |
| The Credit Quality Diversification table reflects the lowest rating assigned by either Moody’s Investors Service or Standard and Poor’s if the ratings differ. These rating agencies are independent, nationally recognized statistical rating organizations and are widely used. Investment grade ratings are credit ratings of BBB/Baa or higher. Below investment grade ratings are credit ratings of BB/Ba or lower. Investments designated as “Not Rated” are not rated by either rating agency and do not necessarily indicate low credit quality. Credit quality ratings are subject to change. |
This report describes changes to the Fund that occurred during the reporting period.
What were the Fund expenses for the last year?
(Based on a hypothetical $10,000 investment)
| Fund (Class) | Costs of $10,000 Investment |
Costs paid as a percentage of a $10,000 investment |
| Wilmington Municipal Bond Fund (Class A) |
$74 | 0.72% |
How did the Fund perform last year?
- For the reporting period ended April 30, 2026, the Fund’s Class A shares (excluding sales load) returned 5.26%.
- For the same period, the S&P Intermediate Municipal Bond Index (the “Index”) returned 6.09%.
What contributed to performance?
The Fund’s allocation to State-level General Obligation and Airport securities as well as a slight overweight to index duration contributed positively towards our relative performance for the annual period.
What detracted from performance?
The Fund’s allocation to Higher Education securities contributed negatively towards our relative performance for the annual period.
The preceding information is the opinion of portfolio management only through the end of the period stated. Any such opinions are subject to change at any time based upon market or other conditions and should not be relied upon as investment advice. Past performance is no guarantee of future results, and there is no guarantee that market forecasts will be realized.
How has the Fund historically performed?
The graph below illustrates a hypothetical investment of $10,000 in Class A of the Wilmington Municipal Bond Fund, assuming the maximum sales load of 4.5%, from April 30, 2016 to April 30, 2026, compared to the Standard & Poor's Municipal Bond Index (broad-based securities market index), Standard & Poor’s Intermediate Municipal Bond Index and Standard & Poor’s Investment Grade Intermediate Municipal Bond Index.
GROWTH OF $10,000
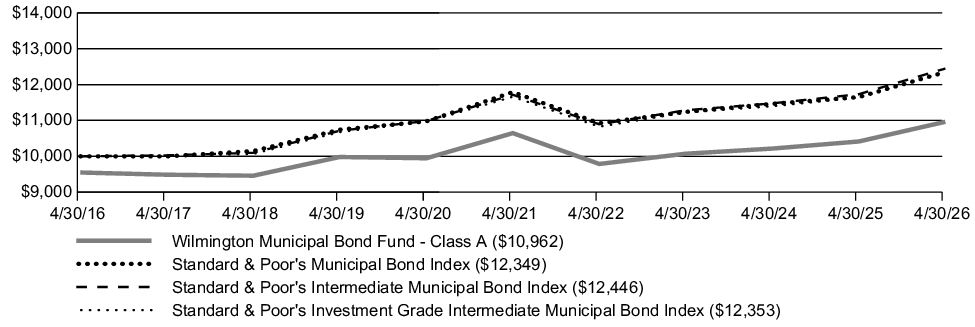
| AVERAGE ANNUAL TOTAL RETURN | 1 Year | 5 Year | 10 Years |
| Wilmington Municipal Bond Fund — Class A (including 4.5% maximum sales load) | 0.53% | (0.33)% | 0.92% |
| Wilmington Municipal Bond Fund — Class A (excluding sales load) | 5.26% | 0.58% | 1.39% |
| Standard & Poor's Municipal Bond Index | 5.99% | 0.93% | 2.13% |
| Standard & Poor’s Intermediate Municipal Bond Index | 6.09% | 1.22% | 2.21% |
| Standard & Poor’s Investment Grade Intermediate Municipal Bond Index | 6.12% | 1.16% | 2.14% |
Key Fund Statistics
| Fund net assets | $365,925,155 |
| Total number of portfolio holdings | 202 |
| Total advisory fees paid | $1,147,843 |
| Portfolio turnover rate as of the end of the reporting period | 12% |
What Did the Fund Invest In?
(as of April 30, 2026)
PORTFOLIO COMPOSITION
(as a % of Total Investments)
(as a % of Total Investments)
| General | 22.1% |
| General Obligations | 13.0% |
| Medical | 12.9% |
| Airport | 12.0% |
| Transportation | 8.7% |
| Higher Education | 7.3% |
| Power | 6.8% |
| School District | 6.4% |
| Water | 3.7% |
| Education | 2.8% |
| Utilities | 1.7% |
| Student Loan | 1.2% |
| Development | 0.8% |
| Tobacco Settlement | 0.3% |
| Money Market Fund | 0.3% |
CREDIT QUALITY DIVERSIFICATION
(as a % of Total Investments)
(as a % of Total Investments)
| AAA / Aaa | 9.4% |
| AA / Aa | 28.4% |
| A | 47.8% |
| BBB / Baa | 11.6% |
| Not Rated | 2.8% |
| The Credit Quality Diversification table reflects the lowest rating assigned by either Moody’s Investors Service or Standard and Poor’s if the ratings differ. These rating agencies are independent, nationally recognized statistical rating organizations and are widely used. Investment grade ratings are credit ratings of BBB/Baa or higher. Below investment grade ratings are credit ratings of BB/Ba or lower. Investments designated as “Not Rated” are not rated by either rating agency and do not necessarily indicate low credit quality. Credit quality ratings are subject to change. |
This report describes changes to the Fund that occurred during the reporting period.
What were the Fund expenses for the last year?
(Based on a hypothetical $10,000 investment)
| Fund (Class) | Costs of $10,000 Investment |
Costs paid as a percentage of a $10,000 investment |
| Wilmington Real Asset Fund (Class A) |
$94 | 0.82% |
How did the Fund perform last year?
- For the reporting period ended April 30, 2026, the Fund’s Class A shares (excluding sales load) returned 28.44%.
- The Fund had positive performance but underperformed the Blended Index, which consisted of a 50% weighting to the Bloomberg Commodity Index and 50% to the S&P Developed Property Index.
- The Fund’s performance against the broad-based market indexes was mixed with it underperforming the MSCI All Country World Index but outperforming the Bloomberg U.S. Aggregate Bond Index.
- Both the Fund’s Commodity/Other Real Assets exposure and Real Estate exposure were positive but slightly trailed their respective benchmarks.
What contributed to performance?
Within Real Estate, the Fund’s Developed International outperformed. Within Commodities, the Fund’s natural resource equities position was up nearly 50% and 2 of 3 commodity futures managers outperformed.
What detracted from performance?
Within Real Estate, the Fund’s US exposure was positive but detracted relative to the index. Within Commodities/Other Real Assets, the Fund’s MLP position was positive but detracted.
The preceding information is the opinion of portfolio management only through the end of the period stated. Any such opinions are subject to change at any time based upon market or other conditions and should not be relied upon as investment advice. Past performance is no guarantee of future results, and there is no guarantee that market forecasts will be realized.
How has the Fund historically performed?
The graph below illustrates a hypothetical investment of $10,000 in Class A of the Wilmington Real Asset Fund, assuming the maximum sales load of 5.5%, from April 30, 2016 to April 30, 2026, compared to the MSCI ACWI Index (Net) (broad-based securities market index), Bloomberg U.S. Aggregate Bond Index (broad-based securities market index), Real Asset Blended Index and Bloomberg Commodity Index.
GROWTH OF $10,000
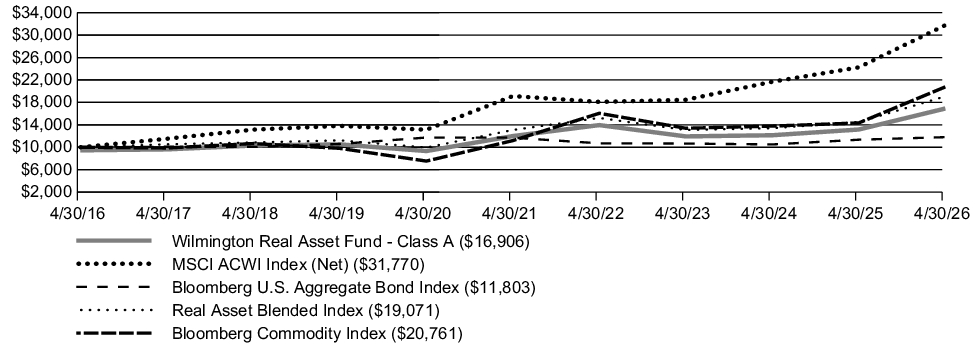
| AVERAGE ANNUAL TOTAL RETURN | 1 Year | 5 Year | 10 Years |
| Wilmington Real Asset Fund — Class A (including 5.5% maximum sales load) | 21.40% | 5.90% | 5.39% |
| Wilmington Real Asset Fund — Class A (excluding sales load) | 28.44% | 7.11% | 5.99% |
| MSCI ACWI Index (Net) | 31.00% | 10.68% | 12.25% |
| Bloomberg U.S. Aggregate Bond Index | 4.06% | 0.18% | 1.67% |
| Real Asset Blended Index | 31.50% | 7.84% | 6.67% |
| Bloomberg Commodity Index | 44.82% | 13.17% | 7.58% |
Key Fund Statistics
| Fund net assets | $473,950,945 |
| Total number of portfolio holdings | 426 |
| Total advisory fees paid | $1,704,538 |
| Portfolio turnover rate as of the end of the reporting period | 7% |
What Did the Fund Invest In?
(as of April 30, 2026)
PORTFOLIO COMPOSITION
(as a % of Total Investments)
(as a % of Total Investments)
| Real Estate Related Real Estate Investment Trusts | 31.4% |
| Real Estate Related Exchange-Traded Funds | 8.3% |
| Real Estate Related Common Stocks | 7.1% |
| Real Estate Related Investment Company | 3.4% |
| Commodity Related Investment Companies | 45.8% |
| Commodity Related Exchange-Traded Funds | 1.9% |
| Money Market Fund | 1.4% |
| Cash Collateral Invested for Securities on Loan | 0.7% |
This report describes changes to the Fund that occurred during the reporting period.
What were the Fund expenses for the last year?
(Based on a hypothetical $10,000 investment)
| Fund (Class) | Costs of $10,000 Investment |
Costs paid as a percentage of a $10,000 investment |
| Wilmington Real Asset Fund (Class I) |
$65 | 0.57% |
How did the Fund perform last year?
- For the reporting period ended April 30, 2026, the Fund’s Class I shares (excluding sales load) returned 28.76%.
- The Fund had positive performance but underperformed the Blended Index, which consisted of a 50% weighting to the Bloomberg Commodity Index and 50% to the S&P Developed Property Index.
- The Fund’s performance against the broad-based market indexes was mixed with it underperforming the MSCI All Country World Index but outperforming the Bloomberg U.S. Aggregate Bond Index.
- Both the Fund’s Commodity/Other Real Assets exposure and Real Estate exposure were positive but slightly trailed their respective benchmarks.
What contributed to performance?
Within Real Estate, the Fund’s Developed International outperformed. Within Commodities, the Fund’s natural resource equities position was up nearly 50% and 2 of 3 commodity futures managers outperformed.
What detracted from performance?
Within Real Estate, the Fund’s US exposure was positive but detracted relative to the index. Within Commodities/Other Real Assets, the Fund’s MLP position was positive but detracted.
The preceding information is the opinion of portfolio management only through the end of the period stated. Any such opinions are subject to change at any time based upon market or other conditions and should not be relied upon as investment advice. Past performance is no guarantee of future results, and there is no guarantee that market forecasts will be realized.
How has the Fund historically performed?
The graph below illustrates a hypothetical investment of $100,000 in Class I of the Wilmington Real Asset Fund from April 30, 2016 to April 30, 2026, compared to the MSCI ACWI Index (Net) (broad-based securities market index), Bloomberg U.S. Aggregate Bond Index (broad-based securities market index), Real Asset Blended Index and Bloomberg Commodity Index.
GROWTH OF $100,000
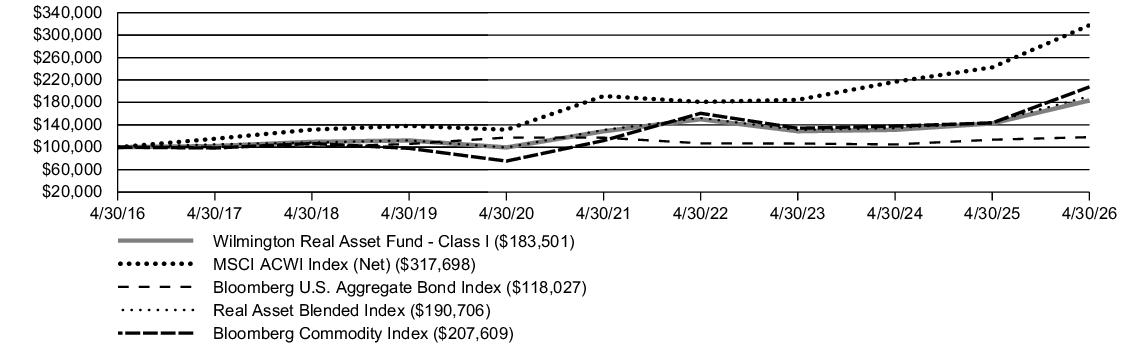
| AVERAGE ANNUAL TOTAL RETURN | 1 Year | 5 Year | 10 Years |
| Wilmington Real Asset Fund — Class I | 28.76% | 7.39% | 6.26% |
| MSCI ACWI Index (Net) | 31.00% | 10.68% | 12.25% |
| Bloomberg U.S. Aggregate Bond Index | 4.06% | 0.18% | 1.67% |
| Real Asset Blended Index | 31.50% | 7.84% | 6.67% |
| Bloomberg Commodity Index | 44.82% | 13.17% | 7.58% |
Key Fund Statistics
| Fund net assets | $473,950,945 |
| Total number of portfolio holdings | 426 |
| Total advisory fees paid | $1,704,538 |
| Portfolio turnover rate as of the end of the reporting period | 7% |
What Did the Fund Invest In?
(as of April 30, 2026)
PORTFOLIO COMPOSITION
(as a % of Total Investments)
(as a % of Total Investments)
| Real Estate Related Real Estate Investment Trusts | 31.4% |
| Real Estate Related Exchange-Traded Funds | 8.3% |
| Real Estate Related Common Stocks | 7.1% |
| Real Estate Related Investment Company | 3.4% |
| Commodity Related Investment Companies | 45.8% |
| Commodity Related Exchange-Traded Funds | 1.9% |
| Money Market Fund | 1.4% |
| Cash Collateral Invested for Securities on Loan | 0.7% |
This report describes changes to the Fund that occurred during the reporting period.
What were the Fund expenses for the last year?
(Based on a hypothetical $10,000 investment)
| Fund (Class) | Costs of $10,000 Investment |
Costs paid as a percentage of a $10,000 investment |
| Wilmington Global Alpha Equities Fund (Class I) |
$129 | 1.24% |
How did the Fund perform last year?
- For the reporting period ended April 30, 2026, the Fund’s Class I shares returned 8.53%.
- The Wilmington Global Alpha Equities Fund had positive performance but underperformed the HFRX Equity Hedge Index and the broad-based market index, the MSCI ACWI Index, during the last fiscal year.
- Three of the nine active strategies within the Fund outperformed the global equities, as measured by the MSCI ACWI Index.
- Three of nine active managers outperformed their specific strategy benchmarks.
What contributed to performance?
Top performing exposures were in the International Value Strategy, and the Mega Cap completion sleeves.
What detracted from performance?
The hedging portfolio, which consists of short positions in equity index futures contracts detracted from absolute performance as equities rose for the period. The Fund’s China manager and Quality managers contributed positive returns, but underperformed their benchmarks and the MSCI ACWI.
The preceding information is the opinion of portfolio management only through the end of the period stated. Any such opinions are subject to change at any time based upon market or other conditions and should not be relied upon as investment advice. Past performance is no guarantee of future results, and there is no guarantee that market forecasts will be realized.
How has the Fund historically performed?
The graph below illustrates a hypothetical investment of $100,000 in Class I of the Wilmington Global Alpha Equities Fund from April 30, 2016 to April 30, 2026, compared to the MSCI ACWI Index (Net) (broad-based securities market index) and HFRX Equity Hedge Index.
GROWTH OF $100,000
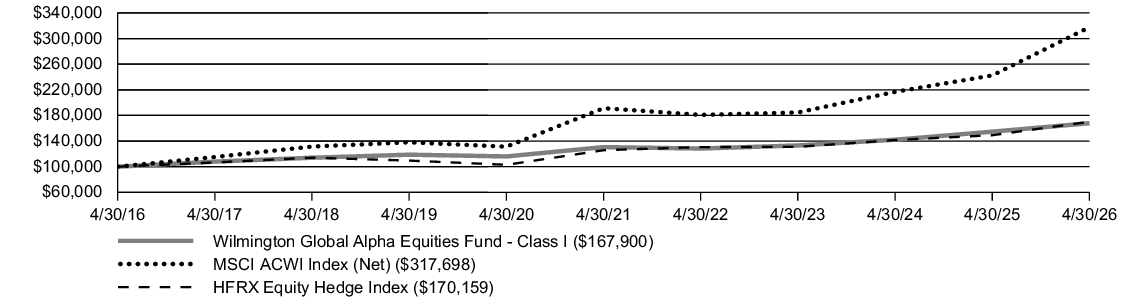
| AVERAGE ANNUAL TOTAL RETURN | 1 Year | 5 Year | 10 Years |
| Wilmington Global Alpha Equities Fund — Class I | 8.53% | 5.15% | 5.32% |
| MSCI ACWI Index (Net) | 31.00% | 10.68% | 12.25% |
| HFRX Equity Hedge Index | 14.07% | 6.24% | 5.46% |
Key Fund Statistics
| Fund net assets | $242,419,971 |
| Total number of portfolio holdings | 738 |
| Total advisory fees paid | $2,276,437 |
| Portfolio turnover rate as of the end of the reporting period | 66% |
What Did the Fund Invest In?
(as of April 30, 2026)
PORTFOLIO COMPOSITION
(as a % of Total Investments)
(as a % of Total Investments)
| Common Stocks | 94.8% |
| Money Market Fund | 4.7% |
| Exchange-Traded Funds | 0.3% |
| Preferred Stocks | 0.2% |
| Long Equity Index Futures (Notional Value) | 1.5% |
| Short Equity Index Futures (Notional Value) | (47.1)% |
SECTOR CLASSIFICATION
(as a % of Total Investments)
(as a % of Total Investments)
| Information Technology | 21.4% |
| Financials | 16.6% |
| Industrials | 12.9% |
| Consumer Discretionary | 10.0% |
| Health Care | 8.6% |
| Communication Services | 7.9% |
| Consumer Staples | 4.8% |
| Materials | 4.1% |
| Energy | 3.3% |
| Real Estate | 2.6% |
| Utilities | 2.6% |
COUNTRY ALLOCATION
(as a % of Total Investments)
(as a % of Total Investments)
| United States | 46.0% |
| Japan | 16.4% |
| United Kingdom | 5.1% |
| China | 3.9% |
| France | 3.7% |
| Netherlands | 2.3% |
| Germany | 2.2% |
| Canada | 2.0% |
| Taiwan | 1.7% |
| Switzerland | 1.4% |
| Hong Kong | 1.4% |
| Italy | 1.3% |
| South Korea | 1.2% |
| Other Countries | 6.7% |
This report describes changes to the Fund that occurred during the reporting period.
What were the Fund expenses for the last year?
(Based on a hypothetical $10,000 investment)
| Fund (Class) | Costs of $10,000 Investment |
Costs paid as a percentage of a $10,000 investment |
| Wilmington Global Alpha Equities Fund (Class A) |
$155 | 1.49% |
How did the Fund perform last year?
- For the reporting period ended April 30, 2026, the Fund’s Class A shares (excluding sales load) returned 8.21%.
- The Wilmington Global Alpha Equities Fund had positive performance but underperformed the HFRX Equity Hedge Index and the broad-based market index, the MSCI ACWI Index, during the last fiscal year.
- Three of the nine active strategies within the Fund outperformed the global equities, as measured by the MSCI ACWI Index.
- Three of nine active managers outperformed their specific strategy benchmarks.
What contributed to performance?
Top performing exposures were in the International Value Strategy, and the Mega Cap completion sleeves.
What detracted from performance?
The hedging portfolio, which consists of short positions in equity index futures contracts detracted from absolute performance as equities rose for the period. The Fund’s China manager and Quality managers contributed positive returns, but underperformed their benchmarks and the MSCI ACWI.
The preceding information is the opinion of portfolio management only through the end of the period stated. Any such opinions are subject to change at any time based upon market or other conditions and should not be relied upon as investment advice. Past performance is no guarantee of future results, and there is no guarantee that market forecasts will be realized.
How has the Fund historically performed?
The graph below illustrates a hypothetical investment of $10,000 in Class A of the Wilmington Global Alpha Equities Fund, assuming the maximum sales load of 5.5%, from April 30, 2016 to April 30, 2026, compared to the MSCI ACWI Index (Net) (broad-based securities market index) and HFRX Equity Hedge Index.
GROWTH OF $10,000
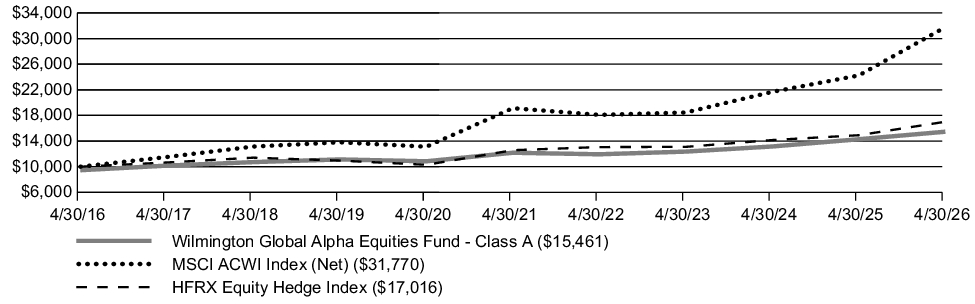
| AVERAGE ANNUAL TOTAL RETURN | 1 Year | 5 Year | 10 Years |
| Wilmington Global Alpha Equities Fund — Class A (including 5.5% maximum sales load) | 2.26% | 3.70% | 4.45% |
| Wilmington Global Alpha Equities Fund — Class A (excluding sales load) | 8.21% | 4.89% | 5.04% |
| MSCI ACWI Index (Net) | 31.00% | 10.68% | 12.25% |
| HFRX Equity Hedge Index | 14.07% | 6.24% | 5.46% |
Key Fund Statistics
| Fund net assets | $242,419,971 |
| Total number of portfolio holdings | 738 |
| Total advisory fees paid | $2,276,437 |
| Portfolio turnover rate as of the end of the reporting period | 66% |
What Did the Fund Invest In?
(as of April 30, 2026)
PORTFOLIO COMPOSITION
(as a % of Total Investments)
(as a % of Total Investments)
| Common Stocks | 94.8% |
| Money Market Fund | 4.7% |
| Exchange-Traded Funds | 0.3% |
| Preferred Stocks | 0.2% |
| Long Equity Index Futures (Notional Value) | 1.5% |
| Short Equity Index Futures (Notional Value) | (47.1)% |
SECTOR CLASSIFICATION
(as a % of Total Investments)
(as a % of Total Investments)
| Information Technology | 21.4% |
| Financials | 16.6% |
| Industrials | 12.9% |
| Consumer Discretionary | 10.0% |
| Health Care | 8.6% |
| Communication Services | 7.9% |
| Consumer Staples | 4.8% |
| Materials | 4.1% |
| Energy | 3.3% |
| Real Estate | 2.6% |
| Utilities | 2.6% |
COUNTRY ALLOCATION
(as a % of Total Investments)
(as a % of Total Investments)
| United States | 46.0% |
| Japan | 16.4% |
| United Kingdom | 5.1% |
| China | 3.9% |
| France | 3.7% |
| Netherlands | 2.3% |
| Germany | 2.2% |
| Canada | 2.0% |
| Taiwan | 1.7% |
| Switzerland | 1.4% |
| Hong Kong | 1.4% |
| Italy | 1.3% |
| South Korea | 1.2% |
| Other Countries | 6.7% |
What were the Fund expenses for the last year?
(Based on a hypothetical $10,000 investment)
| Fund (Class) | Costs of $10,000 Investment |
Costs paid as a percentage of a $10,000 investment |
| Wilmington Large-Cap Strategy Fund (Class I) |
$29 | 0.25% |
How did the Fund perform last year?
- For the reporting period ended April 30, 2026, the Fund's Class I shares returned 30.12%.
- For the same period, the Russell 1000 Index (the “Index”) returned 30.42%.
- During the same period the Fund maintained sector weightings in line with the benchmark Index resulting in similar performance.
The Fund ended the annual fiscal year up, led by the following sectors: technology, communication services and industrials. Real estate, consumer staples, and utilities were the worst performing sectors indicating weaker defense sectors. The Artificial Intelligence (AI) theme continued to play out as technology was the best performing sector over this period. AI positivity permeated into strong performance in communication services and industrial companies that benefit from the buildout of AI data center capacity. Overall, uncertainty in the equity market from the Iran conflict had a subdued effect on markets as the growth acceleration in AI spend overshadowed the potential dampening effects of high oil prices.
The preceding information is the opinion of portfolio management only through the end of the period stated. Any such opinions are subject to change at any time based upon market or other conditions and should not be relied upon as investment advice. Past performance is no guarantee of future results, and there is no guarantee that market forecasts will be realized.
How has the Fund historically performed?
The graph below illustrates a hypothetical investment of $100,000 in Class I of the Wilmington Large-Cap Strategy Fund from April 30, 2016 to April 30, 2026, compared to the Russell 1000® Index (broad-based securities market index).
GROWTH OF $100,000
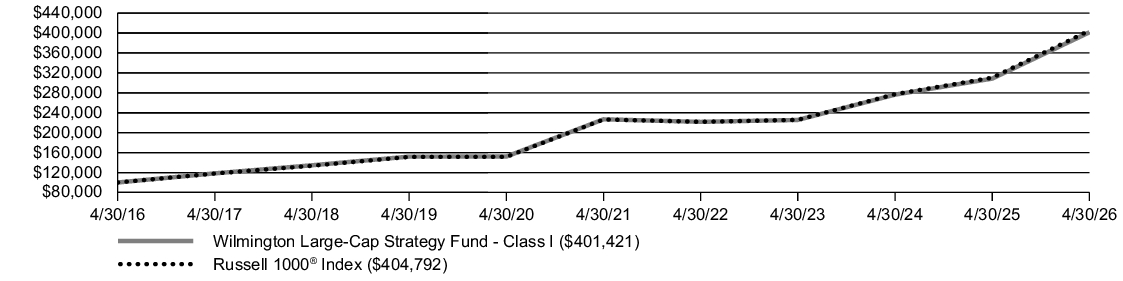
| AVERAGE ANNUAL TOTAL RETURN | 1 Year | 5 Year | 10 Years |
| Wilmington Large-Cap Strategy Fund — Class I | 30.12% | 12.10% | 14.91% |
| Russell 1000® Index | 30.42% | 12.32% | 15.01% |
Key Fund Statistics
| Fund net assets | $614,089,137 |
| Total number of portfolio holdings | 1,020 |
| Total advisory fees paid | $806,759 |
| Portfolio turnover rate as of the end of the reporting period | 7% |
What Did the Fund Invest In?
(as of April 30, 2026)
PORTFOLIO COMPOSITION
(as a % of Total Investments)
(as a % of Total Investments)
| Common Stocks | 99.2% |
| Cash Collateral Invested for Securities on Loan | 0.7% |
| Investment Companies | 0.1% |
SECTOR CLASSIFICATION
(as a % of Total Investments)
(as a % of Total Investments)
| Information Technology | 33.0% |
| Financials | 12.3% |
| Communication Services | 10.7% |
| Consumer Discretionary | 10.1% |
| Industrials | 9.8% |
| Health Care | 8.5% |
| Consumer Staples | 4.7% |
| Energy | 3.5% |
| Utilities | 2.3% |
| Real Estate | 2.2% |
| Materials | 2.1% |