Shareholder Report
|
12 Months Ended |
|
Apr. 30, 2026
USD ($)
Holding
|
|---|
| Shareholder Report [Line Items] |
|
| Document Type |
N-CSR
|
| Amendment Flag |
false
|
| Registrant Name |
New York Life Investments ETF Trust
|
| Entity Central Index Key |
0001415995
|
| Entity Investment Company Type |
N-1A
|
| Document Period End Date |
Apr. 30, 2026
|
| Shareholder Report Annual or Semi-Annual |
annual shareholder report
|
| C000069675 |
|
| Shareholder Report [Line Items] |
|
| Fund Name |
NYLI Hedge Multi-Strategy Tracker ETF
|
| Trading Symbol |
QAI
|
| Security Exchange Name |
NYSEArca
|
| Annual or Semi-Annual Statement [Text Block] |
This annual shareholder report contains important information about NYLI Hedge Multi-Strategy Tracker ETF (the "Fund") for the period of May 1, 2025 to April 30, 2026.
|
| Additional Information [Text Block] |
You can find additional information about the Fund at dfinview.com/NYLIM. You can also request this information by contacting us at 888-474-7725.
|
| Additional Information Phone Number |
888-474-7725
|
| Additional Information Website |
dfinview.com/NYLIM
|
| Expenses [Text Block] |
What were the Fund costs for the last year? (based on a hypothetical $10,000 investment) Table SummaryFund | Costs of a $10,000 investment | Costs paid as a percentage of a $10,000 investmentFootnote Reference1 |
|---|
NYLI Hedge Multi-Strategy Tracker ETF | $58 | 0.54% |
|---|
| Footnote | Description | Footnote1 | Reflects fee waivers and/or expense reimbursements, without which expenses would have been higher. |
|
| Expenses Paid, Amount |
$ 58
|
| Expense Ratio, Percent |
0.54%
|
| Factors Affecting Performance [Text Block] |
What factors influenced Fund performance during the reporting period?During the 12‑month period ended April 30, 2026, the Fund's performance benefited from a macroeconomic environment marked by elevated interest rates, inflation uncertainty, and episodic volatility, which expanded opportunity sets across asset classes. Hedge fund strategies generated strong returns amid increased dispersion, supported by positioning around interest rates, currencies, and event‑driven opportunities. Consistent with its systematic, multi‑strategy approach, the Fund benefited from equity market strength, fixed income carry, and diversified exposures that helped navigate periods of volatility. The following table outlines the key factors (securities, sectors, industries, market events and/or other characteristics) that materially affected the Fund’s performance during the reporting period. |
| Performance Past Does Not Indicate Future [Text] |
Keep in mind that the Fund’s past performance is not a good predictor of how the Fund will perform in the future.
|
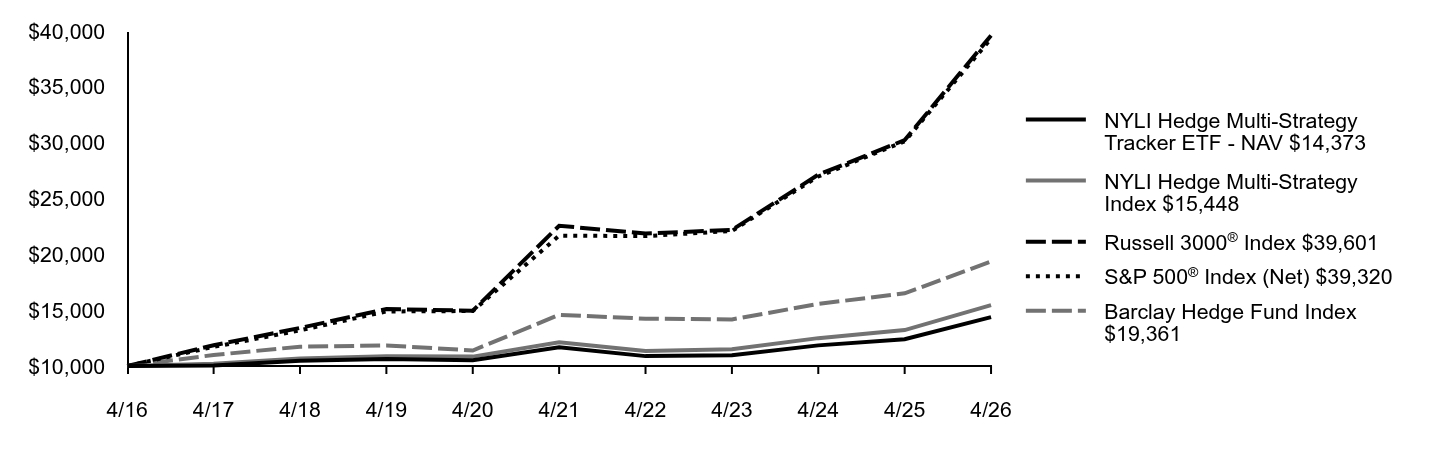
| Line Graph [Table Text Block] |
Table Summary | NYLI Hedge Multi-Strategy Tracker ETF - NAV 14,373 | NYLI Hedge Multi-Strategy Index15,448 | Russell 3000® Index39,601 | S&P 500® Index (Net)39,320 | Barclay Hedge Fund Index19,361 |
|---|
4/16 | 10,000 | 10,000 | 10,000 | 10,000 | 10,000 |
|---|
4/17 | 10,042 | 10,191 | 11,858 | 11,717 | 10,986 |
|---|
4/18 | 10,468 | 10,682 | 13,406 | 13,194 | 11,731 |
|---|
4/19 | 10,631 | 10,882 | 15,106 | 14,884 | 11,844 |
|---|
4/20 | 10,521 | 10,841 | 14,948 | 14,923 | 11,390 |
|---|
4/21 | 11,679 | 12,115 | 22,560 | 21,676 | 14,581 |
|---|
4/22 | 10,885 | 11,351 | 21,857 | 21,631 | 14,238 |
|---|
4/23 | 10,959 | 11,504 | 22,186 | 22,093 | 14,168 |
|---|
4/24 | 11,847 | 12,495 | 27,133 | 26,974 | 15,558 |
|---|
4/25 | 12,405 | 13,218 | 30,227 | 30,114 | 16,509 |
|---|
4/26 | 14,373 | 15,448 | 39,601 | 39,320 | 19,361 |
|---|
|
| Average Annual Return [Table Text Block] |
Table SummaryAverage Annual Total Returns for the Period Ended April 30, 2026 | Inception Date | One Year | Five Years | Ten Years |
|---|
NYLI Hedge Multi-Strategy Tracker ETF - NAV | 3/25/2009 | 15.86% | 4.24% | 3.69% |
|---|
NYLI Hedge Multi-Strategy IndexFootnote Reference1 | | 16.87% | 4.98% | 4.44% |
|---|
Russell 3000® IndexFootnote Reference2 | | 31.01% | 11.91% | 14.75% |
|---|
S&P 500® Index (Net)Footnote Reference3 | | 30.57% | 12.65% | 14.67% |
|---|
Barclay Hedge Fund IndexFootnote Reference4 | | 17.28% | 5.83% | 6.83% |
|---|
|
| Performance Inception Date |
Mar. 25, 2009
|
| No Deduction of Taxes [Text Block] |
The graph and table do not reflect the deduction of taxes that a shareholder would pay on Fund distributions or redemption of Fund shares.
|
| AssetsNet |
$ 968,486,517
|
| Holdings Count | Holding |
114
|
| Advisory Fees Paid, Amount |
$ 4,009,127
|
| InvestmentCompanyPortfolioTurnover |
55.00%
|
| Additional Fund Statistics [Text Block] |
Table SummaryFund's net assets | $968,486,517 |
|---|
Total number of portfolio holdings | 114 |
|---|
Total advisory fees paid | $4,009,127 |
|---|
Portfolio turnover rate | 55% |
|---|
|
| Holdings [Text Block] |
Top Ten Holdings and/or Issuers*Table SummaryiShares Floating Rate Bond ETF | 17.0% |
|---|
Franklin Senior Loan ETF | 8.3% |
|---|
Vanguard FTSE Developed Markets ETF | 8.1% |
|---|
Vanguard Short-Term Treasury ETF | 7.5% |
|---|
iShares Core S&P Small-Cap ETF | 5.7% |
|---|
State Street SPDR Bloomberg Investment Grade Floating Rate ETF | 5.1% |
|---|
iShares MSCI USA Momentum Factor ETF | 4.4% |
|---|
iShares MSCI Emerging Markets ex China ETF | 4.3% |
|---|
iShares National Muni Bond ETF | 3.8% |
|---|
iShares Convertible Bond ETF | 3.6% |
|---|
* Excluding short-term investments Table SummaryFloating Rate - Investment Grade Funds | 22.1% |
|---|
Short-Term Investments | 14.3% |
|---|
Bank Loan Fund | 8.3% |
|---|
International Equity Core Fund | 8.1% |
|---|
U.S. Short Term Treasury Bond Fund | 7.5% |
|---|
Municipal Bond Funds | 7.4% |
|---|
Convertible Bond Funds | 6.8% |
|---|
U.S. Small Cap Core Fund | 5.6% |
|---|
Emerging Markets Funds | 5.3% |
|---|
U.S. Momentum Fund | 4.3% |
|---|
Merger Arbitrage Funds | 4.2% |
|---|
Managed Futures
Funds | 3.7% |
|---|
U.S. Sector Funds | 3.0% |
|---|
Preferred Fund | 2.2% |
|---|
Agriculture Fund | 2.0% |
|---|
High Yield Corporate Bond Funds | 1.9% |
|---|
Broad Funds | 1.8% |
|---|
U.S. Large Cap Core Funds | 1.6% |
|---|
BRIC Equity Fund | 1.6% |
|---|
U.S. Dollar Fund | 1.5% |
|---|
Mortgage Backed Fund | 0.5% |
|---|
Derivative Income Fund | 0.2% |
|---|
Silver Fund | 0.1% |
|---|
China Fund | 0.1% |
|---|
Other Asset and Liabilities | (14.1)% |
|---|
|
| Material Fund Change [Text Block] |
|
| C000077928 |
|
| Shareholder Report [Line Items] |
|
| Fund Name |
NYLI Merger Arbitrage ETF
|
| Trading Symbol |
MNA
|
| Security Exchange Name |
NYSEArca
|
| Annual or Semi-Annual Statement [Text Block] |
This annual shareholder report contains important information about NYLI Merger Arbitrage ETF (the "Fund") for the period of May 1, 2025 to April 30, 2026.
|
| Additional Information [Text Block] |
You can find additional information about the Fund at dfinview.com/NYLIM. You can also request this information by contacting us at 888-474-7725.
|
| Additional Information Phone Number |
888-474-7725
|
| Additional Information Website |
dfinview.com/NYLIM
|
| Expenses [Text Block] |
What were the Fund costs for the last year? (based on a hypothetical $10,000 investment) Table SummaryFund | Costs of a $10,000 investment | Costs paid as a percentage of a $10,000 investment |
|---|
NYLI Merger Arbitrage ETF | $78 | 0.76% |
|---|
|
| Expenses Paid, Amount |
$ 78
|
| Expense Ratio, Percent |
0.76%
|
| Factors Affecting Performance [Text Block] |
What factors influenced Fund performance during the reporting period?During the 12‑month period ended April 30, 2026, the Fund's performance benefited from a more supportive global merger and acquisition environment, driven by improved financing conditions, resilient equity markets, and increased deal activity. While periods of volatility led to temporary spread widening, strong deal flow, limited deal breaks, and subsequent spread compression supported performance. The Fund’s rules‑based strategy of capturing announced deal spreads and hedging stock‑financed transactions contributed to results as transactions progressed toward completion. The following table outlines the key factors (securities, sectors, industries, market events and/or other characteristics) that materially affected the Fund’s performance during the reporting period. |
| Performance Past Does Not Indicate Future [Text] |
Keep in mind that the Fund’s past performance is not a good predictor of how the Fund will perform in the future.
|
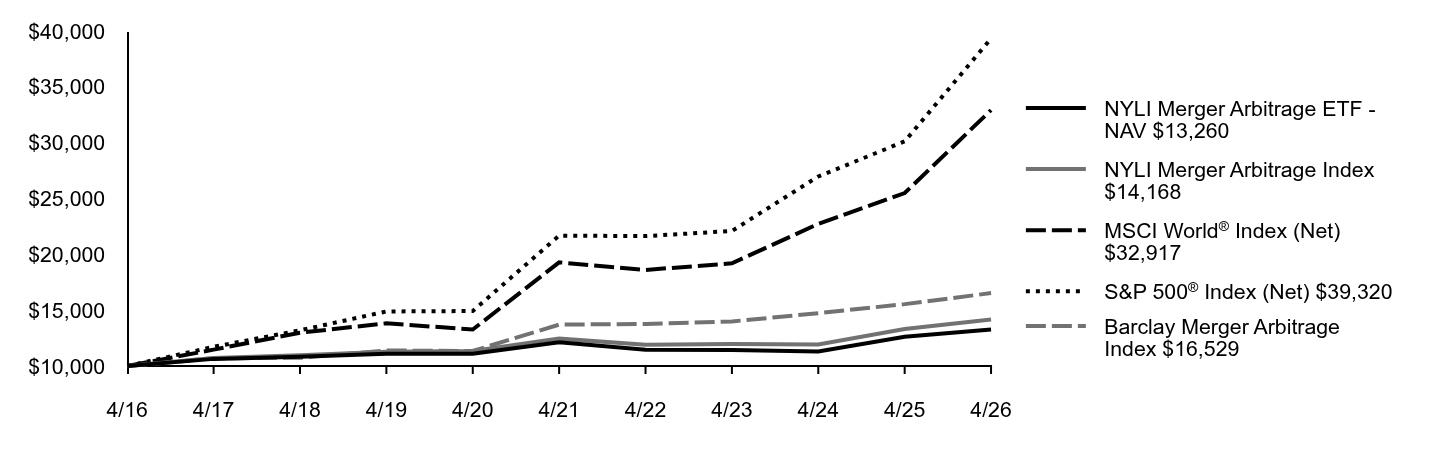
| Line Graph [Table Text Block] |
Table Summary | NYLI Merger Arbitrage ETF - NAV 13,260 | NYLI Merger Arbitrage Index14,168 | MSCI World® Index (Net)32,917 | S&P 500® Index (Net)39,320 | Barclay Merger Arbitrage Index16,529 |
|---|
4/16 | 10,000 | 10,000 | 10,000 | 10,000 | 10,000 |
|---|
4/17 | 10,638 | 10,715 | 11,465 | 11,717 | 10,689 |
|---|
4/18 | 10,825 | 10,961 | 12,981 | 13,194 | 10,742 |
|---|
4/19 | 11,097 | 11,282 | 13,822 | 14,884 | 11,391 |
|---|
4/20 | 11,108 | 11,338 | 13,268 | 14,923 | 11,344 |
|---|
4/21 | 12,116 | 12,451 | 19,282 | 21,676 | 13,705 |
|---|
4/22 | 11,465 | 11,894 | 18,604 | 21,631 | 13,772 |
|---|
4/23 | 11,440 | 11,965 | 19,195 | 22,093 | 13,988 |
|---|
4/24 | 11,297 | 11,927 | 22,724 | 26,974 | 14,733 |
|---|
4/25 | 12,627 | 13,312 | 25,487 | 30,114 | 15,542 |
|---|
4/26 | 13,260 | 14,168 | 32,917 | 39,320 | 16,529 |
|---|
|
| Average Annual Return [Table Text Block] |
Table SummaryAverage Annual Total Returns for the Period Ended April 30, 2026 | Inception Date | One Year | Five Years | Ten Years |
|---|
NYLI Merger Arbitrage ETF - NAV | 11/17/2009 | 5.19% | 1.82% | 2.86% |
|---|
NYLI Merger Arbitrage IndexFootnote Reference1 | | 6.43% | 2.62% | 3.55% |
|---|
MSCI World® Index (Net)Footnote Reference2 | | 29.16% | 11.29% | 12.65% |
|---|
S&P 500® Index (Net)Footnote Reference3 | | 30.57% | 12.65% | 14.67% |
|---|
Barclay Merger Arbitrage IndexFootnote Reference4 | | 6.36% | 3.82% | 5.15% |
|---|
|
| Performance Inception Date |
Nov. 17, 2009
|
| No Deduction of Taxes [Text Block] |
The graph and table do not reflect the deduction of taxes that a shareholder would pay on Fund distributions or redemption of Fund shares.
|
| AssetsNet |
$ 250,830,355
|
| Holdings Count | Holding |
77
|
| Advisory Fees Paid, Amount |
$ 1,871,456
|
| InvestmentCompanyPortfolioTurnover |
335.00%
|
| Additional Fund Statistics [Text Block] |
Table SummaryFund's net assets | $250,830,355 |
|---|
Total number of portfolio holdings | 77 |
|---|
Total advisory fees paid | $1,871,456 |
|---|
Portfolio turnover rate | 335% |
|---|
|
| Holdings [Text Block] |
Top Ten Holdings and/or Issuers*Table SummaryTeck Resources Ltd., Class B | 5.0% |
|---|
Norfolk Southern Corp. | 4.1% |
|---|
Electronic Arts, Inc. | 3.8% |
|---|
Northwestern Energy Group, Inc. | 3.7% |
|---|
Chart Industries, Inc. | 3.5% |
|---|
TXNM Energy, Inc. | 3.5% |
|---|
Warner Bros Discovery, Inc. | 3.2% |
|---|
AES Corp. (The) | 3.0% |
|---|
Kenvue, Inc. | 2.8% |
|---|
Qorvo, Inc. | 2.6% |
|---|
* Excluding short-term investments Table SummaryIndustrials | 17.8% |
|---|
Utilities | 14.5% |
|---|
Financials | 13.0% |
|---|
Short-Term Investments | 12.6% |
|---|
Health Care | 10.8% |
|---|
Communication Services | 10.0% |
|---|
Materials | 9.8% |
|---|
Consumer Staples | 4.3% |
|---|
Information Technology | 4.3% |
|---|
Real Estate | 3.6% |
|---|
Other | (0.7)% |
|---|
|
| Material Fund Change [Text Block] |
|
| C000170331 |
|
| Shareholder Report [Line Items] |
|
| Fund Name |
NYLI Candriam International Equity ETF
|
| Trading Symbol |
IQSI
|
| Security Exchange Name |
NYSEArca
|
| Annual or Semi-Annual Statement [Text Block] |
This annual shareholder report contains important information about NYLI Candriam International Equity ETF (the "Fund") for the period of May 1, 2025 to April 30, 2026.
|
| Additional Information [Text Block] |
You can find additional information about the Fund at dfinview.com/NYLIM. You can also request this information by contacting us at 888-474-7725.
|
| Additional Information Phone Number |
888-474-7725
|
| Additional Information Website |
dfinview.com/NYLIM
|
| Expenses [Text Block] |
What were the Fund costs for the last year? (based on a hypothetical $10,000 investment) Table SummaryFund | Costs of a $10,000 investment | Costs paid as a percentage of a $10,000 investmentFootnote Reference1 |
|---|
NYLI Candriam International Equity ETF | $17 | 0.15% |
|---|
| Footnote | Description | Footnote1 | Reflects fee waivers and/or expense reimbursements, without which expenses would have been higher. |
|
| Expenses Paid, Amount |
$ 17
|
| Expense Ratio, Percent |
0.15%
|
| Factors Affecting Performance [Text Block] |
What factors influenced Fund performance during the reporting period?During the 12-month reporting period ended April 30, 2026, the Fund’s performance was shaped by a shifting global macroeconomic backdrop, as moderating inflation and diverging monetary policy paths—particularly earlier easing expectations outside the United States—supported developed international equities and contributed to a partial reversal of prior U.S. market leadership. A weaker U.S. dollar for much of the period—alongside geopolitical alliance re-orientation, supply chain re-shoring, improving economic conditions in Europe and Japan, and continued fiscal and industrial policy support—further underpinned returns, particularly in cyclical sectors such as financials and industrials. These dynamics were offset in part by episodic volatility tied to geopolitical tensions, trade frictions and uneven global demand, which created dispersion across sectors and regions reflected in the Index’s performance. The following table outlines the key factors (securities, sectors, industries, market events and/or other characteristics) that materially affected the Fund’s performance during the reporting period. |
| Performance Past Does Not Indicate Future [Text] |
Keep in mind that the Fund’s past performance is not a good predictor of how the Fund will perform in the future.
|
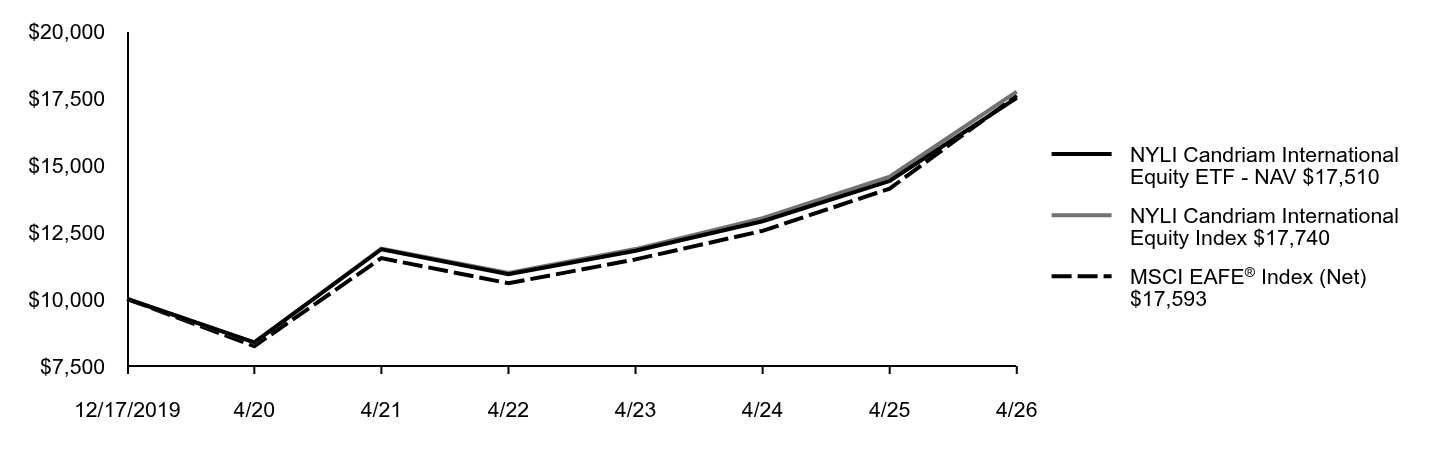
| Line Graph [Table Text Block] |
Table Summary | NYLI Candriam International Equity ETF - NAV 17,510 | NYLI Candriam International Equity Index17,740 | MSCI EAFE® Index (Net)17,593 |
|---|
12/17/2019 | 10,000 | 10,000 | 10,000 |
|---|
4/20 | 8,382 | 8,373 | 8,240 |
|---|
4/21 | 11,856 | 11,877 | 11,526 |
|---|
4/22 | 10,929 | 10,969 | 10,587 |
|---|
4/23 | 11,801 | 11,863 | 11,478 |
|---|
4/24 | 12,903 | 13,015 | 12,543 |
|---|
4/25 | 14,405 | 14,562 | 14,120 |
|---|
4/26 | 17,510 | 17,740 | 17,593 |
|---|
|
| Average Annual Return [Table Text Block] |
Table SummaryAverage Annual Total Returns for the Period Ended April 30, 2026 | Inception Date | One Year | Five Years | Since Inception |
|---|
NYLI Candriam International Equity ETF - NAV | 12/17/2019 | 21.56% | 8.11% | 9.19% |
|---|
NYLI Candriam International Equity IndexFootnote Reference1 | | 21.82% | 8.35% | 9.41% |
|---|
MSCI EAFE® Index (Net)Footnote Reference2 | | 24.60% | 8.83% | 9.27% |
|---|
|
| Performance Inception Date |
Dec. 17, 2019
|
| No Deduction of Taxes [Text Block] |
The graph and table do not reflect the deduction of taxes that a shareholder would pay on Fund distributions or redemption of Fund shares.
|
| AssetsNet |
$ 236,837,995
|
| Holdings Count | Holding |
605
|
| Advisory Fees Paid, Amount |
$ 304,636
|
| InvestmentCompanyPortfolioTurnover |
14.00%
|
| Additional Fund Statistics [Text Block] |
Table SummaryFund's net assets | $236,837,995 |
|---|
Total number of portfolio holdings | 605 |
|---|
Total advisory fees paid | $304,636 |
|---|
Portfolio turnover rate | 14% |
|---|
|
| Holdings [Text Block] |
Top Ten Holdings and/or Issuers*Table SummaryASML Holding NV | 4.1% |
|---|
Roche Holding AG | 2.1% |
|---|
AstraZeneca PLC | 2.1% |
|---|
Novartis AG | 2.0% |
|---|
Nestle SA | 1.9% |
|---|
Siemens AG | 1.6% |
|---|
Commonwealth Bank of Australia | 1.5% |
|---|
Toyota Motor Corp. | 1.4% |
|---|
Schneider Electric SE | 1.3% |
|---|
SAP SE | 1.2% |
|---|
* Excluding short-term investments Table SummaryJapan | 26.2% |
|---|
United Kingdom | 9.8% |
|---|
United States | 9.5% |
|---|
Australia | 9.5% |
|---|
Germany | 7.2% |
|---|
Netherlands | 6.8% |
|---|
France | 4.8% |
|---|
Switzerland | 4.1% |
|---|
Sweden | 3.4% |
|---|
Spain | 3.1% |
|---|
Other | 15.6% |
|---|
|
| Material Fund Change [Text Block] |
|
| C000238086 |
|
| Shareholder Report [Line Items] |
|
| Fund Name |
NYLI Candriam U.S. Mid Cap Equity ETF
|
| Trading Symbol |
IQSM
|
| Security Exchange Name |
NYSEArca
|
| Annual or Semi-Annual Statement [Text Block] |
This annual shareholder report contains important information about NYLI Candriam U.S. Mid Cap Equity ETF (the "Fund") for the period of May 1, 2025 to April 30, 2026.
|
| Additional Information [Text Block] |
You can find additional information about the Fund at dfinview.com/NYLIM. You can also request this information by contacting us at 888-474-7725.
|
| Additional Information Phone Number |
888-474-7725
|
| Additional Information Website |
dfinview.com/NYLIM
|
| Expenses [Text Block] |
What were the Fund costs for the last year? (based on a hypothetical $10,000 investment) Table SummaryFund | Costs of a $10,000 investment | Costs paid as a percentage of a $10,000 investmentFootnote Reference1 |
|---|
NYLI Candriam U.S. Mid Cap Equity ETF | $17 | 0.15% |
|---|
| Footnote | Description | Footnote1 | Reflects fee waivers and/or expense reimbursements, without which expenses would have been higher. |
|
| Expenses Paid, Amount |
$ 17
|
| Expense Ratio, Percent |
0.15%
|
| Factors Affecting Performance [Text Block] |
What factors influenced Fund performance during the reporting period?During the 12-month reporting period ended April 30, 2026, the Fund’s performance was shaped by a bifurcated market environment in which moderating inflation and expectations for eventual monetary easing supported overall risk sentiment, while still-elevated interest rates continued to weigh on more leveraged, rate-sensitive segments of the U.S. mid-cap universe. This dynamic led to pronounced dispersion, with fundamentally stronger, earnings-resilient companies outperforming peers more dependent on external financing or cyclical demand. As a result, returns were driven by company-specific outcomes and prevailing macro conditions, namely the AI capital expenditure boom and energy price volatility driven by geopolitical conflicts, across sectors such as industrials, technology and energy, rather than broad-based market leadership. The following table outlines the key factors (securities, sectors, industries, market events and/or other characteristics) that materially affected the Fund’s performance during the reporting period. |
| Performance Past Does Not Indicate Future [Text] |
Keep in mind that the Fund’s past performance is not a good predictor of how the Fund will perform in the future.
|
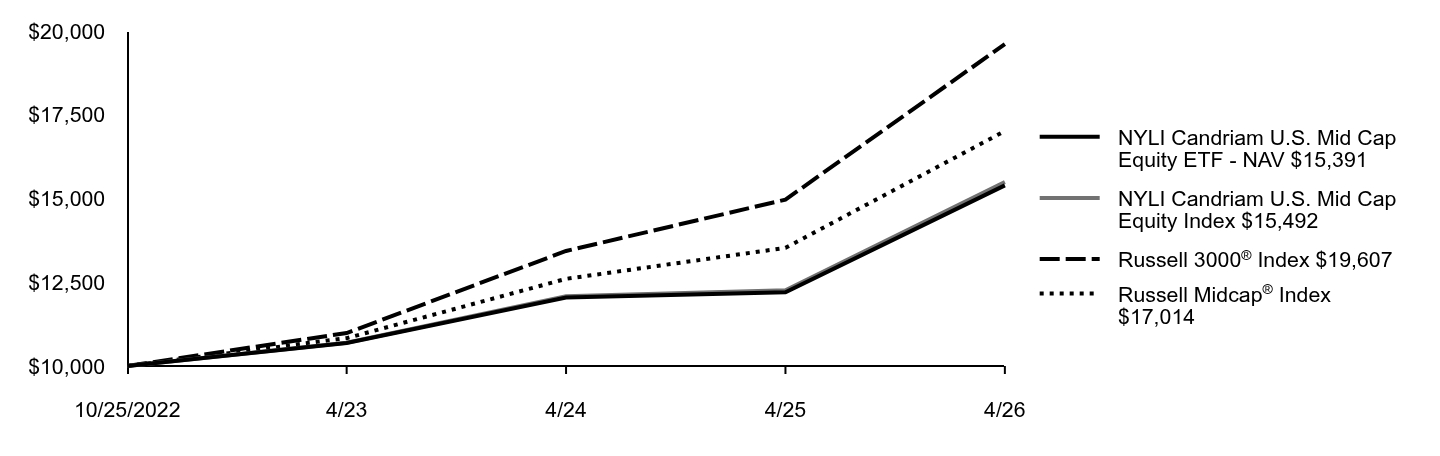
| Line Graph [Table Text Block] |
Table Summary | NYLI Candriam U.S. Mid Cap Equity ETF - NAV 15,391 | NYLI Candriam U.S. Mid Cap Equity Index15,492 | Russell 3000® Index19,607 | Russell Midcap® Index17,014 |
|---|
10/25/2022 | 10,000 | 10,000 | 10,000 | 10,000 |
|---|
4/23 | 10,685 | 10,695 | 10,984 | 10,831 |
|---|
4/24 | 12,044 | 12,079 | 13,434 | 12,602 |
|---|
4/25 | 12,203 | 12,259 | 14,966 | 13,527 |
|---|
4/26 | 15,391 | 15,492 | 19,607 | 17,014 |
|---|
|
| Average Annual Return [Table Text Block] |
Table SummaryAverage Annual Total Returns for the Period Ended April 30, 2026 | Inception Date | One Year | Since Inception |
|---|
NYLI Candriam U.S. Mid Cap Equity ETF - NAV | 10/25/2022 | 26.12% | 13.04% |
|---|
NYLI Candriam U.S. Mid Cap Equity IndexFootnote Reference1 | | 26.37% | 13.25% |
|---|
Russell 3000® IndexFootnote Reference2 | | 31.01% | 21.09% |
|---|
Russell Midcap® IndexFootnote Reference3 | | 25.78% | 16.30% |
|---|
|
| Performance Inception Date |
Oct. 25, 2022
|
| No Deduction of Taxes [Text Block] |
The graph and table do not reflect the deduction of taxes that a shareholder would pay on Fund distributions or redemption of Fund shares.
|
| AssetsNet |
$ 315,038,352
|
| Holdings Count | Holding |
243
|
| Advisory Fees Paid, Amount |
$ 319,177
|
| InvestmentCompanyPortfolioTurnover |
49.00%
|
| Additional Fund Statistics [Text Block] |
Table SummaryFund's net assets | $315,038,352 |
|---|
Total number of portfolio holdings | 243 |
|---|
Total advisory fees paid | $319,177 |
|---|
Portfolio turnover rate | 49% |
|---|
|
| Holdings [Text Block] |
Top Ten Holdings and/or Issuers*Table SummaryTechnipFMC PLC | 1.3% |
|---|
Fabrinet | 1.1% |
|---|
Revolution Medicines, Inc. | 1.1% |
|---|
XPO, Inc. | 1.1% |
|---|
MasTec, Inc. | 1.1% |
|---|
United Therapeutics Corp. | 1.1% |
|---|
Albemarle Corp. | 1.0% |
|---|
nVent Electric PLC | 1.0% |
|---|
Twilio, Inc., Class A | 0.9% |
|---|
CH Robinson Worldwide, Inc. | 0.9% |
|---|
* Excluding short-term investments Table SummaryIndustrials | 22.7% |
|---|
Information Technology | 14.4% |
|---|
Financials | 14.2% |
|---|
Health Care | 14.2% |
|---|
Consumer Discretionary | 9.7% |
|---|
Real Estate | 9.0% |
|---|
Materials | 5.8% |
|---|
Consumer Staples | 4.5% |
|---|
Energy | 2.6% |
|---|
Communication Services | 2.2% |
|---|
Other | 0.7% |
|---|
|
| Material Fund Change [Text Block] |
|
| C000170332 |
|
| Shareholder Report [Line Items] |
|
| Fund Name |
NYLI Candriam U.S. Large Cap Equity ETF
|
| Trading Symbol |
IQSU
|
| Security Exchange Name |
NYSEArca
|
| Annual or Semi-Annual Statement [Text Block] |
This annual shareholder report contains important information about NYLI Candriam U.S. Large Cap Equity ETF (the "Fund") for the period of May 1, 2025 to April 30, 2026.
|
| Additional Information [Text Block] |
You can find additional information about the Fund at dfinview.com/NYLIM. You can also request this information by contacting us at 888-474-7725.
|
| Additional Information Phone Number |
888-474-7725
|
| Additional Information Website |
dfinview.com/NYLIM
|
| Expenses [Text Block] |
What were the Fund costs for the last year? (based on a hypothetical $10,000 investment) Table SummaryFund | Costs of a $10,000 investment | Costs paid as a percentage of a $10,000 investmentFootnote Reference1 |
|---|
NYLI Candriam U.S. Large Cap Equity ETF | $10 | 0.09% |
|---|
| Footnote | Description | Footnote1 | Reflects fee waivers and/or expense reimbursements, without which expenses would have been higher. |
|
| Expenses Paid, Amount |
$ 10
|
| Expense Ratio, Percent |
0.09%
|
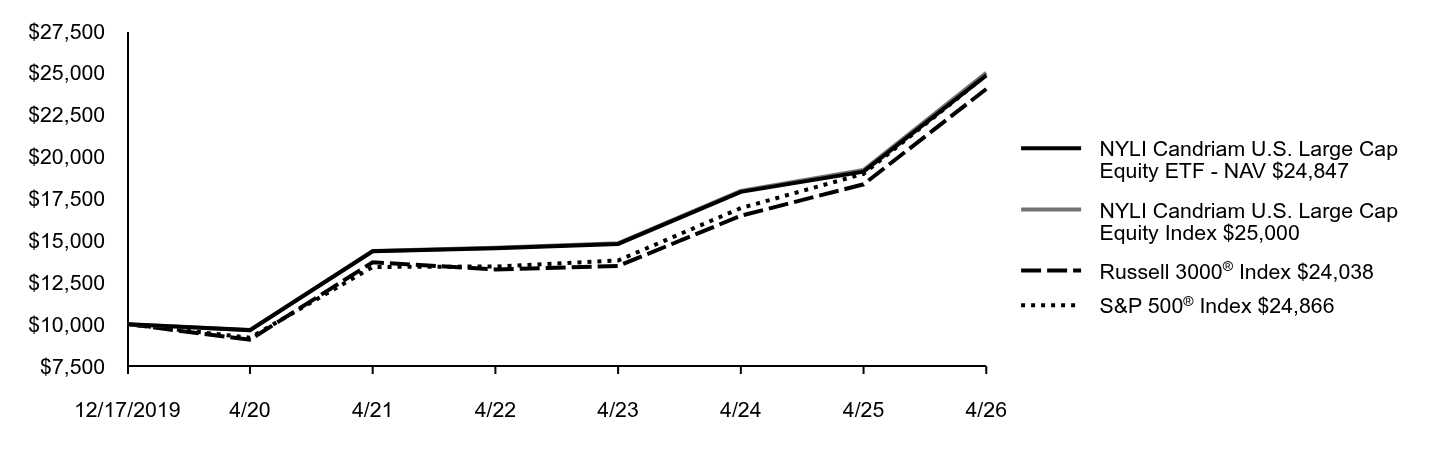
| Factors Affecting Performance [Text Block] |
What factors influenced Fund performance during the reporting period?During the 12-month reporting period ended April 30, 2026, the Fund’s performance was driven primarily by a narrow cohort of mega-cap technology and communication services companies, as continued investor enthusiasm around artificial intelligence and cloud infrastructure fueled outsized gains in hyperscalers and semiconductor-linked names. This concentration of market leadership was reinforced by strong capital expenditure cycles in AI-related infrastructure and resilient earnings growth, even amid elevated interest rates and periodic macro volatility. In contrast, portions of the software and payments ecosystem lagged, as higher discount rates, intensifying competition and concerns around AI-driven disruption weighed on valuations and contributed to pronounced dispersion within the technology sector. The following table outlines the key factors (securities, sectors, industries, market events and/or other characteristics) that materially affected the Fund’s performance during the reporting period. |
| Performance Past Does Not Indicate Future [Text] |
Keep in mind that the Fund’s past performance is not a good predictor of how the Fund will perform in the future.
|
| Line Graph [Table Text Block] |
Table Summary | NYLI Candriam U.S. Large Cap Equity ETF - NAV 24,847 | NYLI Candriam U.S. Large Cap Equity Index25,000 | Russell 3000® Index24,038 | S&P 500® Index24,866 |
|---|
12/17/2019 | 10,000 | 10,000 | 10,000 | 10,000 |
|---|
4/20 | 9,642 | 9,638 | 9,074 | 9,188 |
|---|
4/21 | 14,352 | 14,367 | 13,694 | 13,413 |
|---|
4/22 | 14,526 | 14,553 | 13,267 | 13,441 |
|---|
4/23 | 14,788 | 14,823 | 13,467 | 13,800 |
|---|
4/24 | 17,895 | 17,957 | 16,470 | 16,927 |
|---|
4/25 | 19,104 | 19,199 | 18,348 | 18,974 |
|---|
4/26 | 24,847 | 25,000 | 24,038 | 24,866 |
|---|
|
| Average Annual Return [Table Text Block] |
Table SummaryAverage Annual Total Returns for the Period Ended April 30, 2026 | Inception Date | One Year | Five Years | Since Inception |
|---|
NYLI Candriam U.S. Large Cap Equity ETF - NAV | 12/17/2019 | 30.06% | 11.60% | 15.35% |
|---|
NYLI Candriam U.S. Large Cap Equity IndexFootnote Reference1 | | 30.21% | 11.72% | 15.46% |
|---|
Russell 3000® IndexFootnote Reference2 | | 31.01% | 11.91% | 14.75% |
|---|
S&P 500® IndexFootnote Reference3 | | 31.05% | 13.14% | 15.36% |
|---|
|
| Performance Inception Date |
Dec. 17, 2019
|
| No Deduction of Taxes [Text Block] |
The graph and table do not reflect the deduction of taxes that a shareholder would pay on Fund distributions or redemption of Fund shares.
|
| AssetsNet |
$ 315,456,443
|
| Holdings Count | Holding |
267
|
| Advisory Fees Paid, Amount |
$ 229,580
|
| InvestmentCompanyPortfolioTurnover |
31.00%
|
| Additional Fund Statistics [Text Block] |
Table SummaryFund's net assets | $315,456,443 |
|---|
Total number of portfolio holdings | 267 |
|---|
Total advisory fees paid | $229,580 |
|---|
Portfolio turnover rate | 31% |
|---|
|
| Holdings [Text Block] |
Top Ten Holdings and/or Issuers*Table SummaryAlphabet, Inc. | 12.2% |
|---|
Apple, Inc. | 9.6% |
|---|
Amazon.com, Inc. | 5.7% |
|---|
Microsoft Corp. | 4.6% |
|---|
Tesla, Inc. | 3.5% |
|---|
Micron Technology, Inc. | 2.0% |
|---|
Advanced Micro Devices, Inc. | 1.9% |
|---|
Visa, Inc., Class A Shares | 1.7% |
|---|
Intel Corp. | 1.4% |
|---|
Mastercard, Inc., Class A | 1.2% |
|---|
* Excluding short-term investments Table SummaryInformation Technology | 33.3% |
|---|
Communication Services | 15.0% |
|---|
Consumer Discretionary | 14.7% |
|---|
Financials | 11.9% |
|---|
Industrials | 7.2% |
|---|
Health Care | 6.2% |
|---|
Consumer Staples | 3.5% |
|---|
Materials | 2.8% |
|---|
Real Estate | 2.8% |
|---|
Energy | 1.3% |
|---|
Other | 1.3% |
|---|
|
| Material Fund Change [Text Block] |
|
| C000158453 |
|
| Shareholder Report [Line Items] |
|
| Fund Name |
NYLI FTSE International Equity Currency Neutral ETF
|
| Trading Symbol |
HFXI
|
| Security Exchange Name |
NYSEArca
|
| Annual or Semi-Annual Statement [Text Block] |
This annual shareholder report contains important information about NYLI FTSE International Equity Currency Neutral ETF (the "Fund") for the period of May 1, 2025 to April 30, 2026.
|
| Additional Information [Text Block] |
You can find additional information about the Fund at dfinview.com/NYLIM. You can also request this information by contacting us at 888-474-7725.
|
| Additional Information Phone Number |
888-474-7725
|
| Additional Information Website |
dfinview.com/NYLIM
|
| Expenses [Text Block] |
What were the Fund costs for the last year? (based on a hypothetical $10,000 investment) Table SummaryFund | Costs of a $10,000 investment | Costs paid as a percentage of a $10,000 investment |
|---|
NYLI FTSE International Equity Currency Neutral ETF | $23 | 0.20% |
|---|
|
| Expenses Paid, Amount |
$ 23
|
| Expense Ratio, Percent |
0.20%
|
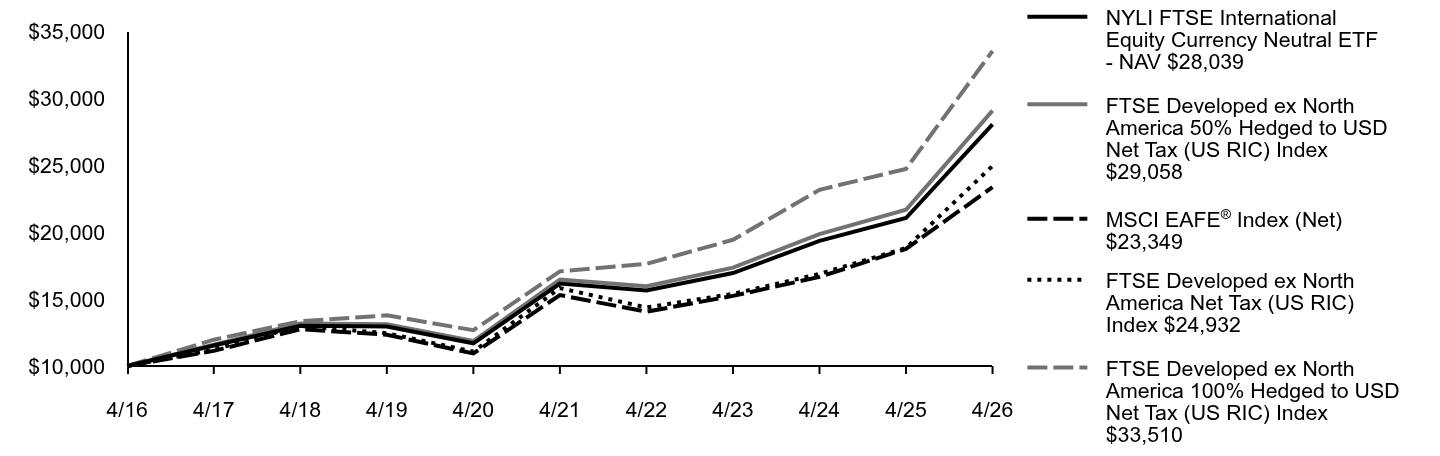
| Factors Affecting Performance [Text Block] |
What factors influenced Fund performance during the reporting period?During the 12-month reporting period ended April 30, 2026, the Fund’s performance was supported by moderating inflation, improving growth expectations in Europe and Japan, and a partial rotation away from U.S. market leadership. Currency dynamics also played a meaningful role, as a weaker U.S. dollar for much of the period enhanced unhedged returns, while the Fund’s 50% hedging approach moderated the full benefit of foreign currency appreciation and reduced volatility from late-period foreign-exchange reversals. Sector leadership was tilted toward financials, industrials and technology, reflecting improved economic sentiment, fiscal policy support and ongoing global investment in infrastructure and AI. The following table outlines the key factors (securities, sectors, industries, market events and/or other characteristics) that materially affected the Fund’s performance during the reporting period. |
| Performance Past Does Not Indicate Future [Text] |
Keep in mind that the Fund’s past performance is not a good predictor of how the Fund will perform in the future.
|
| Line Graph [Table Text Block] |
Table Summary | NYLI FTSE International Equity Currency Neutral ETF - NAV 28,039 | FTSE Developed ex North America 50% Hedged to USD Net Tax (US RIC) Index29,058 | MSCI EAFE® Index (Net)23,349 | FTSE Developed ex North America Net Tax (US RIC) Index24,932 | FTSE Developed ex North America 100% Hedged to USD Net Tax (US RIC) Index33,510 |
|---|
4/16 | 10,000 | 10,000 | 10,000 | 10,000 | 10,000 |
|---|
4/17 | 11,529 | 11,596 | 11,129 | 11,226 | 11,965 |
|---|
4/18 | 13,008 | 13,177 | 12,744 | 12,992 | 13,341 |
|---|
4/19 | 12,954 | 13,109 | 12,334 | 12,446 | 13,779 |
|---|
4/20 | 11,692 | 11,862 | 10,935 | 11,079 | 12,668 |
|---|
4/21 | 16,152 | 16,456 | 15,296 | 15,813 | 17,065 |
|---|
4/22 | 15,641 | 15,948 | 14,050 | 14,371 | 17,617 |
|---|
4/23 | 16,940 | 17,341 | 15,234 | 15,383 | 19,419 |
|---|
4/24 | 19,338 | 19,843 | 16,647 | 16,874 | 23,149 |
|---|
4/25 | 21,044 | 21,661 | 18,739 | 18,805 | 24,711 |
|---|
4/26 | 28,039 | 29,058 | 23,349 | 24,932 | 33,510 |
|---|
|
| Average Annual Return [Table Text Block] |
Table SummaryAverage Annual Total Returns for the Period Ended April 30, 2026 | Inception Date | One Year | Five Years | Ten Years |
|---|
NYLI FTSE International Equity Currency Neutral ETF - NAV | 7/22/2015 | 33.24% | 11.66% | 10.86% |
|---|
FTSE Developed ex North America 50% Hedged to USD Net Tax (US RIC) IndexFootnote Reference1 | | 34.15% | 12.04% | 11.26% |
|---|
MSCI EAFE® Index (Net)Footnote Reference2 | | 24.60% | 8.83% | 8.85% |
|---|
FTSE Developed ex North America 100% Hedged to USD Net Tax (US RIC) IndexFootnote Reference3 | | 35.60% | 14.45% | 12.85% |
|---|
FTSE Developed ex North America Net Tax (US RIC) IndexFootnote Reference4 | | 32.58% | 9.53% | 9.57% |
|---|
|
| Performance Inception Date |
Jul. 22, 2015
|
| No Deduction of Taxes [Text Block] |
The graph and table do not reflect the deduction of taxes that a shareholder would pay on Fund distributions or redemption of Fund shares.
|
| AssetsNet |
$ 1,565,293,725
|
| Holdings Count | Holding |
918
|
| Advisory Fees Paid, Amount |
$ 2,247,017
|
| InvestmentCompanyPortfolioTurnover |
14.00%
|
| Additional Fund Statistics [Text Block] |
Table SummaryFund's net assets | $1,565,293,725 |
|---|
Total number of portfolio holdings | 918 |
|---|
Total advisory fees paid | $2,247,017 |
|---|
Portfolio turnover rate | 14% |
|---|
|
| Holdings [Text Block] |
Top Ten Holdings and/or Issuers*Table SummarySamsung Electronics Co., Ltd. | 3.2% |
|---|
ASML Holding NV | 2.2% |
|---|
SK Hynix, Inc. | 1.9% |
|---|
HSBC Holdings PLC | 1.2% |
|---|
Roche Holding AG | 1.2% |
|---|
Novartis AG | 1.1% |
|---|
AstraZeneca PLC | 1.1% |
|---|
Shell PLC | 1.0% |
|---|
Nestle SA | 1.0% |
|---|
Siemens AG | 0.9% |
|---|
* Excluding short-term investments Table SummaryJapan | 23.1% |
|---|
United Kingdom | 10.0% |
|---|
South Korea | 9.0% |
|---|
Germany | 7.6% |
|---|
United States | 7.5% |
|---|
Australia | 7.2% |
|---|
France | 7.2% |
|---|
Netherlands | 4.2% |
|---|
Switzerland | 4.1% |
|---|
Spain | 3.2% |
|---|
Other | 16.9% |
|---|
|
| Material Fund Change [Text Block] |
|
| C000232898 |
|
| Shareholder Report [Line Items] |
|
| Fund Name |
NYLI U.S. Large Cap R&D Leaders ETF
|
| Trading Symbol |
LRND
|
| Security Exchange Name |
NASDAQ
|
| Annual or Semi-Annual Statement [Text Block] |
This annual shareholder report contains important information about NYLI U.S. Large Cap R&D Leaders ETF (the "Fund") for the period of May 1, 2025 to April 30, 2026.
|
| Additional Information [Text Block] |
You can find additional information about the Fund at dfinview.com/NYLIM. You can also request this information by contacting us at 888-474-7725.
|
| Additional Information Phone Number |
888-474-7725
|
| Additional Information Website |
dfinview.com/NYLIM
|
| Expenses [Text Block] |
What were the Fund costs for the last year? (based on a hypothetical $10,000 investment) Table SummaryFund | Costs of a $10,000 investment | Costs paid as a percentage of a $10,000 investmentFootnote Reference1 |
|---|
NYLI U.S. Large Cap R&D Leaders ETF | $16 | 0.14% |
|---|
| Footnote | Description | Footnote1 | Reflects fee waivers and/or expense reimbursements, without which expenses would have been higher. |
|
| Expenses Paid, Amount |
$ 16
|
| Expense Ratio, Percent |
0.14%
|
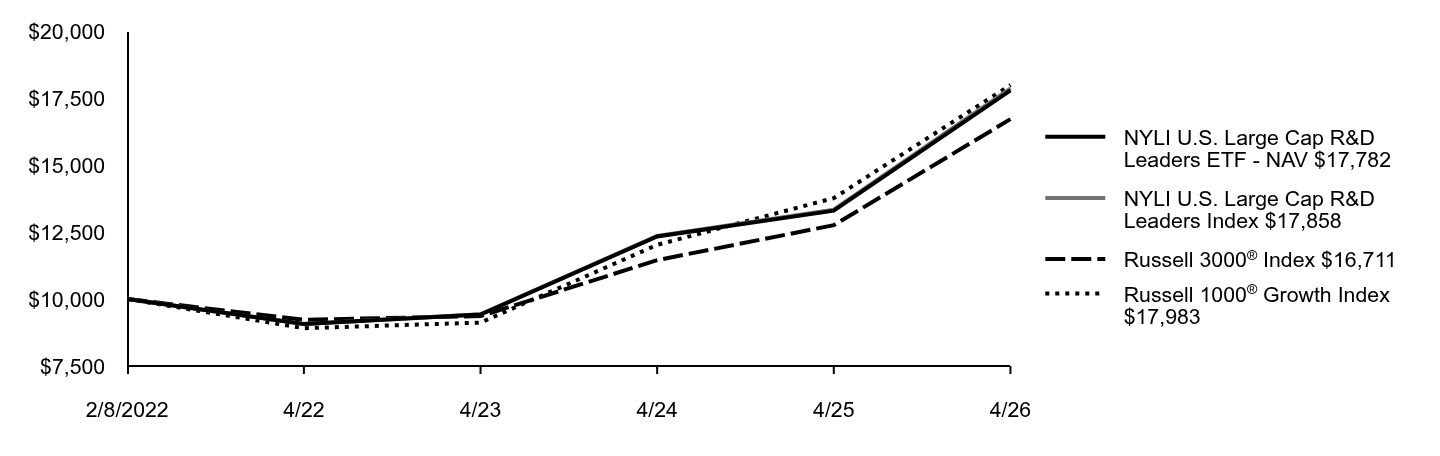
| Factors Affecting Performance [Text Block] |
What factors influenced Fund performance during the reporting period?During the 12‑month period ended April 30, 2026, the Fund's performance benefited from strength in U.S. innovation‑led equities, supported by resilient growth and continued investment in AI and digital infrastructure. Elevated interest rates contributed to volatility and a more selective environment, resulting in a highly concentrated market where a narrow group of mega‑cap innovators drove the majority of returns and other sectors lagged amid valuation and growth concerns. The following table outlines the key factors (securities, sectors, industries, market events and/or other characteristics) that materially affected the Fund’s performance during the reporting period. |
| Performance Past Does Not Indicate Future [Text] |
Keep in mind that the Fund’s past performance is not a good predictor of how the Fund will perform in the future.
|
| Line Graph [Table Text Block] |
Table Summary | NYLI U.S. Large Cap R&D Leaders ETF - NAV 17,782 | NYLI U.S. Large Cap R&D Leaders Index17,858 | Russell 3000® Index16,711 | Russell 1000® Growth Index17,983 |
|---|
2/8/2022 | 10,000 | 10,000 | 10,000 | 10,000 |
|---|
4/22 | 9,064 | 9,063 | 9,224 | 8,911 |
|---|
4/23 | 9,421 | 9,431 | 9,362 | 9,120 |
|---|
4/24 | 12,333 | 12,352 | 11,450 | 12,020 |
|---|
4/25 | 13,295 | 13,334 | 12,755 | 13,766 |
|---|
4/26 | 17,782 | 17,858 | 16,711 | 17,983 |
|---|
|
| Average Annual Return [Table Text Block] |
Table SummaryAverage Annual Total Returns for the Period Ended April 30, 2026 | Inception Date | One Year | Since Inception |
|---|
NYLI U.S. Large Cap R&D Leaders ETF - NAV | 2/8/2022 | 33.75% | 14.58% |
|---|
NYLI U.S. Large Cap R&D Leaders IndexFootnote Reference1 | | 33.93% | 14.70% |
|---|
Russell 3000® IndexFootnote Reference2 | | 31.01% | 12.91% |
|---|
Russell 1000® Growth IndexFootnote Reference3 | | 30.63% | 14.88% |
|---|
|
| Performance Inception Date |
Feb. 08, 2022
|
| No Deduction of Taxes [Text Block] |
The graph and table do not reflect the deduction of taxes that a shareholder would pay on Fund distributions or redemption of Fund shares.
|
| AssetsNet |
$ 287,105,451
|
| Holdings Count | Holding |
110
|
| Advisory Fees Paid, Amount |
$ 82,315
|
| InvestmentCompanyPortfolioTurnover |
46.00%
|
| Additional Fund Statistics [Text Block] |
Table SummaryFund's net assets | $287,105,451 |
|---|
Total number of portfolio holdings | 110 |
|---|
Total advisory fees paid | $82,315 |
|---|
Portfolio turnover rate | 46% |
|---|
|
| Holdings [Text Block] |
Top Ten Holdings and/or Issuers*Table SummaryNVIDIA Corp. | 14.8% |
|---|
Apple, Inc. | 12.7% |
|---|
Microsoft Corp. | 10.2% |
|---|
Alphabet, Inc., Class A | 10.1% |
|---|
Eli Lilly & Co. | 5.2% |
|---|
Amazon.com, Inc. | 4.6% |
|---|
Broadcom, Inc. | 4.6% |
|---|
Meta Platforms, Inc., Class A | 4.2% |
|---|
Cisco Systems, Inc. | 1.5% |
|---|
Lam Research Corp. | 1.3% |
|---|
* Excluding short-term investments Table SummaryInformation Technology | 54.2% |
|---|
Communication Services | 14.8% |
|---|
Health Care | 10.1% |
|---|
Investment Companies | 6.6% |
|---|
Industrials | 6.0% |
|---|
Consumer Discretionary | 5.5% |
|---|
Consumer Staples | 1.9% |
|---|
Materials | 0.9% |
|---|
Short-Term Investments | 0.0% |
|---|
|
| Material Fund Change [Text Block] |
|
| C000232897 |
|
| Shareholder Report [Line Items] |
|
| Fund Name |
NYLI Global Equity R&D Leaders ETF
|
| Trading Symbol |
WRND
|
| Security Exchange Name |
NASDAQ
|
| Annual or Semi-Annual Statement [Text Block] |
This annual shareholder report contains important information about NYLI Global Equity R&D Leaders ETF (the "Fund") for the period of May 1, 2025 to April 30, 2026.
|
| Additional Information [Text Block] |
You can find additional information about the Fund at dfinview.com/NYLIM. You can also request this information by contacting us at 888-474-7725.
|
| Additional Information Phone Number |
888-474-7725
|
| Additional Information Website |
dfinview.com/NYLIM
|
| Expenses [Text Block] |
What were the Fund costs for the last year? (based on a hypothetical $10,000 investment) Table SummaryFund | Costs of a $10,000 investment | Costs paid as a percentage of a $10,000 investmentFootnote Reference1 |
|---|
NYLI Global Equity R&D Leaders ETF | $22 | 0.18% |
|---|
| Footnote | Description | Footnote1 | Reflects fee waivers and/or expense reimbursements, without which expenses would have been higher. |
|
| Expenses Paid, Amount |
$ 22
|
| Expense Ratio, Percent |
0.18%
|
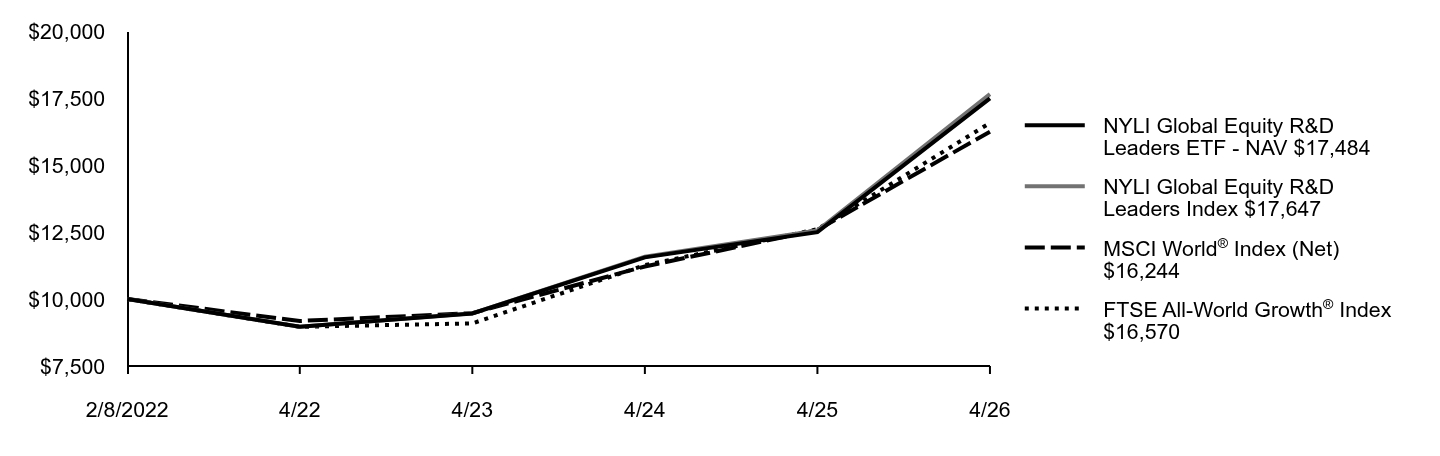
| Factors Affecting Performance [Text Block] |
What factors influenced Fund performance during the reporting period?During the 12-month reporting period ended April 30, 2026, the Fund’s performance was driven by strength in innovation-oriented equities, as moderating inflation and resilient global growth supported risk assets, while sustained capital investment in artificial intelligence and advanced technologies reinforced leadership among R&D-intensive companies. This environment favored firms with high and persistent research spending, particularly in information technology and communication services, where earnings growth remained robust despite elevated interest rates. At the same time, increased dispersion across global markets—driven by trade frictions, geopolitical tensions and uneven demand—resulted in mixed outcomes across sectors, particularly within health care and consumer-oriented industries. The following table outlines the key factors (securities, sectors, industries, market events and/or other characteristics) that materially affected the Fund’s performance during the reporting period. |
| Performance Past Does Not Indicate Future [Text] |
Keep in mind that the Fund’s past performance is not a good predictor of how the Fund will perform in the future.
|
| Line Graph [Table Text Block] |
Table Summary | NYLI Global Equity R&D Leaders ETF - NAV 17,484 | NYLI Global Equity R&D Leaders Index17,647 | MSCI World® Index (Net)16,244 | FTSE All-World Growth® Index16,570 |
|---|
2/8/2022 | 10,000 | 10,000 | 10,000 | 10,000 |
|---|
4/22 | 8,965 | 8,963 | 9,180 | 8,962 |
|---|
4/23 | 9,461 | 9,463 | 9,472 | 9,090 |
|---|
4/24 | 11,554 | 11,580 | 11,214 | 11,262 |
|---|
4/25 | 12,494 | 12,553 | 12,577 | 12,605 |
|---|
4/26 | 17,484 | 17,647 | 16,244 | 16,570 |
|---|
|
| Average Annual Return [Table Text Block] |
Table SummaryAverage Annual Total Returns for the Period Ended April 30, 2026 | Inception Date | One Year | Since Inception |
|---|
NYLI Global Equity R&D Leaders ETF - NAV | 2/8/2022 | 39.94% | 14.12% |
|---|
NYLI Global Equity R&D Leaders IndexFootnote Reference1 | | 40.58% | 14.37% |
|---|
MSCI World® Index (Net)Footnote Reference2 | | 29.16% | 12.15% |
|---|
FTSE All-World Growth® IndexFootnote Reference3 | | 31.45% | 12.68% |
|---|
|
| Performance Inception Date |
Feb. 08, 2022
|
| No Deduction of Taxes [Text Block] |
The graph and table do not reflect the deduction of taxes that a shareholder would pay on Fund distributions or redemption of Fund shares.
|
| AssetsNet |
$ 10,164,829
|
| Holdings Count | Holding |
208
|
| Advisory Fees Paid, Amount |
$ 13,739
|
| InvestmentCompanyPortfolioTurnover |
91.00%
|
| Additional Fund Statistics [Text Block] |
Table SummaryFund's net assets | $10,164,829 |
|---|
Total number of portfolio holdings | 208 |
|---|
Total advisory fees paid | $13,739 |
|---|
Portfolio turnover rate | 91% |
|---|
|
| Holdings [Text Block] |
Top Ten Holdings and/or Issuers*Table SummaryAlphabet, Inc., Class A | 7.9% |
|---|
NVIDIA Corp. | 7.5% |
|---|
Apple, Inc. | 6.2% |
|---|
Amazon.com, Inc. | 4.6% |
|---|
Taiwan Semiconductor Manufacturing Co., Ltd. | 4.5% |
|---|
Microsoft Corp. | 4.4% |
|---|
ASML Holding NV | 4.2% |
|---|
Broadcom, Inc. | 3.9% |
|---|
Meta Platforms, Inc., Class A | 3.3% |
|---|
AstraZeneca PLC | 2.6% |
|---|
* Excluding short-term investments Table SummaryUnited States | 58.7% |
|---|
Japan | 8.6% |
|---|
Taiwan | 8.2% |
|---|
Germany | 5.5% |
|---|
Netherlands | 4.8% |
|---|
United Kingdom | 3.5% |
|---|
South Korea | 2.0% |
|---|
Denmark | 1.7% |
|---|
China | 1.5% |
|---|
Brazil | 1.2% |
|---|
Other | 4.3% |
|---|
|
| Material Fund Change [Text Block] |
|