Shareholder Report
|
12 Months Ended |
|
Apr. 30, 2026
USD ($)
Holding
|
|---|
| Shareholder Report [Line Items] |
|
| Document Type |
N-CSR
|
| Amendment Flag |
false
|
| Registrant Name |
Exchange Listed Funds Trust
|
| Entity Central Index Key |
0001547950
|
| Entity Investment Company Type |
N-1A
|
| Document Period End Date |
Apr. 30, 2026
|
| Shareholder Report Annual or Semi-Annual |
Annual Shareholder Report
|
| C000218791 |
|
| Shareholder Report [Line Items] |
|
| Fund Name |
ETC Cabana Target Beta ETF
|
| Trading Symbol |
TDSB
|
| Security Exchange Name |
NASDAQ
|
| Additional Information Phone Number |
866-239-9536
|
| Additional Information Website |
https://www.cabanaetfs.com/investor-materials
|
| Expenses [Text Block] |
What were the Fund’s costs for the last year?(based on a hypothetical $10,000 investment) Table SummaryFund Name | Costs of a $10,000 investment | Costs paid as a percentage of a $10,000 investment |
|---|
ETC Cabana Target Beta ETF | $74 | 0.68% |
|---|
|
| Expenses Paid, Amount |
$ 74
|
| Expense Ratio, Percent |
0.68%
|
| Performance Past Does Not Indicate Future [Text] |
The Fund's past performance is not a good predictor of how the Fund will perform in the future.
|
| Performance Inception Date |
Sep. 16, 2020
|
| No Deduction of Taxes [Text Block] |
The graph and table do not reflect the deduction of taxes that a shareholder would pay on fund distributions or redemption of fund shares.
|
| AssetsNet |
$ 49,623,452
|
| Holdings Count | Holding |
10
|
| Advisory Fees Paid, Amount |
$ 426,500
|
| InvestmentCompanyPortfolioTurnover |
136.00%
|
| Additional Fund Statistics [Text Block] |
Table SummaryNet Assets | $49,623,452 |
|---|
Number of Portfolio Holdings | 10 |
|---|
Total Advisory Fee Paid | $426,500 |
|---|
Portfolio Turnover Rate | 136% |
|---|
|
| Holdings [Text Block] |
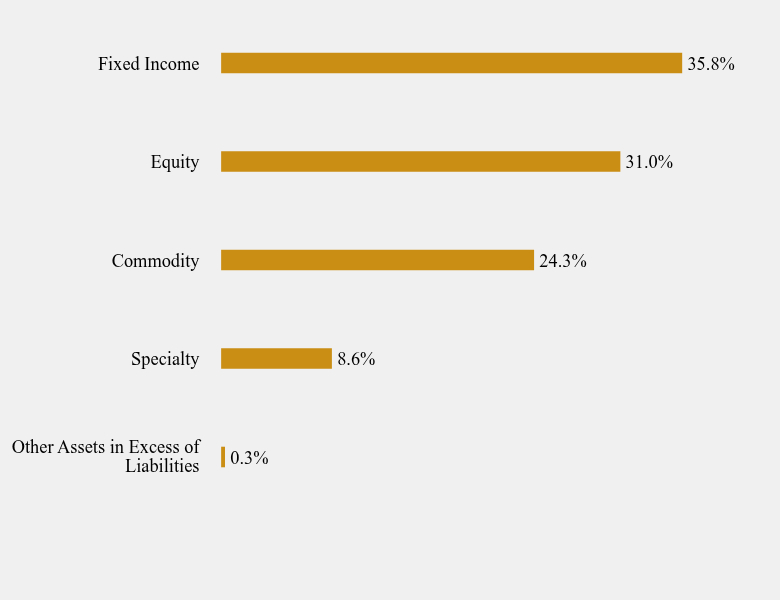
Sector Weighting (% of net assets)Table SummaryValue | Value |
|---|
Other Assets in Excess of Liabilities | 0.3% | Specialty | 8.6% | Commodity | 24.3% | Equity | 31.0% | Fixed Income | 35.8% | Top 10 Holdings (% of net assets)Table SummaryGoldman Sachs Physical Gold ETF | 12.7% |
|---|
Pimco Commodity Strategy Active ETF | 11.6% |
|---|
Invesco Nasdaq 100 ETF | 11.2% |
|---|
State Street Utilities Select Sector SPDR ETF | 10.1% |
|---|
State Street Health Care Select Sector SPDR ETF | 9.7% |
|---|
Vanguard Intermediate-Term Bond ETF | 9.0% |
|---|
iShares 7-10 Year Treasury Bond ETF | 9.0% |
|---|
Vanguard Long-Term Bond ETF | 8.9% |
|---|
iShares 3-7 Year Treasury Bond ETF | 8.9% |
|---|
Invesco DB US Dollar Index Bullish Fund | 8.6% |
|---|
|
| Material Fund Change [Text Block] |
No material changes occurred during the year ended April 30, 2026. |
| C000218792 |
|
| Shareholder Report [Line Items] |
|
| Fund Name |
ETC Cabana Target Drawdown 10 ETF
|
| Trading Symbol |
TDSC
|
| Security Exchange Name |
NASDAQ
|
| Additional Information Phone Number |
866-239-9536
|
| Additional Information Website |
https://www.cabanaetfs.com/investor-materials
|
| Expenses [Text Block] |
What were the Fund’s costs for the last year?(based on a hypothetical $10,000 investment) Table SummaryFund Name | Costs of a $10,000 investment | Costs paid as a percentage of a $10,000 investment |
|---|
ETC Cabana Target Drawdown 10 ETF | $75 | 0.69% |
|---|
|
| Expenses Paid, Amount |
$ 75
|
| Expense Ratio, Percent |
0.69%
|
| Performance Past Does Not Indicate Future [Text] |
The Fund's past performance is not a good predictor of how the Fund will perform in the future.
|
| Performance Inception Date |
Sep. 16, 2020
|
| No Deduction of Taxes [Text Block] |
The graph and table do not reflect the deduction of taxes that a shareholder would pay on fund distributions or redemption of fund shares.
|
| AssetsNet |
$ 102,420,896
|
| Holdings Count | Holding |
10
|
| Advisory Fees Paid, Amount |
$ 882,278
|
| InvestmentCompanyPortfolioTurnover |
185.00%
|
| Additional Fund Statistics [Text Block] |
Table SummaryNet Assets | $102,420,896 |
|---|
Number of Portfolio Holdings | 10 |
|---|
Total Advisory Fee Paid | $882,278 |
|---|
Portfolio Turnover Rate | 185% |
|---|
|
| Holdings [Text Block] |
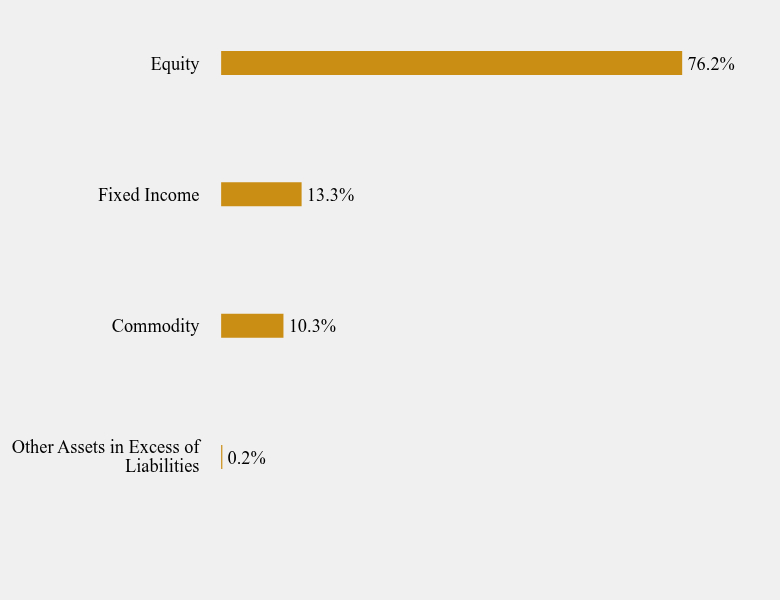
Sector Weighting (% of net assets)Table SummaryValue | Value |
|---|
Other Assets in Excess of Liabilities | 0.2% | Commodity | 10.3% | Fixed Income | 13.3% | Equity | 76.2% | Top 10 Holdings (% of net assets)Table SummaryInvesco Nasdaq 100 ETF | 15.5% |
|---|
iShares 7-10 Year Treasury Bond ETF | 13.3% |
|---|
State Street Health Care Select Sector SPDR ETF | 13.1% |
|---|
State Street Energy Select Sector SPDR ETF | 12.2% |
|---|
State Street Technology Select Sector SPDR ETF | 10.6% |
|---|
Goldman Sachs Physical Gold ETF | 10.3% |
|---|
State Street Utilities Select Sector SPDR ETF | 9.6% |
|---|
Vanguard High Dividend Yield ETF | 5.1% |
|---|
iShares Select Dividend ETF | 5.1% |
|---|
Vanguard Mega Cap ETF | 5.0% |
|---|
|
| Material Fund Change [Text Block] |
No material changes occurred during the year ended April 30, 2026. |
| C000227938 |
|
| Shareholder Report [Line Items] |
|
| Fund Name |
ETC Cabana Target Leading Sector Moderate ETF
|
| Trading Symbol |
CLSM
|
| Security Exchange Name |
NASDAQ
|
| Additional Information Phone Number |
866-239-9536
|
| Additional Information Website |
https://www.cabanaetfs.com/investor-materials
|
| Expenses [Text Block] |
What were the Fund’s costs for the last year?(based on a hypothetical $10,000 investment) Table SummaryFund Name | Costs of a $10,000 investment | Costs paid as a percentage of a $10,000 investment |
|---|
ETC Cabana Target Leading Sector Moderate ETF | $79 | 0.69% |
|---|
|
| Expenses Paid, Amount |
$ 79
|
| Expense Ratio, Percent |
0.69%
|
| Performance Past Does Not Indicate Future [Text] |
The Fund's past performance is not a good predictor of how the Fund will perform in the future.
|
| Performance Inception Date |
Jul. 12, 2021
|
| No Deduction of Taxes [Text Block] |
The graph and table do not reflect the deduction of taxes that a shareholder would pay on fund distributions or redemption of fund shares.
|
| AssetsNet |
$ 92,899,006
|
| Holdings Count | Holding |
4
|
| Advisory Fees Paid, Amount |
$ 748,885
|
| InvestmentCompanyPortfolioTurnover |
417.00%
|
| Additional Fund Statistics [Text Block] |
Table SummaryNet Assets | $92,899,006 |
|---|
Number of Portfolio Holdings | 4 |
|---|
Total Advisory Fee Paid | $748,885 |
|---|
Portfolio Turnover Rate | 417% |
|---|
|
| Holdings [Text Block] |
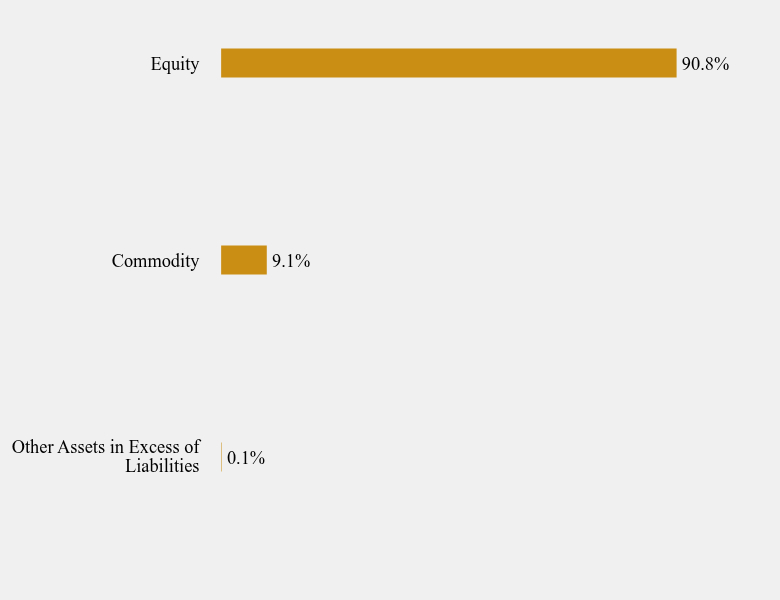
Sector Weighting (% of net assets)Table SummaryValue | Value |
|---|
Other Assets in Excess of Liabilities | 0.1% | Commodity | 9.1% | Equity | 90.8% | Top 10 Holdings (% of net assets)Table SummaryState Street Technology Select Sector SPDR ETF | 30.8% |
|---|
Invesco Nasdaq 100 ETF | 30.4% |
|---|
State Street Consumer Staples Select Sector SPDR ETF | 29.6% |
|---|
Goldman Sachs Physical Gold ETF | 9.1% |
|---|
|
| Material Fund Change [Text Block] |
No material changes occurred during the year ended April 30, 2026. |