Shareholder Report
Apr. 30, 2026
USD ($)
Holding
This report describes changes to the Fund that occurred during the reporting period.
What were the Fund costs for the last year ?
(based on a hypothetical $10,000 investment)
| Fund name | Costs of a $10,000 investment |
Costs paid as a percentage of a $10,000 investment |
| $66 | 0.60% |
How did the Fund perform last year ?
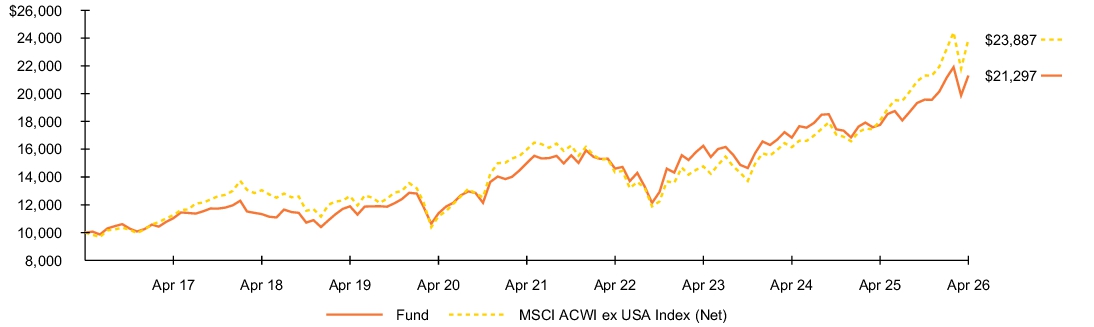
- For the reporting period ended April 30, 2026, the Fund returned 19.96%.
- For the same period, the Fund’s benchmark, the MSCI ACWI ex USA Index (Net) returned 32.20%.
What contributed to performance?
At the sector level, information technology, financials, and materials were the leading contributors to the Fund’s absolute return. Among individual holdings, Taiwan Semiconductor Manufacturing Co., Ltd. made the largest contribution. The company reported strong revenue growth, supported by robust demand for High Performance Computing, AI, and smartphone chips. The Korean semiconductor company SK Hynix, Inc. was also a top contributor thanks to its leading position in memory, a critical component of AI infrastructure. Memory prices rose sharply due to the combination of supply shortages and accelerating demand, contributing to the company’s strong earnings results. The European semiconductor manufacturer ASM International NV, which also benefited from a favorable pricing environment driven by supportive supply-and-demand trends, was another contributor of note.
What detracted from performance?
Healthcare, consumer discretionary, and consumer staples were the largest sector-level detractors from absolute performance. The German enterprise software company SAP SE, which came under pressure from concerns that its business would be disrupted by AI, was the primary detractor among the Fund’s individual holdings. India-based HDFC Bank detracted, as well. Its shares were pressured by broader weakness in India’s stock market, together with the resignation of the bank’s chairman. Sony Corp., which slid on concerns about rising memory costs and potential headwinds from AI, further detracted from results.
The views expressed reflect the opinions of BlackRock as of the date of this report and are subject to change based on changes in market, economic or other conditions. These views are not intended to be a forecast of future events and are no guarantee of future results.
Fund performance
Cumulative performance: May 1, 2016 through April 30, 2026
Initial investment of $10,000
See “Average annual total returns” for additional information on fund performance.
| Average annual total returns | ||||||
| 1 Year | 5 Years | 10 Years | ||||
| 19.96 | % | 7.25 | % | 7.85 | % | |
| 32.20 | 8.38 | 9.10 |
| Key Fund statistics | |
| $428,302,637 | |
| 49 | |
| $3,372,961 | |
| 67% |
What did the Fund invest in?
(as of April 30, 2026)
| Geographic allocation | ||
| Country/Geographic Region | Percent of Net Assets |
|
| 13.1 | % | |
| 10.4 | ||
| 9.8 | ||
| 9.2 | ||
| 6.9 | ||
| 6.8 | ||
| 6.3 | ||
| 6.1 | ||
| 5.8 | ||
| 5.7 | ||
| 20.0 | ||
| (0.1 | ) | |
| Ten largest holdings | ||
| Security(a) | Percent of Net Assets |
|
| 7.4 | % | |
| 3.4 | ||
| 3.2 | ||
| 3.1 | ||
| 2.9 | ||
| 2.8 | ||
| 2.8 | ||
| 2.8 | ||
| 2.8 | ||
| 2.7 | ||
| Excludes short-term securities. |
| Ten largest countries/geographic regions are presented. Additional countries/geographic regions are found in Other. |
| Ten largest holdings | ||
| Security(a) | Percent of Net Assets |
|
| 7.4 | % | |
| 3.4 | ||
| 3.2 | ||
| 3.1 | ||
| 2.9 | ||
| 2.8 | ||
| 2.8 | ||
| 2.8 | ||
| 2.8 | ||
| 2.7 | ||
Material Fund changes
This is a summary of certain changes and planned changes to the Fund since April 30, 2025. For more complete information, you may review the Fund’s next prospectus, which we expect to be available approximately 120 days after April 30, 2026 at blackrock.com/fundreports or upon request by contacting us at (800) 474-2737.
Effective November 28 2025, BlackRock Fund Advisors ("BFA") has contractually agreed to cap the Fund’s total annual fund operating expenses after fee waiver to 0.59% as a percentage of the Fund’s average daily net assets through June 30, 2027.
Effective June 1, 2026, BFA has voluntarily agreed to cap the Fund's total annual fund operating expenses after fee waiver to 0.44% as a percentage of the Fund's average daily net assets. BFA may also from time to time voluntarily waive and/or reimburse other fees or expenses in order to limit total annual fund operating expenses (excluding acquired fund fees and expenses, if any). Any such voluntary waiver or reimbursement may be eliminated by BFA at any time.
This is a summary of certain changes and planned changes to the Fund since April 30, 2025. For more complete information, you may review the Fund’s next prospectus, which we expect to be available approximately 120 days after April 30, 2026 at blackrock.com/fundreports or upon request by contacting us at (800) 474-2737.
This report describes changes to the Fund that occurred during the reporting period.
What were the Fund costs for the last year ?
(based on a hypothetical $10,000 investment)
| Fund name | Costs of a $10,000 investment |
Costs paid as a percentage of a $10,000 investment |
| $41 | 0.38% |
How did the Fund perform last year ?
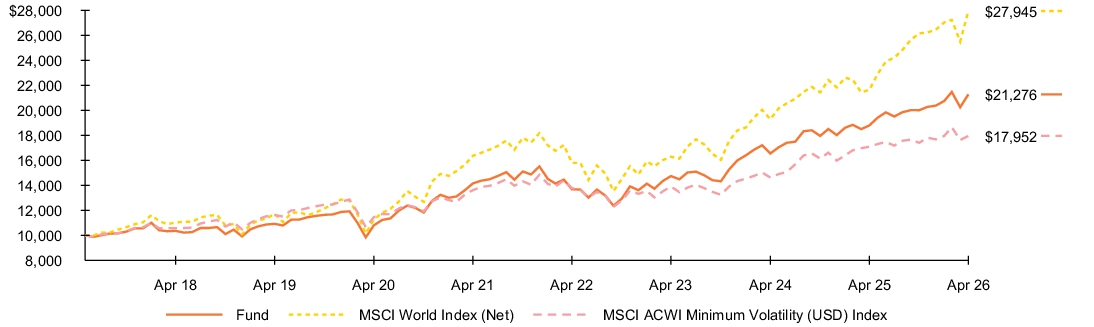
- For the reporting period ended April 30, 2026, the Fund returned 13.23%.
- For the same period, the Fund’s benchmark, the MSCI World Index (Net) returned 29.16% and the MSCI ACWI Minimum Volatility (USD) Index returned 5.03%.
What contributed to performance?
Holdings in the industrials, information technology, and communication services sectors made the largest contributions to absolute performance.
What detracted from performance?
Currency management strategies were the largest detractor.
The views expressed reflect the opinions of BlackRock as of the date of this report and are subject to change based on changes in market, economic or other conditions. These views are not intended to be a forecast of future events and are no guarantee of future results.
Fund performance
Cumulative performance: June 1, 2017 through April 30, 2026
Initial investment of $10,000
See “Average annual total returns” for additional information on fund performance.
| Average annual total returns | ||||||
| 1 Year | 5 Years | Since Fund Inception |
||||
| 13.23 | % | 8.49 | % | 8.84 | % | |
| 29.16 | 11.29 | 12.22 | ||||
| 5.03 | 5.68 | 6.78 |
| Key Fund statistics | |
| $1,674,079,511 | |
| 729 | |
| $4,817,065 | |
| 193% |
What did the Fund invest in?
(as of April 30, 2026)
| Geographic allocation | ||
| Country/Geographic Region | Percent of Net Assets |
|
| 73.3 | % | |
| 10.2 | ||
| 7.1 | ||
| 3.4 | ||
| 1.2 | ||
| 1.1 | ||
| 0.8 | ||
| 0.8 | ||
| 0.7 | ||
| 0.7 | ||
| 3.2 | ||
| (2.5 | ) | |
| Ten largest holdings | ||
| Security(a)(b) | Percent of Net Assets |
|
| 2.9 | % | |
| 1.6 | ||
| 1.3 | ||
| 1.2 | ||
| 1.2 | ||
| 1.2 | ||
| 1.2 | ||
| 1.1 | ||
| 1.0 | ||
| 1.0 | ||
| Excludes underlying investments in equity swaps. |
| Excludes short-term securities. |
| Ten largest countries/geographic regions are presented. Additional countries/geographic regions are found in Other. |
| Ten largest holdings | ||
| Security(a)(b) | Percent of Net Assets |
|
| 2.9 | % | |
| 1.6 | ||
| 1.3 | ||
| 1.2 | ||
| 1.2 | ||
| 1.2 | ||
| 1.2 | ||
| 1.1 | ||
| 1.0 | ||
| 1.0 | ||
Material Fund changes
This is a summary of certain changes to the Fund Since April 30, 2025. For more complete information, you may review the Fund’s next prospectus, which we expect to be available approximately 120 days after April 30, 2026 at blackrock.com/fundreports or upon request by contacting us at (800) 474-2737.
On September 12, 2025, BlackRock GA Disciplined Volatility Equity Fund was reorganized into iShares Disciplined Volatility Equity Active ETF.
The net expense ratio decreased from the prior fiscal year end primarily due to a change in the Fund’s expense structure in connection with the reorganization.
This is a summary of certain changes to the Fund Since April 30, 2025. For more complete information, you may review the Fund’s next prospectus, which we expect to be available approximately 120 days after April 30, 2026 at blackrock.com/fundreports or upon request by contacting us at (800) 474-2737.
This report describes changes to the Fund that occurred during the reporting period.
What were the Fund costs for the last year ?
(based on a hypothetical $10,000 investment)
| Fund name | Costs of a $10,000 investment |
Costs paid as a percentage of a $10,000 investment |
| $43 | 0.38% |
How did the Fund perform last year ?
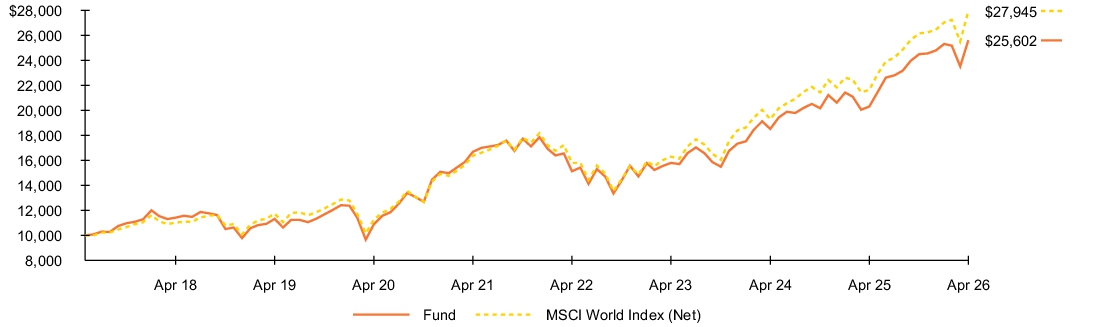
- For the reporting period ended April 30, 2026, the Fund returned 26.07%.
- For the same period, the Fund’s benchmark, the MSCI World Index (Net) returned 29.16%.
What contributed to performance?
Holdings in the information technology, communication services, financials, and energy sectors made the largest contributions to absolute performance. The Fund's cash position had no material impact on performance.
What detracted from performance?
Holdings in the healthcare sector detracted.
The views expressed reflect the opinions of BlackRock as of the date of this report and are subject to change based on changes in market, economic or other conditions. These views are not intended to be a forecast of future events and are no guarantee of future results.
Fund performance
Cumulative performance: June 1, 2017 through April 30, 2026
Initial investment of $10,000
See “Average annual total returns” for additional information on fund performance.
| Average annual total returns | ||||||
| 1 Year | 5 Years | Since Fund Inception |
||||
| 26.07 | % | 8.95 | % | 11.12 | % | |
| 29.16 | 11.29 | 12.22 |
| Key Fund statistics | |
| $2,758,533,727 | |
| 485 | |
| $7,984,536 | |
| 84% |
What did the Fund invest in?
(as of April 30, 2026)
| Geographic allocation | ||
| Country/Geographic Region | Percent of Net Assets |
|
| 79.2 | % | |
| 4.6 | ||
| 4.5 | ||
| 2.4 | ||
| 2.3 | ||
| 2.2 | ||
| 1.7 | ||
| 1.3 | ||
| 0.8 | ||
| 0.6 | ||
| 0.7 | ||
| (0.3 | ) | |
| Ten largest holdings | ||
| Security(a) | Percent of Net Assets |
|
| 5.7 | % | |
| 5.5 | ||
| 4.5 | ||
| 3.1 | ||
| 2.6 | ||
| 2.3 | ||
| 2.1 | ||
| 1.7 | ||
| 1.7 | ||
| 1.6 | ||
| Excludes short-term securities, short investments and options, if any. |
| Ten largest countries/geographic regions are presented. Additional countries/geographic regions are found in Other. |
| Ten largest holdings | ||
| Security(a) | Percent of Net Assets |
|
| 5.7 | % | |
| 5.5 | ||
| 4.5 | ||
| 3.1 | ||
| 2.6 | ||
| 2.3 | ||
| 2.1 | ||
| 1.7 | ||
| 1.7 | ||
| 1.6 | ||
Material Fund changes
This is a summary of certain changes to the Fund Since April 30, 2025. For more complete information, you may review the Fund’s next prospectus, which we expect to be available approximately 120 days after April 30, 2026 at blackrock.com/fundreports or upon request by contacting us at (800) 474-2737.
On September 12, 2025, BlackRock GA Dynamic Equity Fund was reorganized into iShares Dynamic Equity Active ETF.
The net expense ratio decreased from the prior fiscal year end primarily due to a change in the Fund’s expense structure in connection with the reorganization.
On September 12, 2025, BlackRock GA Dynamic Equity Fund was reorganized into iShares Dynamic Equity Active ETF.
The net expense ratio decreased from the prior fiscal year end primarily due to a change in the Fund’s expense structure in connection with the reorganization.
This is a summary of certain changes to the Fund Since April 30, 2025. For more complete information, you may review the Fund’s next prospectus, which we expect to be available approximately 120 days after April 30, 2026 at blackrock.com/fundreports or upon request by contacting us at (800) 474-2737.