Shareholder Report
|
12 Months Ended |
|
Apr. 30, 2026
USD ($)
Holding
|
|---|
| Shareholder Report [Line Items] |
|
| Document Type |
N-CSR
|
| Amendment Flag |
false
|
| Registrant Name |
Columbia Funds Series Trust I
|
| Entity Central Index Key |
0000773757
|
| Entity Investment Company Type |
N-1A
|
| Document Period End Date |
Apr. 30, 2026
|
| Shareholder Report Annual or Semi-Annual |
Annual Shareholder Report
|
| C000032979 |
|
| Shareholder Report [Line Items] |
|
| Fund Name |
Columbia Select Corporate Income Fund
|
| Class Name |
Class A
|
| Trading Symbol |
LIIAX
|
| Annual or Semi-Annual Statement [Text Block] |
This annual shareholder report contains important information about Columbia Select Corporate Income Fund (the Fund) for the period of May 1, 2025 to April 30, 2026.
|
| Additional Information [Text Block] |
You can find additional information about the Fund at columbiathreadneedleus.com/resources/literature. You can also request more information by contacting us at 1-800-345-6611.
|
| Material Fund Change Notice [Text Block] |
This report describes changes to the Fund that occurred during the reporting period.
|
| Additional Information Phone Number |
1-800-345-6611
|
| Additional Information Website |
columbiathreadneedleus.com/resources/literature
|
| Expenses [Text Block] |
What were the Fund costs for the reporting period? (Based on a hypothetical $10,000 investment)
Table Summary
Class |
Cost of a $10,000 investment |
Cost paid as a percentage of a $10,000 investment |
Class A |
$86 |
0.84% | |
| Expenses Paid, Amount |
$ 86
|
| Expense Ratio, Percent |
0.84%
|
| Factors Affecting Performance [Text Block] |
Management's Discussion of Fund Performance The performance of Class A shares for the period presented is shown in the Average Annual Total Returns table. Top Performance ContributorsSecurity selection | Security selection contributed positively to the Fund’s performance. The most notable contributor to alpha was exposure to a beverage company. Industry allocation | Industry allocation effects were positive overall for the period. Most notable were overweight exposures to independent energy and aerospace and defense, as well as underweight allocations to media and entertainment and technology firms. Top Performance DetractorsIndustry allocation | Despite positive returns relative to the benchmark, underweight exposures to automotive and finance companies, as well as an overweight to cable and satellite, detracted from the Fund’s positive performance. Security selection | Despite positive security selection contribution, overweights to a technology company and a packaged food retailer detracted from the Fund’s performance. Credit allocation | The portfolio, on average, was underweight spread duration relative to the benchmark, which marginally detracted from the Fund’s performance over the period. |
| Performance Past Does Not Indicate Future [Text] |
The Fund's past performance is not a good predictor of the Fund's future performance.
|
| Line Graph [Table Text Block] |
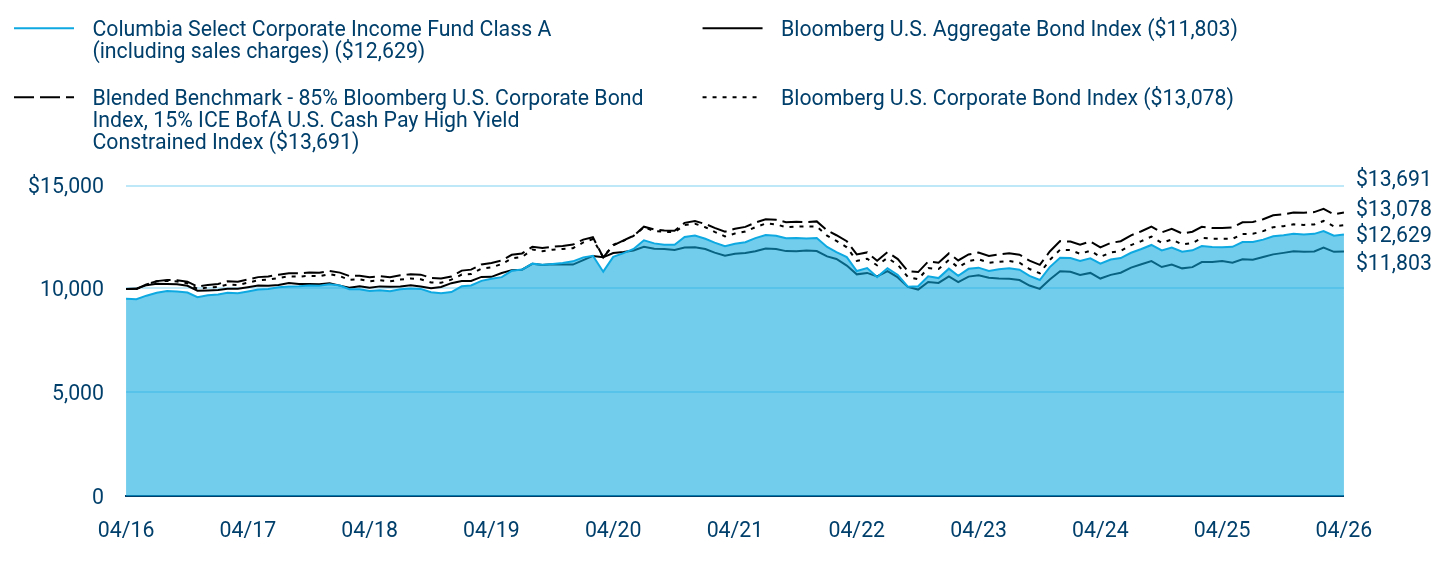
Table Summary
|
Columbia Select Corporate Income Fund Class A (including sales charges) ($12,629) |
Bloomberg U.S. Aggregate Bond Index ($11,803) |
Blended Benchmark - 85% Bloomberg U.S. Corporate Bond Index, 15% ICE BofA U.S. Cash Pay High Yield Constrained Index ($13,691) |
Bloomberg U.S. Corporate Bond Index ($13,078) |
04/16 |
$9,524 |
$10,000 |
$10,000 |
$10,000 |
05/16 |
$9,498 |
$10,003 |
$10,003 |
$9,992 |
06/16 |
$9,673 |
$10,182 |
$10,211 |
$10,217 |
07/16 |
$9,810 |
$10,247 |
$10,376 |
$10,366 |
08/16 |
$9,898 |
$10,235 |
$10,428 |
$10,387 |
09/16 |
$9,879 |
$10,229 |
$10,417 |
$10,361 |
10/16 |
$9,822 |
$10,151 |
$10,349 |
$10,277 |
11/16 |
$9,600 |
$9,911 |
$10,107 |
$10,001 |
12/16 |
$9,690 |
$9,925 |
$10,194 |
$10,068 |
01/17 |
$9,731 |
$9,944 |
$10,241 |
$10,099 |
02/17 |
$9,818 |
$10,011 |
$10,365 |
$10,215 |
03/17 |
$9,789 |
$10,006 |
$10,341 |
$10,191 |
04/17 |
$9,878 |
$10,083 |
$10,453 |
$10,300 |
05/17 |
$9,968 |
$10,160 |
$10,569 |
$10,418 |
06/17 |
$9,998 |
$10,150 |
$10,598 |
$10,450 |
07/17 |
$10,078 |
$10,194 |
$10,683 |
$10,527 |
08/17 |
$10,119 |
$10,285 |
$10,753 |
$10,608 |
09/17 |
$10,129 |
$10,236 |
$10,752 |
$10,590 |
10/17 |
$10,170 |
$10,242 |
$10,795 |
$10,633 |
11/17 |
$10,150 |
$10,229 |
$10,777 |
$10,617 |
12/17 |
$10,230 |
$10,276 |
$10,865 |
$10,714 |
01/18 |
$10,162 |
$10,158 |
$10,787 |
$10,612 |
02/18 |
$9,983 |
$10,061 |
$10,623 |
$10,439 |
03/18 |
$9,986 |
$10,126 |
$10,636 |
$10,466 |
04/18 |
$9,899 |
$10,051 |
$10,563 |
$10,369 |
05/18 |
$9,934 |
$10,122 |
$10,610 |
$10,424 |
06/18 |
$9,887 |
$10,110 |
$10,564 |
$10,364 |
07/18 |
$9,982 |
$10,112 |
$10,656 |
$10,450 |
08/18 |
$10,017 |
$10,177 |
$10,712 |
$10,502 |
09/18 |
$10,000 |
$10,112 |
$10,689 |
$10,464 |
10/18 |
$9,843 |
$10,032 |
$10,530 |
$10,311 |
11/18 |
$9,787 |
$10,092 |
$10,501 |
$10,294 |
12/18 |
$9,846 |
$10,277 |
$10,598 |
$10,446 |
01/19 |
$10,128 |
$10,386 |
$10,883 |
$10,691 |
02/19 |
$10,163 |
$10,380 |
$10,930 |
$10,714 |
03/19 |
$10,387 |
$10,580 |
$11,179 |
$10,983 |
04/19 |
$10,486 |
$10,582 |
$11,254 |
$11,042 |
05/19 |
$10,567 |
$10,770 |
$11,370 |
$11,201 |
06/19 |
$10,874 |
$10,906 |
$11,648 |
$11,475 |
07/19 |
$10,933 |
$10,930 |
$11,712 |
$11,539 |
08/19 |
$11,220 |
$11,213 |
$12,033 |
$11,902 |
09/19 |
$11,162 |
$11,153 |
$11,972 |
$11,824 |
10/19 |
$11,208 |
$11,187 |
$12,038 |
$11,896 |
11/19 |
$11,253 |
$11,181 |
$12,068 |
$11,926 |
12/19 |
$11,331 |
$11,173 |
$12,139 |
$11,964 |
01/20 |
$11,524 |
$11,388 |
$12,381 |
$12,245 |
02/20 |
$11,599 |
$11,593 |
$12,493 |
$12,408 |
03/20 |
$10,832 |
$11,525 |
$11,521 |
$11,529 |
04/20 |
$11,545 |
$11,730 |
$12,100 |
$12,134 |
05/20 |
$11,727 |
$11,784 |
$12,343 |
$12,324 |
06/20 |
$11,931 |
$11,859 |
$12,566 |
$12,565 |
07/20 |
$12,348 |
$12,036 |
$13,003 |
$12,974 |
08/20 |
$12,199 |
$11,939 |
$12,870 |
$12,795 |
09/20 |
$12,136 |
$11,932 |
$12,819 |
$12,758 |
10/20 |
$12,127 |
$11,879 |
$12,808 |
$12,735 |
11/20 |
$12,503 |
$11,995 |
$13,188 |
$13,090 |
12/20 |
$12,580 |
$12,012 |
$13,274 |
$13,147 |
01/21 |
$12,421 |
$11,926 |
$13,136 |
$12,978 |
02/21 |
$12,237 |
$11,753 |
$12,950 |
$12,755 |
03/21 |
$12,065 |
$11,607 |
$12,764 |
$12,536 |
04/21 |
$12,176 |
$11,698 |
$12,905 |
$12,675 |
05/21 |
$12,253 |
$11,737 |
$12,995 |
$12,772 |
06/21 |
$12,453 |
$11,819 |
$13,202 |
$12,980 |
07/21 |
$12,597 |
$11,951 |
$13,362 |
$13,158 |
08/21 |
$12,571 |
$11,929 |
$13,339 |
$13,118 |
09/21 |
$12,443 |
$11,825 |
$13,220 |
$12,980 |
10/21 |
$12,463 |
$11,822 |
$13,245 |
$13,012 |
11/21 |
$12,436 |
$11,857 |
$13,231 |
$13,020 |
12/21 |
$12,461 |
$11,827 |
$13,260 |
$13,010 |
01/22 |
$12,027 |
$11,572 |
$12,826 |
$12,572 |
02/22 |
$11,779 |
$11,443 |
$12,591 |
$12,321 |
03/22 |
$11,533 |
$11,125 |
$12,303 |
$12,010 |
04/22 |
$10,863 |
$10,703 |
$11,664 |
$11,353 |
05/22 |
$11,006 |
$10,772 |
$11,762 |
$11,459 |
06/22 |
$10,571 |
$10,603 |
$11,362 |
$11,138 |
07/22 |
$11,001 |
$10,862 |
$11,778 |
$11,499 |
08/22 |
$10,673 |
$10,555 |
$11,441 |
$11,162 |
09/22 |
$10,106 |
$10,099 |
$10,862 |
$10,575 |
10/22 |
$10,125 |
$9,968 |
$10,813 |
$10,466 |
11/22 |
$10,611 |
$10,335 |
$11,320 |
$11,008 |
12/22 |
$10,523 |
$10,288 |
$11,265 |
$10,959 |
01/23 |
$10,977 |
$10,604 |
$11,714 |
$11,398 |
02/23 |
$10,632 |
$10,330 |
$11,375 |
$11,036 |
03/23 |
$10,969 |
$10,593 |
$11,663 |
$11,343 |
04/23 |
$11,026 |
$10,657 |
$11,756 |
$11,430 |
05/23 |
$10,867 |
$10,541 |
$11,594 |
$11,264 |
06/23 |
$10,950 |
$10,503 |
$11,663 |
$11,311 |
07/23 |
$10,999 |
$10,496 |
$11,722 |
$11,350 |
08/23 |
$10,924 |
$10,429 |
$11,650 |
$11,262 |
09/23 |
$10,627 |
$10,164 |
$11,365 |
$10,961 |
10/23 |
$10,430 |
$10,003 |
$11,163 |
$10,756 |
11/23 |
$11,052 |
$10,456 |
$11,807 |
$11,399 |
12/23 |
$11,502 |
$10,857 |
$12,307 |
$11,893 |
01/24 |
$11,491 |
$10,827 |
$12,289 |
$11,873 |
02/24 |
$11,352 |
$10,674 |
$12,137 |
$11,694 |
03/24 |
$11,480 |
$10,773 |
$12,292 |
$11,845 |
04/24 |
$11,216 |
$10,500 |
$12,008 |
$11,544 |
05/24 |
$11,422 |
$10,678 |
$12,219 |
$11,760 |
06/24 |
$11,487 |
$10,780 |
$12,302 |
$11,835 |
07/24 |
$11,745 |
$11,031 |
$12,587 |
$12,117 |
08/24 |
$11,928 |
$11,190 |
$12,786 |
$12,308 |
09/24 |
$12,122 |
$11,340 |
$13,010 |
$12,526 |
10/24 |
$11,855 |
$11,058 |
$12,730 |
$12,222 |
11/24 |
$11,999 |
$11,175 |
$12,897 |
$12,385 |
12/24 |
$11,794 |
$10,992 |
$12,676 |
$12,146 |
01/25 |
$11,863 |
$11,051 |
$12,762 |
$12,213 |
02/25 |
$12,072 |
$11,294 |
$12,996 |
$12,462 |
03/25 |
$12,024 |
$11,298 |
$12,943 |
$12,426 |
04/25 |
$12,015 |
$11,343 |
$12,940 |
$12,422 |
05/25 |
$12,033 |
$11,261 |
$12,971 |
$12,420 |
06/25 |
$12,262 |
$11,435 |
$13,213 |
$12,653 |
07/25 |
$12,268 |
$11,404 |
$13,228 |
$12,661 |
08/25 |
$12,380 |
$11,541 |
$13,367 |
$12,789 |
09/25 |
$12,545 |
$11,667 |
$13,553 |
$12,981 |
10/25 |
$12,591 |
$11,740 |
$13,601 |
$13,031 |
11/25 |
$12,662 |
$11,813 |
$13,687 |
$13,116 |
12/25 |
$12,627 |
$11,795 |
$13,677 |
$13,090 |
01/26 |
$12,659 |
$11,808 |
$13,708 |
$13,113 |
02/26 |
$12,797 |
$12,001 |
$13,862 |
$13,282 |
03/26 |
$12,569 |
$11,789 |
$13,604 |
$13,020 |
04/26 |
$12,629 |
$11,803 |
$13,691 |
$13,078 |
|
| Average Annual Return [Table Text Block] |
Table Summary
Average Annual Total Returns (%) |
1 year |
5 years |
10 years |
Class A (excluding sales charges) |
5.11 |
0.73 |
2.86 |
Class A (including sales charges) |
0.15 |
(0.25) |
2.36 |
Bloomberg U.S. Aggregate Bond Index |
4.06 |
0.18 |
1.67 |
Blended Benchmark - 85% Bloomberg U.S. Corporate Bond Index, 15% ICE BofA U.S. Cash Pay High Yield Constrained Index |
5.80 |
1.19 |
3.19 |
Bloomberg U.S. Corporate Bond Index |
5.29 |
0.63 |
2.72 | |
| No Deduction of Taxes [Text Block] |
Performance does not reflect the deduction of taxes that a shareholder may pay on fund distributions or on the redemptions of fund shares.
|
| Updated Performance Information Location [Text Block] |
columbiathreadneedleus.com/investment-products/mutual-funds
|
| AssetsNet |
$ 1,906,268,582
|
| Holdings Count | Holding |
739
|
| Advisory Fees Paid, Amount |
$ 9,091,622
|
| InvestmentCompanyPortfolioTurnover |
105.00%
|
| Additional Fund Statistics [Text Block] |
Table Summary
Fund net assets |
$1,906,268,582 |
Total number of portfolio holdings |
739 |
Management services fees (represents 0.49% of Fund average net assets) |
$9,091,622 |
Portfolio turnover for the reporting period |
105% | |
| Holdings [Text Block] |
Table Summary
Corporate Bonds & Notes |
88.8% |
Money Market Funds |
6.5% |
U.S. Treasury Obligations |
3.7% |
Other |
0.3% | |
| Largest Holdings [Text Block] |
Table Summary
JPMorgan Chase & Co. 4.622% 04/23/2032 |
2.1% |
Principal Life Global Funding II 4.950% 11/27/2029 |
1.9% |
U.S. Treasury 4.875% 08/15/2045 |
1.8% |
Bacardi Ltd./Bacardi-Martini BV 5.400% 06/15/2033 |
1.6% |
Bank of America Corp. 1.922% 10/24/2031 |
1.2% |
ERAC USA Finance LLC 4.600% 05/01/2028 |
1.2% |
BAE Systems PLC 1.900% 02/15/2031 |
1.1% |
Merck & Co., Inc. 4.750% 12/04/2035 |
1.1% |
Morgan Stanley 5.900% 03/13/2047 |
1.1% |
AT&T, Inc. 3.800% 12/01/2057 |
1.0% | |
| Material Fund Change [Text Block] |
This is a summary of the changes to the Fund. For more complete information, you may review the Fund’s prospectus, which is available at columbiathreadneedleus.com/resources/literature or upon request at 1-800-345-6611. On September 1, 2025, the Fund's name was changed to Columbia Select Corporate Income Fund from Columbia Corporate Income Fund. |
| Material Fund Change Name [Text Block] |
On September 1, 2025, the Fund's name was changed to Columbia Select Corporate Income Fund from Columbia Corporate Income Fund.
|
| Summary of Change Legend [Text Block] |
This is a summary of the changes to the Fund. For more complete information, you may review the Fund’s prospectus, which is available at columbiathreadneedleus.com/resources/literature or upon request at 1-800-345-6611.
|
| Updated Prospectus Phone Number |
1-800-345-6611
|
| Updated Prospectus Web Address |
columbiathreadneedleus.com/resources/literature
|
| C000255091 |
|
| Shareholder Report [Line Items] |
|
| Fund Name |
Columbia Select Corporate Income Fund
|
| Class Name |
Class S
|
| Trading Symbol |
SRIJX
|
| Annual or Semi-Annual Statement [Text Block] |
This annual shareholder report contains important information about Columbia Select Corporate Income Fund (the Fund) for the period of May 1, 2025 to April 30, 2026.
|
| Additional Information [Text Block] |
You can find additional information about the Fund at columbiathreadneedleus.com/resources/literature. You can also request more information by contacting us at 1-800-345-6611.
|
| Material Fund Change Notice [Text Block] |
This report describes changes to the Fund that occurred during the reporting period.
|
| Additional Information Phone Number |
1-800-345-6611
|
| Additional Information Website |
columbiathreadneedleus.com/resources/literature
|
| Expenses [Text Block] |
What were the Fund costs for the reporting period? (Based on a hypothetical $10,000 investment)
Table Summary
Class |
Cost of a $10,000 investment |
Cost paid as a percentage of a $10,000 investment |
Class S |
$61 |
0.59% | |
| Expenses Paid, Amount |
$ 61
|
| Expense Ratio, Percent |
0.59%
|
| Factors Affecting Performance [Text Block] |
Management's Discussion of Fund Performance The performance of Class S shares for the period presented is shown in the Average Annual Total Returns table. Top Performance ContributorsSecurity selection | Security selection contributed positively to the Fund’s performance. The most notable contributor to alpha was exposure to a beverage company. Industry allocation | Industry allocation effects were positive overall for the period. Most notable were overweight exposures to independent energy and aerospace and defense, as well as underweight allocations to media and entertainment and technology firms. Top Performance DetractorsIndustry allocation | Despite positive returns relative to the benchmark, underweight exposures to automotive and finance companies, as well as an overweight to cable and satellite, detracted from the Fund’s positive performance. Security selection | Despite positive security selection contribution, overweights to a technology company and a packaged food retailer detracted from the Fund’s performance. Credit allocation | The portfolio, on average, was underweight spread duration relative to the benchmark, which marginally detracted from the Fund’s performance over the period. |
| Performance Past Does Not Indicate Future [Text] |
The Fund's past performance is not a good predictor of the Fund's future performance.
|
| Line Graph [Table Text Block] |

Table Summary
|
Columbia Select Corporate Income Fund Class S ($13,609) |
Bloomberg U.S. Aggregate Bond Index ($11,803) |
Blended Benchmark - 85% Bloomberg U.S. Corporate Bond Index, 15% ICE BofA U.S. Cash Pay High Yield Constrained Index ($13,691) |
Bloomberg U.S. Corporate Bond Index ($13,078) |
04/16 |
$10,000 |
$10,000 |
$10,000 |
$10,000 |
05/16 |
$9,975 |
$10,003 |
$10,003 |
$9,992 |
06/16 |
$10,161 |
$10,182 |
$10,211 |
$10,217 |
07/16 |
$10,307 |
$10,247 |
$10,376 |
$10,366 |
08/16 |
$10,402 |
$10,235 |
$10,428 |
$10,387 |
09/16 |
$10,384 |
$10,229 |
$10,417 |
$10,361 |
10/16 |
$10,326 |
$10,151 |
$10,349 |
$10,277 |
11/16 |
$10,095 |
$9,911 |
$10,107 |
$10,001 |
12/16 |
$10,181 |
$9,925 |
$10,194 |
$10,068 |
01/17 |
$10,227 |
$9,944 |
$10,241 |
$10,099 |
02/17 |
$10,330 |
$10,011 |
$10,365 |
$10,215 |
03/17 |
$10,303 |
$10,006 |
$10,341 |
$10,191 |
04/17 |
$10,398 |
$10,083 |
$10,453 |
$10,300 |
05/17 |
$10,495 |
$10,160 |
$10,569 |
$10,418 |
06/17 |
$10,529 |
$10,150 |
$10,598 |
$10,450 |
07/17 |
$10,615 |
$10,194 |
$10,683 |
$10,527 |
08/17 |
$10,661 |
$10,285 |
$10,753 |
$10,608 |
09/17 |
$10,674 |
$10,236 |
$10,752 |
$10,590 |
10/17 |
$10,719 |
$10,242 |
$10,795 |
$10,633 |
11/17 |
$10,700 |
$10,229 |
$10,777 |
$10,617 |
12/17 |
$10,787 |
$10,276 |
$10,865 |
$10,714 |
01/18 |
$10,717 |
$10,158 |
$10,787 |
$10,612 |
02/18 |
$10,530 |
$10,061 |
$10,623 |
$10,439 |
03/18 |
$10,525 |
$10,126 |
$10,636 |
$10,466 |
04/18 |
$10,446 |
$10,051 |
$10,563 |
$10,369 |
05/18 |
$10,485 |
$10,122 |
$10,610 |
$10,424 |
06/18 |
$10,427 |
$10,110 |
$10,564 |
$10,364 |
07/18 |
$10,541 |
$10,112 |
$10,656 |
$10,450 |
08/18 |
$10,569 |
$10,177 |
$10,712 |
$10,502 |
09/18 |
$10,564 |
$10,112 |
$10,689 |
$10,464 |
10/18 |
$10,400 |
$10,032 |
$10,530 |
$10,311 |
11/18 |
$10,332 |
$10,092 |
$10,501 |
$10,294 |
12/18 |
$10,407 |
$10,277 |
$10,598 |
$10,446 |
01/19 |
$10,708 |
$10,386 |
$10,883 |
$10,691 |
02/19 |
$10,747 |
$10,380 |
$10,930 |
$10,714 |
03/19 |
$10,986 |
$10,580 |
$11,179 |
$10,983 |
04/19 |
$11,093 |
$10,582 |
$11,254 |
$11,042 |
05/19 |
$11,182 |
$10,770 |
$11,370 |
$11,201 |
06/19 |
$11,498 |
$10,906 |
$11,648 |
$11,475 |
07/19 |
$11,573 |
$10,930 |
$11,712 |
$11,539 |
08/19 |
$11,868 |
$11,213 |
$12,033 |
$11,902 |
09/19 |
$11,820 |
$11,153 |
$11,972 |
$11,824 |
10/19 |
$11,872 |
$11,187 |
$12,038 |
$11,896 |
11/19 |
$11,922 |
$11,181 |
$12,068 |
$11,926 |
12/19 |
$11,996 |
$11,173 |
$12,139 |
$11,964 |
01/20 |
$12,214 |
$11,388 |
$12,381 |
$12,245 |
02/20 |
$12,296 |
$11,593 |
$12,493 |
$12,408 |
03/20 |
$11,486 |
$11,525 |
$11,521 |
$11,529 |
04/20 |
$12,244 |
$11,730 |
$12,100 |
$12,134 |
05/20 |
$12,440 |
$11,784 |
$12,343 |
$12,324 |
06/20 |
$12,658 |
$11,859 |
$12,566 |
$12,565 |
07/20 |
$13,104 |
$12,036 |
$13,003 |
$12,974 |
08/20 |
$12,948 |
$11,939 |
$12,870 |
$12,795 |
09/20 |
$12,873 |
$11,932 |
$12,819 |
$12,758 |
10/20 |
$12,877 |
$11,879 |
$12,808 |
$12,735 |
11/20 |
$13,280 |
$11,995 |
$13,188 |
$13,090 |
12/20 |
$13,363 |
$12,012 |
$13,274 |
$13,147 |
01/21 |
$13,197 |
$11,926 |
$13,136 |
$12,978 |
02/21 |
$13,004 |
$11,753 |
$12,950 |
$12,755 |
03/21 |
$12,825 |
$11,607 |
$12,764 |
$12,536 |
04/21 |
$12,945 |
$11,698 |
$12,905 |
$12,675 |
05/21 |
$13,030 |
$11,737 |
$12,995 |
$12,772 |
06/21 |
$13,245 |
$11,819 |
$13,202 |
$12,980 |
07/21 |
$13,401 |
$11,951 |
$13,362 |
$13,158 |
08/21 |
$13,377 |
$11,929 |
$13,339 |
$13,118 |
09/21 |
$13,242 |
$11,825 |
$13,220 |
$12,980 |
10/21 |
$13,267 |
$11,822 |
$13,245 |
$13,012 |
11/21 |
$13,241 |
$11,857 |
$13,231 |
$13,020 |
12/21 |
$13,271 |
$11,827 |
$13,260 |
$13,010 |
01/22 |
$12,811 |
$11,572 |
$12,826 |
$12,572 |
02/22 |
$12,549 |
$11,443 |
$12,591 |
$12,321 |
03/22 |
$12,289 |
$11,125 |
$12,303 |
$12,010 |
04/22 |
$11,578 |
$10,703 |
$11,664 |
$11,353 |
05/22 |
$11,733 |
$10,772 |
$11,762 |
$11,459 |
06/22 |
$11,272 |
$10,603 |
$11,362 |
$11,138 |
07/22 |
$11,732 |
$10,862 |
$11,778 |
$11,499 |
08/22 |
$11,385 |
$10,555 |
$11,441 |
$11,162 |
09/22 |
$10,783 |
$10,099 |
$10,862 |
$10,575 |
10/22 |
$10,805 |
$9,968 |
$10,813 |
$10,466 |
11/22 |
$11,313 |
$10,335 |
$11,320 |
$11,008 |
12/22 |
$11,234 |
$10,288 |
$11,265 |
$10,959 |
01/23 |
$11,721 |
$10,604 |
$11,714 |
$11,398 |
02/23 |
$11,356 |
$10,330 |
$11,375 |
$11,036 |
03/23 |
$11,718 |
$10,593 |
$11,663 |
$11,343 |
04/23 |
$11,782 |
$10,657 |
$11,756 |
$11,430 |
05/23 |
$11,614 |
$10,541 |
$11,594 |
$11,264 |
06/23 |
$11,705 |
$10,503 |
$11,663 |
$11,311 |
07/23 |
$11,759 |
$10,496 |
$11,722 |
$11,350 |
08/23 |
$11,682 |
$10,429 |
$11,650 |
$11,262 |
09/23 |
$11,367 |
$10,164 |
$11,365 |
$10,961 |
10/23 |
$11,158 |
$10,003 |
$11,163 |
$10,756 |
11/23 |
$11,826 |
$10,456 |
$11,807 |
$11,399 |
12/23 |
$12,311 |
$10,857 |
$12,307 |
$11,893 |
01/24 |
$12,301 |
$10,827 |
$12,289 |
$11,873 |
02/24 |
$12,155 |
$10,674 |
$12,137 |
$11,694 |
03/24 |
$12,295 |
$10,773 |
$12,292 |
$11,845 |
04/24 |
$12,014 |
$10,500 |
$12,008 |
$11,544 |
05/24 |
$12,237 |
$10,678 |
$12,219 |
$11,760 |
06/24 |
$12,309 |
$10,780 |
$12,302 |
$11,835 |
07/24 |
$12,589 |
$11,031 |
$12,587 |
$12,117 |
08/24 |
$12,787 |
$11,190 |
$12,786 |
$12,308 |
09/24 |
$12,999 |
$11,340 |
$13,010 |
$12,526 |
10/24 |
$12,713 |
$11,058 |
$12,730 |
$12,222 |
11/24 |
$12,871 |
$11,175 |
$12,897 |
$12,385 |
12/24 |
$12,654 |
$10,992 |
$12,676 |
$12,146 |
01/25 |
$12,730 |
$11,051 |
$12,762 |
$12,213 |
02/25 |
$12,957 |
$11,294 |
$12,996 |
$12,462 |
03/25 |
$12,908 |
$11,298 |
$12,943 |
$12,426 |
04/25 |
$12,901 |
$11,343 |
$12,940 |
$12,422 |
05/25 |
$12,923 |
$11,261 |
$12,971 |
$12,420 |
06/25 |
$13,172 |
$11,435 |
$13,213 |
$12,653 |
07/25 |
$13,181 |
$11,404 |
$13,228 |
$12,661 |
08/25 |
$13,305 |
$11,541 |
$13,367 |
$12,789 |
09/25 |
$13,484 |
$11,667 |
$13,553 |
$12,981 |
10/25 |
$13,536 |
$11,740 |
$13,601 |
$13,031 |
11/25 |
$13,616 |
$11,813 |
$13,687 |
$13,116 |
12/25 |
$13,581 |
$11,795 |
$13,677 |
$13,090 |
01/26 |
$13,618 |
$11,808 |
$13,708 |
$13,113 |
02/26 |
$13,769 |
$12,001 |
$13,862 |
$13,282 |
03/26 |
$13,527 |
$11,789 |
$13,604 |
$13,020 |
04/26 |
$13,609 |
$11,803 |
$13,691 |
$13,078 |
|
| Average Annual Return [Table Text Block] |
Table Summary
Average Annual Total Returns (%) |
1 year |
5 years |
10 years |
Class SFootnote Reference(a) |
5.49 |
1.01 |
3.13 |
Bloomberg U.S. Aggregate Bond Index |
4.06 |
0.18 |
1.67 |
Blended Benchmark - 85% Bloomberg U.S. Corporate Bond Index, 15% ICE BofA U.S. Cash Pay High Yield Constrained Index |
5.80 |
1.19 |
3.19 |
Bloomberg U.S. Corporate Bond Index |
5.29 |
0.63 |
2.72 | |
| No Deduction of Taxes [Text Block] |
Performance does not reflect the deduction of taxes that a shareholder may pay on fund distributions or on the redemptions of fund shares.
|
| Updated Performance Information Location [Text Block] |
columbiathreadneedleus.com/investment-products/mutual-funds
|
| AssetsNet |
$ 1,906,268,582
|
| Holdings Count | Holding |
739
|
| Advisory Fees Paid, Amount |
$ 9,091,622
|
| InvestmentCompanyPortfolioTurnover |
105.00%
|
| Additional Fund Statistics [Text Block] |
Table Summary
Fund net assets |
$1,906,268,582 |
Total number of portfolio holdings |
739 |
Management services fees (represents 0.49% of Fund average net assets) |
$9,091,622 |
Portfolio turnover for the reporting period |
105% | |
| Holdings [Text Block] |
Table Summary
Corporate Bonds & Notes |
88.8% |
Money Market Funds |
6.5% |
U.S. Treasury Obligations |
3.7% |
Other |
0.3% | |
| Largest Holdings [Text Block] |
Table Summary
JPMorgan Chase & Co. 4.622% 04/23/2032 |
2.1% |
Principal Life Global Funding II 4.950% 11/27/2029 |
1.9% |
U.S. Treasury 4.875% 08/15/2045 |
1.8% |
Bacardi Ltd./Bacardi-Martini BV 5.400% 06/15/2033 |
1.6% |
Bank of America Corp. 1.922% 10/24/2031 |
1.2% |
ERAC USA Finance LLC 4.600% 05/01/2028 |
1.2% |
BAE Systems PLC 1.900% 02/15/2031 |
1.1% |
Merck & Co., Inc. 4.750% 12/04/2035 |
1.1% |
Morgan Stanley 5.900% 03/13/2047 |
1.1% |
AT&T, Inc. 3.800% 12/01/2057 |
1.0% | |
| Material Fund Change [Text Block] |
This is a summary of the changes to the Fund. For more complete information, you may review the Fund’s prospectus, which is available at columbiathreadneedleus.com/resources/literature or upon request at 1-800-345-6611. On September 1, 2025, the Fund's name was changed to Columbia Select Corporate Income Fund from Columbia Corporate Income Fund. |
| Material Fund Change Name [Text Block] |
On September 1, 2025, the Fund's name was changed to Columbia Select Corporate Income Fund from Columbia Corporate Income Fund.
|
| Summary of Change Legend [Text Block] |
This is a summary of the changes to the Fund. For more complete information, you may review the Fund’s prospectus, which is available at columbiathreadneedleus.com/resources/literature or upon request at 1-800-345-6611.
|
| Updated Prospectus Phone Number |
1-800-345-6611
|
| Updated Prospectus Web Address |
columbiathreadneedleus.com/resources/literature
|
| C000122679 |
|
| Shareholder Report [Line Items] |
|
| Fund Name |
Columbia Select Corporate Income Fund
|
| Class Name |
Institutional 2 Class
|
| Trading Symbol |
CPIRX
|
| Annual or Semi-Annual Statement [Text Block] |
This annual shareholder report contains important information about Columbia Select Corporate Income Fund (the Fund) for the period of May 1, 2025 to April 30, 2026.
|
| Additional Information [Text Block] |
You can find additional information about the Fund at columbiathreadneedleus.com/resources/literature. You can also request more information by contacting us at 1-800-345-6611.
|
| Material Fund Change Notice [Text Block] |
This report describes changes to the Fund that occurred during the reporting period.
|
| Additional Information Phone Number |
1-800-345-6611
|
| Additional Information Website |
columbiathreadneedleus.com/resources/literature
|
| Expenses [Text Block] |
What were the Fund costs for the reporting period? (Based on a hypothetical $10,000 investment)
Table Summary
Class |
Cost of a $10,000 investment |
Cost paid as a percentage of a $10,000 investment |
Institutional 2 Class |
$49 |
0.48% | |
| Expenses Paid, Amount |
$ 49
|
| Expense Ratio, Percent |
0.48%
|
| Factors Affecting Performance [Text Block] |
Management's Discussion of Fund Performance The performance of Institutional 2 Class shares for the period presented is shown in the Average Annual Total Returns table. Top Performance ContributorsSecurity selection | Security selection contributed positively to the Fund’s performance. The most notable contributor to alpha was exposure to a beverage company. Industry allocation | Industry allocation effects were positive overall for the period. Most notable were overweight exposures to independent energy and aerospace and defense, as well as underweight allocations to media and entertainment and technology firms. Top Performance DetractorsIndustry allocation | Despite positive returns relative to the benchmark, underweight exposures to automotive and finance companies, as well as an overweight to cable and satellite, detracted from the Fund’s positive performance. Security selection | Despite positive security selection contribution, overweights to a technology company and a packaged food retailer detracted from the Fund’s performance. Credit allocation | The portfolio, on average, was underweight spread duration relative to the benchmark, which marginally detracted from the Fund’s performance over the period. |
| Performance Past Does Not Indicate Future [Text] |
The Fund's past performance is not a good predictor of the Fund's future performance.
|
| Line Graph [Table Text Block] |

Table Summary
|
Columbia Select Corporate Income Fund Institutional 2 Class ($13,753) |
Bloomberg U.S. Aggregate Bond Index ($11,803) |
Blended Benchmark - 85% Bloomberg U.S. Corporate Bond Index, 15% ICE BofA U.S. Cash Pay High Yield Constrained Index ($13,691) |
Bloomberg U.S. Corporate Bond Index ($13,078) |
04/16 |
$10,000 |
$10,000 |
$10,000 |
$10,000 |
05/16 |
$9,986 |
$10,003 |
$10,003 |
$9,992 |
06/16 |
$10,163 |
$10,182 |
$10,211 |
$10,217 |
07/16 |
$10,320 |
$10,247 |
$10,376 |
$10,366 |
08/16 |
$10,406 |
$10,235 |
$10,428 |
$10,387 |
09/16 |
$10,389 |
$10,229 |
$10,417 |
$10,361 |
10/16 |
$10,342 |
$10,151 |
$10,349 |
$10,277 |
11/16 |
$10,112 |
$9,911 |
$10,107 |
$10,001 |
12/16 |
$10,199 |
$9,925 |
$10,194 |
$10,068 |
01/17 |
$10,245 |
$9,944 |
$10,241 |
$10,099 |
02/17 |
$10,350 |
$10,011 |
$10,365 |
$10,215 |
03/17 |
$10,323 |
$10,006 |
$10,341 |
$10,191 |
04/17 |
$10,409 |
$10,083 |
$10,453 |
$10,300 |
05/17 |
$10,507 |
$10,160 |
$10,569 |
$10,418 |
06/17 |
$10,543 |
$10,150 |
$10,598 |
$10,450 |
07/17 |
$10,630 |
$10,194 |
$10,683 |
$10,527 |
08/17 |
$10,687 |
$10,285 |
$10,753 |
$10,608 |
09/17 |
$10,691 |
$10,236 |
$10,752 |
$10,590 |
10/17 |
$10,737 |
$10,242 |
$10,795 |
$10,633 |
11/17 |
$10,719 |
$10,229 |
$10,777 |
$10,617 |
12/17 |
$10,807 |
$10,276 |
$10,865 |
$10,714 |
01/18 |
$10,737 |
$10,158 |
$10,787 |
$10,612 |
02/18 |
$10,561 |
$10,061 |
$10,623 |
$10,439 |
03/18 |
$10,557 |
$10,126 |
$10,636 |
$10,466 |
04/18 |
$10,479 |
$10,051 |
$10,563 |
$10,369 |
05/18 |
$10,507 |
$10,122 |
$10,610 |
$10,424 |
06/18 |
$10,461 |
$10,110 |
$10,564 |
$10,364 |
07/18 |
$10,575 |
$10,112 |
$10,656 |
$10,450 |
08/18 |
$10,604 |
$10,177 |
$10,712 |
$10,502 |
09/18 |
$10,590 |
$10,112 |
$10,689 |
$10,464 |
10/18 |
$10,426 |
$10,032 |
$10,530 |
$10,311 |
11/18 |
$10,369 |
$10,092 |
$10,501 |
$10,294 |
12/18 |
$10,434 |
$10,277 |
$10,598 |
$10,446 |
01/19 |
$10,737 |
$10,386 |
$10,883 |
$10,691 |
02/19 |
$10,789 |
$10,380 |
$10,930 |
$10,714 |
03/19 |
$11,029 |
$10,580 |
$11,179 |
$10,983 |
04/19 |
$11,138 |
$10,582 |
$11,254 |
$11,042 |
05/19 |
$11,227 |
$10,770 |
$11,370 |
$11,201 |
06/19 |
$11,546 |
$10,906 |
$11,648 |
$11,475 |
07/19 |
$11,622 |
$10,930 |
$11,712 |
$11,539 |
08/19 |
$11,920 |
$11,213 |
$12,033 |
$11,902 |
09/19 |
$11,872 |
$11,153 |
$11,972 |
$11,824 |
10/19 |
$11,925 |
$11,187 |
$12,038 |
$11,896 |
11/19 |
$11,966 |
$11,181 |
$12,068 |
$11,926 |
12/19 |
$12,052 |
$11,173 |
$12,139 |
$11,964 |
01/20 |
$12,273 |
$11,388 |
$12,381 |
$12,245 |
02/20 |
$12,345 |
$11,593 |
$12,493 |
$12,408 |
03/20 |
$11,531 |
$11,525 |
$11,521 |
$11,529 |
04/20 |
$12,295 |
$11,730 |
$12,100 |
$12,134 |
05/20 |
$12,504 |
$11,784 |
$12,343 |
$12,324 |
06/20 |
$12,725 |
$11,859 |
$12,566 |
$12,565 |
07/20 |
$13,174 |
$12,036 |
$13,003 |
$12,974 |
08/20 |
$13,008 |
$11,939 |
$12,870 |
$12,795 |
09/20 |
$12,944 |
$11,932 |
$12,819 |
$12,758 |
10/20 |
$12,939 |
$11,879 |
$12,808 |
$12,735 |
11/20 |
$13,345 |
$11,995 |
$13,188 |
$13,090 |
12/20 |
$13,430 |
$12,012 |
$13,274 |
$13,147 |
01/21 |
$13,264 |
$11,926 |
$13,136 |
$12,978 |
02/21 |
$13,070 |
$11,753 |
$12,950 |
$12,755 |
03/21 |
$12,903 |
$11,607 |
$12,764 |
$12,536 |
04/21 |
$13,025 |
$11,698 |
$12,905 |
$12,675 |
05/21 |
$13,111 |
$11,737 |
$12,995 |
$12,772 |
06/21 |
$13,329 |
$11,819 |
$13,202 |
$12,980 |
07/21 |
$13,487 |
$11,951 |
$13,362 |
$13,158 |
08/21 |
$13,463 |
$11,929 |
$13,339 |
$13,118 |
09/21 |
$13,329 |
$11,825 |
$13,220 |
$12,980 |
10/21 |
$13,342 |
$11,822 |
$13,245 |
$13,012 |
11/21 |
$13,318 |
$11,857 |
$13,231 |
$13,020 |
12/21 |
$13,349 |
$11,827 |
$13,260 |
$13,010 |
01/22 |
$12,899 |
$11,572 |
$12,826 |
$12,572 |
02/22 |
$12,636 |
$11,443 |
$12,591 |
$12,321 |
03/22 |
$12,362 |
$11,125 |
$12,303 |
$12,010 |
04/22 |
$11,659 |
$10,703 |
$11,664 |
$11,353 |
05/22 |
$11,804 |
$10,772 |
$11,762 |
$11,459 |
06/22 |
$11,352 |
$10,603 |
$11,362 |
$11,138 |
07/22 |
$11,817 |
$10,862 |
$11,778 |
$11,499 |
08/22 |
$11,455 |
$10,555 |
$11,441 |
$11,162 |
09/22 |
$10,862 |
$10,099 |
$10,862 |
$10,575 |
10/22 |
$10,885 |
$9,968 |
$10,813 |
$10,466 |
11/22 |
$11,398 |
$10,335 |
$11,320 |
$11,008 |
12/22 |
$11,320 |
$10,288 |
$11,265 |
$10,959 |
01/23 |
$11,812 |
$10,604 |
$11,714 |
$11,398 |
02/23 |
$11,444 |
$10,330 |
$11,375 |
$11,036 |
03/23 |
$11,797 |
$10,593 |
$11,663 |
$11,343 |
04/23 |
$11,876 |
$10,657 |
$11,756 |
$11,430 |
05/23 |
$11,707 |
$10,541 |
$11,594 |
$11,264 |
06/23 |
$11,801 |
$10,503 |
$11,663 |
$11,311 |
07/23 |
$11,856 |
$10,496 |
$11,722 |
$11,350 |
08/23 |
$11,766 |
$10,429 |
$11,650 |
$11,262 |
09/23 |
$11,462 |
$10,164 |
$11,365 |
$10,961 |
10/23 |
$11,253 |
$10,003 |
$11,163 |
$10,756 |
11/23 |
$11,929 |
$10,456 |
$11,807 |
$11,399 |
12/23 |
$12,419 |
$10,857 |
$12,307 |
$11,893 |
01/24 |
$12,411 |
$10,827 |
$12,289 |
$11,873 |
02/24 |
$12,251 |
$10,674 |
$12,137 |
$11,694 |
03/24 |
$12,407 |
$10,773 |
$12,292 |
$11,845 |
04/24 |
$12,125 |
$10,500 |
$12,008 |
$11,544 |
05/24 |
$12,338 |
$10,678 |
$12,219 |
$11,760 |
06/24 |
$12,426 |
$10,780 |
$12,302 |
$11,835 |
07/24 |
$12,709 |
$11,031 |
$12,587 |
$12,117 |
08/24 |
$12,911 |
$11,190 |
$12,786 |
$12,308 |
09/24 |
$13,126 |
$11,340 |
$13,010 |
$12,526 |
10/24 |
$12,840 |
$11,058 |
$12,730 |
$12,222 |
11/24 |
$13,001 |
$11,175 |
$12,897 |
$12,385 |
12/24 |
$12,768 |
$10,992 |
$12,676 |
$12,146 |
01/25 |
$12,847 |
$11,051 |
$12,762 |
$12,213 |
02/25 |
$13,092 |
$11,294 |
$12,996 |
$12,462 |
03/25 |
$13,043 |
$11,298 |
$12,943 |
$12,426 |
04/25 |
$13,038 |
$11,343 |
$12,940 |
$12,422 |
05/25 |
$13,062 |
$11,261 |
$12,971 |
$12,420 |
06/25 |
$13,315 |
$11,435 |
$13,213 |
$12,653 |
07/25 |
$13,325 |
$11,404 |
$13,228 |
$12,661 |
08/25 |
$13,452 |
$11,541 |
$13,367 |
$12,789 |
09/25 |
$13,634 |
$11,667 |
$13,553 |
$12,981 |
10/25 |
$13,688 |
$11,740 |
$13,601 |
$13,031 |
11/25 |
$13,770 |
$11,813 |
$13,687 |
$13,116 |
12/25 |
$13,735 |
$11,795 |
$13,677 |
$13,090 |
01/26 |
$13,775 |
$11,808 |
$13,708 |
$13,113 |
02/26 |
$13,928 |
$12,001 |
$13,862 |
$13,282 |
03/26 |
$13,684 |
$11,789 |
$13,604 |
$13,020 |
04/26 |
$13,753 |
$11,803 |
$13,691 |
$13,078 |
|
| Average Annual Return [Table Text Block] |
Table Summary
Average Annual Total Returns (%) |
1 year |
5 years |
10 years |
Institutional 2 Class |
5.49 |
1.09 |
3.24 |
Bloomberg U.S. Aggregate Bond Index |
4.06 |
0.18 |
1.67 |
Blended Benchmark - 85% Bloomberg U.S. Corporate Bond Index, 15% ICE BofA U.S. Cash Pay High Yield Constrained Index |
5.80 |
1.19 |
3.19 |
Bloomberg U.S. Corporate Bond Index |
5.29 |
0.63 |
2.72 | |
| No Deduction of Taxes [Text Block] |
Performance does not reflect the deduction of taxes that a shareholder may pay on fund distributions or on the redemptions of fund shares.
|
| Updated Performance Information Location [Text Block] |
columbiathreadneedleus.com/investment-products/mutual-funds
|
| AssetsNet |
$ 1,906,268,582
|
| Holdings Count | Holding |
739
|
| Advisory Fees Paid, Amount |
$ 9,091,622
|
| InvestmentCompanyPortfolioTurnover |
105.00%
|
| Additional Fund Statistics [Text Block] |
Table Summary
Fund net assets |
$1,906,268,582 |
Total number of portfolio holdings |
739 |
Management services fees (represents 0.49% of Fund average net assets) |
$9,091,622 |
Portfolio turnover for the reporting period |
105% | |
| Holdings [Text Block] |
Table Summary
Corporate Bonds & Notes |
88.8% |
Money Market Funds |
6.5% |
U.S. Treasury Obligations |
3.7% |
Other |
0.3% | |
| Largest Holdings [Text Block] |
Table Summary
JPMorgan Chase & Co. 4.622% 04/23/2032 |
2.1% |
Principal Life Global Funding II 4.950% 11/27/2029 |
1.9% |
U.S. Treasury 4.875% 08/15/2045 |
1.8% |
Bacardi Ltd./Bacardi-Martini BV 5.400% 06/15/2033 |
1.6% |
Bank of America Corp. 1.922% 10/24/2031 |
1.2% |
ERAC USA Finance LLC 4.600% 05/01/2028 |
1.2% |
BAE Systems PLC 1.900% 02/15/2031 |
1.1% |
Merck & Co., Inc. 4.750% 12/04/2035 |
1.1% |
Morgan Stanley 5.900% 03/13/2047 |
1.1% |
AT&T, Inc. 3.800% 12/01/2057 |
1.0% | |
| Material Fund Change [Text Block] |
This is a summary of the changes to the Fund. For more complete information, you may review the Fund’s prospectus, which is available at columbiathreadneedleus.com/resources/literature or upon request at 1-800-345-6611. On September 1, 2025, the Fund's name was changed to Columbia Select Corporate Income Fund from Columbia Corporate Income Fund. |
| Material Fund Change Name [Text Block] |
On September 1, 2025, the Fund's name was changed to Columbia Select Corporate Income Fund from Columbia Corporate Income Fund.
|
| Summary of Change Legend [Text Block] |
This is a summary of the changes to the Fund. For more complete information, you may review the Fund’s prospectus, which is available at columbiathreadneedleus.com/resources/literature or upon request at 1-800-345-6611.
|
| Updated Prospectus Phone Number |
1-800-345-6611
|
| Updated Prospectus Web Address |
columbiathreadneedleus.com/resources/literature
|
| C000122677 |
|
| Shareholder Report [Line Items] |
|
| Fund Name |
Columbia Select Corporate Income Fund
|
| Class Name |
Institutional 3 Class
|
| Trading Symbol |
CRIYX
|
| Annual or Semi-Annual Statement [Text Block] |
This annual shareholder report contains important information about Columbia Select Corporate Income Fund (the Fund) for the period of May 1, 2025 to April 30, 2026.
|
| Additional Information [Text Block] |
You can find additional information about the Fund at columbiathreadneedleus.com/resources/literature. You can also request more information by contacting us at 1-800-345-6611.
|
| Material Fund Change Notice [Text Block] |
This report describes changes to the Fund that occurred during the reporting period.
|
| Additional Information Phone Number |
1-800-345-6611
|
| Additional Information Website |
columbiathreadneedleus.com/resources/literature
|
| Expenses [Text Block] |
What were the Fund costs for the reporting period? (Based on a hypothetical $10,000 investment)
Table Summary
Class |
Cost of a $10,000 investment |
Cost paid as a percentage of a $10,000 investment |
Institutional 3 Class |
$46 |
0.45% | |
| Expenses Paid, Amount |
$ 46
|
| Expense Ratio, Percent |
0.45%
|
| Factors Affecting Performance [Text Block] |
Management's Discussion of Fund Performance The performance of Institutional 3 Class shares for the period presented is shown in the Average Annual Total Returns table. Top Performance ContributorsSecurity selection | Security selection contributed positively to the Fund’s performance. The most notable contributor to alpha was exposure to a beverage company. Industry allocation | Industry allocation effects were positive overall for the period. Most notable were overweight exposures to independent energy and aerospace and defense, as well as underweight allocations to media and entertainment and technology firms. Top Performance DetractorsIndustry allocation | Despite positive returns relative to the benchmark, underweight exposures to automotive and finance companies, as well as an overweight to cable and satellite, detracted from the Fund’s positive performance. Security selection | Despite positive security selection contribution, overweights to a technology company and a packaged food retailer detracted from the Fund’s performance. Credit allocation | The portfolio, on average, was underweight spread duration relative to the benchmark, which marginally detracted from the Fund’s performance over the period. |
| Performance Past Does Not Indicate Future [Text] |
The Fund's past performance is not a good predictor of the Fund's future performance.
|
| Line Graph [Table Text Block] |
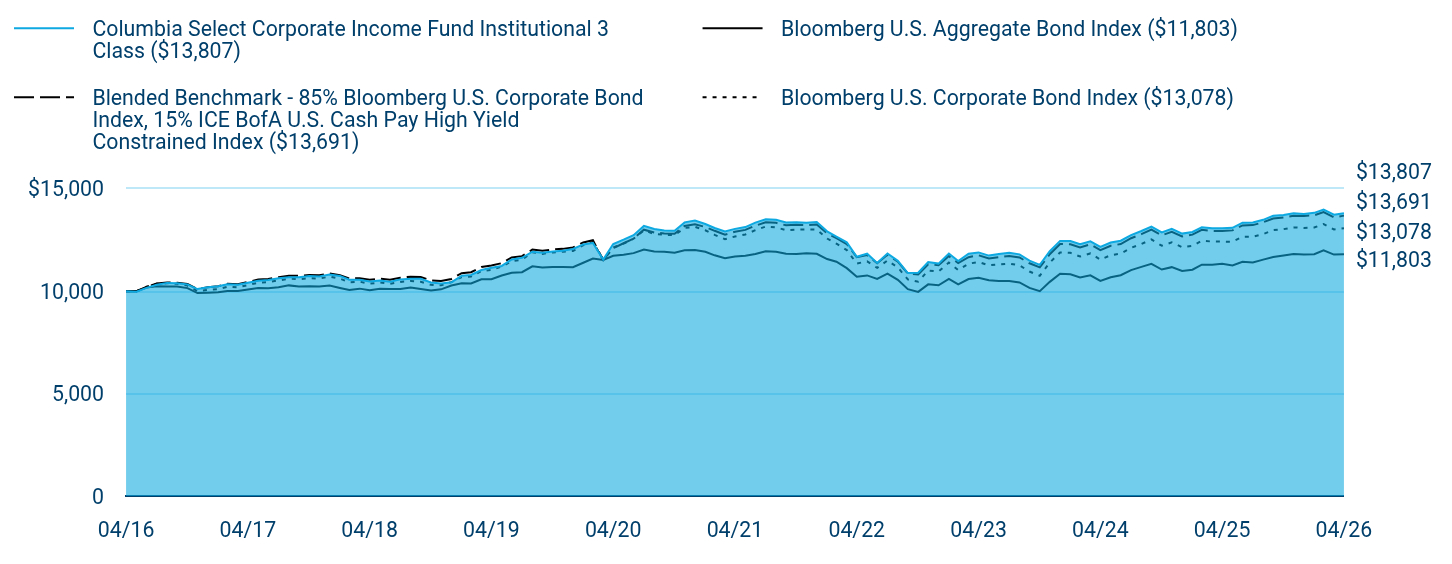
Table Summary
|
Columbia Select Corporate Income Fund Institutional 3 Class ($13,807) |
Bloomberg U.S. Aggregate Bond Index ($11,803) |
Blended Benchmark - 85% Bloomberg U.S. Corporate Bond Index, 15% ICE BofA U.S. Cash Pay High Yield Constrained Index ($13,691) |
Bloomberg U.S. Corporate Bond Index ($13,078) |
04/16 |
$10,000 |
$10,000 |
$10,000 |
$10,000 |
05/16 |
$9,977 |
$10,003 |
$10,003 |
$9,992 |
06/16 |
$10,164 |
$10,182 |
$10,211 |
$10,217 |
07/16 |
$10,311 |
$10,247 |
$10,376 |
$10,366 |
08/16 |
$10,407 |
$10,235 |
$10,428 |
$10,387 |
09/16 |
$10,390 |
$10,229 |
$10,417 |
$10,361 |
10/16 |
$10,334 |
$10,151 |
$10,349 |
$10,277 |
11/16 |
$10,105 |
$9,911 |
$10,107 |
$10,001 |
12/16 |
$10,192 |
$9,925 |
$10,194 |
$10,068 |
01/17 |
$10,239 |
$9,944 |
$10,241 |
$10,099 |
02/17 |
$10,344 |
$10,011 |
$10,365 |
$10,215 |
03/17 |
$10,318 |
$10,006 |
$10,341 |
$10,191 |
04/17 |
$10,414 |
$10,083 |
$10,453 |
$10,300 |
05/17 |
$10,513 |
$10,160 |
$10,569 |
$10,418 |
06/17 |
$10,548 |
$10,150 |
$10,598 |
$10,450 |
07/17 |
$10,636 |
$10,194 |
$10,683 |
$10,527 |
08/17 |
$10,683 |
$10,285 |
$10,753 |
$10,608 |
09/17 |
$10,687 |
$10,236 |
$10,752 |
$10,590 |
10/17 |
$10,744 |
$10,242 |
$10,795 |
$10,633 |
11/17 |
$10,717 |
$10,229 |
$10,777 |
$10,617 |
12/17 |
$10,815 |
$10,276 |
$10,865 |
$10,714 |
01/18 |
$10,747 |
$10,158 |
$10,787 |
$10,612 |
02/18 |
$10,561 |
$10,061 |
$10,623 |
$10,439 |
03/18 |
$10,557 |
$10,126 |
$10,636 |
$10,466 |
04/18 |
$10,479 |
$10,051 |
$10,563 |
$10,369 |
05/18 |
$10,519 |
$10,122 |
$10,610 |
$10,424 |
06/18 |
$10,463 |
$10,110 |
$10,564 |
$10,364 |
07/18 |
$10,578 |
$10,112 |
$10,656 |
$10,450 |
08/18 |
$10,607 |
$10,177 |
$10,712 |
$10,502 |
09/18 |
$10,604 |
$10,112 |
$10,689 |
$10,464 |
10/18 |
$10,430 |
$10,032 |
$10,530 |
$10,311 |
11/18 |
$10,374 |
$10,092 |
$10,501 |
$10,294 |
12/18 |
$10,439 |
$10,277 |
$10,598 |
$10,446 |
01/19 |
$10,753 |
$10,386 |
$10,883 |
$10,691 |
02/19 |
$10,794 |
$10,380 |
$10,930 |
$10,714 |
03/19 |
$11,035 |
$10,580 |
$11,179 |
$10,983 |
04/19 |
$11,144 |
$10,582 |
$11,254 |
$11,042 |
05/19 |
$11,234 |
$10,770 |
$11,370 |
$11,201 |
06/19 |
$11,553 |
$10,906 |
$11,648 |
$11,475 |
07/19 |
$11,630 |
$10,930 |
$11,712 |
$11,539 |
08/19 |
$11,928 |
$11,213 |
$12,033 |
$11,902 |
09/19 |
$11,881 |
$11,153 |
$11,972 |
$11,824 |
10/19 |
$11,935 |
$11,187 |
$12,038 |
$11,896 |
11/19 |
$11,976 |
$11,181 |
$12,068 |
$11,926 |
12/19 |
$12,063 |
$11,173 |
$12,139 |
$11,964 |
01/20 |
$12,284 |
$11,388 |
$12,381 |
$12,245 |
02/20 |
$12,357 |
$11,593 |
$12,493 |
$12,408 |
03/20 |
$11,543 |
$11,525 |
$11,521 |
$11,529 |
04/20 |
$12,308 |
$11,730 |
$12,100 |
$12,134 |
05/20 |
$12,518 |
$11,784 |
$12,343 |
$12,324 |
06/20 |
$12,739 |
$11,859 |
$12,566 |
$12,565 |
07/20 |
$13,189 |
$12,036 |
$13,003 |
$12,974 |
08/20 |
$13,035 |
$11,939 |
$12,870 |
$12,795 |
09/20 |
$12,960 |
$11,932 |
$12,819 |
$12,758 |
10/20 |
$12,955 |
$11,879 |
$12,808 |
$12,735 |
11/20 |
$13,362 |
$11,995 |
$13,188 |
$13,090 |
12/20 |
$13,448 |
$12,012 |
$13,274 |
$13,147 |
01/21 |
$13,283 |
$11,926 |
$13,136 |
$12,978 |
02/21 |
$13,089 |
$11,753 |
$12,950 |
$12,755 |
03/21 |
$12,923 |
$11,607 |
$12,764 |
$12,536 |
04/21 |
$13,045 |
$11,698 |
$12,905 |
$12,675 |
05/21 |
$13,132 |
$11,737 |
$12,995 |
$12,772 |
06/21 |
$13,351 |
$11,819 |
$13,202 |
$12,980 |
07/21 |
$13,509 |
$11,951 |
$13,362 |
$13,158 |
08/21 |
$13,486 |
$11,929 |
$13,339 |
$13,118 |
09/21 |
$13,352 |
$11,825 |
$13,220 |
$12,980 |
10/21 |
$13,366 |
$11,822 |
$13,245 |
$13,012 |
11/21 |
$13,343 |
$11,857 |
$13,231 |
$13,020 |
12/21 |
$13,374 |
$11,827 |
$13,260 |
$13,010 |
01/22 |
$12,924 |
$11,572 |
$12,826 |
$12,572 |
02/22 |
$12,661 |
$11,443 |
$12,591 |
$12,321 |
03/22 |
$12,388 |
$11,125 |
$12,303 |
$12,010 |
04/22 |
$11,684 |
$10,703 |
$11,664 |
$11,353 |
05/22 |
$11,830 |
$10,772 |
$11,762 |
$11,459 |
06/22 |
$11,378 |
$10,603 |
$11,362 |
$11,138 |
07/22 |
$11,845 |
$10,862 |
$11,778 |
$11,499 |
08/22 |
$11,483 |
$10,555 |
$11,441 |
$11,162 |
09/22 |
$10,889 |
$10,099 |
$10,862 |
$10,575 |
10/22 |
$10,900 |
$9,968 |
$10,813 |
$10,466 |
11/22 |
$11,427 |
$10,335 |
$11,320 |
$11,008 |
12/22 |
$11,349 |
$10,288 |
$11,265 |
$10,959 |
01/23 |
$11,843 |
$10,604 |
$11,714 |
$11,398 |
02/23 |
$11,475 |
$10,330 |
$11,375 |
$11,036 |
03/23 |
$11,829 |
$10,593 |
$11,663 |
$11,343 |
04/23 |
$11,895 |
$10,657 |
$11,756 |
$11,430 |
05/23 |
$11,740 |
$10,541 |
$11,594 |
$11,264 |
06/23 |
$11,821 |
$10,503 |
$11,663 |
$11,311 |
07/23 |
$11,877 |
$10,496 |
$11,722 |
$11,350 |
08/23 |
$11,800 |
$10,429 |
$11,650 |
$11,262 |
09/23 |
$11,496 |
$10,164 |
$11,365 |
$10,961 |
10/23 |
$11,287 |
$10,003 |
$11,163 |
$10,756 |
11/23 |
$11,951 |
$10,456 |
$11,807 |
$11,399 |
12/23 |
$12,457 |
$10,857 |
$12,307 |
$11,893 |
01/24 |
$12,449 |
$10,827 |
$12,289 |
$11,873 |
02/24 |
$12,290 |
$10,674 |
$12,137 |
$11,694 |
03/24 |
$12,433 |
$10,773 |
$12,292 |
$11,845 |
04/24 |
$12,164 |
$10,500 |
$12,008 |
$11,544 |
05/24 |
$12,378 |
$10,678 |
$12,219 |
$11,760 |
06/24 |
$12,467 |
$10,780 |
$12,302 |
$11,835 |
07/24 |
$12,738 |
$11,031 |
$12,587 |
$12,117 |
08/24 |
$12,940 |
$11,190 |
$12,786 |
$12,308 |
09/24 |
$13,157 |
$11,340 |
$13,010 |
$12,526 |
10/24 |
$12,870 |
$11,058 |
$12,730 |
$12,222 |
11/24 |
$13,045 |
$11,175 |
$12,897 |
$12,385 |
12/24 |
$12,813 |
$10,992 |
$12,676 |
$12,146 |
01/25 |
$12,892 |
$11,051 |
$12,762 |
$12,213 |
02/25 |
$13,124 |
$11,294 |
$12,996 |
$12,462 |
03/25 |
$13,076 |
$11,298 |
$12,943 |
$12,426 |
04/25 |
$13,070 |
$11,343 |
$12,940 |
$12,422 |
05/25 |
$13,094 |
$11,261 |
$12,971 |
$12,420 |
06/25 |
$13,349 |
$11,435 |
$13,213 |
$12,653 |
07/25 |
$13,360 |
$11,404 |
$13,228 |
$12,661 |
08/25 |
$13,487 |
$11,541 |
$13,367 |
$12,789 |
09/25 |
$13,685 |
$11,667 |
$13,553 |
$12,981 |
10/25 |
$13,724 |
$11,740 |
$13,601 |
$13,031 |
11/25 |
$13,806 |
$11,813 |
$13,687 |
$13,116 |
12/25 |
$13,772 |
$11,795 |
$13,677 |
$13,090 |
01/26 |
$13,827 |
$11,808 |
$13,708 |
$13,113 |
02/26 |
$13,982 |
$12,001 |
$13,862 |
$13,282 |
03/26 |
$13,737 |
$11,789 |
$13,604 |
$13,020 |
04/26 |
$13,807 |
$11,803 |
$13,691 |
$13,078 |
|
| Average Annual Return [Table Text Block] |
Table Summary
Average Annual Total Returns (%) |
1 year |
5 years |
10 years |
Institutional 3 Class |
5.64 |
1.14 |
3.28 |
Bloomberg U.S. Aggregate Bond Index |
4.06 |
0.18 |
1.67 |
Blended Benchmark - 85% Bloomberg U.S. Corporate Bond Index, 15% ICE BofA U.S. Cash Pay High Yield Constrained Index |
5.80 |
1.19 |
3.19 |
Bloomberg U.S. Corporate Bond Index |
5.29 |
0.63 |
2.72 | |
| No Deduction of Taxes [Text Block] |
Performance does not reflect the deduction of taxes that a shareholder may pay on fund distributions or on the redemptions of fund shares.
|
| Updated Performance Information Location [Text Block] |
columbiathreadneedleus.com/investment-products/mutual-funds
|
| AssetsNet |
$ 1,906,268,582
|
| Holdings Count | Holding |
739
|
| Advisory Fees Paid, Amount |
$ 9,091,622
|
| InvestmentCompanyPortfolioTurnover |
105.00%
|
| Additional Fund Statistics [Text Block] |
Table Summary
Fund net assets |
$1,906,268,582 |
Total number of portfolio holdings |
739 |
Management services fees (represents 0.49% of Fund average net assets) |
$9,091,622 |
Portfolio turnover for the reporting period |
105% | |
| Holdings [Text Block] |
Table Summary
Corporate Bonds & Notes |
88.8% |
Money Market Funds |
6.5% |
U.S. Treasury Obligations |
3.7% |
Other |
0.3% | |
| Largest Holdings [Text Block] |
Table Summary
JPMorgan Chase & Co. 4.622% 04/23/2032 |
2.1% |
Principal Life Global Funding II 4.950% 11/27/2029 |
1.9% |
U.S. Treasury 4.875% 08/15/2045 |
1.8% |
Bacardi Ltd./Bacardi-Martini BV 5.400% 06/15/2033 |
1.6% |
Bank of America Corp. 1.922% 10/24/2031 |
1.2% |
ERAC USA Finance LLC 4.600% 05/01/2028 |
1.2% |
BAE Systems PLC 1.900% 02/15/2031 |
1.1% |
Merck & Co., Inc. 4.750% 12/04/2035 |
1.1% |
Morgan Stanley 5.900% 03/13/2047 |
1.1% |
AT&T, Inc. 3.800% 12/01/2057 |
1.0% | |
| Material Fund Change [Text Block] |
This is a summary of the changes to the Fund. For more complete information, you may review the Fund’s prospectus, which is available at columbiathreadneedleus.com/resources/literature or upon request at 1-800-345-6611. On September 1, 2025, the Fund's name was changed to Columbia Select Corporate Income Fund from Columbia Corporate Income Fund. |
| Material Fund Change Name [Text Block] |
On September 1, 2025, the Fund's name was changed to Columbia Select Corporate Income Fund from Columbia Corporate Income Fund.
|
| Summary of Change Legend [Text Block] |
This is a summary of the changes to the Fund. For more complete information, you may review the Fund’s prospectus, which is available at columbiathreadneedleus.com/resources/literature or upon request at 1-800-345-6611.
|
| Updated Prospectus Phone Number |
1-800-345-6611
|
| Updated Prospectus Web Address |
columbiathreadneedleus.com/resources/literature
|
| C000032982 |
|
| Shareholder Report [Line Items] |
|
| Fund Name |
Columbia Select Corporate Income Fund
|
| Class Name |
Institutional Class
|
| Trading Symbol |
SRINX
|
| Annual or Semi-Annual Statement [Text Block] |
This annual shareholder report contains important information about Columbia Select Corporate Income Fund (the Fund) for the period of May 1, 2025 to April 30, 2026.
|
| Additional Information [Text Block] |
You can find additional information about the Fund at columbiathreadneedleus.com/resources/literature. You can also request more information by contacting us at 1-800-345-6611.
|
| Material Fund Change Notice [Text Block] |
This report describes changes to the Fund that occurred during the reporting period.
|
| Additional Information Phone Number |
1-800-345-6611
|
| Additional Information Website |
columbiathreadneedleus.com/resources/literature
|
| Expenses [Text Block] |
What were the Fund costs for the reporting period? (Based on a hypothetical $10,000 investment)
Table Summary
Class |
Cost of a $10,000 investment |
Cost paid as a percentage of a $10,000 investment |
Institutional Class |
$61 |
0.59% | |
| Expenses Paid, Amount |
$ 61
|
| Expense Ratio, Percent |
0.59%
|
| Factors Affecting Performance [Text Block] |
Management's Discussion of Fund Performance The performance of Institutional Class shares for the period presented is shown in the Average Annual Total Returns table. Top Performance ContributorsSecurity selection | Security selection contributed positively to the Fund’s performance. The most notable contributor to alpha was exposure to a beverage company. Industry allocation | Industry allocation effects were positive overall for the period. Most notable were overweight exposures to independent energy and aerospace and defense, as well as underweight allocations to media and entertainment and technology firms. Top Performance DetractorsIndustry allocation | Despite positive returns relative to the benchmark, underweight exposures to automotive and finance companies, as well as an overweight to cable and satellite, detracted from the Fund’s positive performance. Security selection | Despite positive security selection contribution, overweights to a technology company and a packaged food retailer detracted from the Fund’s performance. Credit allocation | The portfolio, on average, was underweight spread duration relative to the benchmark, which marginally detracted from the Fund’s performance over the period. |
| Performance Past Does Not Indicate Future [Text] |
The Fund's past performance is not a good predictor of the Fund's future performance.
|
| Line Graph [Table Text Block] |
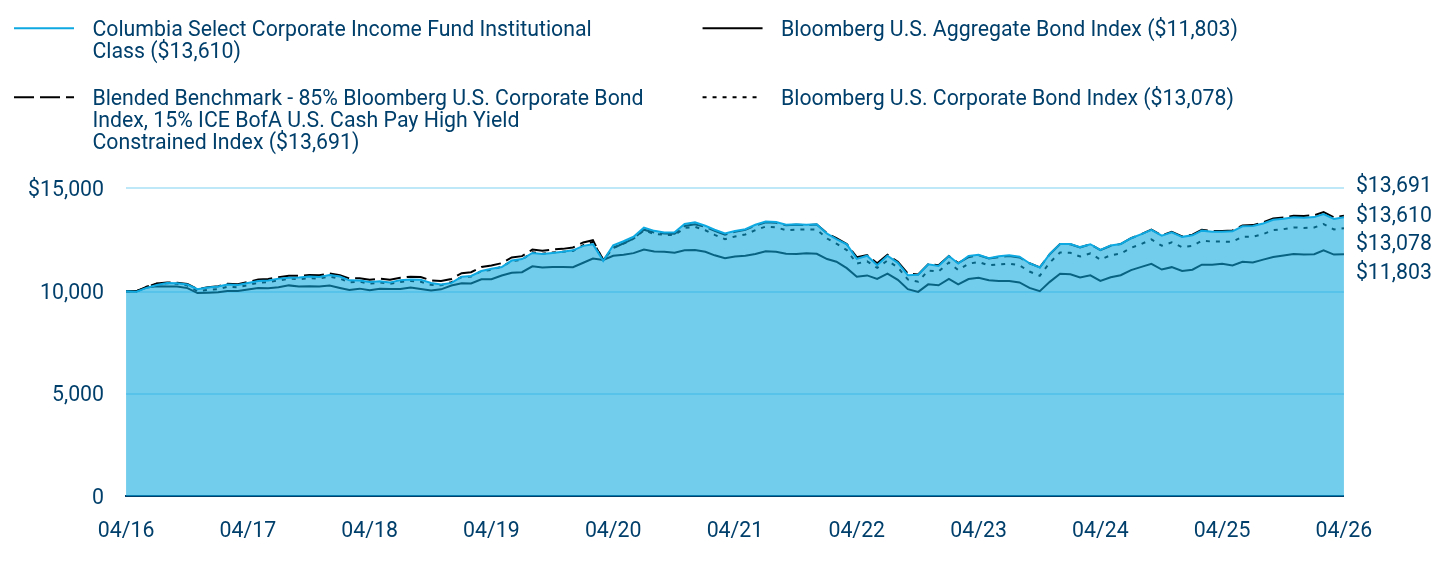
Table Summary
|
Columbia Select Corporate Income Fund Institutional Class ($13,610) |
Bloomberg U.S. Aggregate Bond Index ($11,803) |
Blended Benchmark - 85% Bloomberg U.S. Corporate Bond Index, 15% ICE BofA U.S. Cash Pay High Yield Constrained Index ($13,691) |
Bloomberg U.S. Corporate Bond Index ($13,078) |
04/16 |
$10,000 |
$10,000 |
$10,000 |
$10,000 |
05/16 |
$9,975 |
$10,003 |
$10,003 |
$9,992 |
06/16 |
$10,161 |
$10,182 |
$10,211 |
$10,217 |
07/16 |
$10,307 |
$10,247 |
$10,376 |
$10,366 |
08/16 |
$10,402 |
$10,235 |
$10,428 |
$10,387 |
09/16 |
$10,384 |
$10,229 |
$10,417 |
$10,361 |
10/16 |
$10,326 |
$10,151 |
$10,349 |
$10,277 |
11/16 |
$10,095 |
$9,911 |
$10,107 |
$10,001 |
12/16 |
$10,181 |
$9,925 |
$10,194 |
$10,068 |
01/17 |
$10,227 |
$9,944 |
$10,241 |
$10,099 |
02/17 |
$10,330 |
$10,011 |
$10,365 |
$10,215 |
03/17 |
$10,303 |
$10,006 |
$10,341 |
$10,191 |
04/17 |
$10,398 |
$10,083 |
$10,453 |
$10,300 |
05/17 |
$10,495 |
$10,160 |
$10,569 |
$10,418 |
06/17 |
$10,529 |
$10,150 |
$10,598 |
$10,450 |
07/17 |
$10,615 |
$10,194 |
$10,683 |
$10,527 |
08/17 |
$10,661 |
$10,285 |
$10,753 |
$10,608 |
09/17 |
$10,674 |
$10,236 |
$10,752 |
$10,590 |
10/17 |
$10,719 |
$10,242 |
$10,795 |
$10,633 |
11/17 |
$10,700 |
$10,229 |
$10,777 |
$10,617 |
12/17 |
$10,787 |
$10,276 |
$10,865 |
$10,714 |
01/18 |
$10,717 |
$10,158 |
$10,787 |
$10,612 |
02/18 |
$10,530 |
$10,061 |
$10,623 |
$10,439 |
03/18 |
$10,525 |
$10,126 |
$10,636 |
$10,466 |
04/18 |
$10,446 |
$10,051 |
$10,563 |
$10,369 |
05/18 |
$10,485 |
$10,122 |
$10,610 |
$10,424 |
06/18 |
$10,427 |
$10,110 |
$10,564 |
$10,364 |
07/18 |
$10,541 |
$10,112 |
$10,656 |
$10,450 |
08/18 |
$10,569 |
$10,177 |
$10,712 |
$10,502 |
09/18 |
$10,564 |
$10,112 |
$10,689 |
$10,464 |
10/18 |
$10,400 |
$10,032 |
$10,530 |
$10,311 |
11/18 |
$10,332 |
$10,092 |
$10,501 |
$10,294 |
12/18 |
$10,407 |
$10,277 |
$10,598 |
$10,446 |
01/19 |
$10,708 |
$10,386 |
$10,883 |
$10,691 |
02/19 |
$10,747 |
$10,380 |
$10,930 |
$10,714 |
03/19 |
$10,986 |
$10,580 |
$11,179 |
$10,983 |
04/19 |
$11,093 |
$10,582 |
$11,254 |
$11,042 |
05/19 |
$11,182 |
$10,770 |
$11,370 |
$11,201 |
06/19 |
$11,498 |
$10,906 |
$11,648 |
$11,475 |
07/19 |
$11,573 |
$10,930 |
$11,712 |
$11,539 |
08/19 |
$11,868 |
$11,213 |
$12,033 |
$11,902 |
09/19 |
$11,820 |
$11,153 |
$11,972 |
$11,824 |
10/19 |
$11,872 |
$11,187 |
$12,038 |
$11,896 |
11/19 |
$11,922 |
$11,181 |
$12,068 |
$11,926 |
12/19 |
$11,996 |
$11,173 |
$12,139 |
$11,964 |
01/20 |
$12,214 |
$11,388 |
$12,381 |
$12,245 |
02/20 |
$12,296 |
$11,593 |
$12,493 |
$12,408 |
03/20 |
$11,486 |
$11,525 |
$11,521 |
$11,529 |
04/20 |
$12,244 |
$11,730 |
$12,100 |
$12,134 |
05/20 |
$12,440 |
$11,784 |
$12,343 |
$12,324 |
06/20 |
$12,658 |
$11,859 |
$12,566 |
$12,565 |
07/20 |
$13,104 |
$12,036 |
$13,003 |
$12,974 |
08/20 |
$12,948 |
$11,939 |
$12,870 |
$12,795 |
09/20 |
$12,873 |
$11,932 |
$12,819 |
$12,758 |
10/20 |
$12,877 |
$11,879 |
$12,808 |
$12,735 |
11/20 |
$13,280 |
$11,995 |
$13,188 |
$13,090 |
12/20 |
$13,363 |
$12,012 |
$13,274 |
$13,147 |
01/21 |
$13,197 |
$11,926 |
$13,136 |
$12,978 |
02/21 |
$13,004 |
$11,753 |
$12,950 |
$12,755 |
03/21 |
$12,825 |
$11,607 |
$12,764 |
$12,536 |
04/21 |
$12,945 |
$11,698 |
$12,905 |
$12,675 |
05/21 |
$13,030 |
$11,737 |
$12,995 |
$12,772 |
06/21 |
$13,245 |
$11,819 |
$13,202 |
$12,980 |
07/21 |
$13,401 |
$11,951 |
$13,362 |
$13,158 |
08/21 |
$13,377 |
$11,929 |
$13,339 |
$13,118 |
09/21 |
$13,242 |
$11,825 |
$13,220 |
$12,980 |
10/21 |
$13,267 |
$11,822 |
$13,245 |
$13,012 |
11/21 |
$13,241 |
$11,857 |
$13,231 |
$13,020 |
12/21 |
$13,271 |
$11,827 |
$13,260 |
$13,010 |
01/22 |
$12,811 |
$11,572 |
$12,826 |
$12,572 |
02/22 |
$12,549 |
$11,443 |
$12,591 |
$12,321 |
03/22 |
$12,289 |
$11,125 |
$12,303 |
$12,010 |
04/22 |
$11,578 |
$10,703 |
$11,664 |
$11,353 |
05/22 |
$11,733 |
$10,772 |
$11,762 |
$11,459 |
06/22 |
$11,272 |
$10,603 |
$11,362 |
$11,138 |
07/22 |
$11,732 |
$10,862 |
$11,778 |
$11,499 |
08/22 |
$11,385 |
$10,555 |
$11,441 |
$11,162 |
09/22 |
$10,783 |
$10,099 |
$10,862 |
$10,575 |
10/22 |
$10,805 |
$9,968 |
$10,813 |
$10,466 |
11/22 |
$11,313 |
$10,335 |
$11,320 |
$11,008 |
12/22 |
$11,234 |
$10,288 |
$11,265 |
$10,959 |
01/23 |
$11,721 |
$10,604 |
$11,714 |
$11,398 |
02/23 |
$11,356 |
$10,330 |
$11,375 |
$11,036 |
03/23 |
$11,718 |
$10,593 |
$11,663 |
$11,343 |
04/23 |
$11,782 |
$10,657 |
$11,756 |
$11,430 |
05/23 |
$11,614 |
$10,541 |
$11,594 |
$11,264 |
06/23 |
$11,705 |
$10,503 |
$11,663 |
$11,311 |
07/23 |
$11,759 |
$10,496 |
$11,722 |
$11,350 |
08/23 |
$11,682 |
$10,429 |
$11,650 |
$11,262 |
09/23 |
$11,367 |
$10,164 |
$11,365 |
$10,961 |
10/23 |
$11,158 |
$10,003 |
$11,163 |
$10,756 |
11/23 |
$11,826 |
$10,456 |
$11,807 |
$11,399 |
12/23 |
$12,311 |
$10,857 |
$12,307 |
$11,893 |
01/24 |
$12,301 |
$10,827 |
$12,289 |
$11,873 |
02/24 |
$12,155 |
$10,674 |
$12,137 |
$11,694 |
03/24 |
$12,295 |
$10,773 |
$12,292 |
$11,845 |
04/24 |
$12,014 |
$10,500 |
$12,008 |
$11,544 |
05/24 |
$12,237 |
$10,678 |
$12,219 |
$11,760 |
06/24 |
$12,309 |
$10,780 |
$12,302 |
$11,835 |
07/24 |
$12,589 |
$11,031 |
$12,587 |
$12,117 |
08/24 |
$12,787 |
$11,190 |
$12,786 |
$12,308 |
09/24 |
$12,999 |
$11,340 |
$13,010 |
$12,526 |
10/24 |
$12,714 |
$11,058 |
$12,730 |
$12,222 |
11/24 |
$12,872 |
$11,175 |
$12,897 |
$12,385 |
12/24 |
$12,655 |
$10,992 |
$12,676 |
$12,146 |
01/25 |
$12,731 |
$11,051 |
$12,762 |
$12,213 |
02/25 |
$12,958 |
$11,294 |
$12,996 |
$12,462 |
03/25 |
$12,909 |
$11,298 |
$12,943 |
$12,426 |
04/25 |
$12,902 |
$11,343 |
$12,940 |
$12,422 |
05/25 |
$12,924 |
$11,261 |
$12,971 |
$12,420 |
06/25 |
$13,173 |
$11,435 |
$13,213 |
$12,653 |
07/25 |
$13,182 |
$11,404 |
$13,228 |
$12,661 |
08/25 |
$13,306 |
$11,541 |
$13,367 |
$12,789 |
09/25 |
$13,485 |
$11,667 |
$13,553 |
$12,981 |
10/25 |
$13,537 |
$11,740 |
$13,601 |
$13,031 |
11/25 |
$13,617 |
$11,813 |
$13,687 |
$13,116 |
12/25 |
$13,582 |
$11,795 |
$13,677 |
$13,090 |
01/26 |
$13,620 |
$11,808 |
$13,708 |
$13,113 |
02/26 |
$13,771 |
$12,001 |
$13,862 |
$13,282 |
03/26 |
$13,529 |
$11,789 |
$13,604 |
$13,020 |
04/26 |
$13,610 |
$11,803 |
$13,691 |
$13,078 |
|
| Average Annual Return [Table Text Block] |
Table Summary
Average Annual Total Returns (%) |
1 year |
5 years |
10 years |
Institutional Class |
5.49 |
1.01 |
3.13 |
Bloomberg U.S. Aggregate Bond Index |
4.06 |
0.18 |
1.67 |
Blended Benchmark - 85% Bloomberg U.S. Corporate Bond Index, 15% ICE BofA U.S. Cash Pay High Yield Constrained Index |
5.80 |
1.19 |
3.19 |
Bloomberg U.S. Corporate Bond Index |
5.29 |
0.63 |
2.72 | |
| No Deduction of Taxes [Text Block] |
Performance does not reflect the deduction of taxes that a shareholder may pay on fund distributions or on the redemptions of fund shares.
|
| Updated Performance Information Location [Text Block] |
columbiathreadneedleus.com/investment-products/mutual-funds
|
| AssetsNet |
$ 1,906,268,582
|
| Holdings Count | Holding |
739
|
| Advisory Fees Paid, Amount |
$ 9,091,622
|
| InvestmentCompanyPortfolioTurnover |
105.00%
|
| Additional Fund Statistics [Text Block] |
Table Summary
Fund net assets |
$1,906,268,582 |
Total number of portfolio holdings |
739 |
Management services fees (represents 0.49% of Fund average net assets) |
$9,091,622 |
Portfolio turnover for the reporting period |
105% | |
| Holdings [Text Block] |
Table Summary
Corporate Bonds & Notes |
88.8% |
Money Market Funds |
6.5% |
U.S. Treasury Obligations |
3.7% |
Other |
0.3% | |
| Largest Holdings [Text Block] |
Table Summary
JPMorgan Chase & Co. 4.622% 04/23/2032 |
2.1% |
Principal Life Global Funding II 4.950% 11/27/2029 |
1.9% |
U.S. Treasury 4.875% 08/15/2045 |
1.8% |
Bacardi Ltd./Bacardi-Martini BV 5.400% 06/15/2033 |
1.6% |
Bank of America Corp. 1.922% 10/24/2031 |
1.2% |
ERAC USA Finance LLC 4.600% 05/01/2028 |
1.2% |
BAE Systems PLC 1.900% 02/15/2031 |
1.1% |
Merck & Co., Inc. 4.750% 12/04/2035 |
1.1% |
Morgan Stanley 5.900% 03/13/2047 |
1.1% |
AT&T, Inc. 3.800% 12/01/2057 |
1.0% | |
| Material Fund Change [Text Block] |
This is a summary of the changes to the Fund. For more complete information, you may review the Fund’s prospectus, which is available at columbiathreadneedleus.com/resources/literature or upon request at 1-800-345-6611. On September 1, 2025, the Fund's name was changed to Columbia Select Corporate Income Fund from Columbia Corporate Income Fund. |
| Material Fund Change Name [Text Block] |
On September 1, 2025, the Fund's name was changed to Columbia Select Corporate Income Fund from Columbia Corporate Income Fund.
|
| Summary of Change Legend [Text Block] |
This is a summary of the changes to the Fund. For more complete information, you may review the Fund’s prospectus, which is available at columbiathreadneedleus.com/resources/literature or upon request at 1-800-345-6611.
|
| Updated Prospectus Phone Number |
1-800-345-6611
|
| Updated Prospectus Web Address |
columbiathreadneedleus.com/resources/literature
|
| C000033005 |
|
| Shareholder Report [Line Items] |
|
| Fund Name |
Columbia Small Cap Value Discovery Fund
|
| Class Name |
Class A
|
| Trading Symbol |
CSMIX
|
| Annual or Semi-Annual Statement [Text Block] |
This annual shareholder report contains important information about Columbia Small Cap Value Discovery Fund (the Fund) for the period of May 1, 2025 to April 30, 2026.
|
| Additional Information [Text Block] |
You can find additional information about the Fund at columbiathreadneedleus.com/resources/literature. You can also request more information by contacting us at 1-800-345-6611.
|
| Material Fund Change Notice [Text Block] |
This report describes changes to the Fund that occurred during the reporting period.
|
| Additional Information Phone Number |
1-800-345-6611
|
| Additional Information Website |
columbiathreadneedleus.com/resources/literature
|
| Expenses [Text Block] |
What were the Fund costs for the reporting period? (Based on a hypothetical $10,000 investment)
Table Summary
Class |
Cost of a $10,000 investment |
Cost paid as a percentage of a $10,000 investment |
Class A |
$145 |
1.19% | |
| Expenses Paid, Amount |
$ 145
|
| Expense Ratio, Percent |
1.19%
|
| Factors Affecting Performance [Text Block] |
Management's Discussion of Fund Performance The performance of Class A shares for the period presented is shown in the Average Annual Total Returns table. Top Performance ContributorsStock selection | Selections in the energy, materials and consumer discretionary sectors boosted the Fund’s relative performance during the annual period. Allocations | Smaller allocations to the financials and utilities sectors and a larger allocation to the materials sector buoyed the Fund’s relative performance during the annual period. Individual holdings | Positions in PACS Group, a post-acute healthcare operator; MP Materials, a rare earth materials company; uniQure, a gene therapy developer; Celcuity, a cancer-focused biotech company; and Olema Pharmaceuticals, another cancer-focused biotech company, were among the top contributors to the Fund’s relative performance. Top Performance DetractorsStock selection | Selections in the information technology, communication services and consumer staples sectors hurt the Fund’s relative performance during the annual period. Allocations | Larger weightings in the consumer discretionary and consumer staples sectors and a smaller allocation to the energy sector detracted from the Fund’s relative performance. Individual holdings | Positions in Everforth, an IT solutions company; KinderCare Learning, an early childhood education company; and Perrigo, an over-the-counter pharmaceutical manufacturer, were among the top detractors from the Fund’s relative performance. Zero weights in TTM Technologies, an electronic components manufacturer; and EchoStar, a telecom company with a right to acquire an ownership stake in SpaceX, were also among the top detractors from relative performance. |
| Performance Past Does Not Indicate Future [Text] |
The Fund's past performance is not a good predictor of the Fund's future performance.
|
| Line Graph [Table Text Block] |

Table Summary
|
Columbia Small Cap Value Discovery Fund Class A (including sales charges) ($28,017) |
Russell 3000® Index ($39,601) |
Russell 2000® Value Index ($26,880) |
04/16 |
$9,424 |
$10,000 |
$10,000 |
05/16 |
$9,482 |
$10,179 |
$10,183 |
06/16 |
$9,273 |
$10,200 |
$10,214 |
07/16 |
$9,846 |
$10,605 |
$10,765 |
08/16 |
$10,242 |
$10,632 |
$11,033 |
09/16 |
$10,350 |
$10,648 |
$11,120 |
10/16 |
$9,887 |
$10,418 |
$10,754 |
11/16 |
$11,309 |
$10,884 |
$12,182 |
12/16 |
$11,782 |
$11,097 |
$12,685 |
01/17 |
$11,782 |
$11,305 |
$12,594 |
02/17 |
$11,931 |
$11,726 |
$12,777 |
03/17 |
$11,899 |
$11,734 |
$12,668 |
04/17 |
$11,876 |
$11,858 |
$12,718 |
05/17 |
$11,560 |
$11,980 |
$12,322 |
06/17 |
$12,094 |
$12,088 |
$12,753 |
07/17 |
$12,336 |
$12,316 |
$12,834 |
08/17 |
$12,060 |
$12,339 |
$12,518 |
09/17 |
$13,024 |
$12,640 |
$13,405 |
10/17 |
$13,107 |
$12,916 |
$13,422 |
11/17 |
$13,529 |
$13,308 |
$13,811 |
12/17 |
$13,421 |
$13,441 |
$13,679 |
01/18 |
$13,540 |
$14,150 |
$13,848 |
02/18 |
$12,801 |
$13,628 |
$13,155 |
03/18 |
$12,846 |
$13,355 |
$13,318 |
04/18 |
$13,068 |
$13,406 |
$13,549 |
05/18 |
$13,745 |
$13,784 |
$14,337 |
06/18 |
$13,883 |
$13,874 |
$14,424 |
07/18 |
$14,008 |
$14,335 |
$14,678 |
08/18 |
$14,293 |
$14,838 |
$15,028 |
09/18 |
$13,752 |
$14,863 |
$14,655 |
10/18 |
$12,416 |
$13,768 |
$13,343 |
11/18 |
$12,557 |
$14,044 |
$13,558 |
12/18 |
$10,963 |
$12,737 |
$11,919 |
01/19 |
$12,349 |
$13,830 |
$13,223 |
02/19 |
$12,819 |
$14,316 |
$13,737 |
03/19 |
$12,321 |
$14,526 |
$13,341 |
04/19 |
$12,757 |
$15,106 |
$13,846 |
05/19 |
$11,489 |
$14,128 |
$12,715 |
06/19 |
$12,346 |
$15,120 |
$13,524 |
07/19 |
$12,382 |
$15,345 |
$13,546 |
08/19 |
$11,395 |
$15,032 |
$12,790 |
09/19 |
$12,131 |
$15,296 |
$13,447 |
10/19 |
$12,300 |
$15,625 |
$13,773 |
11/19 |
$12,684 |
$16,219 |
$14,095 |
12/19 |
$13,260 |
$16,688 |
$14,589 |
01/20 |
$12,377 |
$16,669 |
$13,802 |
02/20 |
$11,096 |
$15,305 |
$12,461 |
03/20 |
$8,479 |
$13,200 |
$9,386 |
04/20 |
$9,735 |
$14,948 |
$10,544 |
05/20 |
$10,126 |
$15,748 |
$10,847 |
06/20 |
$10,458 |
$16,108 |
$11,161 |
07/20 |
$10,502 |
$17,022 |
$11,391 |
08/20 |
$11,194 |
$18,255 |
$12,005 |
09/20 |
$10,716 |
$17,591 |
$11,446 |
10/20 |
$11,147 |
$17,211 |
$11,855 |
11/20 |
$13,289 |
$19,305 |
$14,144 |
12/20 |
$14,298 |
$20,173 |
$15,265 |
01/21 |
$14,669 |
$20,084 |
$16,068 |
02/21 |
$16,562 |
$20,711 |
$17,577 |
03/21 |
$17,453 |
$21,454 |
$18,496 |
04/21 |
$17,941 |
$22,560 |
$18,870 |
05/21 |
$18,574 |
$22,663 |
$19,457 |
06/21 |
$18,102 |
$23,222 |
$19,339 |
07/21 |
$17,607 |
$23,614 |
$18,647 |
08/21 |
$18,000 |
$24,288 |
$19,146 |
09/21 |
$17,804 |
$23,198 |
$18,763 |
10/21 |
$18,386 |
$24,767 |
$19,478 |
11/21 |
$17,747 |
$24,390 |
$18,813 |
12/21 |
$18,409 |
$25,350 |
$19,580 |
01/22 |
$17,655 |
$23,859 |
$18,438 |
02/22 |
$18,063 |
$23,258 |
$18,744 |
03/22 |
$18,080 |
$24,012 |
$19,110 |
04/22 |
$16,875 |
$21,857 |
$17,627 |
05/22 |
$17,156 |
$21,828 |
$17,966 |
06/22 |
$15,435 |
$20,002 |
$16,191 |
07/22 |
$16,955 |
$21,878 |
$17,758 |
08/22 |
$16,539 |
$21,062 |
$17,197 |
09/22 |
$14,940 |
$19,109 |
$15,444 |
10/22 |
$16,740 |
$20,676 |
$17,389 |
11/22 |
$17,489 |
$21,755 |
$17,920 |
12/22 |
$16,785 |
$20,481 |
$16,744 |
01/23 |
$18,617 |
$21,892 |
$18,342 |
02/23 |
$18,265 |
$21,380 |
$17,919 |
03/23 |
$17,061 |
$21,952 |
$16,634 |
04/23 |
$16,723 |
$22,186 |
$16,219 |
05/23 |
$16,376 |
$22,272 |
$15,900 |
06/23 |
$18,069 |
$23,793 |
$17,163 |
07/23 |
$19,263 |
$24,646 |
$18,459 |
08/23 |
$18,811 |
$24,170 |
$17,571 |
09/23 |
$17,733 |
$23,019 |
$16,656 |
10/23 |
$16,687 |
$22,408 |
$15,662 |
11/23 |
$18,154 |
$24,498 |
$17,072 |
12/23 |
$20,370 |
$25,797 |
$19,197 |
01/24 |
$19,523 |
$26,083 |
$18,325 |
02/24 |
$20,104 |
$27,495 |
$18,924 |
03/24 |
$21,170 |
$28,382 |
$19,754 |
04/24 |
$19,790 |
$27,133 |
$18,495 |
05/24 |
$20,903 |
$28,415 |
$19,360 |
06/24 |
$20,175 |
$29,295 |
$19,034 |
07/24 |
$22,088 |
$29,839 |
$21,353 |
08/24 |
$21,535 |
$30,489 |
$20,952 |
09/24 |
$21,679 |
$31,120 |
$20,966 |
10/24 |
$21,321 |
$30,891 |
$20,638 |
11/24 |
$23,721 |
$32,946 |
$22,628 |
12/24 |
$22,130 |
$31,939 |
$20,743 |
01/25 |
$22,746 |
$32,947 |
$21,169 |
02/25 |
$21,524 |
$32,316 |
$20,359 |
03/25 |
$20,414 |
$30,431 |
$19,137 |
04/25 |
$19,589 |
$30,227 |
$18,368 |
05/25 |
$20,714 |
$32,143 |
$19,140 |
06/25 |
$21,661 |
$33,776 |
$20,087 |
07/25 |
$22,009 |
$34,520 |
$20,442 |
08/25 |
$23,867 |
$35,318 |
$22,173 |
09/25 |
$24,335 |
$36,537 |
$22,619 |
10/25 |
$24,167 |
$37,320 |
$22,676 |
11/25 |
$25,004 |
$37,423 |
$23,313 |
12/25 |
$25,362 |
$37,415 |
$23,355 |
01/26 |
$26,666 |
$37,996 |
$24,957 |
02/26 |
$26,865 |
$37,815 |
$25,438 |
03/26 |
$25,531 |
$35,935 |
$24,513 |
04/26 |
$28,017 |
$39,601 |
$26,880 |
|
| Average Annual Return [Table Text Block] |
Table Summary
Average Annual Total Returns (%) |
1 year |
5 years |
10 years |
Class A (excluding sales charges) |
43.03 |
9.32 |
11.51 |
Class A (including sales charges) |
34.79 |
8.04 |
10.85 |
Russell 3000® Index |
31.01 |
11.91 |
14.75 |
Russell 2000® Value Index |
46.34 |
7.33 |
10.39 | |
| No Deduction of Taxes [Text Block] |
Performance does not reflect the deduction of taxes that a shareholder may pay on fund distributions or on the redemptions of fund shares.
|
| Updated Performance Information Location [Text Block] |
columbiathreadneedleus.com/investment-products/mutual-funds
|
| AssetsNet |
$ 2,211,976,094
|
| Holdings Count | Holding |
228
|
| Advisory Fees Paid, Amount |
$ 14,484,082
|
| InvestmentCompanyPortfolioTurnover |
67.00%
|
| Additional Fund Statistics [Text Block] |
Table Summary
Fund net assets |
$2,211,976,094 |
Total number of portfolio holdings |
228 |
Management services fees (represents 0.79% of Fund average net assets) |
$14,484,082 |
Portfolio turnover for the reporting period |
67% | |
| Holdings [Text Block] |
Table Summary
Financials |
18.0% |
Industrials |
17.1% |
Real Estate |
13.6% |
Consumer Discretionary |
11.5% |
Health Care |
8.3% |
Energy |
8.2% |
Materials |
7.7% |
Information Technology |
6.6% |
Consumer Staples |
4.1% |
Communication Services |
2.2% |
Other |
1.3% |
Table Summary
Common Stocks |
98.6% |
Other |
1.3% | |
| Largest Holdings [Text Block] |
Table Summary
Littelfuse, Inc. |
1.2% |
Knight-Swift Transportation Holdings, Inc. |
1.1% |
Meritage Homes Corp. |
1.1% |
National Fuel Gas Co. |
1.0% |
ArcBest Corp. |
1.0% |
Rayonier, Inc. |
1.0% |
Kite Realty Group Trust |
1.0% |
Vishay Intertechnology, Inc. |
1.0% |
UFP Industries, Inc. |
1.0% |
Polaris, Inc. |
1.0% | |
| Material Fund Change [Text Block] |
This is a summary of the changes to the Fund. For more complete information, you may review the Fund’s prospectus, which is available at columbiathreadneedleus.com/resources/literature or upon request at 1-800-345-6611. Effective September 1, 2025, the Fund's name was changed from Columbia Small Cap Value Fund I to Columbia Small Cap Value Discovery Fund. |
| Material Fund Change Name [Text Block] |
Effective September 1, 2025, the Fund's name was changed from Columbia Small Cap Value Fund I to Columbia Small Cap Value Discovery Fund.
|
| Summary of Change Legend [Text Block] |
This is a summary of the changes to the Fund. For more complete information, you may review the Fund’s prospectus, which is available at columbiathreadneedleus.com/resources/literature or upon request at 1-800-345-6611.
|
| Updated Prospectus Phone Number |
1-800-345-6611
|
| Updated Prospectus Web Address |
columbiathreadneedleus.com/resources/literature
|
| C000033007 |
|
| Shareholder Report [Line Items] |
|
| Fund Name |
Columbia Small Cap Value Discovery Fund
|
| Class Name |
Class C
|
| Trading Symbol |
CSSCX
|
| Annual or Semi-Annual Statement [Text Block] |
This annual shareholder report contains important information about Columbia Small Cap Value Discovery Fund (the Fund) for the period of May 1, 2025 to April 30, 2026.
|
| Additional Information [Text Block] |
You can find additional information about the Fund at columbiathreadneedleus.com/resources/literature. You can also request more information by contacting us at 1-800-345-6611.
|
| Material Fund Change Notice [Text Block] |
This report describes changes to the Fund that occurred during the reporting period.
|
| Additional Information Phone Number |
1-800-345-6611
|
| Additional Information Website |
columbiathreadneedleus.com/resources/literature
|
| Expenses [Text Block] |
What were the Fund costs for the reporting period? (Based on a hypothetical $10,000 investment)
Table Summary
Class |
Cost of a $10,000 investment |
Cost paid as a percentage of a $10,000 investment |
Class C |
$235 |
1.94% | |
| Expenses Paid, Amount |
$ 235
|
| Expense Ratio, Percent |
1.94%
|
| Factors Affecting Performance [Text Block] |
Management's Discussion of Fund Performance The performance of Class C shares for the period presented is shown in the Average Annual Total Returns table. Top Performance ContributorsStock selection | Selections in the energy, materials and consumer discretionary sectors boosted the Fund’s relative performance during the annual period. Allocations | Smaller allocations to the financials and utilities sectors and a larger allocation to the materials sector buoyed the Fund’s relative performance during the annual period. Individual holdings | Positions in PACS Group, a post-acute healthcare operator; MP Materials, a rare earth materials company; uniQure, a gene therapy developer; Celcuity, a cancer-focused biotech company; and Olema Pharmaceuticals, another cancer-focused biotech company, were among the top contributors to the Fund’s relative performance. Top Performance DetractorsStock selection | Selections in the information technology, communication services and consumer staples sectors hurt the Fund’s relative performance during the annual period. Allocations | Larger weightings in the consumer discretionary and consumer staples sectors and a smaller allocation to the energy sector detracted from the Fund’s relative performance. Individual holdings | Positions in Everforth, an IT solutions company; KinderCare Learning, an early childhood education company; and Perrigo, an over-the-counter pharmaceutical manufacturer, were among the top detractors from the Fund’s relative performance. Zero weights in TTM Technologies, an electronic components manufacturer; and EchoStar, a telecom company with a right to acquire an ownership stake in SpaceX, were also among the top detractors from relative performance. |
| Performance Past Does Not Indicate Future [Text] |
The Fund's past performance is not a good predictor of the Fund's future performance.
|
| Line Graph [Table Text Block] |

Table Summary
|
Columbia Small Cap Value Discovery Fund Class C (including sales charges) ($27,572) |
Russell 3000® Index ($39,601) |
Russell 2000® Value Index ($26,880) |
04/16 |
$10,000 |
$10,000 |
$10,000 |
05/16 |
$10,053 |
$10,179 |
$10,183 |
06/16 |
$9,825 |
$10,200 |
$10,214 |
07/16 |
$10,427 |
$10,605 |
$10,765 |
08/16 |
$10,840 |
$10,632 |
$11,033 |
09/16 |
$10,945 |
$10,648 |
$11,120 |
10/16 |
$10,451 |
$10,418 |
$10,754 |
11/16 |
$11,948 |
$10,884 |
$12,182 |
12/16 |
$12,438 |
$11,097 |
$12,685 |
01/17 |
$12,429 |
$11,305 |
$12,594 |
02/17 |
$12,580 |
$11,726 |
$12,777 |
03/17 |
$12,538 |
$11,734 |
$12,668 |
04/17 |
$12,505 |
$11,858 |
$12,718 |
05/17 |
$12,161 |
$11,980 |
$12,322 |
06/17 |
$12,719 |
$12,088 |
$12,753 |
07/17 |
$12,964 |
$12,316 |
$12,834 |
08/17 |
$12,669 |
$12,339 |
$12,518 |
09/17 |
$13,672 |
$12,640 |
$13,405 |
10/17 |
$13,750 |
$12,916 |
$13,422 |
11/17 |
$14,180 |
$13,308 |
$13,811 |
12/17 |
$14,062 |
$13,441 |
$13,679 |
01/18 |
$14,176 |
$14,150 |
$13,848 |
02/18 |
$13,397 |
$13,628 |
$13,155 |
03/18 |
$13,432 |
$13,355 |
$13,318 |
04/18 |
$13,660 |
$13,406 |
$13,549 |
05/18 |
$14,354 |
$13,784 |
$14,337 |
06/18 |
$14,487 |
$13,874 |
$14,424 |
07/18 |
$14,610 |
$14,335 |
$14,678 |
08/18 |
$14,897 |
$14,838 |
$15,028 |
09/18 |
$14,323 |
$14,863 |
$14,655 |
10/18 |
$12,925 |
$13,768 |
$13,343 |
11/18 |
$13,063 |
$14,044 |
$13,558 |
12/18 |
$11,400 |
$12,737 |
$11,919 |
01/19 |
$12,833 |
$13,830 |
$13,223 |
02/19 |
$13,313 |
$14,316 |
$13,737 |
03/19 |
$12,789 |
$14,526 |
$13,341 |
04/19 |
$13,229 |
$15,106 |
$13,846 |
05/19 |
$11,908 |
$14,128 |
$12,715 |
06/19 |
$12,790 |
$15,120 |
$13,524 |
07/19 |
$12,819 |
$15,345 |
$13,546 |
08/19 |
$11,790 |
$15,032 |
$12,790 |
09/19 |
$12,544 |
$15,296 |
$13,447 |
10/19 |
$12,708 |
$15,625 |
$13,773 |
11/19 |
$13,094 |
$16,219 |
$14,095 |
12/19 |
$13,683 |
$16,688 |
$14,589 |
01/20 |
$12,766 |
$16,669 |
$13,802 |
02/20 |
$11,438 |
$15,305 |
$12,461 |
03/20 |
$8,736 |
$13,200 |
$9,386 |
04/20 |
$10,023 |
$14,948 |
$10,544 |
05/20 |
$10,416 |
$15,748 |
$10,847 |
06/20 |
$10,752 |
$16,108 |
$11,161 |
07/20 |
$10,787 |
$17,022 |
$11,391 |
08/20 |
$11,493 |
$18,255 |
$12,005 |
09/20 |
$10,993 |
$17,591 |
$11,446 |
10/20 |
$11,428 |
$17,211 |
$11,855 |
11/20 |
$13,617 |
$19,305 |
$14,144 |
12/20 |
$14,641 |
$20,173 |
$15,265 |
01/21 |
$15,018 |
$20,084 |
$16,068 |
02/21 |
$16,942 |
$20,711 |
$17,577 |
03/21 |
$17,843 |
$21,454 |
$18,496 |
04/21 |
$18,331 |
$22,560 |
$18,870 |
05/21 |
$18,967 |
$22,663 |
$19,457 |
06/21 |
$18,471 |
$23,222 |
$19,339 |
07/21 |
$17,952 |
$23,614 |
$18,647 |
08/21 |
$18,340 |
$24,288 |
$19,146 |
09/21 |
$18,133 |
$23,198 |
$18,763 |
10/21 |
$18,715 |
$24,767 |
$19,478 |
11/21 |
$18,052 |
$24,390 |
$18,813 |
12/21 |
$18,714 |
$25,350 |
$19,580 |
01/22 |
$17,934 |
$23,859 |
$18,438 |
02/22 |
$18,338 |
$23,258 |
$18,744 |
03/22 |
$18,346 |
$24,012 |
$19,110 |
04/22 |
$17,111 |
$21,857 |
$17,627 |
05/22 |
$17,385 |
$21,828 |
$17,966 |
06/22 |
$15,631 |
$20,002 |
$16,191 |
07/22 |
$17,155 |
$21,878 |
$17,758 |
08/22 |
$16,730 |
$21,062 |
$17,197 |
09/22 |
$15,101 |
$19,109 |
$15,444 |
10/22 |
$16,906 |
$20,676 |
$17,389 |
11/22 |
$17,653 |
$21,755 |
$17,920 |
12/22 |
$16,930 |
$20,481 |
$16,744 |
01/23 |
$18,768 |
$21,892 |
$18,342 |
02/23 |
$18,407 |
$21,380 |
$17,919 |
03/23 |
$17,179 |
$21,952 |
$16,634 |
04/23 |
$16,834 |
$22,186 |
$16,219 |
05/23 |
$16,465 |
$22,272 |
$15,900 |
06/23 |
$18,163 |
$23,793 |
$17,163 |
07/23 |
$19,346 |
$24,646 |
$18,459 |
08/23 |
$18,883 |
$24,170 |
$17,571 |
09/23 |
$17,790 |
$23,019 |
$16,656 |
10/23 |
$16,730 |
$22,408 |
$15,662 |
11/23 |
$18,187 |
$24,498 |
$17,072 |
12/23 |
$20,401 |
$25,797 |
$19,197 |
01/24 |
$19,534 |
$26,083 |
$18,325 |
02/24 |
$20,105 |
$27,495 |
$18,924 |
03/24 |
$21,157 |
$28,382 |
$19,754 |
04/24 |
$19,764 |
$27,133 |
$18,495 |
05/24 |
$20,862 |
$28,415 |
$19,360 |
06/24 |
$20,124 |
$29,295 |
$19,034 |
07/24 |
$22,020 |
$29,839 |
$21,353 |
08/24 |
$21,455 |
$30,489 |
$20,952 |
09/24 |
$21,586 |
$31,120 |
$20,966 |
10/24 |
$21,213 |
$30,891 |
$20,638 |
11/24 |
$23,584 |
$32,946 |
$22,628 |
12/24 |
$21,998 |
$31,939 |
$20,743 |
01/25 |
$22,584 |
$32,947 |
$21,169 |
02/25 |
$21,360 |
$32,316 |
$20,359 |
03/25 |
$20,252 |
$30,431 |
$19,137 |
04/25 |
$19,416 |
$30,227 |
$18,368 |
05/25 |
$20,524 |
$32,143 |
$19,140 |
06/25 |
$21,445 |
$33,776 |
$20,087 |
07/25 |
$21,780 |
$34,520 |
$20,442 |
08/25 |
$23,596 |
$35,318 |
$22,173 |
09/25 |
$24,052 |
$36,537 |
$22,619 |
10/25 |
$23,863 |
$37,320 |
$22,676 |
11/25 |
$24,676 |
$37,423 |
$23,313 |
12/25 |
$25,013 |
$37,415 |
$23,355 |
01/26 |
$26,285 |
$37,996 |
$24,957 |
02/26 |
$26,467 |
$37,815 |
$25,438 |
03/26 |
$25,139 |
$35,935 |
$24,513 |
04/26 |
$27,572 |
$39,601 |
$26,880 |
|
| Average Annual Return [Table Text Block] |
Table Summary
Average Annual Total Returns (%) |
1 year |
5 years |
10 years |
Class C (excluding sales charges) |
42.01 |
8.51 |
10.67 |
Class C (including sales charges) |
41.01 |
8.51 |
10.67 |
Russell 3000® Index |
31.01 |
11.91 |
14.75 |
Russell 2000® Value Index |
46.34 |
7.33 |
10.39 | |
| No Deduction of Taxes [Text Block] |
Performance does not reflect the deduction of taxes that a shareholder may pay on fund distributions or on the redemptions of fund shares.
|
| Updated Performance Information Location [Text Block] |
columbiathreadneedleus.com/investment-products/mutual-funds
|
| AssetsNet |
$ 2,211,976,094
|
| Holdings Count | Holding |
228
|
| Advisory Fees Paid, Amount |
$ 14,484,082
|
| InvestmentCompanyPortfolioTurnover |
67.00%
|
| Additional Fund Statistics [Text Block] |
Table Summary
Fund net assets |
$2,211,976,094 |
Total number of portfolio holdings |
228 |
Management services fees (represents 0.79% of Fund average net assets) |
$14,484,082 |
Portfolio turnover for the reporting period |
67% | |
| Holdings [Text Block] |
Table Summary
Financials |
18.0% |
Industrials |
17.1% |
Real Estate |
13.6% |
Consumer Discretionary |
11.5% |
Health Care |
8.3% |
Energy |
8.2% |
Materials |
7.7% |
Information Technology |
6.6% |
Consumer Staples |
4.1% |
Communication Services |
2.2% |
Other |
1.3% |
Table Summary
Common Stocks |
98.6% |
Other |
1.3% | |
| Largest Holdings [Text Block] |
Table Summary
Littelfuse, Inc. |
1.2% |
Knight-Swift Transportation Holdings, Inc. |
1.1% |
Meritage Homes Corp. |
1.1% |
National Fuel Gas Co. |
1.0% |
ArcBest Corp. |
1.0% |
Rayonier, Inc. |
1.0% |
Kite Realty Group Trust |
1.0% |
Vishay Intertechnology, Inc. |
1.0% |
UFP Industries, Inc. |
1.0% |
Polaris, Inc. |
1.0% | |
| Material Fund Change [Text Block] |
This is a summary of the changes to the Fund. For more complete information, you may review the Fund’s prospectus, which is available at columbiathreadneedleus.com/resources/literature or upon request at 1-800-345-6611. Effective September 1, 2025, the Fund's name was changed from Columbia Small Cap Value Fund I to Columbia Small Cap Value Discovery Fund. |
| Material Fund Change Name [Text Block] |
Effective September 1, 2025, the Fund's name was changed from Columbia Small Cap Value Fund I to Columbia Small Cap Value Discovery Fund.
|
| Summary of Change Legend [Text Block] |
This is a summary of the changes to the Fund. For more complete information, you may review the Fund’s prospectus, which is available at columbiathreadneedleus.com/resources/literature or upon request at 1-800-345-6611.
|
| Updated Prospectus Phone Number |
1-800-345-6611
|
| Updated Prospectus Web Address |
columbiathreadneedleus.com/resources/literature
|
| C000094701 |
|
| Shareholder Report [Line Items] |
|
| Fund Name |
Columbia Small Cap Value Discovery Fund
|
| Class Name |
Class R
|
| Trading Symbol |
CSVRX
|
| Annual or Semi-Annual Statement [Text Block] |
This annual shareholder report contains important information about Columbia Small Cap Value Discovery Fund (the Fund) for the period of May 1, 2025 to April 30, 2026.
|
| Additional Information [Text Block] |
You can find additional information about the Fund at columbiathreadneedleus.com/resources/literature. You can also request more information by contacting us at 1-800-345-6611.
|
| Material Fund Change Notice [Text Block] |
This report describes changes to the Fund that occurred during the reporting period.
|
| Additional Information Phone Number |
1-800-345-6611
|
| Additional Information Website |
columbiathreadneedleus.com/resources/literature
|
| Expenses [Text Block] |
What were the Fund costs for the reporting period? (Based on a hypothetical $10,000 investment)
Table Summary
Class |
Cost of a $10,000 investment |
Cost paid as a percentage of a $10,000 investment |
Class R |
$175 |
1.44% | |
| Expenses Paid, Amount |
$ 175
|
| Expense Ratio, Percent |
1.44%
|
| Factors Affecting Performance [Text Block] |
Management's Discussion of Fund Performance The performance of Class R shares for the period presented is shown in the Average Annual Total Returns table. Top Performance ContributorsStock selection | Selections in the energy, materials and consumer discretionary sectors boosted the Fund’s relative performance during the annual period. Allocations | Smaller allocations to the financials and utilities sectors and a larger allocation to the materials sector buoyed the Fund’s relative performance during the annual period. Individual holdings | Positions in PACS Group, a post-acute healthcare operator; MP Materials, a rare earth materials company; uniQure, a gene therapy developer; Celcuity, a cancer-focused biotech company; and Olema Pharmaceuticals, another cancer-focused biotech company, were among the top contributors to the Fund’s relative performance. Top Performance DetractorsStock selection | Selections in the information technology, communication services and consumer staples sectors hurt the Fund’s relative performance during the annual period. Allocations | Larger weightings in the consumer discretionary and consumer staples sectors and a smaller allocation to the energy sector detracted from the Fund’s relative performance. Individual holdings | Positions in Everforth, an IT solutions company; KinderCare Learning, an early childhood education company; and Perrigo, an over-the-counter pharmaceutical manufacturer, were among the top detractors from the Fund’s relative performance. Zero weights in TTM Technologies, an electronic components manufacturer; and EchoStar, a telecom company with a right to acquire an ownership stake in SpaceX, were also among the top detractors from relative performance. |
| Performance Past Does Not Indicate Future [Text] |
The Fund's past performance is not a good predictor of the Fund's future performance.
|
| Line Graph [Table Text Block] |

Table Summary
|
Columbia Small Cap Value Discovery Fund Class R ($28,985) |
Russell 3000® Index ($39,601) |
Russell 2000® Value Index ($26,880) |
04/16 |
$10,000 |
$10,000 |
$10,000 |
05/16 |
$10,059 |
$10,179 |
$10,183 |
06/16 |
$9,834 |
$10,200 |
$10,214 |
07/16 |
$10,442 |
$10,605 |
$10,765 |
08/16 |
$10,859 |
$10,632 |
$11,033 |
09/16 |
$10,970 |
$10,648 |
$11,120 |
10/16 |
$10,479 |
$10,418 |
$10,754 |
11/16 |
$11,984 |
$10,884 |
$12,182 |
12/16 |
$12,480 |
$11,097 |
$12,685 |
01/17 |
$12,477 |
$11,305 |
$12,594 |
02/17 |
$12,634 |
$11,726 |
$12,777 |
03/17 |
$12,598 |
$11,734 |
$12,668 |
04/17 |
$12,571 |
$11,858 |
$12,718 |
05/17 |
$12,230 |
$11,980 |
$12,322 |
06/17 |
$12,795 |
$12,088 |
$12,753 |
07/17 |
$13,045 |
$12,316 |
$12,834 |
08/17 |
$12,753 |
$12,339 |
$12,518 |
09/17 |
$13,770 |
$12,640 |
$13,405 |
10/17 |
$13,857 |
$12,916 |
$13,422 |
11/17 |
$14,298 |
$13,308 |
$13,811 |
12/17 |
$14,179 |
$13,441 |
$13,679 |
01/18 |
$14,305 |
$14,150 |
$13,848 |
02/18 |
$13,523 |
$13,628 |
$13,155 |
03/18 |
$13,564 |
$13,355 |
$13,318 |
04/18 |
$13,799 |
$13,406 |
$13,549 |
05/18 |
$14,509 |
$13,784 |
$14,337 |
06/18 |
$14,651 |
$13,874 |
$14,424 |
07/18 |
$14,779 |
$14,335 |
$14,678 |
08/18 |
$15,078 |
$14,838 |
$15,028 |
09/18 |
$14,502 |
$14,863 |
$14,655 |
10/18 |
$13,091 |
$13,768 |
$13,343 |
11/18 |
$13,237 |
$14,044 |
$13,558 |
12/18 |
$11,554 |
$12,737 |
$11,919 |
01/19 |
$13,015 |
$13,830 |
$13,223 |
02/19 |
$13,508 |
$14,316 |
$13,737 |
03/19 |
$12,978 |
$14,526 |
$13,341 |
04/19 |
$13,431 |
$15,106 |
$13,846 |
05/19 |
$12,095 |
$14,128 |
$12,715 |
06/19 |
$12,994 |
$15,120 |
$13,524 |
07/19 |
$13,031 |
$15,345 |
$13,546 |
08/19 |
$11,988 |
$15,032 |
$12,790 |
09/19 |
$12,762 |
$15,296 |
$13,447 |
10/19 |
$12,937 |
$15,625 |
$13,773 |
11/19 |
$13,335 |
$16,219 |
$14,095 |
12/19 |
$13,942 |
$16,688 |
$14,589 |
01/20 |
$13,011 |
$16,669 |
$13,802 |
02/20 |
$11,660 |
$15,305 |
$12,461 |
03/20 |
$8,912 |
$13,200 |
$9,386 |
04/20 |
$10,225 |
$14,948 |
$10,544 |
05/20 |
$10,633 |
$15,748 |
$10,847 |
06/20 |
$10,981 |
$16,108 |
$11,161 |
07/20 |
$11,023 |
$17,022 |
$11,391 |
08/20 |
$11,752 |
$18,255 |
$12,005 |
09/20 |
$11,244 |
$17,591 |
$11,446 |
10/20 |
$11,691 |
$17,211 |
$11,855 |
11/20 |
$13,938 |
$19,305 |
$14,144 |
12/20 |
$14,994 |
$20,173 |
$15,265 |
01/21 |
$15,381 |
$20,084 |
$16,068 |
02/21 |
$17,357 |
$20,711 |
$17,577 |
03/21 |
$18,292 |
$21,454 |
$18,496 |
04/21 |
$18,798 |
$22,560 |
$18,870 |
05/21 |
$19,456 |
$22,663 |
$19,457 |
06/21 |
$18,957 |
$23,222 |
$19,339 |
07/21 |
$18,436 |
$23,614 |
$18,647 |
08/21 |
$18,842 |
$24,288 |
$19,146 |
09/21 |
$18,635 |
$23,198 |
$18,763 |
10/21 |
$19,240 |
$24,767 |
$19,478 |
11/21 |
$18,568 |
$24,390 |
$18,813 |
12/21 |
$19,256 |
$25,350 |
$19,580 |
01/22 |
$18,462 |
$23,859 |
$18,438 |
02/22 |
$18,887 |
$23,258 |
$18,744 |
03/22 |
$18,900 |
$24,012 |
$19,110 |
04/22 |
$17,638 |
$21,857 |
$17,627 |
05/22 |
$17,924 |
$21,828 |
$17,966 |
06/22 |
$16,123 |
$20,002 |
$16,191 |
07/22 |
$17,708 |
$21,878 |
$17,758 |
08/22 |
$17,270 |
$21,062 |
$17,197 |
09/22 |
$15,598 |
$19,109 |
$15,444 |
10/22 |
$17,468 |
$20,676 |
$17,389 |
11/22 |
$18,247 |
$21,755 |
$17,920 |
12/22 |
$17,515 |
$20,481 |
$16,744 |
01/23 |
$19,420 |
$21,892 |
$18,342 |
02/23 |
$19,051 |
$21,380 |
$17,919 |
03/23 |
$17,791 |
$21,952 |
$16,634 |
04/23 |
$17,436 |
$22,186 |
$16,219 |
05/23 |
$17,067 |
$22,272 |
$15,900 |
06/23 |
$18,828 |
$23,793 |
$17,163 |
07/23 |
$20,067 |
$24,646 |
$18,459 |
08/23 |
$19,593 |
$24,170 |
$17,571 |
09/23 |
$18,466 |
$23,019 |
$16,656 |
10/23 |
$17,372 |
$22,408 |
$15,662 |
11/23 |
$18,893 |
$24,498 |
$17,072 |
12/23 |
$21,200 |
$25,797 |
$19,197 |
01/24 |
$20,317 |
$26,083 |
$18,325 |
02/24 |
$20,916 |
$27,495 |
$18,924 |
03/24 |
$22,019 |
$28,382 |
$19,754 |
04/24 |
$20,576 |
$27,133 |
$18,495 |
05/24 |
$21,734 |
$28,415 |
$19,360 |
06/24 |
$20,971 |
$29,295 |
$19,034 |
07/24 |
$22,956 |
$29,839 |
$21,353 |
08/24 |
$22,371 |
$30,489 |
$20,952 |
09/24 |
$22,522 |
$31,120 |
$20,966 |
10/24 |
$22,141 |
$30,891 |
$20,638 |
11/24 |
$24,627 |
$32,946 |
$22,628 |
12/24 |
$22,975 |
$31,939 |
$20,743 |
01/25 |
$23,605 |
$32,947 |
$21,169 |
02/25 |
$22,335 |
$32,316 |
$20,359 |
03/25 |
$21,178 |
$30,431 |
$19,137 |
04/25 |
$20,319 |
$30,227 |
$18,368 |
05/25 |
$21,482 |
$32,143 |
$19,140 |
06/25 |
$22,458 |
$33,776 |
$20,087 |
07/25 |
$22,816 |
$34,520 |
$20,442 |
08/25 |
$24,733 |
$35,318 |
$22,173 |
09/25 |
$25,212 |
$36,537 |
$22,619 |
10/25 |
$25,036 |
$37,320 |
$22,676 |
11/25 |
$25,895 |
$37,423 |
$23,313 |
12/25 |
$26,263 |
$37,415 |
$23,355 |
01/26 |
$27,608 |
$37,996 |
$24,957 |
02/26 |
$27,810 |
$37,815 |
$25,438 |
03/26 |
$26,422 |
$35,935 |
$24,513 |
04/26 |
$28,985 |
$39,601 |
$26,880 |
|
| Average Annual Return [Table Text Block] |
Table Summary
Average Annual Total Returns (%) |
1 year |
5 years |
10 years |
Class R |
42.64 |
9.05 |
11.23 |
Russell 3000® Index |
31.01 |
11.91 |
14.75 |
Russell 2000® Value Index |
46.34 |
7.33 |
10.39 | |
| No Deduction of Taxes [Text Block] |
Performance does not reflect the deduction of taxes that a shareholder may pay on fund distributions or on the redemptions of fund shares.
|
| Updated Performance Information Location [Text Block] |
columbiathreadneedleus.com/investment-products/mutual-funds
|
| AssetsNet |
$ 2,211,976,094
|
| Holdings Count | Holding |
228
|
| Advisory Fees Paid, Amount |
$ 14,484,082
|
| InvestmentCompanyPortfolioTurnover |
67.00%
|
| Additional Fund Statistics [Text Block] |
Table Summary
Fund net assets |
$2,211,976,094 |
Total number of portfolio holdings |
228 |
Management services fees (represents 0.79% of Fund average net assets) |
$14,484,082 |
Portfolio turnover for the reporting period |
67% | |
| Holdings [Text Block] |
Table Summary
Financials |
18.0% |
Industrials |
17.1% |
Real Estate |
13.6% |
Consumer Discretionary |
11.5% |
Health Care |
8.3% |
Energy |
8.2% |
Materials |
7.7% |
Information Technology |
6.6% |
Consumer Staples |
4.1% |
Communication Services |
2.2% |
Other |
1.3% |
Table Summary
Common Stocks |
98.6% |
Other |
1.3% | |
| Largest Holdings [Text Block] |
Table Summary
Littelfuse, Inc. |
1.2% |
Knight-Swift Transportation Holdings, Inc. |
1.1% |
Meritage Homes Corp. |
1.1% |
National Fuel Gas Co. |
1.0% |
ArcBest Corp. |
1.0% |
Rayonier, Inc. |
1.0% |
Kite Realty Group Trust |
1.0% |
Vishay Intertechnology, Inc. |
1.0% |
UFP Industries, Inc. |
1.0% |
Polaris, Inc. |
1.0% | |
| Material Fund Change [Text Block] |
This is a summary of the changes to the Fund. For more complete information, you may review the Fund’s prospectus, which is available at columbiathreadneedleus.com/resources/literature or upon request at 1-800-345-6611. Effective September 1, 2025, the Fund's name was changed from Columbia Small Cap Value Fund I to Columbia Small Cap Value Discovery Fund. |
| Material Fund Change Name [Text Block] |
Effective September 1, 2025, the Fund's name was changed from Columbia Small Cap Value Fund I to Columbia Small Cap Value Discovery Fund.
|
| Summary of Change Legend [Text Block] |
This is a summary of the changes to the Fund. For more complete information, you may review the Fund’s prospectus, which is available at columbiathreadneedleus.com/resources/literature or upon request at 1-800-345-6611.
|
| Updated Prospectus Phone Number |
1-800-345-6611
|
| Updated Prospectus Web Address |
columbiathreadneedleus.com/resources/literature
|
| C000255093 |
|
| Shareholder Report [Line Items] |
|
| Fund Name |
Columbia Small Cap Value Discovery Fund
|
| Class Name |
Class S
|
| Trading Symbol |
CSCQX
|
| Annual or Semi-Annual Statement [Text Block] |
This annual shareholder report contains important information about Columbia Small Cap Value Discovery Fund (the Fund) for the period of May 1, 2025 to April 30, 2026.
|
| Additional Information [Text Block] |
You can find additional information about the Fund at columbiathreadneedleus.com/resources/literature. You can also request more information by contacting us at 1-800-345-6611.
|
| Material Fund Change Notice [Text Block] |
This report describes changes to the Fund that occurred during the reporting period.
|
| Additional Information Phone Number |
1-800-345-6611
|
| Additional Information Website |
columbiathreadneedleus.com/resources/literature
|
| Expenses [Text Block] |
What were the Fund costs for the reporting period? (Based on a hypothetical $10,000 investment)
Table Summary
Class |
Cost of a $10,000 investment |
Cost paid as a percentage of a $10,000 investment |
Class S |
$114 |
0.94% | |
| Expenses Paid, Amount |
$ 114
|
| Expense Ratio, Percent |
0.94%
|
| Factors Affecting Performance [Text Block] |
Management's Discussion of Fund Performance The performance of Class S shares for the period presented is shown in the Average Annual Total Returns table. Top Performance ContributorsStock selection | Selections in the energy, materials and consumer discretionary sectors boosted the Fund’s relative performance during the annual period. Allocations | Smaller allocations to the financials and utilities sectors and a larger allocation to the materials sector buoyed the Fund’s relative performance during the annual period. Individual holdings | Positions in PACS Group, a post-acute healthcare operator; MP Materials, a rare earth materials company; uniQure, a gene therapy developer; Celcuity, a cancer-focused biotech company; and Olema Pharmaceuticals, another cancer-focused biotech company, were among the top contributors to the Fund’s relative performance. Top Performance DetractorsStock selection | Selections in the information technology, communication services and consumer staples sectors hurt the Fund’s relative performance during the annual period. Allocations | Larger weightings in the consumer discretionary and consumer staples sectors and a smaller allocation to the energy sector detracted from the Fund’s relative performance. Individual holdings | Positions in Everforth, an IT solutions company; KinderCare Learning, an early childhood education company; and Perrigo, an over-the-counter pharmaceutical manufacturer, were among the top detractors from the Fund’s relative performance. Zero weights in TTM Technologies, an electronic components manufacturer; and EchoStar, a telecom company with a right to acquire an ownership stake in SpaceX, were also among the top detractors from relative performance. |
| Performance Past Does Not Indicate Future [Text] |
The Fund's past performance is not a good predictor of the Fund's future performance.
|
| Line Graph [Table Text Block] |
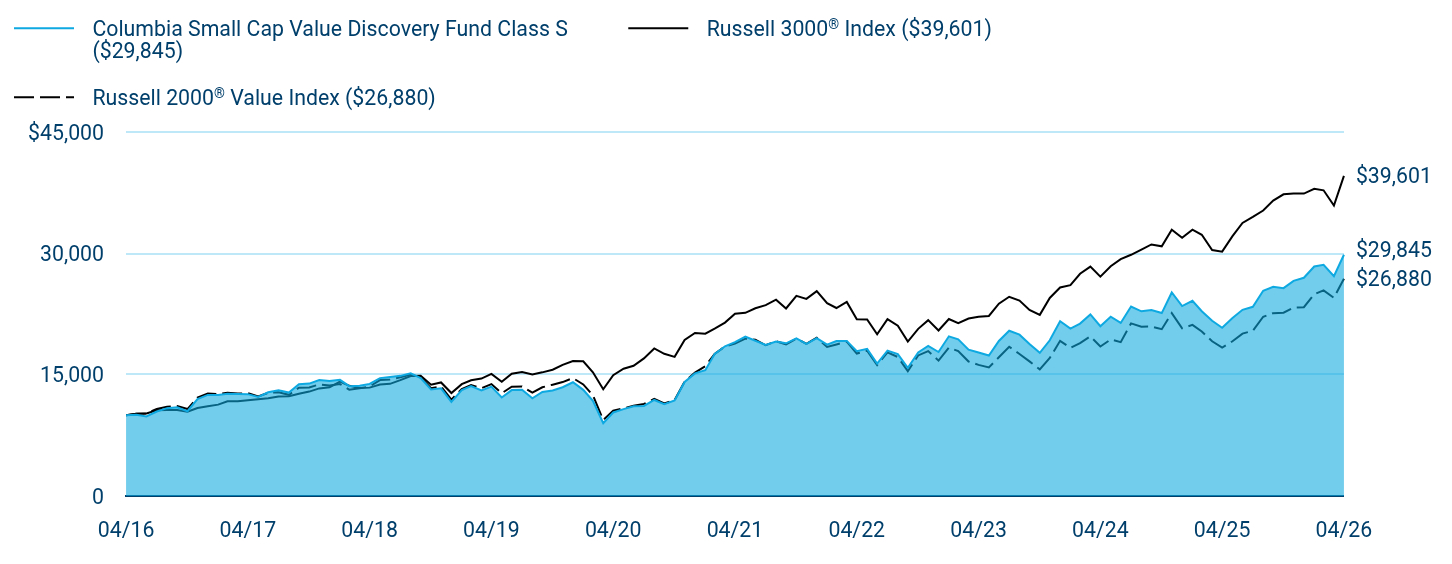
Table Summary
|
Columbia Small Cap Value Discovery Fund Class S ($29,845) |
Russell 3000® Index ($39,601) |
Russell 2000® Value Index ($26,880) |
04/16 |
$10,000 |
$10,000 |
$10,000 |
05/16 |
$10,061 |
$10,179 |
$10,183 |
06/16 |
$9,839 |
$10,200 |
$10,214 |
07/16 |
$10,448 |
$10,605 |
$10,765 |
08/16 |
$10,868 |
$10,632 |
$11,033 |
09/16 |
$10,982 |
$10,648 |
$11,120 |
10/16 |
$10,491 |
$10,418 |
$10,754 |
11/16 |
$12,000 |
$10,884 |
$12,182 |
12/16 |
$12,502 |
$11,097 |
$12,685 |
01/17 |
$12,502 |
$11,305 |
$12,594 |
02/17 |
$12,659 |
$11,726 |
$12,777 |
03/17 |
$12,626 |
$11,734 |
$12,668 |
04/17 |
$12,602 |
$11,858 |
$12,718 |
05/17 |
$12,265 |
$11,980 |
$12,322 |
06/17 |
$12,833 |
$12,088 |
$12,753 |
07/17 |
$13,089 |
$12,316 |
$12,834 |
08/17 |
$12,797 |
$12,339 |
$12,518 |
09/17 |
$13,820 |
$12,640 |
$13,405 |
10/17 |
$13,907 |
$12,916 |
$13,422 |
11/17 |
$14,355 |
$13,308 |
$13,811 |
12/17 |
$14,241 |
$13,441 |
$13,679 |
01/18 |
$14,367 |
$14,150 |
$13,848 |
02/18 |
$13,583 |
$13,628 |
$13,155 |
03/18 |
$13,631 |
$13,355 |
$13,318 |
04/18 |
$13,866 |
$13,406 |
$13,549 |
05/18 |
$14,585 |
$13,784 |
$14,337 |
06/18 |
$14,731 |
$13,874 |
$14,424 |
07/18 |
$14,863 |
$14,335 |
$14,678 |
08/18 |
$15,166 |
$14,838 |
$15,028 |
09/18 |
$14,591 |
$14,863 |
$14,655 |
10/18 |
$13,174 |
$13,768 |
$13,343 |
11/18 |
$13,324 |
$14,044 |
$13,558 |
12/18 |
$11,632 |
$12,737 |
$11,919 |
01/19 |
$13,103 |
$13,830 |
$13,223 |
02/19 |
$13,602 |
$14,316 |
$13,737 |
03/19 |
$13,074 |
$14,526 |
$13,341 |
04/19 |
$13,536 |
$15,106 |
$13,846 |
05/19 |
$12,190 |
$14,128 |
$12,715 |
06/19 |
$13,100 |
$15,120 |
$13,524 |
07/19 |
$13,138 |
$15,345 |
$13,546 |
08/19 |
$12,091 |
$15,032 |
$12,790 |
09/19 |
$12,872 |
$15,296 |
$13,447 |
10/19 |
$13,051 |
$15,625 |
$13,773 |
11/19 |
$13,458 |
$16,219 |
$14,095 |
12/19 |
$14,070 |
$16,688 |
$14,589 |
01/20 |
$13,133 |
$16,669 |
$13,802 |
02/20 |
$11,773 |
$15,305 |
$12,461 |
03/20 |
$8,997 |
$13,200 |
$9,386 |
04/20 |
$10,330 |
$14,948 |
$10,544 |
05/20 |
$10,744 |
$15,748 |
$10,847 |
06/20 |
$11,097 |
$16,108 |
$11,161 |
07/20 |
$11,143 |
$17,022 |
$11,391 |
08/20 |
$11,878 |
$18,255 |
$12,005 |
09/20 |
$11,370 |
$17,591 |
$11,446 |
10/20 |
$11,828 |
$17,211 |
$11,855 |
11/20 |
$14,101 |
$19,305 |
$14,144 |
12/20 |
$15,171 |
$20,173 |
$15,265 |
01/21 |
$15,565 |
$20,084 |
$16,068 |
02/21 |
$17,573 |
$20,711 |
$17,577 |
03/21 |
$18,519 |
$21,454 |
$18,496 |
04/21 |
$19,036 |
$22,560 |
$18,870 |
05/21 |
$19,708 |
$22,663 |
$19,457 |
06/21 |
$19,208 |
$23,222 |
$19,339 |
07/21 |
$18,682 |
$23,614 |
$18,647 |
08/21 |
$19,100 |
$24,288 |
$19,146 |
09/21 |
$18,891 |
$23,198 |
$18,763 |
10/21 |
$19,509 |
$24,767 |
$19,478 |
11/21 |
$18,831 |
$24,390 |
$18,813 |
12/21 |
$19,534 |
$25,350 |
$19,580 |
01/22 |
$18,733 |
$23,859 |
$18,438 |
02/22 |
$19,166 |
$23,258 |
$18,744 |
03/22 |
$19,184 |
$24,012 |
$19,110 |
04/22 |
$17,906 |
$21,857 |
$17,627 |
05/22 |
$18,203 |
$21,828 |
$17,966 |
06/22 |
$16,378 |
$20,002 |
$16,191 |
07/22 |
$17,990 |
$21,878 |
$17,758 |
08/22 |
$17,549 |
$21,062 |
$17,197 |
09/22 |
$15,853 |
$19,109 |
$15,444 |
10/22 |
$17,762 |
$20,676 |
$17,389 |
11/22 |
$18,557 |
$21,755 |
$17,920 |
12/22 |
$17,810 |
$20,481 |
$16,744 |
01/23 |
$19,754 |
$21,892 |
$18,342 |
02/23 |
$19,381 |
$21,380 |
$17,919 |
03/23 |
$18,103 |
$21,952 |
$16,634 |
04/23 |
$17,744 |
$22,186 |
$16,219 |
05/23 |
$17,376 |
$22,272 |
$15,900 |
06/23 |
$19,172 |
$23,793 |
$17,163 |
07/23 |
$20,439 |
$24,646 |
$18,459 |
08/23 |
$19,960 |
$24,170 |
$17,571 |
09/23 |
$18,816 |
$23,019 |
$16,656 |
10/23 |
$17,706 |
$22,408 |
$15,662 |
11/23 |
$19,262 |
$24,498 |
$17,072 |
12/23 |
$21,614 |
$25,797 |
$19,197 |
01/24 |
$20,715 |
$26,083 |
$18,325 |
02/24 |
$21,331 |
$27,495 |
$18,924 |
03/24 |
$22,463 |
$28,382 |
$19,754 |
04/24 |
$20,998 |
$27,133 |
$18,495 |
05/24 |
$22,180 |
$28,415 |
$19,360 |
06/24 |
$21,407 |
$29,295 |
$19,034 |
07/24 |
$23,437 |
$29,839 |
$21,353 |
08/24 |
$22,850 |
$30,489 |
$20,952 |
09/24 |
$23,003 |
$31,120 |
$20,966 |
10/24 |
$22,628 |
$30,891 |
$20,638 |
11/24 |
$25,180 |
$32,946 |
$22,628 |
12/24 |
$23,498 |
$31,939 |
$20,743 |
01/25 |
$24,152 |
$32,947 |
$21,169 |
02/25 |
$22,861 |
$32,316 |
$20,359 |
03/25 |
$21,685 |
$30,431 |
$19,137 |
04/25 |
$20,815 |
$30,227 |
$18,368 |
05/25 |
$22,019 |
$32,143 |
$19,140 |
06/25 |
$23,031 |
$33,776 |
$20,087 |
07/25 |
$23,403 |
$34,520 |
$20,442 |
08/25 |
$25,382 |
$35,318 |
$22,173 |
09/25 |
$25,886 |
$36,537 |
$22,619 |
10/25 |
$25,712 |
$37,320 |
$22,676 |
11/25 |
$26,607 |
$37,423 |
$23,313 |
12/25 |
$26,996 |
$37,415 |
$23,355 |
01/26 |
$28,392 |
$37,996 |
$24,957 |
02/26 |
$28,608 |
$37,815 |
$25,438 |
03/26 |
$27,191 |
$35,935 |
$24,513 |
04/26 |
$29,845 |
$39,601 |
$26,880 |
|
| Average Annual Return [Table Text Block] |
Table Summary
Average Annual Total Returns (%) |
1 year |
5 years |
10 years |
Class SFootnote Reference(a) |
43.39 |
9.41 |
11.55 |
Russell 3000® Index |
31.01 |
11.91 |
14.75 |
Russell 2000® Value Index |
46.34 |
7.33 |
10.39 | |
| No Deduction of Taxes [Text Block] |
Performance does not reflect the deduction of taxes that a shareholder may pay on fund distributions or on the redemptions of fund shares.
|
| Updated Performance Information Location [Text Block] |
columbiathreadneedleus.com/investment-products/mutual-funds
|
| AssetsNet |
$ 2,211,976,094
|
| Holdings Count | Holding |
228
|
| Advisory Fees Paid, Amount |
$ 14,484,082
|
| InvestmentCompanyPortfolioTurnover |
67.00%
|
| Additional Fund Statistics [Text Block] |
Table Summary
Fund net assets |
$2,211,976,094 |
Total number of portfolio holdings |
228 |
Management services fees (represents 0.79% of Fund average net assets) |
$14,484,082 |
Portfolio turnover for the reporting period |
67% | |
| Holdings [Text Block] |
Table Summary
Financials |
18.0% |
Industrials |
17.1% |
Real Estate |
13.6% |
Consumer Discretionary |
11.5% |
Health Care |
8.3% |
Energy |
8.2% |
Materials |
7.7% |
Information Technology |
6.6% |
Consumer Staples |
4.1% |
Communication Services |
2.2% |
Other |
1.3% |
Table Summary
Common Stocks |
98.6% |
Other |
1.3% | |
| Largest Holdings [Text Block] |
Table Summary
Littelfuse, Inc. |
1.2% |
Knight-Swift Transportation Holdings, Inc. |
1.1% |
Meritage Homes Corp. |
1.1% |
National Fuel Gas Co. |
1.0% |
ArcBest Corp. |
1.0% |
Rayonier, Inc. |
1.0% |
Kite Realty Group Trust |
1.0% |
Vishay Intertechnology, Inc. |
1.0% |
UFP Industries, Inc. |
1.0% |
Polaris, Inc. |
1.0% | |
| Material Fund Change [Text Block] |
This is a summary of the changes to the Fund. For more complete information, you may review the Fund’s prospectus, which is available at columbiathreadneedleus.com/resources/literature or upon request at 1-800-345-6611. Effective September 1, 2025, the Fund's name was changed from Columbia Small Cap Value Fund I to Columbia Small Cap Value Discovery Fund. |
| Material Fund Change Name [Text Block] |
Effective September 1, 2025, the Fund's name was changed from Columbia Small Cap Value Fund I to Columbia Small Cap Value Discovery Fund.
|
| Summary of Change Legend [Text Block] |
This is a summary of the changes to the Fund. For more complete information, you may review the Fund’s prospectus, which is available at columbiathreadneedleus.com/resources/literature or upon request at 1-800-345-6611.
|
| Updated Prospectus Phone Number |
1-800-345-6611
|
| Updated Prospectus Web Address |
columbiathreadneedleus.com/resources/literature
|
| C000122683 |
|
| Shareholder Report [Line Items] |
|
| Fund Name |
Columbia Small Cap Value Discovery Fund
|
| Class Name |
Institutional 2 Class
|
| Trading Symbol |
CUURX
|
| Annual or Semi-Annual Statement [Text Block] |
This annual shareholder report contains important information about Columbia Small Cap Value Discovery Fund (the Fund) for the period of May 1, 2025 to April 30, 2026.
|
| Additional Information [Text Block] |
You can find additional information about the Fund at columbiathreadneedleus.com/resources/literature. You can also request more information by contacting us at 1-800-345-6611.
|
| Material Fund Change Notice [Text Block] |
This report describes changes to the Fund that occurred during the reporting period.
|
| Additional Information Phone Number |
1-800-345-6611
|
| Additional Information Website |
columbiathreadneedleus.com/resources/literature
|
| Expenses [Text Block] |
What were the Fund costs for the reporting period? (Based on a hypothetical $10,000 investment)
Table Summary
Class |
Cost of a $10,000 investment |
Cost paid as a percentage of a $10,000 investment |
Institutional 2 Class |
$104 |
0.85% | |
| Expenses Paid, Amount |
$ 104
|
| Expense Ratio, Percent |
0.85%
|
| Factors Affecting Performance [Text Block] |
Management's Discussion of Fund Performance The performance of Institutional 2 Class shares for the period presented is shown in the Average Annual Total Returns table. Top Performance ContributorsStock selection | Selections in the energy, materials and consumer discretionary sectors boosted the Fund’s relative performance during the annual period. Allocations | Smaller allocations to the financials and utilities sectors and a larger allocation to the materials sector buoyed the Fund’s relative performance during the annual period. Individual holdings | Positions in PACS Group, a post-acute healthcare operator; MP Materials, a rare earth materials company; uniQure, a gene therapy developer; Celcuity, a cancer-focused biotech company; and Olema Pharmaceuticals, another cancer-focused biotech company, were among the top contributors to the Fund’s relative performance. Top Performance DetractorsStock selection | Selections in the information technology, communication services and consumer staples sectors hurt the Fund’s relative performance during the annual period. Allocations | Larger weightings in the consumer discretionary and consumer staples sectors and a smaller allocation to the energy sector detracted from the Fund’s relative performance. Individual holdings | Positions in Everforth, an IT solutions company; KinderCare Learning, an early childhood education company; and Perrigo, an over-the-counter pharmaceutical manufacturer, were among the top detractors from the Fund’s relative performance. Zero weights in TTM Technologies, an electronic components manufacturer; and EchoStar, a telecom company with a right to acquire an ownership stake in SpaceX, were also among the top detractors from relative performance. |
| Performance Past Does Not Indicate Future [Text] |
The Fund's past performance is not a good predictor of the Fund's future performance.
|
| Line Graph [Table Text Block] |

Table Summary
|
Columbia Small Cap Value Discovery Fund Institutional 2 Class ($30,820) |
Russell 3000® Index ($39,601) |
Russell 2000® Value Index ($26,880) |
04/16 |
$10,000 |
$10,000 |
$10,000 |
05/16 |
$10,065 |
$10,179 |
$10,183 |
06/16 |
$9,843 |
$10,200 |
$10,214 |
07/16 |
$10,457 |
$10,605 |
$10,765 |
08/16 |
$10,882 |
$10,632 |
$11,033 |
09/16 |
$11,000 |
$10,648 |
$11,120 |
10/16 |
$10,511 |
$10,418 |
$10,754 |
11/16 |
$12,028 |
$10,884 |
$12,182 |
12/16 |
$12,534 |
$11,097 |
$12,685 |
01/17 |
$12,540 |
$11,305 |
$12,594 |
02/17 |
$12,702 |
$11,726 |
$12,777 |
03/17 |
$12,672 |
$11,734 |
$12,668 |
04/17 |
$12,650 |
$11,858 |
$12,718 |
05/17 |
$12,316 |
$11,980 |
$12,322 |
06/17 |
$12,891 |
$12,088 |
$12,753 |
07/17 |
$13,150 |
$12,316 |
$12,834 |
08/17 |
$12,863 |
$12,339 |
$12,518 |
09/17 |
$13,896 |
$12,640 |
$13,405 |
10/17 |
$13,988 |
$12,916 |
$13,422 |
11/17 |
$14,441 |
$13,308 |
$13,811 |
12/17 |
$14,330 |
$13,441 |
$13,679 |
01/18 |
$14,462 |
$14,150 |
$13,848 |
02/18 |
$13,679 |
$13,628 |
$13,155 |
03/18 |
$13,730 |
$13,355 |
$13,318 |
04/18 |
$13,973 |
$13,406 |
$13,549 |
05/18 |
$14,702 |
$13,784 |
$14,337 |
06/18 |
$14,854 |
$13,874 |
$14,424 |
07/18 |
$14,992 |
$14,335 |
$14,678 |
08/18 |
$15,301 |
$14,838 |
$15,028 |
09/18 |
$14,726 |
$14,863 |
$14,655 |
10/18 |
$13,301 |
$13,768 |
$13,343 |
11/18 |
$13,457 |
$14,044 |
$13,558 |
12/18 |
$11,752 |
$12,737 |
$11,919 |
01/19 |
$13,244 |
$13,830 |
$13,223 |
02/19 |
$13,751 |
$14,316 |
$13,737 |
03/19 |
$13,218 |
$14,526 |
$13,341 |
04/19 |
$13,693 |
$15,106 |
$13,846 |
05/19 |
$12,333 |
$14,128 |
$12,715 |
06/19 |
$13,261 |
$15,120 |
$13,524 |
07/19 |
$13,304 |
$15,345 |
$13,546 |
08/19 |
$12,246 |
$15,032 |
$12,790 |
09/19 |
$13,042 |
$15,296 |
$13,447 |
10/19 |
$13,228 |
$15,625 |
$13,773 |
11/19 |
$13,642 |
$16,219 |
$14,095 |
12/19 |
$14,269 |
$16,688 |
$14,589 |
01/20 |
$13,323 |
$16,669 |
$13,802 |
02/20 |
$11,948 |
$15,305 |
$12,461 |
03/20 |
$9,135 |
$13,200 |
$9,386 |
04/20 |
$10,489 |
$14,948 |
$10,544 |
05/20 |
$10,911 |
$15,748 |
$10,847 |
06/20 |
$11,272 |
$16,108 |
$11,161 |
07/20 |
$11,326 |
$17,022 |
$11,391 |
08/20 |
$12,077 |
$18,255 |
$12,005 |
09/20 |
$11,560 |
$17,591 |
$11,446 |
10/20 |
$12,033 |
$17,211 |
$11,855 |
11/20 |
$14,347 |
$19,305 |
$14,144 |
12/20 |
$15,444 |
$20,173 |
$15,265 |
01/21 |
$15,852 |
$20,084 |
$16,068 |
02/21 |
$17,899 |
$20,711 |
$17,577 |
03/21 |
$18,870 |
$21,454 |
$18,496 |
04/21 |
$19,402 |
$22,560 |
$18,870 |
05/21 |
$20,093 |
$22,663 |
$19,457 |
06/21 |
$19,590 |
$23,222 |
$19,339 |
07/21 |
$19,056 |
$23,614 |
$18,647 |
08/21 |
$19,485 |
$24,288 |
$19,146 |
09/21 |
$19,283 |
$23,198 |
$18,763 |
10/21 |
$19,917 |
$24,767 |
$19,478 |
11/21 |
$19,234 |
$24,390 |
$18,813 |
12/21 |
$19,955 |
$25,350 |
$19,580 |
01/22 |
$19,143 |
$23,859 |
$18,438 |
02/22 |
$19,590 |
$23,258 |
$18,744 |
03/22 |
$19,617 |
$24,012 |
$19,110 |
04/22 |
$18,315 |
$21,857 |
$17,627 |
05/22 |
$18,620 |
$21,828 |
$17,966 |
06/22 |
$16,757 |
$20,002 |
$16,191 |
07/22 |
$18,414 |
$21,878 |
$17,758 |
08/22 |
$17,967 |
$21,062 |
$17,197 |
09/22 |
$16,235 |
$19,109 |
$15,444 |
10/22 |
$18,193 |
$20,676 |
$17,389 |
11/22 |
$19,015 |
$21,755 |
$17,920 |
12/22 |
$18,256 |
$20,481 |
$16,744 |
01/23 |
$20,255 |
$21,892 |
$18,342 |
02/23 |
$19,877 |
$21,380 |
$17,919 |
03/23 |
$18,573 |
$21,952 |
$16,634 |
04/23 |
$18,208 |
$22,186 |
$16,219 |
05/23 |
$17,834 |
$22,272 |
$15,900 |
06/23 |
$19,688 |
$23,793 |
$17,163 |
07/23 |
$20,992 |
$24,646 |
$18,459 |
08/23 |
$20,503 |
$24,170 |
$17,571 |
09/23 |
$19,337 |
$23,019 |
$16,656 |
10/23 |
$18,198 |
$22,408 |
$15,662 |
11/23 |
$19,805 |
$24,498 |
$17,072 |
12/23 |
$22,228 |
$25,797 |
$19,197 |
01/24 |
$21,312 |
$26,083 |
$18,325 |
02/24 |
$21,956 |
$27,495 |
$18,924 |
03/24 |
$23,127 |
$28,382 |
$19,754 |
04/24 |
$21,619 |
$27,133 |
$18,495 |
05/24 |
$22,846 |
$28,415 |
$19,360 |
06/24 |
$22,054 |
$29,295 |
$19,034 |
07/24 |
$24,155 |
$29,839 |
$21,353 |
08/24 |
$23,553 |
$30,489 |
$20,952 |
09/24 |
$23,721 |
$31,120 |
$20,966 |
10/24 |
$23,337 |
$30,891 |
$20,638 |
11/24 |
$25,967 |
$32,946 |
$22,628 |
12/24 |
$24,234 |
$31,939 |
$20,743 |
01/25 |
$24,916 |
$32,947 |
$21,169 |
02/25 |
$23,580 |
$32,316 |
$20,359 |
03/25 |
$22,371 |
$30,431 |
$19,137 |
04/25 |
$21,473 |
$30,227 |
$18,368 |
05/25 |
$22,714 |
$32,143 |
$19,140 |
06/25 |
$23,762 |
$33,776 |
$20,087 |
07/25 |
$24,152 |
$34,520 |
$20,442 |
08/25 |
$26,192 |
$35,318 |
$22,173 |
09/25 |
$26,716 |
$36,537 |
$22,619 |
10/25 |
$26,540 |
$37,320 |
$22,676 |
11/25 |
$27,467 |
$37,423 |
$23,313 |
12/25 |
$27,864 |
$37,415 |
$23,355 |
01/26 |
$29,309 |
$37,996 |
$24,957 |
02/26 |
$29,537 |
$37,815 |
$25,438 |
03/26 |
$28,076 |
$35,935 |
$24,513 |
04/26 |
$30,820 |
$39,601 |
$26,880 |
|
| Average Annual Return [Table Text Block] |
Table Summary
Average Annual Total Returns (%) |
1 year |
5 years |
10 years |
Institutional 2 Class |
43.53 |
9.70 |
11.91 |
Russell 3000® Index |
31.01 |
11.91 |
14.75 |
Russell 2000® Value Index |
46.34 |
7.33 |
10.39 | |
| No Deduction of Taxes [Text Block] |
Performance does not reflect the deduction of taxes that a shareholder may pay on fund distributions or on the redemptions of fund shares.
|
| Updated Performance Information Location [Text Block] |
columbiathreadneedleus.com/investment-products/mutual-funds
|
| AssetsNet |
$ 2,211,976,094
|
| Holdings Count | Holding |
228
|
| Advisory Fees Paid, Amount |
$ 14,484,082
|
| InvestmentCompanyPortfolioTurnover |
67.00%
|
| Additional Fund Statistics [Text Block] |
Table Summary
Fund net assets |
$2,211,976,094 |
Total number of portfolio holdings |
228 |
Management services fees (represents 0.79% of Fund average net assets) |
$14,484,082 |
Portfolio turnover for the reporting period |
67% | |
| Holdings [Text Block] |
Table Summary
Financials |
18.0% |
Industrials |
17.1% |
Real Estate |
13.6% |
Consumer Discretionary |
11.5% |
Health Care |
8.3% |
Energy |
8.2% |
Materials |
7.7% |
Information Technology |
6.6% |
Consumer Staples |
4.1% |
Communication Services |
2.2% |
Other |
1.3% |
Table Summary
Common Stocks |
98.6% |
Other |
1.3% | |
| Largest Holdings [Text Block] |
Table Summary
Littelfuse, Inc. |
1.2% |
Knight-Swift Transportation Holdings, Inc. |
1.1% |
Meritage Homes Corp. |
1.1% |
National Fuel Gas Co. |
1.0% |
ArcBest Corp. |
1.0% |
Rayonier, Inc. |
1.0% |
Kite Realty Group Trust |
1.0% |
Vishay Intertechnology, Inc. |
1.0% |
UFP Industries, Inc. |
1.0% |
Polaris, Inc. |
1.0% | |
| Material Fund Change [Text Block] |
This is a summary of the changes to the Fund. For more complete information, you may review the Fund’s prospectus, which is available at columbiathreadneedleus.com/resources/literature or upon request at 1-800-345-6611. Effective September 1, 2025, the Fund's name was changed from Columbia Small Cap Value Fund I to Columbia Small Cap Value Discovery Fund. |
| Material Fund Change Name [Text Block] |
Effective September 1, 2025, the Fund's name was changed from Columbia Small Cap Value Fund I to Columbia Small Cap Value Discovery Fund.
|
| Summary of Change Legend [Text Block] |
This is a summary of the changes to the Fund. For more complete information, you may review the Fund’s prospectus, which is available at columbiathreadneedleus.com/resources/literature or upon request at 1-800-345-6611.
|
| Updated Prospectus Phone Number |
1-800-345-6611
|
| Updated Prospectus Web Address |
columbiathreadneedleus.com/resources/literature
|
| C000078991 |
|
| Shareholder Report [Line Items] |
|
| Fund Name |
Columbia Small Cap Value Discovery Fund
|
| Class Name |
Institutional 3 Class
|
| Trading Symbol |
CSVYX
|
| Annual or Semi-Annual Statement [Text Block] |
This annual shareholder report contains important information about Columbia Small Cap Value Discovery Fund (the Fund) for the period of May 1, 2025 to April 30, 2026.
|
| Additional Information [Text Block] |
You can find additional information about the Fund at columbiathreadneedleus.com/resources/literature. You can also request more information by contacting us at 1-800-345-6611.
|
| Material Fund Change Notice [Text Block] |
This report describes changes to the Fund that occurred during the reporting period.
|
| Additional Information Phone Number |
1-800-345-6611
|
| Additional Information Website |
columbiathreadneedleus.com/resources/literature
|
| Expenses [Text Block] |
What were the Fund costs for the reporting period? (Based on a hypothetical $10,000 investment)
Table Summary
Class |
Cost of a $10,000 investment |
Cost paid as a percentage of a $10,000 investment |
Institutional 3 Class |
$99 |
0.81% | |
| Expenses Paid, Amount |
$ 99
|
| Expense Ratio, Percent |
0.81%
|
| Factors Affecting Performance [Text Block] |
Management's Discussion of Fund Performance The performance of Institutional 3 Class shares for the period presented is shown in the Average Annual Total Returns table. Top Performance ContributorsStock selection | Selections in the energy, materials and consumer discretionary sectors boosted the Fund’s relative performance during the annual period. Allocations | Smaller allocations to the financials and utilities sectors and a larger allocation to the materials sector buoyed the Fund’s relative performance during the annual period. Individual holdings | Positions in PACS Group, a post-acute healthcare operator; MP Materials, a rare earth materials company; uniQure, a gene therapy developer; Celcuity, a cancer-focused biotech company; and Olema Pharmaceuticals, another cancer-focused biotech company, were among the top contributors to the Fund’s relative performance. Top Performance DetractorsStock selection | Selections in the information technology, communication services and consumer staples sectors hurt the Fund’s relative performance during the annual period. Allocations | Larger weightings in the consumer discretionary and consumer staples sectors and a smaller allocation to the energy sector detracted from the Fund’s relative performance. Individual holdings | Positions in Everforth, an IT solutions company; KinderCare Learning, an early childhood education company; and Perrigo, an over-the-counter pharmaceutical manufacturer, were among the top detractors from the Fund’s relative performance. Zero weights in TTM Technologies, an electronic components manufacturer; and EchoStar, a telecom company with a right to acquire an ownership stake in SpaceX, were also among the top detractors from relative performance. |
| Performance Past Does Not Indicate Future [Text] |
The Fund's past performance is not a good predictor of the Fund's future performance.
|
| Line Graph [Table Text Block] |
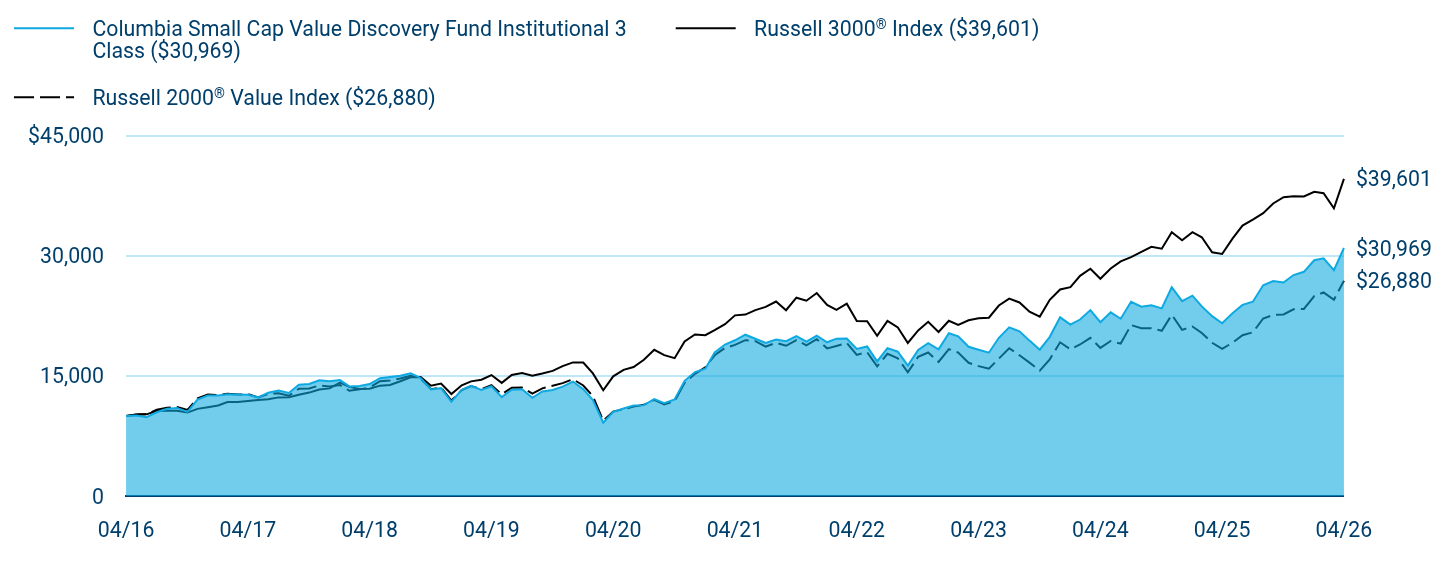
Table Summary
|
Columbia Small Cap Value Discovery Fund Institutional 3 Class ($30,969) |
Russell 3000® Index ($39,601) |
Russell 2000® Value Index ($26,880) |
04/16 |
$10,000 |
$10,000 |
$10,000 |
05/16 |
$10,066 |
$10,179 |
$10,183 |
06/16 |
$9,844 |
$10,200 |
$10,214 |
07/16 |
$10,458 |
$10,605 |
$10,765 |
08/16 |
$10,884 |
$10,632 |
$11,033 |
09/16 |
$11,002 |
$10,648 |
$11,120 |
10/16 |
$10,513 |
$10,418 |
$10,754 |
11/16 |
$12,031 |
$10,884 |
$12,182 |
12/16 |
$12,538 |
$11,097 |
$12,685 |
01/17 |
$12,544 |
$11,305 |
$12,594 |
02/17 |
$12,707 |
$11,726 |
$12,777 |
03/17 |
$12,676 |
$11,734 |
$12,668 |
04/17 |
$12,657 |
$11,858 |
$12,718 |
05/17 |
$12,323 |
$11,980 |
$12,322 |
06/17 |
$12,898 |
$12,088 |
$12,753 |
07/17 |
$13,160 |
$12,316 |
$12,834 |
08/17 |
$12,871 |
$12,339 |
$12,518 |
09/17 |
$13,906 |
$12,640 |
$13,405 |
10/17 |
$13,998 |
$12,916 |
$13,422 |
11/17 |
$14,453 |
$13,308 |
$13,811 |
12/17 |
$14,340 |
$13,441 |
$13,679 |
01/18 |
$14,475 |
$14,150 |
$13,848 |
02/18 |
$13,691 |
$13,628 |
$13,155 |
03/18 |
$13,743 |
$13,355 |
$13,318 |
04/18 |
$13,986 |
$13,406 |
$13,549 |
05/18 |
$14,715 |
$13,784 |
$14,337 |
06/18 |
$14,866 |
$13,874 |
$14,424 |
07/18 |
$15,007 |
$14,335 |
$14,678 |
08/18 |
$15,318 |
$14,838 |
$15,028 |
09/18 |
$14,743 |
$14,863 |
$14,655 |
10/18 |
$13,316 |
$13,768 |
$13,343 |
11/18 |
$13,472 |
$14,044 |
$13,558 |
12/18 |
$11,768 |
$12,737 |
$11,919 |
01/19 |
$13,262 |
$13,830 |
$13,223 |
02/19 |
$13,770 |
$14,316 |
$13,737 |
03/19 |
$13,239 |
$14,526 |
$13,341 |
04/19 |
$13,710 |
$15,106 |
$13,846 |
05/19 |
$12,352 |
$14,128 |
$12,715 |
06/19 |
$13,279 |
$15,120 |
$13,524 |
07/19 |
$13,324 |
$15,345 |
$13,546 |
08/19 |
$12,267 |
$15,032 |
$12,790 |
09/19 |
$13,064 |
$15,296 |
$13,447 |
10/19 |
$13,249 |
$15,625 |
$13,773 |
11/19 |
$13,664 |
$16,219 |
$14,095 |
12/19 |
$14,294 |
$16,688 |
$14,589 |
01/20 |
$13,347 |
$16,669 |
$13,802 |
02/20 |
$11,970 |
$15,305 |
$12,461 |
03/20 |
$9,150 |
$13,200 |
$9,386 |
04/20 |
$10,510 |
$14,948 |
$10,544 |
05/20 |
$10,934 |
$15,748 |
$10,847 |
06/20 |
$11,297 |
$16,108 |
$11,161 |
07/20 |
$11,349 |
$17,022 |
$11,391 |
08/20 |
$12,105 |
$18,255 |
$12,005 |
09/20 |
$11,587 |
$17,591 |
$11,446 |
10/20 |
$12,056 |
$17,211 |
$11,855 |
11/20 |
$14,380 |
$19,305 |
$14,144 |
12/20 |
$15,479 |
$20,173 |
$15,265 |
01/21 |
$15,888 |
$20,084 |
$16,068 |
02/21 |
$17,940 |
$20,711 |
$17,577 |
03/21 |
$18,913 |
$21,454 |
$18,496 |
04/21 |
$19,447 |
$22,560 |
$18,870 |
05/21 |
$20,142 |
$22,663 |
$19,457 |
06/21 |
$19,636 |
$23,222 |
$19,339 |
07/21 |
$19,104 |
$23,614 |
$18,647 |
08/21 |
$19,539 |
$24,288 |
$19,146 |
09/21 |
$19,331 |
$23,198 |
$18,763 |
10/21 |
$19,970 |
$24,767 |
$19,478 |
11/21 |
$19,284 |
$24,390 |
$18,813 |
12/21 |
$20,012 |
$25,350 |
$19,580 |
01/22 |
$19,196 |
$23,859 |
$18,438 |
02/22 |
$19,647 |
$23,258 |
$18,744 |
03/22 |
$19,670 |
$24,012 |
$19,110 |
04/22 |
$18,367 |
$21,857 |
$17,627 |
05/22 |
$18,678 |
$21,828 |
$17,966 |
06/22 |
$16,808 |
$20,002 |
$16,191 |
07/22 |
$18,470 |
$21,878 |
$17,758 |
08/22 |
$18,024 |
$21,062 |
$17,197 |
09/22 |
$16,288 |
$19,109 |
$15,444 |
10/22 |
$18,253 |
$20,676 |
$17,389 |
11/22 |
$19,076 |
$21,755 |
$17,920 |
12/22 |
$18,316 |
$20,481 |
$16,744 |
01/23 |
$20,320 |
$21,892 |
$18,342 |
02/23 |
$19,946 |
$21,380 |
$17,919 |
03/23 |
$18,633 |
$21,952 |
$16,634 |
04/23 |
$18,270 |
$22,186 |
$16,219 |
05/23 |
$17,896 |
$22,272 |
$15,900 |
06/23 |
$19,757 |
$23,793 |
$17,163 |
07/23 |
$21,067 |
$24,646 |
$18,459 |
08/23 |
$20,577 |
$24,170 |
$17,571 |
09/23 |
$19,406 |
$23,019 |
$16,656 |
10/23 |
$18,268 |
$22,408 |
$15,662 |
11/23 |
$19,878 |
$24,498 |
$17,072 |
12/23 |
$22,313 |
$25,797 |
$19,197 |
01/24 |
$21,397 |
$26,083 |
$18,325 |
02/24 |
$22,039 |
$27,495 |
$18,924 |
03/24 |
$23,216 |
$28,382 |
$19,754 |
04/24 |
$21,707 |
$27,133 |
$18,495 |
05/24 |
$22,937 |
$28,415 |
$19,360 |
06/24 |
$22,141 |
$29,295 |
$19,034 |
07/24 |
$24,252 |
$29,839 |
$21,353 |
08/24 |
$23,649 |
$30,489 |
$20,952 |
09/24 |
$23,819 |
$31,120 |
$20,966 |
10/24 |
$23,433 |
$30,891 |
$20,638 |
11/24 |
$26,077 |
$32,946 |
$22,628 |
12/24 |
$24,337 |
$31,939 |
$20,743 |
01/25 |
$25,023 |
$32,947 |
$21,169 |
02/25 |
$23,684 |
$32,316 |
$20,359 |
03/25 |
$22,467 |
$30,431 |
$19,137 |
04/25 |
$21,570 |
$30,227 |
$18,368 |
05/25 |
$22,815 |
$32,143 |
$19,140 |
06/25 |
$23,868 |
$33,776 |
$20,087 |
07/25 |
$24,259 |
$34,520 |
$20,442 |
08/25 |
$26,314 |
$35,318 |
$22,173 |
09/25 |
$26,841 |
$36,537 |
$22,619 |
10/25 |
$26,662 |
$37,320 |
$22,676 |
11/25 |
$27,595 |
$37,423 |
$23,313 |
12/25 |
$27,998 |
$37,415 |
$23,355 |
01/26 |
$29,446 |
$37,996 |
$24,957 |
02/26 |
$29,679 |
$37,815 |
$25,438 |
03/26 |
$28,214 |
$35,935 |
$24,513 |
04/26 |
$30,969 |
$39,601 |
$26,880 |
|
| Average Annual Return [Table Text Block] |
Table Summary
Average Annual Total Returns (%) |
1 year |
5 years |
10 years |
Institutional 3 Class |
43.57 |
9.75 |
11.97 |
Russell 3000® Index |
31.01 |
11.91 |
14.75 |
Russell 2000® Value Index |
46.34 |
7.33 |
10.39 | |
| No Deduction of Taxes [Text Block] |
Performance does not reflect the deduction of taxes that a shareholder may pay on fund distributions or on the redemptions of fund shares.
|
| Updated Performance Information Location [Text Block] |
columbiathreadneedleus.com/investment-products/mutual-funds
|
| AssetsNet |
$ 2,211,976,094
|
| Holdings Count | Holding |
228
|
| Advisory Fees Paid, Amount |
$ 14,484,082
|
| InvestmentCompanyPortfolioTurnover |
67.00%
|
| Additional Fund Statistics [Text Block] |
Table Summary
Fund net assets |
$2,211,976,094 |
Total number of portfolio holdings |
228 |
Management services fees (represents 0.79% of Fund average net assets) |
$14,484,082 |
Portfolio turnover for the reporting period |
67% | |
| Holdings [Text Block] |
Table Summary
Financials |
18.0% |
Industrials |
17.1% |
Real Estate |
13.6% |
Consumer Discretionary |
11.5% |
Health Care |
8.3% |
Energy |
8.2% |
Materials |
7.7% |
Information Technology |
6.6% |
Consumer Staples |
4.1% |
Communication Services |
2.2% |
Other |
1.3% |
Table Summary
Common Stocks |
98.6% |
Other |
1.3% | |
| Largest Holdings [Text Block] |
Table Summary
Littelfuse, Inc. |
1.2% |
Knight-Swift Transportation Holdings, Inc. |
1.1% |
Meritage Homes Corp. |
1.1% |
National Fuel Gas Co. |
1.0% |
ArcBest Corp. |
1.0% |
Rayonier, Inc. |
1.0% |
Kite Realty Group Trust |
1.0% |
Vishay Intertechnology, Inc. |
1.0% |
UFP Industries, Inc. |
1.0% |
Polaris, Inc. |
1.0% | |
| Material Fund Change [Text Block] |
This is a summary of the changes to the Fund. For more complete information, you may review the Fund’s prospectus, which is available at columbiathreadneedleus.com/resources/literature or upon request at 1-800-345-6611. Effective September 1, 2025, the Fund's name was changed from Columbia Small Cap Value Fund I to Columbia Small Cap Value Discovery Fund. |
| Material Fund Change Name [Text Block] |
Effective September 1, 2025, the Fund's name was changed from Columbia Small Cap Value Fund I to Columbia Small Cap Value Discovery Fund.
|
| Summary of Change Legend [Text Block] |
This is a summary of the changes to the Fund. For more complete information, you may review the Fund’s prospectus, which is available at columbiathreadneedleus.com/resources/literature or upon request at 1-800-345-6611.
|
| Updated Prospectus Phone Number |
1-800-345-6611
|
| Updated Prospectus Web Address |
columbiathreadneedleus.com/resources/literature
|
| C000033008 |
|
| Shareholder Report [Line Items] |
|
| Fund Name |
Columbia Small Cap Value Discovery Fund
|
| Class Name |
Institutional Class
|
| Trading Symbol |
CSCZX
|
| Annual or Semi-Annual Statement [Text Block] |
This annual shareholder report contains important information about Columbia Small Cap Value Discovery Fund (the Fund) for the period of May 1, 2025 to April 30, 2026.
|
| Additional Information [Text Block] |
You can find additional information about the Fund at columbiathreadneedleus.com/resources/literature. You can also request more information by contacting us at 1-800-345-6611.
|
| Material Fund Change Notice [Text Block] |
This report describes changes to the Fund that occurred during the reporting period.
|
| Additional Information Phone Number |
1-800-345-6611
|
| Additional Information Website |
columbiathreadneedleus.com/resources/literature
|
| Expenses [Text Block] |
What were the Fund costs for the reporting period? (Based on a hypothetical $10,000 investment)
Table Summary
Class |
Cost of a $10,000 investment |
Cost paid as a percentage of a $10,000 investment |
Institutional Class |
$114 |
0.94% | |
| Expenses Paid, Amount |
$ 114
|
| Expense Ratio, Percent |
0.94%
|
| Factors Affecting Performance [Text Block] |
Management's Discussion of Fund Performance The performance of Institutional Class shares for the period presented is shown in the Average Annual Total Returns table. Top Performance ContributorsStock selection | Selections in the energy, materials and consumer discretionary sectors boosted the Fund’s relative performance during the annual period. Allocations | Smaller allocations to the financials and utilities sectors and a larger allocation to the materials sector buoyed the Fund’s relative performance during the annual period. Individual holdings | Positions in PACS Group, a post-acute healthcare operator; MP Materials, a rare earth materials company; uniQure, a gene therapy developer; Celcuity, a cancer-focused biotech company; and Olema Pharmaceuticals, another cancer-focused biotech company, were among the top contributors to the Fund’s relative performance. Top Performance DetractorsStock selection | Selections in the information technology, communication services and consumer staples sectors hurt the Fund’s relative performance during the annual period. Allocations | Larger weightings in the consumer discretionary and consumer staples sectors and a smaller allocation to the energy sector detracted from the Fund’s relative performance. Individual holdings | Positions in Everforth, an IT solutions company; KinderCare Learning, an early childhood education company; and Perrigo, an over-the-counter pharmaceutical manufacturer, were among the top detractors from the Fund’s relative performance. Zero weights in TTM Technologies, an electronic components manufacturer; and EchoStar, a telecom company with a right to acquire an ownership stake in SpaceX, were also among the top detractors from relative performance. |
| Performance Past Does Not Indicate Future [Text] |
The Fund's past performance is not a good predictor of the Fund's future performance.
|
| Line Graph [Table Text Block] |

Table Summary
|
Columbia Small Cap Value Discovery Fund Institutional Class ($30,477) |
Russell 3000® Index ($39,601) |
Russell 2000® Value Index ($26,880) |
04/16 |
$10,000 |
$10,000 |
$10,000 |
05/16 |
$10,064 |
$10,179 |
$10,183 |
06/16 |
$9,840 |
$10,200 |
$10,214 |
07/16 |
$10,453 |
$10,605 |
$10,765 |
08/16 |
$10,875 |
$10,632 |
$11,033 |
09/16 |
$10,992 |
$10,648 |
$11,120 |
10/16 |
$10,503 |
$10,418 |
$10,754 |
11/16 |
$12,017 |
$10,884 |
$12,182 |
12/16 |
$12,522 |
$11,097 |
$12,685 |
01/17 |
$12,525 |
$11,305 |
$12,594 |
02/17 |
$12,685 |
$11,726 |
$12,777 |
03/17 |
$12,655 |
$11,734 |
$12,668 |
04/17 |
$12,633 |
$11,858 |
$12,718 |
05/17 |
$12,296 |
$11,980 |
$12,322 |
06/17 |
$12,869 |
$12,088 |
$12,753 |
07/17 |
$13,128 |
$12,316 |
$12,834 |
08/17 |
$12,836 |
$12,339 |
$12,518 |
09/17 |
$13,867 |
$12,640 |
$13,405 |
10/17 |
$13,958 |
$12,916 |
$13,422 |
11/17 |
$14,409 |
$13,308 |
$13,811 |
12/17 |
$14,297 |
$13,441 |
$13,679 |
01/18 |
$14,429 |
$14,150 |
$13,848 |
02/18 |
$13,644 |
$13,628 |
$13,155 |
03/18 |
$13,693 |
$13,355 |
$13,318 |
04/18 |
$13,936 |
$13,406 |
$13,549 |
05/18 |
$14,657 |
$13,784 |
$14,337 |
06/18 |
$14,808 |
$13,874 |
$14,424 |
07/18 |
$14,943 |
$14,335 |
$14,678 |
08/18 |
$15,251 |
$14,838 |
$15,028 |
09/18 |
$14,676 |
$14,863 |
$14,655 |
10/18 |
$13,256 |
$13,768 |
$13,343 |
11/18 |
$13,410 |
$14,044 |
$13,558 |
12/18 |
$11,710 |
$12,737 |
$11,919 |
01/19 |
$13,194 |
$13,830 |
$13,223 |
02/19 |
$13,698 |
$14,316 |
$13,737 |
03/19 |
$13,167 |
$14,526 |
$13,341 |
04/19 |
$13,635 |
$15,106 |
$13,846 |
05/19 |
$12,281 |
$14,128 |
$12,715 |
06/19 |
$13,201 |
$15,120 |
$13,524 |
07/19 |
$13,246 |
$15,345 |
$13,546 |
08/19 |
$12,192 |
$15,032 |
$12,790 |
09/19 |
$12,980 |
$15,296 |
$13,447 |
10/19 |
$13,164 |
$15,625 |
$13,773 |
11/19 |
$13,576 |
$16,219 |
$14,095 |
12/19 |
$14,200 |
$16,688 |
$14,589 |
01/20 |
$13,254 |
$16,669 |
$13,802 |
02/20 |
$11,885 |
$15,305 |
$12,461 |
03/20 |
$9,085 |
$13,200 |
$9,386 |
04/20 |
$10,433 |
$14,948 |
$10,544 |
05/20 |
$10,853 |
$15,748 |
$10,847 |
06/20 |
$11,209 |
$16,108 |
$11,161 |
07/20 |
$11,261 |
$17,022 |
$11,391 |
08/20 |
$12,006 |
$18,255 |
$12,005 |
09/20 |
$11,492 |
$17,591 |
$11,446 |
10/20 |
$11,958 |
$17,211 |
$11,855 |
11/20 |
$14,261 |
$19,305 |
$14,144 |
12/20 |
$15,347 |
$20,173 |
$15,265 |
01/21 |
$15,749 |
$20,084 |
$16,068 |
02/21 |
$17,783 |
$20,711 |
$17,577 |
03/21 |
$18,746 |
$21,454 |
$18,496 |
04/21 |
$19,272 |
$22,560 |
$18,870 |
05/21 |
$19,958 |
$22,663 |
$19,457 |
06/21 |
$19,455 |
$23,222 |
$19,339 |
07/21 |
$18,928 |
$23,614 |
$18,647 |
08/21 |
$19,351 |
$24,288 |
$19,146 |
09/21 |
$19,146 |
$23,198 |
$18,763 |
10/21 |
$19,777 |
$24,767 |
$19,478 |
11/21 |
$19,096 |
$24,390 |
$18,813 |
12/21 |
$19,811 |
$25,350 |
$19,580 |
01/22 |
$19,004 |
$23,859 |
$18,438 |
02/22 |
$19,446 |
$23,258 |
$18,744 |
03/22 |
$19,469 |
$24,012 |
$19,110 |
04/22 |
$18,174 |
$21,857 |
$17,627 |
05/22 |
$18,481 |
$21,828 |
$17,966 |
06/22 |
$16,627 |
$20,002 |
$16,191 |
07/22 |
$18,269 |
$21,878 |
$17,758 |
08/22 |
$17,823 |
$21,062 |
$17,197 |
09/22 |
$16,108 |
$19,109 |
$15,444 |
10/22 |
$18,048 |
$20,676 |
$17,389 |
11/22 |
$18,861 |
$21,755 |
$17,920 |
12/22 |
$18,106 |
$20,481 |
$16,744 |
01/23 |
$20,088 |
$21,892 |
$18,342 |
02/23 |
$19,715 |
$21,380 |
$17,919 |
03/23 |
$18,414 |
$21,952 |
$16,634 |
04/23 |
$18,057 |
$22,186 |
$16,219 |
05/23 |
$17,684 |
$22,272 |
$15,900 |
06/23 |
$19,518 |
$23,793 |
$17,163 |
07/23 |
$20,810 |
$24,646 |
$18,459 |
08/23 |
$20,323 |
$24,170 |
$17,571 |
09/23 |
$19,164 |
$23,019 |
$16,656 |
10/23 |
$18,038 |
$22,408 |
$15,662 |
11/23 |
$19,626 |
$24,498 |
$17,072 |
12/23 |
$22,029 |
$25,797 |
$19,197 |
01/24 |
$21,117 |
$26,083 |
$18,325 |
02/24 |
$21,751 |
$27,495 |
$18,924 |
03/24 |
$22,910 |
$28,382 |
$19,754 |
04/24 |
$21,416 |
$27,133 |
$18,495 |
05/24 |
$22,628 |
$28,415 |
$19,360 |
06/24 |
$21,843 |
$29,295 |
$19,034 |
07/24 |
$23,922 |
$29,839 |
$21,353 |
08/24 |
$23,327 |
$30,489 |
$20,952 |
09/24 |
$23,487 |
$31,120 |
$20,966 |
10/24 |
$23,107 |
$30,891 |
$20,638 |
11/24 |
$25,708 |
$32,946 |
$22,628 |
12/24 |
$23,992 |
$31,939 |
$20,743 |
01/25 |
$24,665 |
$32,947 |
$21,169 |
02/25 |
$23,342 |
$32,316 |
$20,359 |
03/25 |
$22,145 |
$30,431 |
$19,137 |
04/25 |
$21,252 |
$30,227 |
$18,368 |
05/25 |
$22,482 |
$32,143 |
$19,140 |
06/25 |
$23,515 |
$33,776 |
$20,087 |
07/25 |
$23,900 |
$34,520 |
$20,442 |
08/25 |
$25,915 |
$35,318 |
$22,173 |
09/25 |
$26,435 |
$36,537 |
$22,619 |
10/25 |
$26,257 |
$37,320 |
$22,676 |
11/25 |
$27,171 |
$37,423 |
$23,313 |
12/25 |
$27,563 |
$37,415 |
$23,355 |
01/26 |
$28,988 |
$37,996 |
$24,957 |
02/26 |
$29,209 |
$37,815 |
$25,438 |
03/26 |
$27,768 |
$35,935 |
$24,513 |
04/26 |
$30,477 |
$39,601 |
$26,880 |
|
| Average Annual Return [Table Text Block] |
Table Summary
Average Annual Total Returns (%) |
1 year |
5 years |
10 years |
Institutional Class |
43.41 |
9.60 |
11.79 |
Russell 3000® Index |
31.01 |
11.91 |
14.75 |
Russell 2000® Value Index |
46.34 |
7.33 |
10.39 | |
| No Deduction of Taxes [Text Block] |
Performance does not reflect the deduction of taxes that a shareholder may pay on fund distributions or on the redemptions of fund shares.
|
| Updated Performance Information Location [Text Block] |
columbiathreadneedleus.com/investment-products/mutual-funds
|
| AssetsNet |
$ 2,211,976,094
|
| Holdings Count | Holding |
228
|
| Advisory Fees Paid, Amount |
$ 14,484,082
|
| InvestmentCompanyPortfolioTurnover |
67.00%
|
| Additional Fund Statistics [Text Block] |
Table Summary
Fund net assets |
$2,211,976,094 |
Total number of portfolio holdings |
228 |
Management services fees (represents 0.79% of Fund average net assets) |
$14,484,082 |
Portfolio turnover for the reporting period |
67% | |
| Holdings [Text Block] |
Table Summary
Financials |
18.0% |
Industrials |
17.1% |
Real Estate |
13.6% |
Consumer Discretionary |
11.5% |
Health Care |
8.3% |
Energy |
8.2% |
Materials |
7.7% |
Information Technology |
6.6% |
Consumer Staples |
4.1% |
Communication Services |
2.2% |
Other |
1.3% |
Table Summary
Common Stocks |
98.6% |
Other |
1.3% | |
| Largest Holdings [Text Block] |
Table Summary
Littelfuse, Inc. |
1.2% |
Knight-Swift Transportation Holdings, Inc. |
1.1% |
Meritage Homes Corp. |
1.1% |
National Fuel Gas Co. |
1.0% |
ArcBest Corp. |
1.0% |
Rayonier, Inc. |
1.0% |
Kite Realty Group Trust |
1.0% |
Vishay Intertechnology, Inc. |
1.0% |
UFP Industries, Inc. |
1.0% |
Polaris, Inc. |
1.0% | |
| Material Fund Change [Text Block] |
This is a summary of the changes to the Fund. For more complete information, you may review the Fund’s prospectus, which is available at columbiathreadneedleus.com/resources/literature or upon request at 1-800-345-6611. Effective September 1, 2025, the Fund's name was changed from Columbia Small Cap Value Fund I to Columbia Small Cap Value Discovery Fund. |
| Material Fund Change Name [Text Block] |
Effective September 1, 2025, the Fund's name was changed from Columbia Small Cap Value Fund I to Columbia Small Cap Value Discovery Fund.
|
| Summary of Change Legend [Text Block] |
This is a summary of the changes to the Fund. For more complete information, you may review the Fund’s prospectus, which is available at columbiathreadneedleus.com/resources/literature or upon request at 1-800-345-6611.
|
| Updated Prospectus Phone Number |
1-800-345-6611
|
| Updated Prospectus Web Address |
columbiathreadneedleus.com/resources/literature
|
| C000032983 |
|
| Shareholder Report [Line Items] |
|
| Fund Name |
Columbia Total Return Bond Fund
|
| Class Name |
Class A
|
| Trading Symbol |
LIBAX
|
| Annual or Semi-Annual Statement [Text Block] |
This annual shareholder report contains important information about Columbia Total Return Bond Fund (the Fund) for the period of May 1, 2025 to April 30, 2026.
|
| Additional Information [Text Block] |
You can find additional information about the Fund at columbiathreadneedleus.com/resources/literature. You can also request more information by contacting us at 1-800-345-6611.
|
| Additional Information Phone Number |
1-800-345-6611
|
| Additional Information Website |
columbiathreadneedleus.com/resources/literature
|
| Expenses [Text Block] |
What were the Fund costs for the reporting period? (Based on a hypothetical $10,000 investment)
Table Summary
Class |
Cost of a $10,000 investment |
Cost paid as a percentage of a $10,000 investment |
Class A |
$76 |
0.74% | |
| Expenses Paid, Amount |
$ 76
|
| Expense Ratio, Percent |
0.74%
|
| Factors Affecting Performance [Text Block] |
Management's Discussion of Fund Performance The performance of Class A shares for the period presented is shown in the Average Annual Total Returns table. Top Performance ContributorsAgency mortgages | An overweight allocation to agency mortgage-backed securities was most positive for the Fund’s performance. Strong carry, supportive asset class technicals and valuations remained attractive during the period. Spreads tightened through the period, resulting in the Fund’s positive performance. Consumer-based credit | Exposure to consumer-based credit proved beneficial, led by holdings of non-agency mortgage-backed securities, as housing fundamentals remained relatively strong and borrower delinquencies remained low. Commercial mortgage-backed securities | Selection within commercial mortgage-backed securities was positive for the Fund’s performance. The asset class saw spreads tighten throughout the period as individual issuer selection contributed to overall performance. High-yield corporate bonds | An out-of-benchmark allocation to high-yield bonds and bank loans positively contributed to the Fund’s overall performance. Top Performance DetractorsDuration | The Fund’s generally overweight duration exposure detracted from the Fund's performance during periods when market bond yields rose. Investment-grade corporates | The Fund’s underweight allocation to investment-grade corporate debt was a detractor from the Fund’s overall performance as the asset class had positive relative performance, which negatively impacted the Fund's performance. ABS/CLOs | An allocation to asset-backed securities (ABS) and collateralized loan obligations (CLOs) marginally detracted from the Fund’s overall performance. Smaller compression effects in CLOs and ABS, relative to tightening seen in other asset classes, created a slight negative effect on the Fund’s overall performance. |
| Performance Past Does Not Indicate Future [Text] |
The Fund's past performance is not a good predictor of the Fund's future performance.
|
| Line Graph [Table Text Block] |
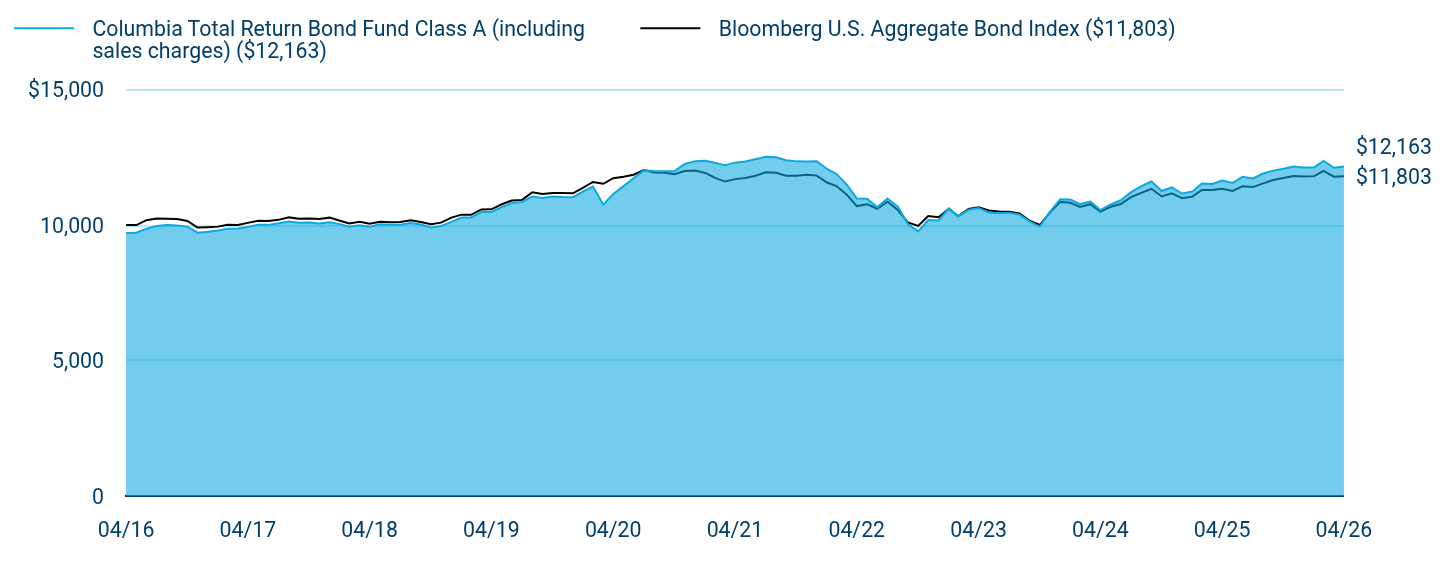
Table Summary
|
Columbia Total Return Bond Fund Class A (including sales charges) ($12,163) |
Bloomberg U.S. Aggregate Bond Index ($11,803) |
04/16 |
$9,705 |
$10,000 |
05/16 |
$9,717 |
$10,003 |
06/16 |
$9,863 |
$10,182 |
07/16 |
$9,968 |
$10,247 |
08/16 |
$10,000 |
$10,235 |
09/16 |
$9,988 |
$10,229 |
10/16 |
$9,944 |
$10,151 |
11/16 |
$9,722 |
$9,911 |
12/16 |
$9,757 |
$9,925 |
01/17 |
$9,802 |
$9,944 |
02/17 |
$9,863 |
$10,011 |
03/17 |
$9,872 |
$10,006 |
04/17 |
$9,935 |
$10,083 |
05/17 |
$10,011 |
$10,160 |
06/17 |
$10,009 |
$10,150 |
07/17 |
$10,065 |
$10,194 |
08/17 |
$10,132 |
$10,285 |
09/17 |
$10,089 |
$10,236 |
10/17 |
$10,098 |
$10,242 |
11/17 |
$10,064 |
$10,229 |
12/17 |
$10,106 |
$10,276 |
01/18 |
$10,036 |
$10,158 |
02/18 |
$9,942 |
$10,061 |
03/18 |
$9,994 |
$10,126 |
04/18 |
$9,943 |
$10,051 |
05/18 |
$10,027 |
$10,122 |
06/18 |
$10,010 |
$10,110 |
07/18 |
$10,016 |
$10,112 |
08/18 |
$10,081 |
$10,177 |
09/18 |
$10,023 |
$10,112 |
10/18 |
$9,911 |
$10,032 |
11/18 |
$9,964 |
$10,092 |
12/18 |
$10,118 |
$10,277 |
01/19 |
$10,280 |
$10,386 |
02/19 |
$10,283 |
$10,380 |
03/19 |
$10,481 |
$10,580 |
04/19 |
$10,485 |
$10,582 |
05/19 |
$10,662 |
$10,770 |
06/19 |
$10,816 |
$10,906 |
07/19 |
$10,855 |
$10,930 |
08/19 |
$11,057 |
$11,213 |
09/19 |
$11,003 |
$11,153 |
10/19 |
$11,057 |
$11,187 |
11/19 |
$11,038 |
$11,181 |
12/19 |
$11,033 |
$11,173 |
01/20 |
$11,248 |
$11,388 |
02/20 |
$11,424 |
$11,593 |
03/20 |
$10,757 |
$11,525 |
04/20 |
$11,150 |
$11,730 |
05/20 |
$11,438 |
$11,784 |
06/20 |
$11,729 |
$11,859 |
07/20 |
$12,020 |
$12,036 |
08/20 |
$11,996 |
$11,939 |
09/20 |
$11,991 |
$11,932 |
10/20 |
$11,991 |
$11,879 |
11/20 |
$12,259 |
$11,995 |
12/20 |
$12,360 |
$12,012 |
01/21 |
$12,373 |
$11,926 |
02/21 |
$12,302 |
$11,753 |
03/21 |
$12,214 |
$11,607 |
04/21 |
$12,306 |
$11,698 |
05/21 |
$12,346 |
$11,737 |
06/21 |
$12,429 |
$11,819 |
07/21 |
$12,519 |
$11,951 |
08/21 |
$12,507 |
$11,929 |
09/21 |
$12,393 |
$11,825 |
10/21 |
$12,353 |
$11,822 |
11/21 |
$12,348 |
$11,857 |
12/21 |
$12,359 |
$11,827 |
01/22 |
$12,074 |
$11,572 |
02/22 |
$11,889 |
$11,443 |
03/22 |
$11,497 |
$11,125 |
04/22 |
$10,986 |
$10,703 |
05/22 |
$10,973 |
$10,772 |
06/22 |
$10,658 |
$10,603 |
07/22 |
$10,981 |
$10,862 |
08/22 |
$10,684 |
$10,555 |
09/22 |
$10,039 |
$10,099 |
10/22 |
$9,768 |
$9,968 |
11/22 |
$10,189 |
$10,335 |
12/22 |
$10,173 |
$10,288 |
01/23 |
$10,613 |
$10,604 |
02/23 |
$10,320 |
$10,330 |
03/23 |
$10,565 |
$10,593 |
04/23 |
$10,627 |
$10,657 |
05/23 |
$10,468 |
$10,541 |
06/23 |
$10,442 |
$10,503 |
07/23 |
$10,459 |
$10,496 |
08/23 |
$10,388 |
$10,429 |
09/23 |
$10,138 |
$10,164 |
10/23 |
$9,947 |
$10,003 |
11/23 |
$10,481 |
$10,456 |
12/23 |
$10,952 |
$10,857 |
01/24 |
$10,949 |
$10,827 |
02/24 |
$10,776 |
$10,674 |
03/24 |
$10,870 |
$10,773 |
04/24 |
$10,555 |
$10,500 |
05/24 |
$10,762 |
$10,678 |
06/24 |
$10,917 |
$10,780 |
07/24 |
$11,217 |
$11,031 |
08/24 |
$11,441 |
$11,190 |
09/24 |
$11,610 |
$11,340 |
10/24 |
$11,258 |
$11,058 |
11/24 |
$11,394 |
$11,175 |
12/24 |
$11,167 |
$10,992 |
01/25 |
$11,238 |
$11,051 |
02/25 |
$11,532 |
$11,294 |
03/25 |
$11,521 |
$11,298 |
04/25 |
$11,644 |
$11,343 |
05/25 |
$11,553 |
$11,261 |
06/25 |
$11,782 |
$11,435 |
07/25 |
$11,721 |
$11,404 |
08/25 |
$11,905 |
$11,541 |
09/25 |
$12,012 |
$11,667 |
10/25 |
$12,082 |
$11,740 |
11/25 |
$12,163 |
$11,813 |
12/25 |
$12,129 |
$11,795 |
01/26 |
$12,131 |
$11,808 |
02/26 |
$12,367 |
$12,001 |
03/26 |
$12,115 |
$11,789 |
04/26 |
$12,163 |
$11,803 |
|
| Average Annual Return [Table Text Block] |
Table Summary
Average Annual Total Returns (%) |
1 year |
5 years |
10 years |
Class A (excluding sales charges) |
4.46 |
(0.23) |
2.28 |
Class A (including sales charges) |
1.32 |
(0.84) |
1.98 |
Bloomberg U.S. Aggregate Bond Index |
4.06 |
0.18 |
1.67 | |
| No Deduction of Taxes [Text Block] |
Performance does not reflect the deduction of taxes that a shareholder may pay on fund distributions or on the redemptions of fund shares.
|
| Updated Performance Information Location [Text Block] |
columbiathreadneedleus.com/investment-products/mutual-funds
|
| AssetsNet |
$ 3,152,583,318
|
| Holdings Count | Holding |
1,224
|
| Advisory Fees Paid, Amount |
$ 14,208,602
|
| InvestmentCompanyPortfolioTurnover |
222.00%
|
| Additional Fund Statistics [Text Block] |
Table Summary
Fund net assets |
$3,152,583,318 |
Total number of portfolio holdings |
1,224 |
Management services fees (represents 0.48% of Fund average net assets) |
$14,208,602 |
Portfolio turnover for the reporting period |
222% |
Portfolio turnover as of the end of the period excluding transactions in to be announced securities |
61% | |
| Holdings [Text Block] |
Table Summary
|
Long |
Credit Risk |
2.8% |
Interest Rate Risk |
59.6% |
|
Short |
Credit Risk |
1.1% |
Interest Rate Risk |
44.6% |
Table Summary
Residential Mortgage-Backed Securities - Agency |
37.2% |
Corporate Bonds & Notes |
22.4% |
Residential Mortgage-Backed Securities - Non-Agency |
15.6% |
Asset-Backed Securities - Non-Agency |
11.2% |
Money Market Funds |
9.2% |
Foreign Government Obligations |
5.6% |
Senior Loans |
5.2% |
Other |
1.7% | |
| Material Fund Change [Text Block] |
|
| C000032985 |
|
| Shareholder Report [Line Items] |
|
| Fund Name |
Columbia Total Return Bond Fund
|
| Class Name |
Class C
|
| Trading Symbol |
LIBCX
|
| Annual or Semi-Annual Statement [Text Block] |
This annual shareholder report contains important information about Columbia Total Return Bond Fund (the Fund) for the period of May 1, 2025 to April 30, 2026.
|
| Additional Information [Text Block] |
You can find additional information about the Fund at columbiathreadneedleus.com/resources/literature. You can also request more information by contacting us at 1-800-345-6611.
|
| Additional Information Phone Number |
1-800-345-6611
|
| Additional Information Website |
columbiathreadneedleus.com/resources/literature
|
| Expenses [Text Block] |
What were the Fund costs for the reporting period? (Based on a hypothetical $10,000 investment)
Table Summary
Class |
Cost of a $10,000 investment |
Cost paid as a percentage of a $10,000 investment |
Class C |
$152 |
1.49% | |
| Expenses Paid, Amount |
$ 152
|
| Expense Ratio, Percent |
1.49%
|
| Factors Affecting Performance [Text Block] |
Management's Discussion of Fund Performance The performance of Class C shares for the period presented is shown in the Average Annual Total Returns table. Top Performance ContributorsAgency mortgages | An overweight allocation to agency mortgage-backed securities was most positive for the Fund’s performance. Strong carry, supportive asset class technicals and valuations remained attractive during the period. Spreads tightened through the period, resulting in the Fund’s positive performance. Consumer-based credit | Exposure to consumer-based credit proved beneficial, led by holdings of non-agency mortgage-backed securities, as housing fundamentals remained relatively strong and borrower delinquencies remained low. Commercial mortgage-backed securities | Selection within commercial mortgage-backed securities was positive for the Fund’s performance. The asset class saw spreads tighten throughout the period as individual issuer selection contributed to overall performance. High-yield corporate bonds | An out-of-benchmark allocation to high-yield bonds and bank loans positively contributed to the Fund’s overall performance. Top Performance DetractorsDuration | The Fund’s generally overweight duration exposure detracted from the Fund's performance during periods when market bond yields rose. Investment-grade corporates | The Fund’s underweight allocation to investment-grade corporate debt was a detractor from the Fund’s overall performance as the asset class had positive relative performance, which negatively impacted the Fund's performance. ABS/CLOs | An allocation to asset-backed securities (ABS) and collateralized loan obligations (CLOs) marginally detracted from the Fund’s overall performance. Smaller compression effects in CLOs and ABS, relative to tightening seen in other asset classes, created a slight negative effect on the Fund’s overall performance. |
| Performance Past Does Not Indicate Future [Text] |
The Fund's past performance is not a good predictor of the Fund's future performance.
|
| Line Graph [Table Text Block] |
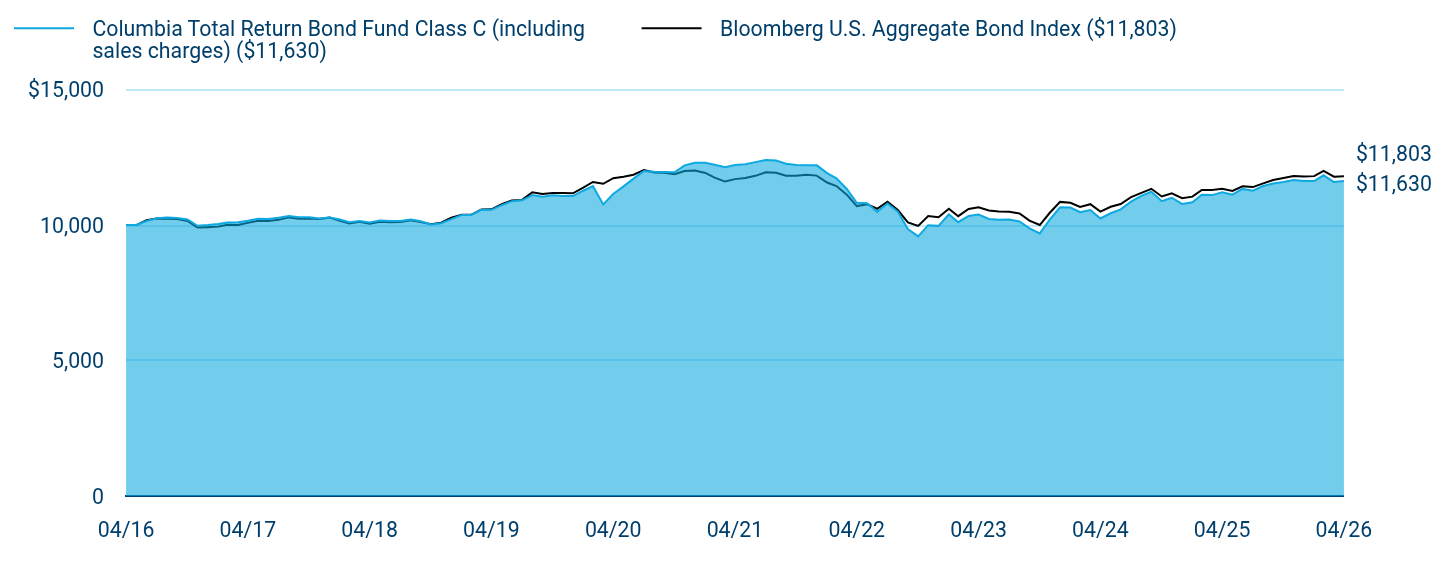
Table Summary
|
Columbia Total Return Bond Fund Class C (including sales charges) ($11,630) |
Bloomberg U.S. Aggregate Bond Index ($11,803) |
04/16 |
$10,000 |
$10,000 |
05/16 |
$10,006 |
$10,003 |
06/16 |
$10,151 |
$10,182 |
07/16 |
$10,252 |
$10,247 |
08/16 |
$10,278 |
$10,235 |
09/16 |
$10,260 |
$10,229 |
10/16 |
$10,208 |
$10,151 |
11/16 |
$9,974 |
$9,911 |
12/16 |
$10,003 |
$9,925 |
01/17 |
$10,043 |
$9,944 |
02/17 |
$10,100 |
$10,011 |
03/17 |
$10,103 |
$10,006 |
04/17 |
$10,161 |
$10,083 |
05/17 |
$10,232 |
$10,160 |
06/17 |
$10,224 |
$10,150 |
07/17 |
$10,275 |
$10,194 |
08/17 |
$10,337 |
$10,285 |
09/17 |
$10,286 |
$10,236 |
10/17 |
$10,289 |
$10,242 |
11/17 |
$10,248 |
$10,229 |
12/17 |
$10,284 |
$10,276 |
01/18 |
$10,206 |
$10,158 |
02/18 |
$10,105 |
$10,061 |
03/18 |
$10,151 |
$10,126 |
04/18 |
$10,093 |
$10,051 |
05/18 |
$10,172 |
$10,122 |
06/18 |
$10,149 |
$10,110 |
07/18 |
$10,149 |
$10,112 |
08/18 |
$10,208 |
$10,177 |
09/18 |
$10,143 |
$10,112 |
10/18 |
$10,022 |
$10,032 |
11/18 |
$10,070 |
$10,092 |
12/18 |
$10,219 |
$10,277 |
01/19 |
$10,376 |
$10,386 |
02/19 |
$10,373 |
$10,380 |
03/19 |
$10,567 |
$10,580 |
04/19 |
$10,564 |
$10,582 |
05/19 |
$10,735 |
$10,770 |
06/19 |
$10,884 |
$10,906 |
07/19 |
$10,916 |
$10,930 |
08/19 |
$11,112 |
$11,213 |
09/19 |
$11,051 |
$11,153 |
10/19 |
$11,098 |
$11,187 |
11/19 |
$11,073 |
$11,181 |
12/19 |
$11,072 |
$11,173 |
01/20 |
$11,269 |
$11,388 |
02/20 |
$11,438 |
$11,593 |
03/20 |
$10,764 |
$11,525 |
04/20 |
$11,150 |
$11,730 |
05/20 |
$11,431 |
$11,784 |
06/20 |
$11,715 |
$11,859 |
07/20 |
$11,998 |
$12,036 |
08/20 |
$11,967 |
$11,939 |
09/20 |
$11,957 |
$11,932 |
10/20 |
$11,950 |
$11,879 |
11/20 |
$12,206 |
$11,995 |
12/20 |
$12,302 |
$12,012 |
01/21 |
$12,304 |
$11,926 |
02/21 |
$12,226 |
$11,753 |
03/21 |
$12,134 |
$11,607 |
04/21 |
$12,218 |
$11,698 |
05/21 |
$12,247 |
$11,737 |
06/21 |
$12,325 |
$11,819 |
07/21 |
$12,403 |
$11,951 |
08/21 |
$12,386 |
$11,929 |
09/21 |
$12,263 |
$11,825 |
10/21 |
$12,216 |
$11,822 |
11/21 |
$12,206 |
$11,857 |
12/21 |
$12,206 |
$11,827 |
01/22 |
$11,920 |
$11,572 |
02/22 |
$11,727 |
$11,443 |
03/22 |
$11,333 |
$11,125 |
04/22 |
$10,823 |
$10,703 |
05/22 |
$10,806 |
$10,772 |
06/22 |
$10,490 |
$10,603 |
07/22 |
$10,798 |
$10,862 |
08/22 |
$10,499 |
$10,555 |
09/22 |
$9,858 |
$10,099 |
10/22 |
$9,587 |
$9,968 |
11/22 |
$9,997 |
$10,335 |
12/22 |
$9,972 |
$10,288 |
01/23 |
$10,396 |
$10,604 |
02/23 |
$10,107 |
$10,330 |
03/23 |
$10,340 |
$10,593 |
04/23 |
$10,391 |
$10,657 |
05/23 |
$10,229 |
$10,541 |
06/23 |
$10,201 |
$10,503 |
07/23 |
$10,208 |
$10,496 |
08/23 |
$10,135 |
$10,429 |
09/23 |
$9,882 |
$10,164 |
10/23 |
$9,693 |
$10,003 |
11/23 |
$10,207 |
$10,456 |
12/23 |
$10,656 |
$10,857 |
01/24 |
$10,646 |
$10,827 |
02/24 |
$10,475 |
$10,674 |
03/24 |
$10,556 |
$10,773 |
04/24 |
$10,244 |
$10,500 |
05/24 |
$10,438 |
$10,678 |
06/24 |
$10,582 |
$10,780 |
07/24 |
$10,866 |
$11,031 |
08/24 |
$11,080 |
$11,190 |
09/24 |
$11,232 |
$11,340 |
10/24 |
$10,885 |
$11,058 |
11/24 |
$11,010 |
$11,175 |
12/24 |
$10,783 |
$10,992 |
01/25 |
$10,845 |
$11,051 |
02/25 |
$11,122 |
$11,294 |
03/25 |
$11,108 |
$11,298 |
04/25 |
$11,216 |
$11,343 |
05/25 |
$11,122 |
$11,261 |
06/25 |
$11,336 |
$11,435 |
07/25 |
$11,269 |
$11,404 |
08/25 |
$11,443 |
$11,541 |
09/25 |
$11,535 |
$11,667 |
10/25 |
$11,595 |
$11,740 |
11/25 |
$11,669 |
$11,813 |
12/25 |
$11,625 |
$11,795 |
01/26 |
$11,624 |
$11,808 |
02/26 |
$11,839 |
$12,001 |
03/26 |
$11,591 |
$11,789 |
04/26 |
$11,630 |
$11,803 |
|
| Average Annual Return [Table Text Block] |
Table Summary
Average Annual Total Returns (%) |
1 year |
5 years |
10 years |
Class C (excluding sales charges) |
3.69 |
(0.98) |
1.52 |
Class C (including sales charges) |
2.69 |
(0.98) |
1.52 |
Bloomberg U.S. Aggregate Bond Index |
4.06 |
0.18 |
1.67 | |
| No Deduction of Taxes [Text Block] |
Performance does not reflect the deduction of taxes that a shareholder may pay on fund distributions or on the redemptions of fund shares.
|
| Updated Performance Information Location [Text Block] |
columbiathreadneedleus.com/investment-products/mutual-funds
|
| AssetsNet |
$ 3,152,583,318
|
| Holdings Count | Holding |
1,224
|
| Advisory Fees Paid, Amount |
$ 14,208,602
|
| InvestmentCompanyPortfolioTurnover |
222.00%
|
| Additional Fund Statistics [Text Block] |
Table Summary
Fund net assets |
$3,152,583,318 |
Total number of portfolio holdings |
1,224 |
Management services fees (represents 0.48% of Fund average net assets) |
$14,208,602 |
Portfolio turnover for the reporting period |
222% |
Portfolio turnover as of the end of the period excluding transactions in to be announced securities |
61% | |
| Holdings [Text Block] |
Table Summary
|
Long |
Credit Risk |
2.8% |
Interest Rate Risk |
59.6% |
|
Short |
Credit Risk |
1.1% |
Interest Rate Risk |
44.6% |
Table Summary
Residential Mortgage-Backed Securities - Agency |
37.2% |
Corporate Bonds & Notes |
22.4% |
Residential Mortgage-Backed Securities - Non-Agency |
15.6% |
Asset-Backed Securities - Non-Agency |
11.2% |
Money Market Funds |
9.2% |
Foreign Government Obligations |
5.6% |
Senior Loans |
5.2% |
Other |
1.7% | |
| Material Fund Change [Text Block] |
|
| C000032986 |
|
| Shareholder Report [Line Items] |
|
| Fund Name |
Columbia Total Return Bond Fund
|
| Class Name |
Class R
|
| Trading Symbol |
CIBRX
|
| Annual or Semi-Annual Statement [Text Block] |
This annual shareholder report contains important information about Columbia Total Return Bond Fund (the Fund) for the period of May 1, 2025 to April 30, 2026.
|
| Additional Information [Text Block] |
You can find additional information about the Fund at columbiathreadneedleus.com/resources/literature. You can also request more information by contacting us at 1-800-345-6611.
|
| Additional Information Phone Number |
1-800-345-6611
|
| Additional Information Website |
columbiathreadneedleus.com/resources/literature
|
| Expenses [Text Block] |
What were the Fund costs for the reporting period? (Based on a hypothetical $10,000 investment)
Table Summary
Class |
Cost of a $10,000 investment |
Cost paid as a percentage of a $10,000 investment |
Class R |
$101 |
0.99% | |
| Expenses Paid, Amount |
$ 101
|
| Expense Ratio, Percent |
0.99%
|
| Factors Affecting Performance [Text Block] |
Management's Discussion of Fund Performance The performance of Class R shares for the period presented is shown in the Average Annual Total Returns table. Top Performance ContributorsAgency mortgages | An overweight allocation to agency mortgage-backed securities was most positive for the Fund’s performance. Strong carry, supportive asset class technicals and valuations remained attractive during the period. Spreads tightened through the period, resulting in the Fund’s positive performance. Consumer-based credit | Exposure to consumer-based credit proved beneficial, led by holdings of non-agency mortgage-backed securities, as housing fundamentals remained relatively strong and borrower delinquencies remained low. Commercial mortgage-backed securities | Selection within commercial mortgage-backed securities was positive for the Fund’s performance. The asset class saw spreads tighten throughout the period as individual issuer selection contributed to overall performance. High-yield corporate bonds | An out-of-benchmark allocation to high-yield bonds and bank loans positively contributed to the Fund’s overall performance. Top Performance DetractorsDuration | The Fund’s generally overweight duration exposure detracted from the Fund's performance during periods when market bond yields rose. Investment-grade corporates | The Fund’s underweight allocation to investment-grade corporate debt was a detractor from the Fund’s overall performance as the asset class had positive relative performance, which negatively impacted the Fund's performance. ABS/CLOs | An allocation to asset-backed securities (ABS) and collateralized loan obligations (CLOs) marginally detracted from the Fund’s overall performance. Smaller compression effects in CLOs and ABS, relative to tightening seen in other asset classes, created a slight negative effect on the Fund’s overall performance. |
| Performance Past Does Not Indicate Future [Text] |
The Fund's past performance is not a good predictor of the Fund's future performance.
|
| Line Graph [Table Text Block] |
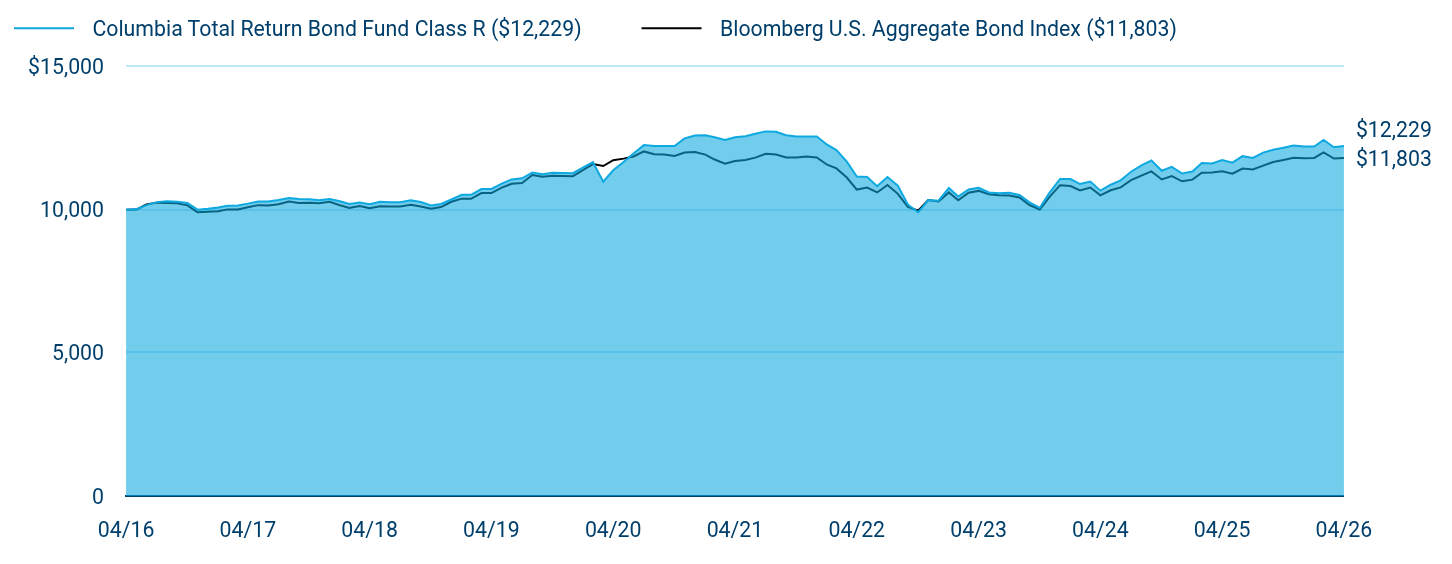
Table Summary
|
Columbia Total Return Bond Fund Class R ($12,229) |
Bloomberg U.S. Aggregate Bond Index ($11,803) |
04/16 |
$10,000 |
$10,000 |
05/16 |
$10,021 |
$10,003 |
06/16 |
$10,159 |
$10,182 |
07/16 |
$10,265 |
$10,247 |
08/16 |
$10,296 |
$10,235 |
09/16 |
$10,281 |
$10,229 |
10/16 |
$10,234 |
$10,151 |
11/16 |
$10,003 |
$9,911 |
12/16 |
$10,037 |
$9,925 |
01/17 |
$10,081 |
$9,944 |
02/17 |
$10,142 |
$10,011 |
03/17 |
$10,149 |
$10,006 |
04/17 |
$10,212 |
$10,083 |
05/17 |
$10,288 |
$10,160 |
06/17 |
$10,283 |
$10,150 |
07/17 |
$10,339 |
$10,194 |
08/17 |
$10,406 |
$10,285 |
09/17 |
$10,370 |
$10,236 |
10/17 |
$10,366 |
$10,242 |
11/17 |
$10,330 |
$10,229 |
12/17 |
$10,370 |
$10,276 |
01/18 |
$10,296 |
$10,158 |
02/18 |
$10,198 |
$10,061 |
03/18 |
$10,249 |
$10,126 |
04/18 |
$10,194 |
$10,051 |
05/18 |
$10,279 |
$10,122 |
06/18 |
$10,259 |
$10,110 |
07/18 |
$10,264 |
$10,112 |
08/18 |
$10,327 |
$10,177 |
09/18 |
$10,266 |
$10,112 |
10/18 |
$10,149 |
$10,032 |
11/18 |
$10,201 |
$10,092 |
12/18 |
$10,357 |
$10,277 |
01/19 |
$10,520 |
$10,386 |
02/19 |
$10,521 |
$10,380 |
03/19 |
$10,722 |
$10,580 |
04/19 |
$10,724 |
$10,582 |
05/19 |
$10,914 |
$10,770 |
06/19 |
$11,058 |
$10,906 |
07/19 |
$11,095 |
$10,930 |
08/19 |
$11,299 |
$11,213 |
09/19 |
$11,242 |
$11,153 |
10/19 |
$11,294 |
$11,187 |
11/19 |
$11,285 |
$11,181 |
12/19 |
$11,277 |
$11,173 |
01/20 |
$11,483 |
$11,388 |
02/20 |
$11,659 |
$11,593 |
03/20 |
$10,977 |
$11,525 |
04/20 |
$11,375 |
$11,730 |
05/20 |
$11,667 |
$11,784 |
06/20 |
$11,961 |
$11,859 |
07/20 |
$12,256 |
$12,036 |
08/20 |
$12,229 |
$11,939 |
09/20 |
$12,227 |
$11,932 |
10/20 |
$12,225 |
$11,879 |
11/20 |
$12,492 |
$11,995 |
12/20 |
$12,595 |
$12,012 |
01/21 |
$12,602 |
$11,926 |
02/21 |
$12,528 |
$11,753 |
03/21 |
$12,439 |
$11,607 |
04/21 |
$12,530 |
$11,698 |
05/21 |
$12,565 |
$11,737 |
06/21 |
$12,650 |
$11,819 |
07/21 |
$12,736 |
$11,951 |
08/21 |
$12,724 |
$11,929 |
09/21 |
$12,603 |
$11,825 |
10/21 |
$12,560 |
$11,822 |
11/21 |
$12,555 |
$11,857 |
12/21 |
$12,560 |
$11,827 |
01/22 |
$12,271 |
$11,572 |
02/22 |
$12,081 |
$11,443 |
03/22 |
$11,677 |
$11,125 |
04/22 |
$11,159 |
$10,703 |
05/22 |
$11,143 |
$10,772 |
06/22 |
$10,822 |
$10,603 |
07/22 |
$11,144 |
$10,862 |
08/22 |
$10,841 |
$10,555 |
09/22 |
$10,184 |
$10,099 |
10/22 |
$9,907 |
$9,968 |
11/22 |
$10,335 |
$10,335 |
12/22 |
$10,313 |
$10,288 |
01/23 |
$10,757 |
$10,604 |
02/23 |
$10,461 |
$10,330 |
03/23 |
$10,707 |
$10,593 |
04/23 |
$10,765 |
$10,657 |
05/23 |
$10,601 |
$10,541 |
06/23 |
$10,576 |
$10,503 |
07/23 |
$10,588 |
$10,496 |
08/23 |
$10,517 |
$10,429 |
09/23 |
$10,259 |
$10,164 |
10/23 |
$10,067 |
$10,003 |
11/23 |
$10,605 |
$10,456 |
12/23 |
$11,076 |
$10,857 |
01/24 |
$11,070 |
$10,827 |
02/24 |
$10,897 |
$10,674 |
03/24 |
$10,986 |
$10,773 |
04/24 |
$10,666 |
$10,500 |
05/24 |
$10,872 |
$10,678 |
06/24 |
$11,027 |
$10,780 |
07/24 |
$11,327 |
$11,031 |
08/24 |
$11,551 |
$11,190 |
09/24 |
$11,718 |
$11,340 |
10/24 |
$11,361 |
$11,058 |
11/24 |
$11,496 |
$11,175 |
12/24 |
$11,265 |
$10,992 |
01/25 |
$11,334 |
$11,051 |
02/25 |
$11,628 |
$11,294 |
03/25 |
$11,618 |
$11,298 |
04/25 |
$11,736 |
$11,343 |
05/25 |
$11,642 |
$11,261 |
06/25 |
$11,871 |
$11,435 |
07/25 |
$11,806 |
$11,404 |
08/25 |
$11,993 |
$11,541 |
09/25 |
$12,095 |
$11,667 |
10/25 |
$12,163 |
$11,740 |
11/25 |
$12,245 |
$11,813 |
12/25 |
$12,205 |
$11,795 |
01/26 |
$12,208 |
$11,808 |
02/26 |
$12,439 |
$12,001 |
03/26 |
$12,183 |
$11,789 |
04/26 |
$12,229 |
$11,803 |
|
| Average Annual Return [Table Text Block] |
Table Summary
Average Annual Total Returns (%) |
1 year |
5 years |
10 years |
Class R |
4.20 |
(0.48) |
2.03 |
Bloomberg U.S. Aggregate Bond Index |
4.06 |
0.18 |
1.67 | |
| No Deduction of Taxes [Text Block] |
Performance does not reflect the deduction of taxes that a shareholder may pay on fund distributions or on the redemptions of fund shares.
|
| Updated Performance Information Location [Text Block] |
columbiathreadneedleus.com/investment-products/mutual-funds
|
| AssetsNet |
$ 3,152,583,318
|
| Holdings Count | Holding |
1,224
|
| Advisory Fees Paid, Amount |
$ 14,208,602
|
| InvestmentCompanyPortfolioTurnover |
222.00%
|
| Additional Fund Statistics [Text Block] |
Table Summary
Fund net assets |
$3,152,583,318 |
Total number of portfolio holdings |
1,224 |
Management services fees (represents 0.48% of Fund average net assets) |
$14,208,602 |
Portfolio turnover for the reporting period |
222% |
Portfolio turnover as of the end of the period excluding transactions in to be announced securities |
61% | |
| Holdings [Text Block] |
Table Summary
|
Long |
Credit Risk |
2.8% |
Interest Rate Risk |
59.6% |
|
Short |
Credit Risk |
1.1% |
Interest Rate Risk |
44.6% |
Table Summary
Residential Mortgage-Backed Securities - Agency |
37.2% |
Corporate Bonds & Notes |
22.4% |
Residential Mortgage-Backed Securities - Non-Agency |
15.6% |
Asset-Backed Securities - Non-Agency |
11.2% |
Money Market Funds |
9.2% |
Foreign Government Obligations |
5.6% |
Senior Loans |
5.2% |
Other |
1.7% | |
| Material Fund Change [Text Block] |
|
| C000255092 |
|
| Shareholder Report [Line Items] |
|
| Fund Name |
Columbia Total Return Bond Fund
|
| Class Name |
Class S
|
| Trading Symbol |
SRBAX
|
| Annual or Semi-Annual Statement [Text Block] |
This annual shareholder report contains important information about Columbia Total Return Bond Fund (the Fund) for the period of May 1, 2025 to April 30, 2026.
|
| Additional Information [Text Block] |
You can find additional information about the Fund at columbiathreadneedleus.com/resources/literature. You can also request more information by contacting us at 1-800-345-6611.
|
| Additional Information Phone Number |
1-800-345-6611
|
| Additional Information Website |
columbiathreadneedleus.com/resources/literature
|
| Expenses [Text Block] |
What were the Fund costs for the reporting period? (Based on a hypothetical $10,000 investment)
Table Summary
Class |
Cost of a $10,000 investment |
Cost paid as a percentage of a $10,000 investment |
Class S |
$50 |
0.49% | |
| Expenses Paid, Amount |
$ 50
|
| Expense Ratio, Percent |
0.49%
|
| Factors Affecting Performance [Text Block] |
Management's Discussion of Fund Performance The performance of Class S shares for the period presented is shown in the Average Annual Total Returns table. Top Performance ContributorsAgency mortgages | An overweight allocation to agency mortgage-backed securities was most positive for the Fund’s performance. Strong carry, supportive asset class technicals and valuations remained attractive during the period. Spreads tightened through the period, resulting in the Fund’s positive performance. Consumer-based credit | Exposure to consumer-based credit proved beneficial, led by holdings of non-agency mortgage-backed securities, as housing fundamentals remained relatively strong and borrower delinquencies remained low. Commercial mortgage-backed securities | Selection within commercial mortgage-backed securities was positive for the Fund’s performance. The asset class saw spreads tighten throughout the period as individual issuer selection contributed to overall performance. High-yield corporate bonds | An out-of-benchmark allocation to high-yield bonds and bank loans positively contributed to the Fund’s overall performance. Top Performance DetractorsDuration | The Fund’s generally overweight duration exposure detracted from the Fund's performance during periods when market bond yields rose. Investment-grade corporates | The Fund’s underweight allocation to investment-grade corporate debt was a detractor from the Fund’s overall performance as the asset class had positive relative performance, which negatively impacted the Fund's performance. ABS/CLOs | An allocation to asset-backed securities (ABS) and collateralized loan obligations (CLOs) marginally detracted from the Fund’s overall performance. Smaller compression effects in CLOs and ABS, relative to tightening seen in other asset classes, created a slight negative effect on the Fund’s overall performance. |
| Performance Past Does Not Indicate Future [Text] |
The Fund's past performance is not a good predictor of the Fund's future performance.
|
| Line Graph [Table Text Block] |
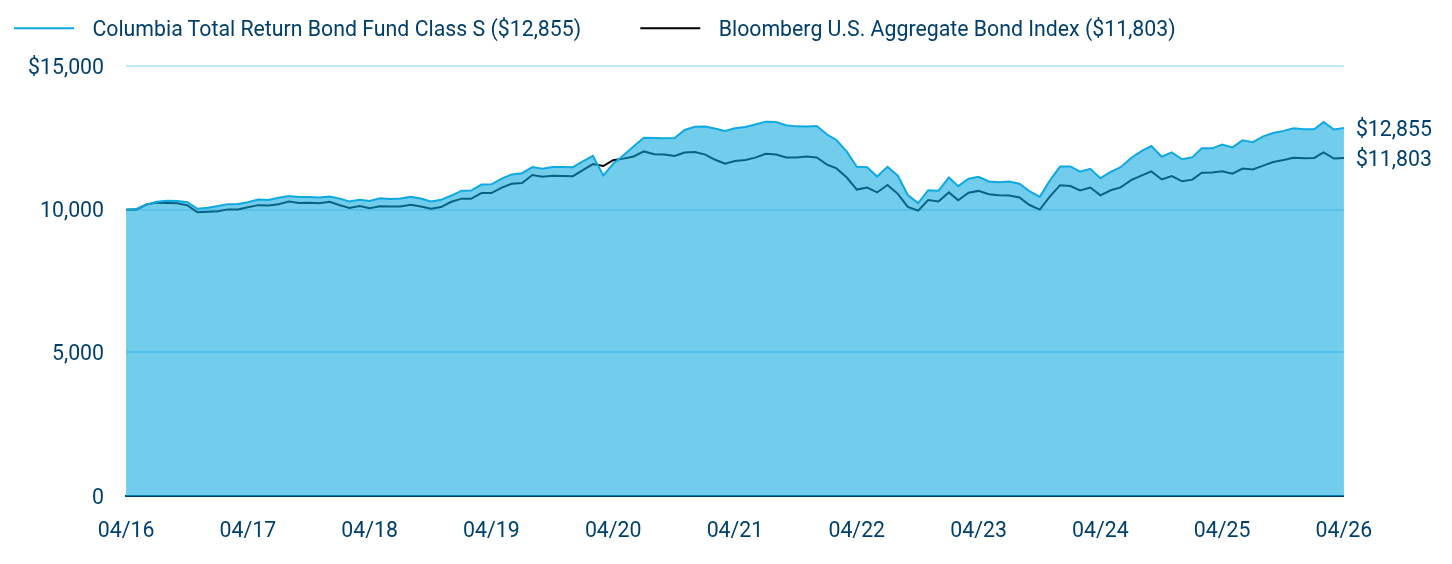
Table Summary
|
Columbia Total Return Bond Fund Class S ($12,855) |
Bloomberg U.S. Aggregate Bond Index ($11,803) |
04/16 |
$10,000 |
$10,000 |
05/16 |
$10,025 |
$10,003 |
06/16 |
$10,179 |
$10,182 |
07/16 |
$10,278 |
$10,247 |
08/16 |
$10,313 |
$10,235 |
09/16 |
$10,303 |
$10,229 |
10/16 |
$10,260 |
$10,151 |
11/16 |
$10,033 |
$9,911 |
12/16 |
$10,071 |
$9,925 |
01/17 |
$10,130 |
$9,944 |
02/17 |
$10,195 |
$10,011 |
03/17 |
$10,196 |
$10,006 |
04/17 |
$10,263 |
$10,083 |
05/17 |
$10,355 |
$10,160 |
06/17 |
$10,343 |
$10,150 |
07/17 |
$10,416 |
$10,194 |
08/17 |
$10,476 |
$10,285 |
09/17 |
$10,444 |
$10,236 |
10/17 |
$10,444 |
$10,242 |
11/17 |
$10,423 |
$10,229 |
12/17 |
$10,457 |
$10,276 |
01/18 |
$10,387 |
$10,158 |
02/18 |
$10,291 |
$10,061 |
03/18 |
$10,347 |
$10,126 |
04/18 |
$10,308 |
$10,051 |
05/18 |
$10,398 |
$10,122 |
06/18 |
$10,371 |
$10,110 |
07/18 |
$10,391 |
$10,112 |
08/18 |
$10,448 |
$10,177 |
09/18 |
$10,391 |
$10,112 |
10/18 |
$10,288 |
$10,032 |
11/18 |
$10,346 |
$10,092 |
12/18 |
$10,495 |
$10,277 |
01/19 |
$10,666 |
$10,386 |
02/19 |
$10,671 |
$10,380 |
03/19 |
$10,879 |
$10,580 |
04/19 |
$10,885 |
$10,582 |
05/19 |
$11,083 |
$10,770 |
06/19 |
$11,233 |
$10,906 |
07/19 |
$11,276 |
$10,930 |
08/19 |
$11,488 |
$11,213 |
09/19 |
$11,435 |
$11,153 |
10/19 |
$11,493 |
$11,187 |
11/19 |
$11,488 |
$11,181 |
12/19 |
$11,485 |
$11,173 |
01/20 |
$11,699 |
$11,388 |
02/20 |
$11,884 |
$11,593 |
03/20 |
$11,193 |
$11,525 |
04/20 |
$11,604 |
$11,730 |
05/20 |
$11,906 |
$11,784 |
06/20 |
$12,211 |
$11,859 |
07/20 |
$12,517 |
$12,036 |
08/20 |
$12,508 |
$11,939 |
09/20 |
$12,499 |
$11,932 |
10/20 |
$12,505 |
$11,879 |
11/20 |
$12,784 |
$11,995 |
12/20 |
$12,894 |
$12,012 |
01/21 |
$12,907 |
$11,926 |
02/21 |
$12,836 |
$11,753 |
03/21 |
$12,750 |
$11,607 |
04/21 |
$12,845 |
$11,698 |
05/21 |
$12,890 |
$11,737 |
06/21 |
$12,979 |
$11,819 |
07/21 |
$13,076 |
$11,951 |
08/21 |
$13,066 |
$11,929 |
09/21 |
$12,950 |
$11,825 |
10/21 |
$12,911 |
$11,822 |
11/21 |
$12,909 |
$11,857 |
12/21 |
$12,923 |
$11,827 |
01/22 |
$12,627 |
$11,572 |
02/22 |
$12,436 |
$11,443 |
03/22 |
$12,029 |
$11,125 |
04/22 |
$11,498 |
$10,703 |
05/22 |
$11,486 |
$10,772 |
06/22 |
$11,159 |
$10,603 |
07/22 |
$11,499 |
$10,862 |
08/22 |
$11,188 |
$10,555 |
09/22 |
$10,514 |
$10,099 |
10/22 |
$10,233 |
$9,968 |
11/22 |
$10,680 |
$10,335 |
12/22 |
$10,665 |
$10,288 |
01/23 |
$11,128 |
$10,604 |
02/23 |
$10,824 |
$10,330 |
03/23 |
$11,083 |
$10,593 |
04/23 |
$11,150 |
$10,657 |
05/23 |
$10,986 |
$10,541 |
06/23 |
$10,961 |
$10,503 |
07/23 |
$10,981 |
$10,496 |
08/23 |
$10,908 |
$10,429 |
09/23 |
$10,645 |
$10,164 |
10/23 |
$10,451 |
$10,003 |
11/23 |
$11,014 |
$10,456 |
12/23 |
$11,507 |
$10,857 |
01/24 |
$11,510 |
$10,827 |
02/24 |
$11,331 |
$10,674 |
03/24 |
$11,431 |
$10,773 |
04/24 |
$11,103 |
$10,500 |
05/24 |
$11,323 |
$10,678 |
06/24 |
$11,485 |
$10,780 |
07/24 |
$11,806 |
$11,031 |
08/24 |
$12,045 |
$11,190 |
09/24 |
$12,224 |
$11,340 |
10/24 |
$11,852 |
$11,058 |
11/24 |
$12,000 |
$11,175 |
12/24 |
$11,763 |
$10,992 |
01/25 |
$11,836 |
$11,051 |
02/25 |
$12,148 |
$11,294 |
03/25 |
$12,143 |
$11,298 |
04/25 |
$12,275 |
$11,343 |
05/25 |
$12,178 |
$11,261 |
06/25 |
$12,422 |
$11,435 |
07/25 |
$12,360 |
$11,404 |
08/25 |
$12,561 |
$11,541 |
09/25 |
$12,677 |
$11,667 |
10/25 |
$12,754 |
$11,740 |
11/25 |
$12,841 |
$11,813 |
12/25 |
$12,808 |
$11,795 |
01/26 |
$12,813 |
$11,808 |
02/26 |
$13,061 |
$12,001 |
03/26 |
$12,801 |
$11,789 |
04/26 |
$12,855 |
$11,803 |
|
| Average Annual Return [Table Text Block] |
Table Summary
Average Annual Total Returns (%) |
1 year |
5 years |
10 years |
Class SFootnote Reference(a) |
4.72 |
0.02 |
2.54 |
Bloomberg U.S. Aggregate Bond Index |
4.06 |
0.18 |
1.67 | |
| No Deduction of Taxes [Text Block] |
Performance does not reflect the deduction of taxes that a shareholder may pay on fund distributions or on the redemptions of fund shares.
|
| Updated Performance Information Location [Text Block] |
columbiathreadneedleus.com/investment-products/mutual-funds
|
| AssetsNet |
$ 3,152,583,318
|
| Holdings Count | Holding |
1,224
|
| Advisory Fees Paid, Amount |
$ 14,208,602
|
| InvestmentCompanyPortfolioTurnover |
222.00%
|
| Additional Fund Statistics [Text Block] |
Table Summary
Fund net assets |
$3,152,583,318 |
Total number of portfolio holdings |
1,224 |
Management services fees (represents 0.48% of Fund average net assets) |
$14,208,602 |
Portfolio turnover for the reporting period |
222% |
Portfolio turnover as of the end of the period excluding transactions in to be announced securities |
61% | |
| Holdings [Text Block] |
Table Summary
|
Long |
Credit Risk |
2.8% |
Interest Rate Risk |
59.6% |
|
Short |
Credit Risk |
1.1% |
Interest Rate Risk |
44.6% |
Table Summary
Residential Mortgage-Backed Securities - Agency |
37.2% |
Corporate Bonds & Notes |
22.4% |
Residential Mortgage-Backed Securities - Non-Agency |
15.6% |
Asset-Backed Securities - Non-Agency |
11.2% |
Money Market Funds |
9.2% |
Foreign Government Obligations |
5.6% |
Senior Loans |
5.2% |
Other |
1.7% | |
| Material Fund Change [Text Block] |
|
| C000121794 |
|
| Shareholder Report [Line Items] |
|
| Fund Name |
Columbia Total Return Bond Fund
|
| Class Name |
Institutional 2 Class
|
| Trading Symbol |
CTBRX
|
| Annual or Semi-Annual Statement [Text Block] |
This annual shareholder report contains important information about Columbia Total Return Bond Fund (the Fund) for the period of May 1, 2025 to April 30, 2026.
|
| Additional Information [Text Block] |
You can find additional information about the Fund at columbiathreadneedleus.com/resources/literature. You can also request more information by contacting us at 1-800-345-6611.
|
| Additional Information Phone Number |
1-800-345-6611
|
| Additional Information Website |
columbiathreadneedleus.com/resources/literature
|
| Expenses [Text Block] |
What were the Fund costs for the reporting period? (Based on a hypothetical $10,000 investment)
Table Summary
Class |
Cost of a $10,000 investment |
Cost paid as a percentage of a $10,000 investment |
Institutional 2 Class |
$42 |
0.41% | |
| Expenses Paid, Amount |
$ 42
|
| Expense Ratio, Percent |
0.41%
|
| Factors Affecting Performance [Text Block] |
Management's Discussion of Fund Performance The performance of Institutional 2 Class shares for the period presented is shown in the Average Annual Total Returns table. Top Performance ContributorsAgency mortgages | An overweight allocation to agency mortgage-backed securities was most positive for the Fund’s performance. Strong carry, supportive asset class technicals and valuations remained attractive during the period. Spreads tightened through the period, resulting in the Fund’s positive performance. Consumer-based credit | Exposure to consumer-based credit proved beneficial, led by holdings of non-agency mortgage-backed securities, as housing fundamentals remained relatively strong and borrower delinquencies remained low. Commercial mortgage-backed securities | Selection within commercial mortgage-backed securities was positive for the Fund’s performance. The asset class saw spreads tighten throughout the period as individual issuer selection contributed to overall performance. High-yield corporate bonds | An out-of-benchmark allocation to high-yield bonds and bank loans positively contributed to the Fund’s overall performance. Top Performance DetractorsDuration | The Fund’s generally overweight duration exposure detracted from the Fund's performance during periods when market bond yields rose. Investment-grade corporates | The Fund’s underweight allocation to investment-grade corporate debt was a detractor from the Fund’s overall performance as the asset class had positive relative performance, which negatively impacted the Fund's performance. ABS/CLOs | An allocation to asset-backed securities (ABS) and collateralized loan obligations (CLOs) marginally detracted from the Fund’s overall performance. Smaller compression effects in CLOs and ABS, relative to tightening seen in other asset classes, created a slight negative effect on the Fund’s overall performance. |
| Performance Past Does Not Indicate Future [Text] |
The Fund's past performance is not a good predictor of the Fund's future performance.
|
| Line Graph [Table Text Block] |

Table Summary
|
Columbia Total Return Bond Fund Institutional 2 Class ($12,952) |
Bloomberg U.S. Aggregate Bond Index ($11,803) |
04/16 |
$10,000 |
$10,000 |
05/16 |
$10,026 |
$10,003 |
06/16 |
$10,180 |
$10,182 |
07/16 |
$10,291 |
$10,247 |
08/16 |
$10,327 |
$10,235 |
09/16 |
$10,317 |
$10,229 |
10/16 |
$10,263 |
$10,151 |
11/16 |
$10,047 |
$9,911 |
12/16 |
$10,086 |
$9,925 |
01/17 |
$10,134 |
$9,944 |
02/17 |
$10,200 |
$10,011 |
03/17 |
$10,212 |
$10,006 |
04/17 |
$10,279 |
$10,083 |
05/17 |
$10,361 |
$10,160 |
06/17 |
$10,361 |
$10,150 |
07/17 |
$10,422 |
$10,194 |
08/17 |
$10,494 |
$10,285 |
09/17 |
$10,452 |
$10,236 |
10/17 |
$10,464 |
$10,242 |
11/17 |
$10,432 |
$10,229 |
12/17 |
$10,478 |
$10,276 |
01/18 |
$10,408 |
$10,158 |
02/18 |
$10,313 |
$10,061 |
03/18 |
$10,369 |
$10,126 |
04/18 |
$10,319 |
$10,051 |
05/18 |
$10,409 |
$10,122 |
06/18 |
$10,394 |
$10,110 |
07/18 |
$10,403 |
$10,112 |
08/18 |
$10,473 |
$10,177 |
09/18 |
$10,416 |
$10,112 |
10/18 |
$10,302 |
$10,032 |
11/18 |
$10,361 |
$10,092 |
12/18 |
$10,512 |
$10,277 |
01/19 |
$10,683 |
$10,386 |
02/19 |
$10,689 |
$10,380 |
03/19 |
$10,911 |
$10,580 |
04/19 |
$10,918 |
$10,582 |
05/19 |
$11,105 |
$10,770 |
06/19 |
$11,269 |
$10,906 |
07/19 |
$11,313 |
$10,930 |
08/19 |
$11,527 |
$11,213 |
09/19 |
$11,473 |
$11,153 |
10/19 |
$11,533 |
$11,187 |
11/19 |
$11,516 |
$11,181 |
12/19 |
$11,514 |
$11,173 |
01/20 |
$11,730 |
$11,388 |
02/20 |
$11,916 |
$11,593 |
03/20 |
$11,235 |
$11,525 |
04/20 |
$11,649 |
$11,730 |
05/20 |
$11,940 |
$11,784 |
06/20 |
$12,260 |
$11,859 |
07/20 |
$12,568 |
$12,036 |
08/20 |
$12,547 |
$11,939 |
09/20 |
$12,541 |
$11,932 |
10/20 |
$12,545 |
$11,879 |
11/20 |
$12,829 |
$11,995 |
12/20 |
$12,937 |
$12,012 |
01/21 |
$12,951 |
$11,926 |
02/21 |
$12,883 |
$11,753 |
03/21 |
$12,794 |
$11,607 |
04/21 |
$12,894 |
$11,698 |
05/21 |
$12,936 |
$11,737 |
06/21 |
$13,030 |
$11,819 |
07/21 |
$13,125 |
$11,951 |
08/21 |
$13,118 |
$11,929 |
09/21 |
$13,003 |
$11,825 |
10/21 |
$12,961 |
$11,822 |
11/21 |
$12,962 |
$11,857 |
12/21 |
$12,977 |
$11,827 |
01/22 |
$12,681 |
$11,572 |
02/22 |
$12,489 |
$11,443 |
03/22 |
$12,080 |
$11,125 |
04/22 |
$11,549 |
$10,703 |
05/22 |
$11,538 |
$10,772 |
06/22 |
$11,209 |
$10,603 |
07/22 |
$11,549 |
$10,862 |
08/22 |
$11,240 |
$10,555 |
09/22 |
$10,566 |
$10,099 |
10/22 |
$10,284 |
$9,968 |
11/22 |
$10,730 |
$10,335 |
12/22 |
$10,716 |
$10,288 |
01/23 |
$11,183 |
$10,604 |
02/23 |
$10,877 |
$10,330 |
03/23 |
$11,139 |
$10,593 |
04/23 |
$11,207 |
$10,657 |
05/23 |
$11,042 |
$10,541 |
06/23 |
$11,018 |
$10,503 |
07/23 |
$11,039 |
$10,496 |
08/23 |
$10,966 |
$10,429 |
09/23 |
$10,705 |
$10,164 |
10/23 |
$10,510 |
$10,003 |
11/23 |
$11,074 |
$10,456 |
12/23 |
$11,575 |
$10,857 |
01/24 |
$11,575 |
$10,827 |
02/24 |
$11,395 |
$10,674 |
03/24 |
$11,497 |
$10,773 |
04/24 |
$11,167 |
$10,500 |
05/24 |
$11,389 |
$10,678 |
06/24 |
$11,556 |
$10,780 |
07/24 |
$11,877 |
$11,031 |
08/24 |
$12,118 |
$11,190 |
09/24 |
$12,299 |
$11,340 |
10/24 |
$11,930 |
$11,058 |
11/24 |
$12,077 |
$11,175 |
12/24 |
$11,839 |
$10,992 |
01/25 |
$11,918 |
$11,051 |
02/25 |
$12,229 |
$11,294 |
03/25 |
$12,224 |
$11,298 |
04/25 |
$12,359 |
$11,343 |
05/25 |
$12,265 |
$11,261 |
06/25 |
$12,508 |
$11,435 |
07/25 |
$12,446 |
$11,404 |
08/25 |
$12,650 |
$11,541 |
09/25 |
$12,768 |
$11,667 |
10/25 |
$12,845 |
$11,740 |
11/25 |
$12,935 |
$11,813 |
12/25 |
$12,902 |
$11,795 |
01/26 |
$12,908 |
$11,808 |
02/26 |
$13,158 |
$12,001 |
03/26 |
$12,897 |
$11,789 |
04/26 |
$12,952 |
$11,803 |
|
| Average Annual Return [Table Text Block] |
Table Summary
Average Annual Total Returns (%) |
1 year |
5 years |
10 years |
Institutional 2 Class |
4.81 |
0.09 |
2.62 |
Bloomberg U.S. Aggregate Bond Index |
4.06 |
0.18 |
1.67 | |
| No Deduction of Taxes [Text Block] |
Performance does not reflect the deduction of taxes that a shareholder may pay on fund distributions or on the redemptions of fund shares.
|
| Updated Performance Information Location [Text Block] |
columbiathreadneedleus.com/investment-products/mutual-funds
|
| AssetsNet |
$ 3,152,583,318
|
| Holdings Count | Holding |
1,224
|
| Advisory Fees Paid, Amount |
$ 14,208,602
|
| InvestmentCompanyPortfolioTurnover |
222.00%
|
| Additional Fund Statistics [Text Block] |
Table Summary
Fund net assets |
$3,152,583,318 |
Total number of portfolio holdings |
1,224 |
Management services fees (represents 0.48% of Fund average net assets) |
$14,208,602 |
Portfolio turnover for the reporting period |
222% |
Portfolio turnover as of the end of the period excluding transactions in to be announced securities |
61% | |
| Holdings [Text Block] |
Table Summary
|
Long |
Credit Risk |
2.8% |
Interest Rate Risk |
59.6% |
|
Short |
Credit Risk |
1.1% |
Interest Rate Risk |
44.6% |
Table Summary
Residential Mortgage-Backed Securities - Agency |
37.2% |
Corporate Bonds & Notes |
22.4% |
Residential Mortgage-Backed Securities - Non-Agency |
15.6% |
Asset-Backed Securities - Non-Agency |
11.2% |
Money Market Funds |
9.2% |
Foreign Government Obligations |
5.6% |
Senior Loans |
5.2% |
Other |
1.7% | |
| Material Fund Change [Text Block] |
|
| C000122680 |
|
| Shareholder Report [Line Items] |
|
| Fund Name |
Columbia Total Return Bond Fund
|
| Class Name |
Institutional 3 Class
|
| Trading Symbol |
CTBYX
|
| Annual or Semi-Annual Statement [Text Block] |
This annual shareholder report contains important information about Columbia Total Return Bond Fund (the Fund) for the period of May 1, 2025 to April 30, 2026.
|
| Additional Information [Text Block] |
You can find additional information about the Fund at columbiathreadneedleus.com/resources/literature. You can also request more information by contacting us at 1-800-345-6611.
|
| Additional Information Phone Number |
1-800-345-6611
|
| Additional Information Website |
columbiathreadneedleus.com/resources/literature
|
| Expenses [Text Block] |
What were the Fund costs for the reporting period? (Based on a hypothetical $10,000 investment)
Table Summary
Class |
Cost of a $10,000 investment |
Cost paid as a percentage of a $10,000 investment |
Institutional 3 Class |
$39 |
0.38% | |
| Expenses Paid, Amount |
$ 39
|
| Expense Ratio, Percent |
0.38%
|
| Factors Affecting Performance [Text Block] |
Management's Discussion of Fund Performance The performance of Institutional 3 Class shares for the period presented is shown in the Average Annual Total Returns table. Top Performance ContributorsAgency mortgages | An overweight allocation to agency mortgage-backed securities was most positive for the Fund’s performance. Strong carry, supportive asset class technicals and valuations remained attractive during the period. Spreads tightened through the period, resulting in the Fund’s positive performance. Consumer-based credit | Exposure to consumer-based credit proved beneficial, led by holdings of non-agency mortgage-backed securities, as housing fundamentals remained relatively strong and borrower delinquencies remained low. Commercial mortgage-backed securities | Selection within commercial mortgage-backed securities was positive for the Fund’s performance. The asset class saw spreads tighten throughout the period as individual issuer selection contributed to overall performance. High-yield corporate bonds | An out-of-benchmark allocation to high-yield bonds and bank loans positively contributed to the Fund’s overall performance. Top Performance DetractorsDuration | The Fund’s generally overweight duration exposure detracted from the Fund's performance during periods when market bond yields rose. Investment-grade corporates | The Fund’s underweight allocation to investment-grade corporate debt was a detractor from the Fund’s overall performance as the asset class had positive relative performance, which negatively impacted the Fund's performance. ABS/CLOs | An allocation to asset-backed securities (ABS) and collateralized loan obligations (CLOs) marginally detracted from the Fund’s overall performance. Smaller compression effects in CLOs and ABS, relative to tightening seen in other asset classes, created a slight negative effect on the Fund’s overall performance. |
| Performance Past Does Not Indicate Future [Text] |
The Fund's past performance is not a good predictor of the Fund's future performance.
|
| Line Graph [Table Text Block] |
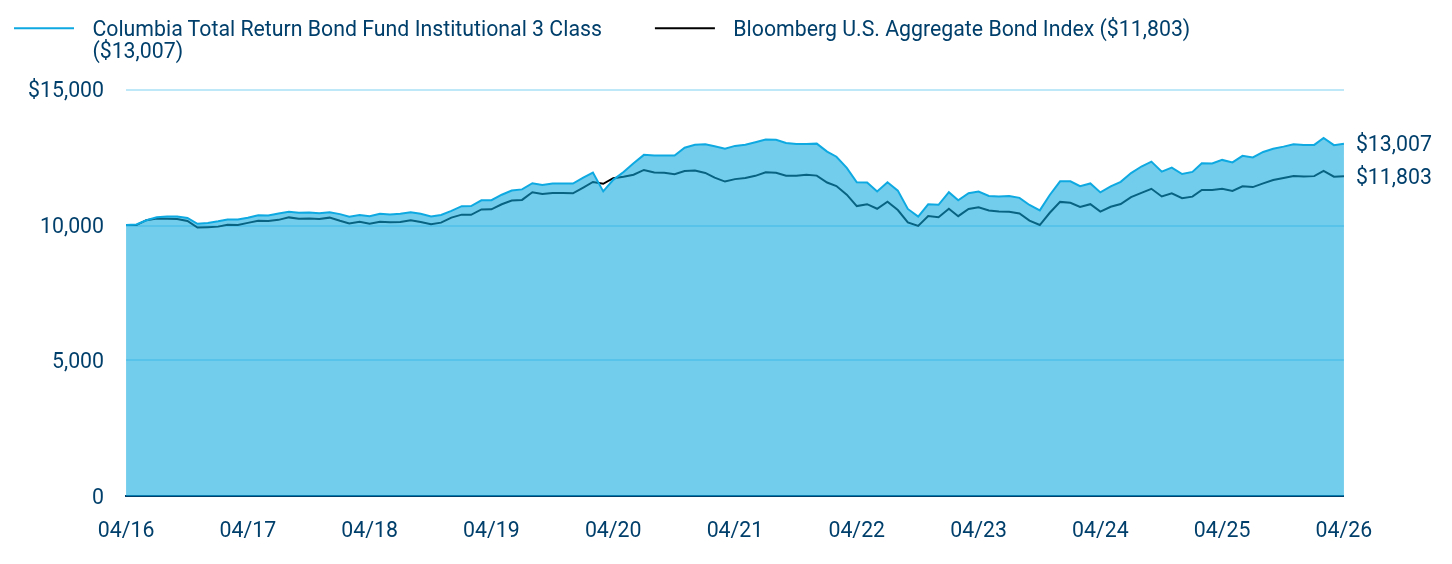
Table Summary
|
Columbia Total Return Bond Fund Institutional 3 Class ($13,007) |
Bloomberg U.S. Aggregate Bond Index ($11,803) |
04/16 |
$10,000 |
$10,000 |
05/16 |
$10,026 |
$10,003 |
06/16 |
$10,181 |
$10,182 |
07/16 |
$10,292 |
$10,247 |
08/16 |
$10,317 |
$10,235 |
09/16 |
$10,319 |
$10,229 |
10/16 |
$10,266 |
$10,151 |
11/16 |
$10,050 |
$9,911 |
12/16 |
$10,078 |
$9,925 |
01/17 |
$10,139 |
$9,944 |
02/17 |
$10,205 |
$10,011 |
03/17 |
$10,206 |
$10,006 |
04/17 |
$10,274 |
$10,083 |
05/17 |
$10,367 |
$10,160 |
06/17 |
$10,356 |
$10,150 |
07/17 |
$10,430 |
$10,194 |
08/17 |
$10,491 |
$10,285 |
09/17 |
$10,460 |
$10,236 |
10/17 |
$10,461 |
$10,242 |
11/17 |
$10,441 |
$10,229 |
12/17 |
$10,476 |
$10,276 |
01/18 |
$10,406 |
$10,158 |
02/18 |
$10,312 |
$10,061 |
03/18 |
$10,369 |
$10,126 |
04/18 |
$10,331 |
$10,051 |
05/18 |
$10,421 |
$10,122 |
06/18 |
$10,395 |
$10,110 |
07/18 |
$10,417 |
$10,112 |
08/18 |
$10,475 |
$10,177 |
09/18 |
$10,418 |
$10,112 |
10/18 |
$10,317 |
$10,032 |
11/18 |
$10,375 |
$10,092 |
12/18 |
$10,527 |
$10,277 |
01/19 |
$10,699 |
$10,386 |
02/19 |
$10,705 |
$10,380 |
03/19 |
$10,915 |
$10,580 |
04/19 |
$10,922 |
$10,582 |
05/19 |
$11,122 |
$10,770 |
06/19 |
$11,274 |
$10,906 |
07/19 |
$11,319 |
$10,930 |
08/19 |
$11,545 |
$11,213 |
09/19 |
$11,480 |
$11,153 |
10/19 |
$11,540 |
$11,187 |
11/19 |
$11,536 |
$11,181 |
12/19 |
$11,534 |
$11,173 |
01/20 |
$11,751 |
$11,388 |
02/20 |
$11,937 |
$11,593 |
03/20 |
$11,245 |
$11,525 |
04/20 |
$11,671 |
$11,730 |
05/20 |
$11,963 |
$11,784 |
06/20 |
$12,284 |
$11,859 |
07/20 |
$12,593 |
$12,036 |
08/20 |
$12,572 |
$11,939 |
09/20 |
$12,567 |
$11,932 |
10/20 |
$12,571 |
$11,879 |
11/20 |
$12,856 |
$11,995 |
12/20 |
$12,965 |
$12,012 |
01/21 |
$12,982 |
$11,926 |
02/21 |
$12,911 |
$11,753 |
03/21 |
$12,823 |
$11,607 |
04/21 |
$12,924 |
$11,698 |
05/21 |
$12,966 |
$11,737 |
06/21 |
$13,061 |
$11,819 |
07/21 |
$13,156 |
$11,951 |
08/21 |
$13,151 |
$11,929 |
09/21 |
$13,032 |
$11,825 |
10/21 |
$12,994 |
$11,822 |
11/21 |
$12,996 |
$11,857 |
12/21 |
$13,008 |
$11,827 |
01/22 |
$12,715 |
$11,572 |
02/22 |
$12,524 |
$11,443 |
03/22 |
$12,112 |
$11,125 |
04/22 |
$11,578 |
$10,703 |
05/22 |
$11,571 |
$10,772 |
06/22 |
$11,243 |
$10,603 |
07/22 |
$11,583 |
$10,862 |
08/22 |
$11,274 |
$10,555 |
09/22 |
$10,597 |
$10,099 |
10/22 |
$10,315 |
$9,968 |
11/22 |
$10,766 |
$10,335 |
12/22 |
$10,749 |
$10,288 |
01/23 |
$11,217 |
$10,604 |
02/23 |
$10,914 |
$10,330 |
03/23 |
$11,177 |
$10,593 |
04/23 |
$11,242 |
$10,657 |
05/23 |
$11,078 |
$10,541 |
06/23 |
$11,058 |
$10,503 |
07/23 |
$11,076 |
$10,496 |
08/23 |
$11,007 |
$10,429 |
09/23 |
$10,742 |
$10,164 |
10/23 |
$10,544 |
$10,003 |
11/23 |
$11,113 |
$10,456 |
12/23 |
$11,615 |
$10,857 |
01/24 |
$11,616 |
$10,827 |
02/24 |
$11,436 |
$10,674 |
03/24 |
$11,538 |
$10,773 |
04/24 |
$11,208 |
$10,500 |
05/24 |
$11,431 |
$10,678 |
06/24 |
$11,599 |
$10,780 |
07/24 |
$11,921 |
$11,031 |
08/24 |
$12,163 |
$11,190 |
09/24 |
$12,345 |
$11,340 |
10/24 |
$11,972 |
$11,058 |
11/24 |
$12,124 |
$11,175 |
12/24 |
$11,886 |
$10,992 |
01/25 |
$11,964 |
$11,051 |
02/25 |
$12,281 |
$11,294 |
03/25 |
$12,273 |
$11,298 |
04/25 |
$12,407 |
$11,343 |
05/25 |
$12,314 |
$11,261 |
06/25 |
$12,558 |
$11,435 |
07/25 |
$12,497 |
$11,404 |
08/25 |
$12,701 |
$11,541 |
09/25 |
$12,820 |
$11,667 |
10/25 |
$12,898 |
$11,740 |
11/25 |
$12,988 |
$11,813 |
12/25 |
$12,955 |
$11,795 |
01/26 |
$12,961 |
$11,808 |
02/26 |
$13,217 |
$12,001 |
03/26 |
$12,952 |
$11,789 |
04/26 |
$13,007 |
$11,803 |
|
| Average Annual Return [Table Text Block] |
Table Summary
Average Annual Total Returns (%) |
1 year |
5 years |
10 years |
Institutional 3 Class |
4.84 |
0.13 |
2.66 |
Bloomberg U.S. Aggregate Bond Index |
4.06 |
0.18 |
1.67 | |
| No Deduction of Taxes [Text Block] |
Performance does not reflect the deduction of taxes that a shareholder may pay on fund distributions or on the redemptions of fund shares.
|
| Updated Performance Information Location [Text Block] |
columbiathreadneedleus.com/investment-products/mutual-funds
|
| AssetsNet |
$ 3,152,583,318
|
| Holdings Count | Holding |
1,224
|
| Advisory Fees Paid, Amount |
$ 14,208,602
|
| InvestmentCompanyPortfolioTurnover |
222.00%
|
| Additional Fund Statistics [Text Block] |
Table Summary
Fund net assets |
$3,152,583,318 |
Total number of portfolio holdings |
1,224 |
Management services fees (represents 0.48% of Fund average net assets) |
$14,208,602 |
Portfolio turnover for the reporting period |
222% |
Portfolio turnover as of the end of the period excluding transactions in to be announced securities |
61% | |
| Holdings [Text Block] |
Table Summary
|
Long |
Credit Risk |
2.8% |
Interest Rate Risk |
59.6% |
|
Short |
Credit Risk |
1.1% |
Interest Rate Risk |
44.6% |
Table Summary
Residential Mortgage-Backed Securities - Agency |
37.2% |
Corporate Bonds & Notes |
22.4% |
Residential Mortgage-Backed Securities - Non-Agency |
15.6% |
Asset-Backed Securities - Non-Agency |
11.2% |
Money Market Funds |
9.2% |
Foreign Government Obligations |
5.6% |
Senior Loans |
5.2% |
Other |
1.7% | |
| Material Fund Change [Text Block] |
|
| C000032987 |
|
| Shareholder Report [Line Items] |
|
| Fund Name |
Columbia Total Return Bond Fund
|
| Class Name |
Institutional Class
|
| Trading Symbol |
SRBFX
|
| Annual or Semi-Annual Statement [Text Block] |
This annual shareholder report contains important information about Columbia Total Return Bond Fund (the Fund) for the period of May 1, 2025 to April 30, 2026.
|
| Additional Information [Text Block] |
You can find additional information about the Fund at columbiathreadneedleus.com/resources/literature. You can also request more information by contacting us at 1-800-345-6611.
|
| Additional Information Phone Number |
1-800-345-6611
|
| Additional Information Website |
columbiathreadneedleus.com/resources/literature
|
| Expenses [Text Block] |
What were the Fund costs for the reporting period? (Based on a hypothetical $10,000 investment)
Table Summary
Class |
Cost of a $10,000 investment |
Cost paid as a percentage of a $10,000 investment |
Institutional Class |
$50 |
0.49% | |
| Expenses Paid, Amount |
$ 50
|
| Expense Ratio, Percent |
0.49%
|
| Factors Affecting Performance [Text Block] |
Management's Discussion of Fund Performance The performance of Institutional Class shares for the period presented is shown in the Average Annual Total Returns table. Top Performance ContributorsAgency mortgages | An overweight allocation to agency mortgage-backed securities was most positive for the Fund’s performance. Strong carry, supportive asset class technicals and valuations remained attractive during the period. Spreads tightened through the period, resulting in the Fund’s positive performance. Consumer-based credit | Exposure to consumer-based credit proved beneficial, led by holdings of non-agency mortgage-backed securities, as housing fundamentals remained relatively strong and borrower delinquencies remained low. Commercial mortgage-backed securities | Selection within commercial mortgage-backed securities was positive for the Fund’s performance. The asset class saw spreads tighten throughout the period as individual issuer selection contributed to overall performance. High-yield corporate bonds | An out-of-benchmark allocation to high-yield bonds and bank loans positively contributed to the Fund’s overall performance. Top Performance DetractorsDuration | The Fund’s generally overweight duration exposure detracted from the Fund's performance during periods when market bond yields rose. Investment-grade corporates | The Fund’s underweight allocation to investment-grade corporate debt was a detractor from the Fund’s overall performance as the asset class had positive relative performance, which negatively impacted the Fund's performance. ABS/CLOs | An allocation to asset-backed securities (ABS) and collateralized loan obligations (CLOs) marginally detracted from the Fund’s overall performance. Smaller compression effects in CLOs and ABS, relative to tightening seen in other asset classes, created a slight negative effect on the Fund’s overall performance. |
| Performance Past Does Not Indicate Future [Text] |
The Fund's past performance is not a good predictor of the Fund's future performance.
|
| Line Graph [Table Text Block] |

Table Summary
|
Columbia Total Return Bond Fund Institutional Class ($12,858) |
Bloomberg U.S. Aggregate Bond Index ($11,803) |
04/16 |
$10,000 |
$10,000 |
05/16 |
$10,025 |
$10,003 |
06/16 |
$10,179 |
$10,182 |
07/16 |
$10,278 |
$10,247 |
08/16 |
$10,313 |
$10,235 |
09/16 |
$10,303 |
$10,229 |
10/16 |
$10,260 |
$10,151 |
11/16 |
$10,033 |
$9,911 |
12/16 |
$10,071 |
$9,925 |
01/17 |
$10,130 |
$9,944 |
02/17 |
$10,195 |
$10,011 |
03/17 |
$10,196 |
$10,006 |
04/17 |
$10,263 |
$10,083 |
05/17 |
$10,355 |
$10,160 |
06/17 |
$10,343 |
$10,150 |
07/17 |
$10,416 |
$10,194 |
08/17 |
$10,476 |
$10,285 |
09/17 |
$10,444 |
$10,236 |
10/17 |
$10,444 |
$10,242 |
11/17 |
$10,423 |
$10,229 |
12/17 |
$10,457 |
$10,276 |
01/18 |
$10,387 |
$10,158 |
02/18 |
$10,291 |
$10,061 |
03/18 |
$10,347 |
$10,126 |
04/18 |
$10,308 |
$10,051 |
05/18 |
$10,398 |
$10,122 |
06/18 |
$10,371 |
$10,110 |
07/18 |
$10,391 |
$10,112 |
08/18 |
$10,448 |
$10,177 |
09/18 |
$10,391 |
$10,112 |
10/18 |
$10,288 |
$10,032 |
11/18 |
$10,346 |
$10,092 |
12/18 |
$10,495 |
$10,277 |
01/19 |
$10,666 |
$10,386 |
02/19 |
$10,671 |
$10,380 |
03/19 |
$10,879 |
$10,580 |
04/19 |
$10,885 |
$10,582 |
05/19 |
$11,083 |
$10,770 |
06/19 |
$11,233 |
$10,906 |
07/19 |
$11,276 |
$10,930 |
08/19 |
$11,488 |
$11,213 |
09/19 |
$11,435 |
$11,153 |
10/19 |
$11,493 |
$11,187 |
11/19 |
$11,488 |
$11,181 |
12/19 |
$11,485 |
$11,173 |
01/20 |
$11,699 |
$11,388 |
02/20 |
$11,884 |
$11,593 |
03/20 |
$11,193 |
$11,525 |
04/20 |
$11,604 |
$11,730 |
05/20 |
$11,906 |
$11,784 |
06/20 |
$12,211 |
$11,859 |
07/20 |
$12,517 |
$12,036 |
08/20 |
$12,508 |
$11,939 |
09/20 |
$12,499 |
$11,932 |
10/20 |
$12,505 |
$11,879 |
11/20 |
$12,784 |
$11,995 |
12/20 |
$12,894 |
$12,012 |
01/21 |
$12,907 |
$11,926 |
02/21 |
$12,836 |
$11,753 |
03/21 |
$12,750 |
$11,607 |
04/21 |
$12,845 |
$11,698 |
05/21 |
$12,890 |
$11,737 |
06/21 |
$12,979 |
$11,819 |
07/21 |
$13,076 |
$11,951 |
08/21 |
$13,066 |
$11,929 |
09/21 |
$12,950 |
$11,825 |
10/21 |
$12,911 |
$11,822 |
11/21 |
$12,909 |
$11,857 |
12/21 |
$12,923 |
$11,827 |
01/22 |
$12,627 |
$11,572 |
02/22 |
$12,436 |
$11,443 |
03/22 |
$12,029 |
$11,125 |
04/22 |
$11,498 |
$10,703 |
05/22 |
$11,486 |
$10,772 |
06/22 |
$11,159 |
$10,603 |
07/22 |
$11,499 |
$10,862 |
08/22 |
$11,188 |
$10,555 |
09/22 |
$10,514 |
$10,099 |
10/22 |
$10,233 |
$9,968 |
11/22 |
$10,680 |
$10,335 |
12/22 |
$10,665 |
$10,288 |
01/23 |
$11,128 |
$10,604 |
02/23 |
$10,824 |
$10,330 |
03/23 |
$11,083 |
$10,593 |
04/23 |
$11,150 |
$10,657 |
05/23 |
$10,986 |
$10,541 |
06/23 |
$10,961 |
$10,503 |
07/23 |
$10,981 |
$10,496 |
08/23 |
$10,908 |
$10,429 |
09/23 |
$10,645 |
$10,164 |
10/23 |
$10,451 |
$10,003 |
11/23 |
$11,014 |
$10,456 |
12/23 |
$11,507 |
$10,857 |
01/24 |
$11,510 |
$10,827 |
02/24 |
$11,331 |
$10,674 |
03/24 |
$11,431 |
$10,773 |
04/24 |
$11,103 |
$10,500 |
05/24 |
$11,323 |
$10,678 |
06/24 |
$11,485 |
$10,780 |
07/24 |
$11,806 |
$11,031 |
08/24 |
$12,045 |
$11,190 |
09/24 |
$12,224 |
$11,340 |
10/24 |
$11,853 |
$11,058 |
11/24 |
$12,003 |
$11,175 |
12/24 |
$11,766 |
$10,992 |
01/25 |
$11,839 |
$11,051 |
02/25 |
$12,151 |
$11,294 |
03/25 |
$12,146 |
$11,298 |
04/25 |
$12,278 |
$11,343 |
05/25 |
$12,181 |
$11,261 |
06/25 |
$12,425 |
$11,435 |
07/25 |
$12,363 |
$11,404 |
08/25 |
$12,564 |
$11,541 |
09/25 |
$12,680 |
$11,667 |
10/25 |
$12,756 |
$11,740 |
11/25 |
$12,844 |
$11,813 |
12/25 |
$12,811 |
$11,795 |
01/26 |
$12,816 |
$11,808 |
02/26 |
$13,063 |
$12,001 |
03/26 |
$12,804 |
$11,789 |
04/26 |
$12,858 |
$11,803 |
|
| Average Annual Return [Table Text Block] |
Table Summary
Average Annual Total Returns (%) |
1 year |
5 years |
10 years |
Institutional Class |
4.72 |
0.02 |
2.55 |
Bloomberg U.S. Aggregate Bond Index |
4.06 |
0.18 |
1.67 | |
| No Deduction of Taxes [Text Block] |
Performance does not reflect the deduction of taxes that a shareholder may pay on fund distributions or on the redemptions of fund shares.
|
| Updated Performance Information Location [Text Block] |
columbiathreadneedleus.com/investment-products/mutual-funds
|
| AssetsNet |
$ 3,152,583,318
|
| Holdings Count | Holding |
1,224
|
| Advisory Fees Paid, Amount |
$ 14,208,602
|
| InvestmentCompanyPortfolioTurnover |
222.00%
|
| Additional Fund Statistics [Text Block] |
Table Summary
Fund net assets |
$3,152,583,318 |
Total number of portfolio holdings |
1,224 |
Management services fees (represents 0.48% of Fund average net assets) |
$14,208,602 |
Portfolio turnover for the reporting period |
222% |
Portfolio turnover as of the end of the period excluding transactions in to be announced securities |
61% | |
| Holdings [Text Block] |
Table Summary
|
Long |
Credit Risk |
2.8% |
Interest Rate Risk |
59.6% |
|
Short |
Credit Risk |
1.1% |
Interest Rate Risk |
44.6% |
Table Summary
Residential Mortgage-Backed Securities - Agency |
37.2% |
Corporate Bonds & Notes |
22.4% |
Residential Mortgage-Backed Securities - Non-Agency |
15.6% |
Asset-Backed Securities - Non-Agency |
11.2% |
Money Market Funds |
9.2% |
Foreign Government Obligations |
5.6% |
Senior Loans |
5.2% |
Other |
1.7% | |
| Material Fund Change [Text Block] |
|
| C000032988 |
|
| Shareholder Report [Line Items] |
|
| Fund Name |
Columbia U.S. Treasury Index Fund
|
| Class Name |
Class A
|
| Trading Symbol |
LUTAX
|
| Annual or Semi-Annual Statement [Text Block] |
This annual shareholder report contains important information about Columbia U.S. Treasury Index Fund (the Fund) for the period of May 1, 2025 to April 30, 2026.
|
| Additional Information [Text Block] |
You can find additional information about the Fund at columbiathreadneedleus.com/resources/literature. You can also request more information by contacting us at 1-800-345-6611.
|
| Additional Information Phone Number |
1-800-345-6611
|
| Additional Information Website |
columbiathreadneedleus.com/resources/literature
|
| Expenses [Text Block] |
What were the Fund costs for the reporting period? (Based on a hypothetical $10,000 investment)
Table Summary
Class |
Cost of a $10,000 investment |
Cost paid as a percentage of a $10,000 investment |
Class A |
$32 |
0.32% | |
| Expenses Paid, Amount |
$ 32
|
| Expense Ratio, Percent |
0.32%
|
| Factors Affecting Performance [Text Block] |
Management's Discussion of Fund Performance The performance of Class A shares for the period presented is shown in the Average Annual Total Returns table. Top Performance ContributorsAllocation | Fund performance was driven by short- and intermediate- maturity U.S. Treasuries, as 1-5-Year Treasuries returned 2.98% and 5-10-year Treasuries returned 2.86%, outperforming longer-maturity Treasuries during the slight duration selloff. Yield curve | The yield curve rose mostly in parallel, with yields on all Treasuries between 2-and 30-years rising between 20 and 30 basis points during the annual period. (A basis point is 1/100 of a percent.) Short-maturity Treasuries experienced less of a price impact from this move, which contributed to their outperformance. Top Performance DetractorsDuration | Overall duration was a detractor as yields rose during the period, detracting 154 basis points from the Fund's performance during the annual period. |
| Performance Past Does Not Indicate Future [Text] |
The Fund's past performance is not a good predictor of the Fund's future performance.
|
| Line Graph [Table Text Block] |
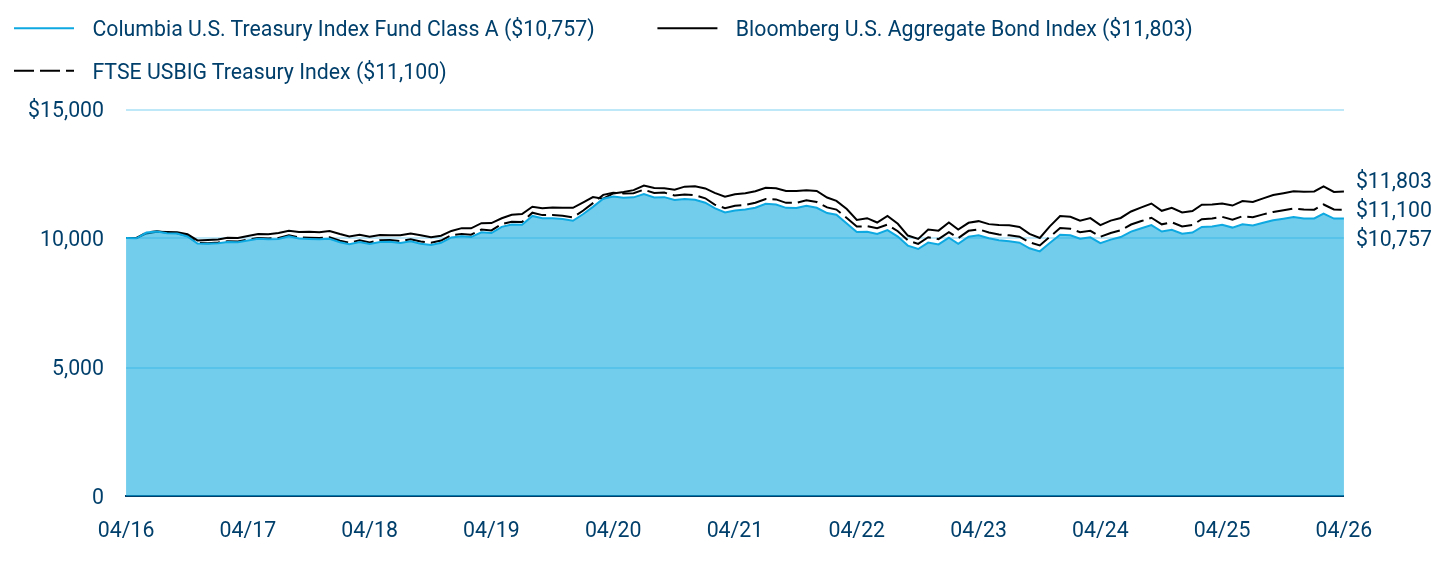
Table Summary
|
Columbia U.S. Treasury Index Fund Class A ($10,757) |
Bloomberg U.S. Aggregate Bond Index ($11,803) |
FTSE USBIG Treasury Index ($11,100) |
04/16 |
$10,000 |
$10,000 |
$10,000 |
05/16 |
$9,993 |
$10,003 |
$10,000 |
06/16 |
$10,215 |
$10,182 |
$10,222 |
07/16 |
$10,252 |
$10,247 |
$10,260 |
08/16 |
$10,192 |
$10,235 |
$10,205 |
09/16 |
$10,175 |
$10,229 |
$10,190 |
10/16 |
$10,061 |
$10,151 |
$10,080 |
11/16 |
$9,789 |
$9,911 |
$9,815 |
12/16 |
$9,783 |
$9,925 |
$9,804 |
01/17 |
$9,802 |
$9,944 |
$9,826 |
02/17 |
$9,848 |
$10,011 |
$9,875 |
03/17 |
$9,841 |
$10,006 |
$9,870 |
04/17 |
$9,906 |
$10,083 |
$9,938 |
05/17 |
$9,971 |
$10,160 |
$10,002 |
06/17 |
$9,956 |
$10,150 |
$9,986 |
07/17 |
$9,967 |
$10,194 |
$10,003 |
08/17 |
$10,069 |
$10,285 |
$10,110 |
09/17 |
$9,982 |
$10,236 |
$10,024 |
10/17 |
$9,967 |
$10,242 |
$10,012 |
11/17 |
$9,952 |
$10,229 |
$9,999 |
12/17 |
$9,973 |
$10,276 |
$10,030 |
01/18 |
$9,841 |
$10,158 |
$9,895 |
02/18 |
$9,763 |
$10,061 |
$9,821 |
03/18 |
$9,849 |
$10,126 |
$9,912 |
04/18 |
$9,773 |
$10,051 |
$9,833 |
05/18 |
$9,851 |
$10,122 |
$9,921 |
06/18 |
$9,857 |
$10,110 |
$9,924 |
07/18 |
$9,808 |
$10,112 |
$9,882 |
08/18 |
$9,878 |
$10,177 |
$9,956 |
09/18 |
$9,784 |
$10,112 |
$9,865 |
10/18 |
$9,736 |
$10,032 |
$9,818 |
11/18 |
$9,816 |
$10,092 |
$9,903 |
12/18 |
$10,026 |
$10,277 |
$10,114 |
01/19 |
$10,071 |
$10,386 |
$10,161 |
02/19 |
$10,040 |
$10,380 |
$10,134 |
03/19 |
$10,224 |
$10,580 |
$10,328 |
04/19 |
$10,195 |
$10,582 |
$10,299 |
05/19 |
$10,435 |
$10,770 |
$10,540 |
06/19 |
$10,526 |
$10,906 |
$10,637 |
07/19 |
$10,515 |
$10,930 |
$10,626 |
08/19 |
$10,858 |
$11,213 |
$10,984 |
09/19 |
$10,772 |
$11,153 |
$10,891 |
10/19 |
$10,770 |
$11,187 |
$10,898 |
11/19 |
$10,740 |
$11,181 |
$10,866 |
12/19 |
$10,672 |
$11,173 |
$10,804 |
01/20 |
$10,933 |
$11,388 |
$11,068 |
02/20 |
$11,211 |
$11,593 |
$11,355 |
03/20 |
$11,529 |
$11,525 |
$11,676 |
04/20 |
$11,610 |
$11,730 |
$11,761 |
05/20 |
$11,567 |
$11,784 |
$11,731 |
06/20 |
$11,580 |
$11,859 |
$11,742 |
07/20 |
$11,707 |
$12,036 |
$11,876 |
08/20 |
$11,577 |
$11,939 |
$11,747 |
09/20 |
$11,588 |
$11,932 |
$11,763 |
10/20 |
$11,477 |
$11,879 |
$11,652 |
11/20 |
$11,516 |
$11,995 |
$11,694 |
12/20 |
$11,488 |
$12,012 |
$11,666 |
01/21 |
$11,373 |
$11,926 |
$11,543 |
02/21 |
$11,163 |
$11,753 |
$11,295 |
03/21 |
$10,991 |
$11,607 |
$11,161 |
04/21 |
$11,068 |
$11,698 |
$11,251 |
05/21 |
$11,107 |
$11,737 |
$11,286 |
06/21 |
$11,174 |
$11,819 |
$11,372 |
07/21 |
$11,328 |
$11,951 |
$11,516 |
08/21 |
$11,299 |
$11,929 |
$11,499 |
09/21 |
$11,173 |
$11,825 |
$11,367 |
10/21 |
$11,163 |
$11,822 |
$11,370 |
11/21 |
$11,249 |
$11,857 |
$11,462 |
12/21 |
$11,175 |
$11,827 |
$11,398 |
01/22 |
$10,971 |
$11,572 |
$11,189 |
02/22 |
$10,903 |
$11,443 |
$11,106 |
03/22 |
$10,564 |
$11,125 |
$10,777 |
04/22 |
$10,234 |
$10,703 |
$10,446 |
05/22 |
$10,245 |
$10,772 |
$10,459 |
06/22 |
$10,159 |
$10,603 |
$10,384 |
07/22 |
$10,307 |
$10,862 |
$10,522 |
08/22 |
$10,057 |
$10,555 |
$10,264 |
09/22 |
$9,708 |
$10,099 |
$9,912 |
10/22 |
$9,576 |
$9,968 |
$9,774 |
11/22 |
$9,827 |
$10,335 |
$10,033 |
12/22 |
$9,756 |
$10,288 |
$9,961 |
01/23 |
$10,019 |
$10,604 |
$10,232 |
02/23 |
$9,780 |
$10,330 |
$9,995 |
03/23 |
$10,056 |
$10,593 |
$10,282 |
04/23 |
$10,105 |
$10,657 |
$10,338 |
05/23 |
$9,996 |
$10,541 |
$10,219 |
06/23 |
$9,917 |
$10,503 |
$10,143 |
07/23 |
$9,878 |
$10,496 |
$10,108 |
08/23 |
$9,820 |
$10,429 |
$10,056 |
09/23 |
$9,603 |
$10,164 |
$9,834 |
10/23 |
$9,486 |
$10,003 |
$9,716 |
11/23 |
$9,810 |
$10,456 |
$10,050 |
12/23 |
$10,126 |
$10,857 |
$10,387 |
01/24 |
$10,111 |
$10,827 |
$10,359 |
02/24 |
$9,973 |
$10,674 |
$10,226 |
03/24 |
$10,030 |
$10,773 |
$10,283 |
04/24 |
$9,801 |
$10,500 |
$10,053 |
05/24 |
$9,941 |
$10,678 |
$10,199 |
06/24 |
$10,039 |
$10,780 |
$10,302 |
07/24 |
$10,252 |
$11,031 |
$10,526 |
08/24 |
$10,383 |
$11,190 |
$10,661 |
09/24 |
$10,503 |
$11,340 |
$10,788 |
10/24 |
$10,253 |
$11,058 |
$10,534 |
11/24 |
$10,323 |
$11,175 |
$10,615 |
12/24 |
$10,166 |
$10,992 |
$10,454 |
01/25 |
$10,216 |
$11,051 |
$10,505 |
02/25 |
$10,432 |
$11,294 |
$10,733 |
03/25 |
$10,451 |
$11,298 |
$10,757 |
04/25 |
$10,513 |
$11,343 |
$10,824 |
05/25 |
$10,407 |
$11,261 |
$10,712 |
06/25 |
$10,532 |
$11,435 |
$10,847 |
07/25 |
$10,489 |
$11,404 |
$10,805 |
08/25 |
$10,594 |
$11,541 |
$10,919 |
09/25 |
$10,689 |
$11,667 |
$11,012 |
10/25 |
$10,752 |
$11,740 |
$11,080 |
11/25 |
$10,815 |
$11,813 |
$11,149 |
12/25 |
$10,761 |
$11,795 |
$11,112 |
01/26 |
$10,761 |
$11,808 |
$11,102 |
02/26 |
$10,953 |
$12,001 |
$11,303 |
03/26 |
$10,757 |
$11,789 |
$11,108 |
04/26 |
$10,757 |
$11,803 |
$11,100 |
|
| Average Annual Return [Table Text Block] |
Table Summary
Average Annual Total Returns (%) |
1 year |
5 years |
10 years |
Class A |
2.32 |
(0.57) |
0.73 |
Bloomberg U.S. Aggregate Bond Index |
4.06 |
0.18 |
1.67 |
FTSE USBIG Treasury Index |
2.55 |
(0.27) |
1.05 | |
| No Deduction of Taxes [Text Block] |
Performance does not reflect the deduction of taxes that a shareholder may pay on fund distributions or on the redemptions of fund shares.
|
| Updated Performance Information Location [Text Block] |
columbiathreadneedleus.com/investment-products/mutual-funds
|
| AssetsNet |
$ 702,916,826
|
| Holdings Count | Holding |
286
|
| Advisory Fees Paid, Amount |
$ 3,248,336
|
| InvestmentCompanyPortfolioTurnover |
44.00%
|
| Additional Fund Statistics [Text Block] |
Table Summary
Fund net assets |
$702,916,826 |
Total number of portfolio holdings |
286 |
Management services fees (represents 0.40% of Fund average net assets) |
$3,248,336 |
Portfolio turnover for the reporting period |
44% | |
| Holdings [Text Block] |
Table Summary
U.S. Treasury Obligations |
98.1% |
Money Market Funds |
1.1% | |
| Largest Holdings [Text Block] |
Table Summary
U.S. Treasury 3.875% 03/31/2031 |
1.2% |
U.S. Treasury 3.875% 03/31/2028 |
1.2% |
U.S. Treasury 4.125% 02/15/2036 |
1.0% |
U.S. Treasury 4.625% 02/15/2035 |
0.9% |
U.S. Treasury 4.375% 05/15/2034 |
0.8% |
U.S. Treasury 4.250% 11/15/2034 |
0.8% |
U.S. Treasury 4.250% 05/15/2035 |
0.8% |
U.S. Treasury 4.250% 08/15/2035 |
0.8% |
U.S. Treasury 4.000% 02/15/2034 |
0.8% |
U.S. Treasury 4.000% 11/15/2035 |
0.8% | |
| Material Fund Change [Text Block] |
|
| C000122681 |
|
| Shareholder Report [Line Items] |
|
| Fund Name |
Columbia U.S. Treasury Index Fund
|
| Class Name |
Institutional 2 Class
|
| Trading Symbol |
CUTRX
|
| Annual or Semi-Annual Statement [Text Block] |
This annual shareholder report contains important information about Columbia U.S. Treasury Index Fund (the Fund) for the period of May 1, 2025 to April 30, 2026.
|
| Additional Information [Text Block] |
You can find additional information about the Fund at columbiathreadneedleus.com/resources/literature. You can also request more information by contacting us at 1-800-345-6611.
|
| Additional Information Phone Number |
1-800-345-6611
|
| Additional Information Website |
columbiathreadneedleus.com/resources/literature
|
| Expenses [Text Block] |
What were the Fund costs for the reporting period? (Based on a hypothetical $10,000 investment)
Table Summary
Class |
Cost of a $10,000 investment |
Cost paid as a percentage of a $10,000 investment |
Institutional 2 Class |
$17 |
0.17% | |
| Expenses Paid, Amount |
$ 17
|
| Expense Ratio, Percent |
0.17%
|
| Factors Affecting Performance [Text Block] |
Management's Discussion of Fund Performance The performance of Institutional 2 Class shares for the period presented is shown in the Average Annual Total Returns table. Top Performance ContributorsAllocation | Fund performance was driven by short- and intermediate- maturity U.S. Treasuries, as 1-5-Year Treasuries returned 2.98% and 5-10-year Treasuries returned 2.86%, outperforming longer-maturity Treasuries during the slight duration selloff. Yield curve | The yield curve rose mostly in parallel, with yields on all Treasuries between 2-and 30-years rising between 20 and 30 basis points during the annual period. (A basis point is 1/100 of a percent.) Short-maturity Treasuries experienced less of a price impact from this move, which contributed to their outperformance. Top Performance DetractorsDuration | Overall duration was a detractor as yields rose during the period, detracting 154 basis points from the Fund's performance during the annual period. |
| Performance Past Does Not Indicate Future [Text] |
The Fund's past performance is not a good predictor of the Fund's future performance.
|
| Line Graph [Table Text Block] |

Table Summary
|
Columbia U.S. Treasury Index Fund Institutional 2 Class ($10,916) |
Bloomberg U.S. Aggregate Bond Index ($11,803) |
FTSE USBIG Treasury Index ($11,100) |
04/16 |
$10,000 |
$10,000 |
$10,000 |
05/16 |
$10,003 |
$10,003 |
$10,000 |
06/16 |
$10,218 |
$10,182 |
$10,222 |
07/16 |
$10,256 |
$10,247 |
$10,260 |
08/16 |
$10,197 |
$10,235 |
$10,205 |
09/16 |
$10,181 |
$10,229 |
$10,190 |
10/16 |
$10,069 |
$10,151 |
$10,080 |
11/16 |
$9,798 |
$9,911 |
$9,815 |
12/16 |
$9,792 |
$9,925 |
$9,804 |
01/17 |
$9,813 |
$9,944 |
$9,826 |
02/17 |
$9,860 |
$10,011 |
$9,875 |
03/17 |
$9,854 |
$10,006 |
$9,870 |
04/17 |
$9,920 |
$10,083 |
$9,938 |
05/17 |
$9,987 |
$10,160 |
$10,002 |
06/17 |
$9,973 |
$10,150 |
$9,986 |
07/17 |
$9,986 |
$10,194 |
$10,003 |
08/17 |
$10,089 |
$10,285 |
$10,110 |
09/17 |
$10,003 |
$10,236 |
$10,024 |
10/17 |
$9,989 |
$10,242 |
$10,012 |
11/17 |
$9,975 |
$10,229 |
$9,999 |
12/17 |
$9,998 |
$10,276 |
$10,030 |
01/18 |
$9,867 |
$10,158 |
$9,895 |
02/18 |
$9,789 |
$10,061 |
$9,821 |
03/18 |
$9,877 |
$10,126 |
$9,912 |
04/18 |
$9,801 |
$10,051 |
$9,833 |
05/18 |
$9,881 |
$10,122 |
$9,921 |
06/18 |
$9,888 |
$10,110 |
$9,924 |
07/18 |
$9,840 |
$10,112 |
$9,882 |
08/18 |
$9,912 |
$10,177 |
$9,956 |
09/18 |
$9,819 |
$10,112 |
$9,865 |
10/18 |
$9,772 |
$10,032 |
$9,818 |
11/18 |
$9,863 |
$10,092 |
$9,903 |
12/18 |
$10,066 |
$10,277 |
$10,114 |
01/19 |
$10,112 |
$10,386 |
$10,161 |
02/19 |
$10,082 |
$10,380 |
$10,134 |
03/19 |
$10,278 |
$10,580 |
$10,328 |
04/19 |
$10,240 |
$10,582 |
$10,299 |
05/19 |
$10,483 |
$10,770 |
$10,540 |
06/19 |
$10,576 |
$10,906 |
$10,637 |
07/19 |
$10,567 |
$10,930 |
$10,626 |
08/19 |
$10,913 |
$11,213 |
$10,984 |
09/19 |
$10,828 |
$11,153 |
$10,891 |
10/19 |
$10,827 |
$11,187 |
$10,898 |
11/19 |
$10,798 |
$11,181 |
$10,866 |
12/19 |
$10,731 |
$11,173 |
$10,804 |
01/20 |
$10,995 |
$11,388 |
$11,068 |
02/20 |
$11,277 |
$11,593 |
$11,355 |
03/20 |
$11,598 |
$11,525 |
$11,676 |
04/20 |
$11,672 |
$11,730 |
$11,761 |
05/20 |
$11,640 |
$11,784 |
$11,731 |
06/20 |
$11,654 |
$11,859 |
$11,742 |
07/20 |
$11,783 |
$12,036 |
$11,876 |
08/20 |
$11,654 |
$11,939 |
$11,747 |
09/20 |
$11,667 |
$11,932 |
$11,763 |
10/20 |
$11,556 |
$11,879 |
$11,652 |
11/20 |
$11,597 |
$11,995 |
$11,694 |
12/20 |
$11,570 |
$12,012 |
$11,666 |
01/21 |
$11,456 |
$11,926 |
$11,543 |
02/21 |
$11,244 |
$11,753 |
$11,295 |
03/21 |
$11,073 |
$11,607 |
$11,161 |
04/21 |
$11,152 |
$11,698 |
$11,251 |
05/21 |
$11,192 |
$11,737 |
$11,286 |
06/21 |
$11,261 |
$11,819 |
$11,372 |
07/21 |
$11,418 |
$11,951 |
$11,516 |
08/21 |
$11,390 |
$11,929 |
$11,499 |
09/21 |
$11,264 |
$11,825 |
$11,367 |
10/21 |
$11,256 |
$11,822 |
$11,370 |
11/21 |
$11,344 |
$11,857 |
$11,462 |
12/21 |
$11,271 |
$11,827 |
$11,398 |
01/22 |
$11,067 |
$11,572 |
$11,189 |
02/22 |
$10,999 |
$11,443 |
$11,106 |
03/22 |
$10,657 |
$11,125 |
$10,777 |
04/22 |
$10,325 |
$10,703 |
$10,446 |
05/22 |
$10,337 |
$10,772 |
$10,459 |
06/22 |
$10,251 |
$10,603 |
$10,384 |
07/22 |
$10,413 |
$10,862 |
$10,522 |
08/22 |
$10,151 |
$10,555 |
$10,264 |
09/22 |
$9,799 |
$10,099 |
$9,912 |
10/22 |
$9,667 |
$9,968 |
$9,774 |
11/22 |
$9,921 |
$10,335 |
$10,033 |
12/22 |
$9,851 |
$10,288 |
$9,961 |
01/23 |
$10,119 |
$10,604 |
$10,232 |
02/23 |
$9,878 |
$10,330 |
$9,995 |
03/23 |
$10,159 |
$10,593 |
$10,282 |
04/23 |
$10,219 |
$10,657 |
$10,338 |
05/23 |
$10,100 |
$10,541 |
$10,219 |
06/23 |
$10,021 |
$10,503 |
$10,143 |
07/23 |
$9,983 |
$10,496 |
$10,108 |
08/23 |
$9,926 |
$10,429 |
$10,056 |
09/23 |
$9,707 |
$10,164 |
$9,834 |
10/23 |
$9,589 |
$10,003 |
$9,716 |
11/23 |
$9,919 |
$10,456 |
$10,050 |
12/23 |
$10,241 |
$10,857 |
$10,387 |
01/24 |
$10,226 |
$10,827 |
$10,359 |
02/24 |
$10,088 |
$10,674 |
$10,226 |
03/24 |
$10,146 |
$10,773 |
$10,283 |
04/24 |
$9,916 |
$10,500 |
$10,053 |
05/24 |
$10,059 |
$10,678 |
$10,199 |
06/24 |
$10,160 |
$10,780 |
$10,302 |
07/24 |
$10,377 |
$11,031 |
$10,526 |
08/24 |
$10,511 |
$11,190 |
$10,661 |
09/24 |
$10,634 |
$11,340 |
$10,788 |
10/24 |
$10,382 |
$11,058 |
$10,534 |
11/24 |
$10,465 |
$11,175 |
$10,615 |
12/24 |
$10,306 |
$10,992 |
$10,454 |
01/25 |
$10,348 |
$11,051 |
$10,505 |
02/25 |
$10,568 |
$11,294 |
$10,733 |
03/25 |
$10,600 |
$11,298 |
$10,757 |
04/25 |
$10,663 |
$11,343 |
$10,824 |
05/25 |
$10,546 |
$11,261 |
$10,712 |
06/25 |
$10,685 |
$11,435 |
$10,847 |
07/25 |
$10,643 |
$11,404 |
$10,805 |
08/25 |
$10,752 |
$11,541 |
$10,919 |
09/25 |
$10,838 |
$11,667 |
$11,012 |
10/25 |
$10,904 |
$11,740 |
$11,080 |
11/25 |
$10,969 |
$11,813 |
$11,149 |
12/25 |
$10,927 |
$11,795 |
$11,112 |
01/26 |
$10,917 |
$11,808 |
$11,102 |
02/26 |
$11,112 |
$12,001 |
$11,303 |
03/26 |
$10,926 |
$11,789 |
$11,108 |
04/26 |
$10,916 |
$11,803 |
$11,100 |
|
| Average Annual Return [Table Text Block] |
Table Summary
Average Annual Total Returns (%) |
1 year |
5 years |
10 years |
Institutional 2 Class |
2.37 |
(0.43) |
0.88 |
Bloomberg U.S. Aggregate Bond Index |
4.06 |
0.18 |
1.67 |
FTSE USBIG Treasury Index |
2.55 |
(0.27) |
1.05 | |
| No Deduction of Taxes [Text Block] |
Performance does not reflect the deduction of taxes that a shareholder may pay on fund distributions or on the redemptions of fund shares.
|
| Updated Performance Information Location [Text Block] |
columbiathreadneedleus.com/investment-products/mutual-funds
|
| AssetsNet |
$ 702,916,826
|
| Holdings Count | Holding |
286
|
| Advisory Fees Paid, Amount |
$ 3,248,336
|
| InvestmentCompanyPortfolioTurnover |
44.00%
|
| Additional Fund Statistics [Text Block] |
Table Summary
Fund net assets |
$702,916,826 |
Total number of portfolio holdings |
286 |
Management services fees (represents 0.40% of Fund average net assets) |
$3,248,336 |
Portfolio turnover for the reporting period |
44% | |
| Holdings [Text Block] |
Table Summary
U.S. Treasury Obligations |
98.1% |
Money Market Funds |
1.1% | |
| Largest Holdings [Text Block] |
Table Summary
U.S. Treasury 3.875% 03/31/2031 |
1.2% |
U.S. Treasury 3.875% 03/31/2028 |
1.2% |
U.S. Treasury 4.125% 02/15/2036 |
1.0% |
U.S. Treasury 4.625% 02/15/2035 |
0.9% |
U.S. Treasury 4.375% 05/15/2034 |
0.8% |
U.S. Treasury 4.250% 11/15/2034 |
0.8% |
U.S. Treasury 4.250% 05/15/2035 |
0.8% |
U.S. Treasury 4.250% 08/15/2035 |
0.8% |
U.S. Treasury 4.000% 02/15/2034 |
0.8% |
U.S. Treasury 4.000% 11/15/2035 |
0.8% | |
| Material Fund Change [Text Block] |
|
| C000174616 |
|
| Shareholder Report [Line Items] |
|
| Fund Name |
Columbia U.S. Treasury Index Fund
|
| Class Name |
Institutional 3 Class
|
| Trading Symbol |
CUTYX
|
| Annual or Semi-Annual Statement [Text Block] |
This annual shareholder report contains important information about Columbia U.S. Treasury Index Fund (the Fund) for the period of May 1, 2025 to April 30, 2026.
|
| Additional Information [Text Block] |
You can find additional information about the Fund at columbiathreadneedleus.com/resources/literature. You can also request more information by contacting us at 1-800-345-6611.
|
| Additional Information Phone Number |
1-800-345-6611
|
| Additional Information Website |
columbiathreadneedleus.com/resources/literature
|
| Expenses [Text Block] |
What were the Fund costs for the reporting period? (Based on a hypothetical $10,000 investment)
Table Summary
Class |
Cost of a $10,000 investment |
Cost paid as a percentage of a $10,000 investment |
Institutional 3 Class |
$17 |
0.17% | |
| Expenses Paid, Amount |
$ 17
|
| Expense Ratio, Percent |
0.17%
|
| Factors Affecting Performance [Text Block] |
Management's Discussion of Fund Performance The performance of Institutional 3 Class shares for the period presented is shown in the Average Annual Total Returns table. Top Performance ContributorsAllocation | Fund performance was driven by short- and intermediate- maturity U.S. Treasuries, as 1-5-Year Treasuries returned 2.98% and 5-10-year Treasuries returned 2.86%, outperforming longer-maturity Treasuries during the slight duration selloff. Yield curve | The yield curve rose mostly in parallel, with yields on all Treasuries between 2-and 30-years rising between 20 and 30 basis points during the annual period. (A basis point is 1/100 of a percent.) Short-maturity Treasuries experienced less of a price impact from this move, which contributed to their outperformance. Top Performance DetractorsDuration | Overall duration was a detractor as yields rose during the period, detracting 154 basis points from the Fund's performance during the annual period. |
| Performance Past Does Not Indicate Future [Text] |
The Fund's past performance is not a good predictor of the Fund's future performance.
|
| Line Graph [Table Text Block] |

Table Summary
|
Columbia U.S. Treasury Index Fund Institutional 3 Class ($10,903) |
Bloomberg U.S. Aggregate Bond Index ($11,803) |
FTSE USBIG Treasury Index ($11,100) |
04/16 |
$10,000 |
$10,000 |
$10,000 |
05/16 |
$9,994 |
$10,003 |
$10,000 |
06/16 |
$10,217 |
$10,182 |
$10,222 |
07/16 |
$10,256 |
$10,247 |
$10,260 |
08/16 |
$10,197 |
$10,235 |
$10,205 |
09/16 |
$10,181 |
$10,229 |
$10,190 |
10/16 |
$10,069 |
$10,151 |
$10,080 |
11/16 |
$9,798 |
$9,911 |
$9,815 |
12/16 |
$9,792 |
$9,925 |
$9,804 |
01/17 |
$9,813 |
$9,944 |
$9,826 |
02/17 |
$9,860 |
$10,011 |
$9,875 |
03/17 |
$9,854 |
$10,006 |
$9,870 |
04/17 |
$9,920 |
$10,083 |
$9,938 |
05/17 |
$9,986 |
$10,160 |
$10,002 |
06/17 |
$9,963 |
$10,150 |
$9,986 |
07/17 |
$9,985 |
$10,194 |
$10,003 |
08/17 |
$10,088 |
$10,285 |
$10,110 |
09/17 |
$10,002 |
$10,236 |
$10,024 |
10/17 |
$9,988 |
$10,242 |
$10,012 |
11/17 |
$9,975 |
$10,229 |
$9,999 |
12/17 |
$9,998 |
$10,276 |
$10,030 |
01/18 |
$9,867 |
$10,158 |
$9,895 |
02/18 |
$9,790 |
$10,061 |
$9,821 |
03/18 |
$9,878 |
$10,126 |
$9,912 |
04/18 |
$9,794 |
$10,051 |
$9,833 |
05/18 |
$9,882 |
$10,122 |
$9,921 |
06/18 |
$9,880 |
$10,110 |
$9,924 |
07/18 |
$9,842 |
$10,112 |
$9,882 |
08/18 |
$9,913 |
$10,177 |
$9,956 |
09/18 |
$9,821 |
$10,112 |
$9,865 |
10/18 |
$9,774 |
$10,032 |
$9,818 |
11/18 |
$9,856 |
$10,092 |
$9,903 |
12/18 |
$10,066 |
$10,277 |
$10,114 |
01/19 |
$10,112 |
$10,386 |
$10,161 |
02/19 |
$10,083 |
$10,380 |
$10,134 |
03/19 |
$10,268 |
$10,580 |
$10,328 |
04/19 |
$10,240 |
$10,582 |
$10,299 |
05/19 |
$10,481 |
$10,770 |
$10,540 |
06/19 |
$10,574 |
$10,906 |
$10,637 |
07/19 |
$10,555 |
$10,930 |
$10,626 |
08/19 |
$10,917 |
$11,213 |
$10,984 |
09/19 |
$10,823 |
$11,153 |
$10,891 |
10/19 |
$10,823 |
$11,187 |
$10,898 |
11/19 |
$10,794 |
$11,181 |
$10,866 |
12/19 |
$10,728 |
$11,173 |
$10,804 |
01/20 |
$10,990 |
$11,388 |
$11,068 |
02/20 |
$11,279 |
$11,593 |
$11,355 |
03/20 |
$11,598 |
$11,525 |
$11,676 |
04/20 |
$11,671 |
$11,730 |
$11,761 |
05/20 |
$11,639 |
$11,784 |
$11,731 |
06/20 |
$11,654 |
$11,859 |
$11,742 |
07/20 |
$11,782 |
$12,036 |
$11,876 |
08/20 |
$11,654 |
$11,939 |
$11,747 |
09/20 |
$11,667 |
$11,932 |
$11,763 |
10/20 |
$11,556 |
$11,879 |
$11,652 |
11/20 |
$11,597 |
$11,995 |
$11,694 |
12/20 |
$11,561 |
$12,012 |
$11,666 |
01/21 |
$11,448 |
$11,926 |
$11,543 |
02/21 |
$11,238 |
$11,753 |
$11,295 |
03/21 |
$11,068 |
$11,607 |
$11,161 |
04/21 |
$11,147 |
$11,698 |
$11,251 |
05/21 |
$11,187 |
$11,737 |
$11,286 |
06/21 |
$11,256 |
$11,819 |
$11,372 |
07/21 |
$11,411 |
$11,951 |
$11,516 |
08/21 |
$11,384 |
$11,929 |
$11,499 |
09/21 |
$11,259 |
$11,825 |
$11,367 |
10/21 |
$11,250 |
$11,822 |
$11,370 |
11/21 |
$11,338 |
$11,857 |
$11,462 |
12/21 |
$11,265 |
$11,827 |
$11,398 |
01/22 |
$11,063 |
$11,572 |
$11,189 |
02/22 |
$10,986 |
$11,443 |
$11,106 |
03/22 |
$10,648 |
$11,125 |
$10,777 |
04/22 |
$10,318 |
$10,703 |
$10,446 |
05/22 |
$10,340 |
$10,772 |
$10,459 |
06/22 |
$10,246 |
$10,603 |
$10,384 |
07/22 |
$10,406 |
$10,862 |
$10,522 |
08/22 |
$10,146 |
$10,555 |
$10,264 |
09/22 |
$9,798 |
$10,099 |
$9,912 |
10/22 |
$9,666 |
$9,968 |
$9,774 |
11/22 |
$9,919 |
$10,335 |
$10,033 |
12/22 |
$9,849 |
$10,288 |
$9,961 |
01/23 |
$10,115 |
$10,604 |
$10,232 |
02/23 |
$9,877 |
$10,330 |
$9,995 |
03/23 |
$10,155 |
$10,593 |
$10,282 |
04/23 |
$10,215 |
$10,657 |
$10,338 |
05/23 |
$10,097 |
$10,541 |
$10,219 |
06/23 |
$10,019 |
$10,503 |
$10,143 |
07/23 |
$9,982 |
$10,496 |
$10,108 |
08/23 |
$9,925 |
$10,429 |
$10,056 |
09/23 |
$9,707 |
$10,164 |
$9,834 |
10/23 |
$9,591 |
$10,003 |
$9,716 |
11/23 |
$9,918 |
$10,456 |
$10,050 |
12/23 |
$10,238 |
$10,857 |
$10,387 |
01/24 |
$10,224 |
$10,827 |
$10,359 |
02/24 |
$10,087 |
$10,674 |
$10,226 |
03/24 |
$10,145 |
$10,773 |
$10,283 |
04/24 |
$9,916 |
$10,500 |
$10,053 |
05/24 |
$10,058 |
$10,678 |
$10,199 |
06/24 |
$10,148 |
$10,780 |
$10,302 |
07/24 |
$10,374 |
$11,031 |
$10,526 |
08/24 |
$10,508 |
$11,190 |
$10,661 |
09/24 |
$10,630 |
$11,340 |
$10,788 |
10/24 |
$10,380 |
$11,058 |
$10,534 |
11/24 |
$10,452 |
$11,175 |
$10,615 |
12/24 |
$10,295 |
$10,992 |
$10,454 |
01/25 |
$10,347 |
$11,051 |
$10,505 |
02/25 |
$10,565 |
$11,294 |
$10,733 |
03/25 |
$10,587 |
$11,298 |
$10,757 |
04/25 |
$10,650 |
$11,343 |
$10,824 |
05/25 |
$10,545 |
$11,261 |
$10,712 |
06/25 |
$10,672 |
$11,435 |
$10,847 |
07/25 |
$10,630 |
$11,404 |
$10,805 |
08/25 |
$10,739 |
$11,541 |
$10,919 |
09/25 |
$10,835 |
$11,667 |
$11,012 |
10/25 |
$10,901 |
$11,740 |
$11,080 |
11/25 |
$10,955 |
$11,813 |
$11,149 |
12/25 |
$10,913 |
$11,795 |
$11,112 |
01/26 |
$10,914 |
$11,808 |
$11,102 |
02/26 |
$11,109 |
$12,001 |
$11,303 |
03/26 |
$10,914 |
$11,789 |
$11,108 |
04/26 |
$10,903 |
$11,803 |
$11,100 |
|
| Average Annual Return [Table Text Block] |
Table Summary
Average Annual Total Returns (%) |
1 year |
5 years |
10 years |
Institutional 3 ClassFootnote Reference(a) |
2.38 |
(0.44) |
0.87 |
Bloomberg U.S. Aggregate Bond Index |
4.06 |
0.18 |
1.67 |
FTSE USBIG Treasury Index |
2.55 |
(0.27) |
1.05 | |
| No Deduction of Taxes [Text Block] |
Performance does not reflect the deduction of taxes that a shareholder may pay on fund distributions or on the redemptions of fund shares.
|
| Updated Performance Information Location [Text Block] |
columbiathreadneedleus.com/investment-products/mutual-funds
|
| AssetsNet |
$ 702,916,826
|
| Holdings Count | Holding |
286
|
| Advisory Fees Paid, Amount |
$ 3,248,336
|
| InvestmentCompanyPortfolioTurnover |
44.00%
|
| Additional Fund Statistics [Text Block] |
Table Summary
Fund net assets |
$702,916,826 |
Total number of portfolio holdings |
286 |
Management services fees (represents 0.40% of Fund average net assets) |
$3,248,336 |
Portfolio turnover for the reporting period |
44% | |
| Holdings [Text Block] |
Table Summary
U.S. Treasury Obligations |
98.1% |
Money Market Funds |
1.1% | |
| Largest Holdings [Text Block] |
Table Summary
U.S. Treasury 3.875% 03/31/2031 |
1.2% |
U.S. Treasury 3.875% 03/31/2028 |
1.2% |
U.S. Treasury 4.125% 02/15/2036 |
1.0% |
U.S. Treasury 4.625% 02/15/2035 |
0.9% |
U.S. Treasury 4.375% 05/15/2034 |
0.8% |
U.S. Treasury 4.250% 11/15/2034 |
0.8% |
U.S. Treasury 4.250% 05/15/2035 |
0.8% |
U.S. Treasury 4.250% 08/15/2035 |
0.8% |
U.S. Treasury 4.000% 02/15/2034 |
0.8% |
U.S. Treasury 4.000% 11/15/2035 |
0.8% | |
| Material Fund Change [Text Block] |
|
| C000032991 |
|
| Shareholder Report [Line Items] |
|
| Fund Name |
Columbia U.S. Treasury Index Fund
|
| Class Name |
Institutional Class
|
| Trading Symbol |
IUTIX
|
| Annual or Semi-Annual Statement [Text Block] |
This annual shareholder report contains important information about Columbia U.S. Treasury Index Fund (the Fund) for the period of May 1, 2025 to April 30, 2026.
|
| Additional Information [Text Block] |
You can find additional information about the Fund at columbiathreadneedleus.com/resources/literature. You can also request more information by contacting us at 1-800-345-6611.
|
| Additional Information Phone Number |
1-800-345-6611
|
| Additional Information Website |
columbiathreadneedleus.com/resources/literature
|
| Expenses [Text Block] |
What were the Fund costs for the reporting period? (Based on a hypothetical $10,000 investment)
Table Summary
Class |
Cost of a $10,000 investment |
Cost paid as a percentage of a $10,000 investment |
Institutional Class |
$17 |
0.17% | |
| Expenses Paid, Amount |
$ 17
|
| Expense Ratio, Percent |
0.17%
|
| Factors Affecting Performance [Text Block] |
Management's Discussion of Fund Performance The performance of Institutional Class shares for the period presented is shown in the Average Annual Total Returns table. Top Performance ContributorsAllocation | Fund performance was driven by short- and intermediate- maturity U.S. Treasuries, as 1-5-Year Treasuries returned 2.98% and 5-10-year Treasuries returned 2.86%, outperforming longer-maturity Treasuries during the slight duration selloff. Yield curve | The yield curve rose mostly in parallel, with yields on all Treasuries between 2-and 30-years rising between 20 and 30 basis points during the annual period. (A basis point is 1/100 of a percent.) Short-maturity Treasuries experienced less of a price impact from this move, which contributed to their outperformance. Top Performance DetractorsDuration | Overall duration was a detractor as yields rose during the period, detracting 154 basis points from the Fund's performance during the annual period. |
| Performance Past Does Not Indicate Future [Text] |
The Fund's past performance is not a good predictor of the Fund's future performance.
|
| Line Graph [Table Text Block] |
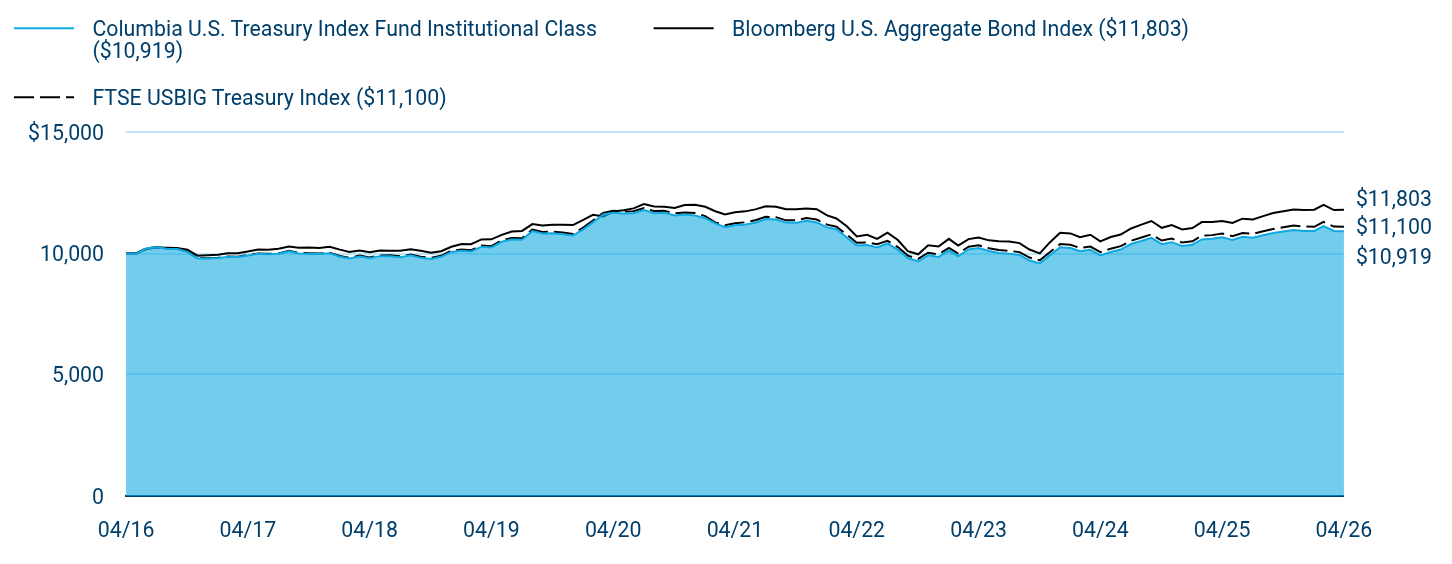
Table Summary
|
Columbia U.S. Treasury Index Fund Institutional Class ($10,919) |
Bloomberg U.S. Aggregate Bond Index ($11,803) |
FTSE USBIG Treasury Index ($11,100) |
04/16 |
$10,000 |
$10,000 |
$10,000 |
05/16 |
$9,994 |
$10,003 |
$10,000 |
06/16 |
$10,217 |
$10,182 |
$10,222 |
07/16 |
$10,256 |
$10,247 |
$10,260 |
08/16 |
$10,197 |
$10,235 |
$10,205 |
09/16 |
$10,181 |
$10,229 |
$10,190 |
10/16 |
$10,069 |
$10,151 |
$10,080 |
11/16 |
$9,798 |
$9,911 |
$9,815 |
12/16 |
$9,792 |
$9,925 |
$9,804 |
01/17 |
$9,813 |
$9,944 |
$9,826 |
02/17 |
$9,860 |
$10,011 |
$9,875 |
03/17 |
$9,855 |
$10,006 |
$9,870 |
04/17 |
$9,921 |
$10,083 |
$9,938 |
05/17 |
$9,987 |
$10,160 |
$10,002 |
06/17 |
$9,973 |
$10,150 |
$9,986 |
07/17 |
$9,986 |
$10,194 |
$10,003 |
08/17 |
$10,089 |
$10,285 |
$10,110 |
09/17 |
$10,003 |
$10,236 |
$10,024 |
10/17 |
$9,990 |
$10,242 |
$10,012 |
11/17 |
$9,976 |
$10,229 |
$9,999 |
12/17 |
$10,008 |
$10,276 |
$10,030 |
01/18 |
$9,867 |
$10,158 |
$9,895 |
02/18 |
$9,790 |
$10,061 |
$9,821 |
03/18 |
$9,878 |
$10,126 |
$9,912 |
04/18 |
$9,802 |
$10,051 |
$9,833 |
05/18 |
$9,891 |
$10,122 |
$9,921 |
06/18 |
$9,889 |
$10,110 |
$9,924 |
07/18 |
$9,841 |
$10,112 |
$9,882 |
08/18 |
$9,922 |
$10,177 |
$9,956 |
09/18 |
$9,820 |
$10,112 |
$9,865 |
10/18 |
$9,773 |
$10,032 |
$9,818 |
11/18 |
$9,864 |
$10,092 |
$9,903 |
12/18 |
$10,066 |
$10,277 |
$10,114 |
01/19 |
$10,113 |
$10,386 |
$10,161 |
02/19 |
$10,083 |
$10,380 |
$10,134 |
03/19 |
$10,278 |
$10,580 |
$10,328 |
04/19 |
$10,250 |
$10,582 |
$10,299 |
05/19 |
$10,484 |
$10,770 |
$10,540 |
06/19 |
$10,576 |
$10,906 |
$10,637 |
07/19 |
$10,567 |
$10,930 |
$10,626 |
08/19 |
$10,922 |
$11,213 |
$10,984 |
09/19 |
$10,827 |
$11,153 |
$10,891 |
10/19 |
$10,836 |
$11,187 |
$10,898 |
11/19 |
$10,797 |
$11,181 |
$10,866 |
12/19 |
$10,740 |
$11,173 |
$10,804 |
01/20 |
$10,994 |
$11,388 |
$11,068 |
02/20 |
$11,285 |
$11,593 |
$11,355 |
03/20 |
$11,606 |
$11,525 |
$11,676 |
04/20 |
$11,680 |
$11,730 |
$11,761 |
05/20 |
$11,648 |
$11,784 |
$11,731 |
06/20 |
$11,662 |
$11,859 |
$11,742 |
07/20 |
$11,791 |
$12,036 |
$11,876 |
08/20 |
$11,662 |
$11,939 |
$11,747 |
09/20 |
$11,675 |
$11,932 |
$11,763 |
10/20 |
$11,564 |
$11,879 |
$11,652 |
11/20 |
$11,605 |
$11,995 |
$11,694 |
12/20 |
$11,568 |
$12,012 |
$11,666 |
01/21 |
$11,455 |
$11,926 |
$11,543 |
02/21 |
$11,253 |
$11,753 |
$11,295 |
03/21 |
$11,082 |
$11,607 |
$11,161 |
04/21 |
$11,161 |
$11,698 |
$11,251 |
05/21 |
$11,192 |
$11,737 |
$11,286 |
06/21 |
$11,270 |
$11,819 |
$11,372 |
07/21 |
$11,417 |
$11,951 |
$11,516 |
08/21 |
$11,399 |
$11,929 |
$11,499 |
09/21 |
$11,273 |
$11,825 |
$11,367 |
10/21 |
$11,265 |
$11,822 |
$11,370 |
11/21 |
$11,353 |
$11,857 |
$11,462 |
12/21 |
$11,280 |
$11,827 |
$11,398 |
01/22 |
$11,076 |
$11,572 |
$11,189 |
02/22 |
$10,999 |
$11,443 |
$11,106 |
03/22 |
$10,658 |
$11,125 |
$10,777 |
04/22 |
$10,326 |
$10,703 |
$10,446 |
05/22 |
$10,349 |
$10,772 |
$10,459 |
06/22 |
$10,253 |
$10,603 |
$10,384 |
07/22 |
$10,414 |
$10,862 |
$10,522 |
08/22 |
$10,152 |
$10,555 |
$10,264 |
09/22 |
$9,812 |
$10,099 |
$9,912 |
10/22 |
$9,669 |
$9,968 |
$9,774 |
11/22 |
$9,924 |
$10,335 |
$10,033 |
12/22 |
$9,854 |
$10,288 |
$9,961 |
01/23 |
$10,121 |
$10,604 |
$10,232 |
02/23 |
$9,881 |
$10,330 |
$9,995 |
03/23 |
$10,171 |
$10,593 |
$10,282 |
04/23 |
$10,221 |
$10,657 |
$10,338 |
05/23 |
$10,103 |
$10,541 |
$10,219 |
06/23 |
$10,024 |
$10,503 |
$10,143 |
07/23 |
$9,986 |
$10,496 |
$10,108 |
08/23 |
$9,939 |
$10,429 |
$10,056 |
09/23 |
$9,710 |
$10,164 |
$9,834 |
10/23 |
$9,593 |
$10,003 |
$9,716 |
11/23 |
$9,922 |
$10,456 |
$10,050 |
12/23 |
$10,253 |
$10,857 |
$10,387 |
01/24 |
$10,229 |
$10,827 |
$10,359 |
02/24 |
$10,091 |
$10,674 |
$10,226 |
03/24 |
$10,149 |
$10,773 |
$10,283 |
04/24 |
$9,919 |
$10,500 |
$10,053 |
05/24 |
$10,062 |
$10,678 |
$10,199 |
06/24 |
$10,163 |
$10,780 |
$10,302 |
07/24 |
$10,390 |
$11,031 |
$10,526 |
08/24 |
$10,513 |
$11,190 |
$10,661 |
09/24 |
$10,647 |
$11,340 |
$10,788 |
10/24 |
$10,385 |
$11,058 |
$10,534 |
11/24 |
$10,467 |
$11,175 |
$10,615 |
12/24 |
$10,309 |
$10,992 |
$10,454 |
01/25 |
$10,362 |
$11,051 |
$10,505 |
02/25 |
$10,581 |
$11,294 |
$10,733 |
03/25 |
$10,603 |
$11,298 |
$10,757 |
04/25 |
$10,666 |
$11,343 |
$10,824 |
05/25 |
$10,560 |
$11,261 |
$10,712 |
06/25 |
$10,688 |
$11,435 |
$10,847 |
07/25 |
$10,646 |
$11,404 |
$10,805 |
08/25 |
$10,754 |
$11,541 |
$10,919 |
09/25 |
$10,841 |
$11,667 |
$11,012 |
10/25 |
$10,907 |
$11,740 |
$11,080 |
11/25 |
$10,972 |
$11,813 |
$11,149 |
12/25 |
$10,929 |
$11,795 |
$11,112 |
01/26 |
$10,931 |
$11,808 |
$11,102 |
02/26 |
$11,126 |
$12,001 |
$11,303 |
03/26 |
$10,929 |
$11,789 |
$11,108 |
04/26 |
$10,919 |
$11,803 |
$11,100 |
|
| Average Annual Return [Table Text Block] |
Table Summary
Average Annual Total Returns (%) |
1 year |
5 years |
10 years |
Institutional Class |
2.37 |
(0.44) |
0.88 |
Bloomberg U.S. Aggregate Bond Index |
4.06 |
0.18 |
1.67 |
FTSE USBIG Treasury Index |
2.55 |
(0.27) |
1.05 | |
| No Deduction of Taxes [Text Block] |
Performance does not reflect the deduction of taxes that a shareholder may pay on fund distributions or on the redemptions of fund shares.
|
| Updated Performance Information Location [Text Block] |
columbiathreadneedleus.com/investment-products/mutual-funds
|
| AssetsNet |
$ 702,916,826
|
| Holdings Count | Holding |
286
|
| Advisory Fees Paid, Amount |
$ 3,248,336
|
| InvestmentCompanyPortfolioTurnover |
44.00%
|
| Additional Fund Statistics [Text Block] |
Table Summary
Fund net assets |
$702,916,826 |
Total number of portfolio holdings |
286 |
Management services fees (represents 0.40% of Fund average net assets) |
$3,248,336 |
Portfolio turnover for the reporting period |
44% | |
| Holdings [Text Block] |
Table Summary
U.S. Treasury Obligations |
98.1% |
Money Market Funds |
1.1% | |
| Largest Holdings [Text Block] |
Table Summary
U.S. Treasury 3.875% 03/31/2031 |
1.2% |
U.S. Treasury 3.875% 03/31/2028 |
1.2% |
U.S. Treasury 4.125% 02/15/2036 |
1.0% |
U.S. Treasury 4.625% 02/15/2035 |
0.9% |
U.S. Treasury 4.375% 05/15/2034 |
0.8% |
U.S. Treasury 4.250% 11/15/2034 |
0.8% |
U.S. Treasury 4.250% 05/15/2035 |
0.8% |
U.S. Treasury 4.250% 08/15/2035 |
0.8% |
U.S. Treasury 4.000% 02/15/2034 |
0.8% |
U.S. Treasury 4.000% 11/15/2035 |
0.8% | |
| Material Fund Change [Text Block] |
|
| C000179758 |
|
| Shareholder Report [Line Items] |
|
| Fund Name |
Multi-Manager Directional Alternative Strategies Fund
|
| Class Name |
Institutional Class
|
| Trading Symbol |
CDAZX
|
| Annual or Semi-Annual Statement [Text Block] |
This annual shareholder report contains important information about Multi-Manager Directional Alternative Strategies Fund (the Fund) for the period of May 1, 2025 to April 30, 2026.
|
| Additional Information [Text Block] |
You can find additional information about the Fund at columbiathreadneedleus.com/resources/literature. You can also request more information by contacting us at 1-800-345-6611.
|
| Material Fund Change Notice [Text Block] |
This report describes changes to the Fund that occurred during the reporting period.
|
| Additional Information Phone Number |
1-800-345-6611
|
| Additional Information Email |
<span style="box-sizing: border-box; color: rgb(0, 63, 107); display: inline; flex-wrap: nowrap; font-size: 13.3333px; font-weight: 400; grid-area: auto; line-height: 16px; margin: 0px; overflow: visible; text-align: left; text-align-last: auto; white-space-collapse: preserve-breaks;">serviceinquiries@columbiathreadneedle.com</span>
|
| Additional Information Website |
columbiathreadneedleus.com/resources/literature
|
| Expenses [Text Block] |
What were the Fund costs for the reporting period? (Based on a hypothetical $10,000 investment)
Table Summary
Class |
Cost of a $10,000 investment |
Cost paid as a percentage of a $10,000 investment |
Institutional Class |
$235 |
2.11% | |
| Expenses Paid, Amount |
$ 235
|
| Expense Ratio, Percent |
2.11%
|
| Factors Affecting Performance [Text Block] |
Management's Discussion of Fund Performance The performance of Institutional Class shares for the period presented is shown in the Average Annual Total Returns table. Top Performance ContributorsStock selection | Stock selection within the pharmaceuticals, biotechnology, life sciences, technology hardware, storage and peripherals and the semiconductors and semiconductor equipment industries accounted for the majority of the Fund’s relative gains during the one-year period. Allocations | Overweight positioning in the pharmaceuticals, biotechnology, and life sciences industries and underweight positioning in the software and services industry contributed positively during the period. Individual holdings | Positions in Sandisk Corp, a data storage company specializing in NAND flash memory; Tower Semiconductor, a manufacturer of analog integrated circuits; Cidara Therapeutics, a developer of antivirals and immunotherapies; and Silicon Motion, a supplier of solid-state drives (SSD), were among the top contributors to the Fund’s absolute performance. All of the top individual contributors were long positions. Top Performance DetractorsStock selection | Stock selection within the capital goods and financial services industries generated negative relative returns during the one-year period. Allocations | Larger weightings in the health care equipment and services industry, as well as underweight positioning across the media, entertainment and banks industries, detracted modestly from relative performance. Individual holdings | Fund positions in the VanEck Semiconductor ETF, a vehicle that tracks the largest U.S.-listed semiconductor companies; the SPDR S&P Biotech ETF, which invests in U.S. biotechnology companies; the Invesco QQQ Trust, an ETF that tracks the NASDAQ-100; Daikin, a Japanese manufacturer of HVAC systems; and Fujifilm Holdings, a Japanese conglomerate focused on the photography market, were top detractors during the period. All of the top individual detractors were short positions. |
| Performance Past Does Not Indicate Future [Text] |
The Fund's past performance is not a good predictor of the Fund's future performance.
|
| Line Graph [Table Text Block] |
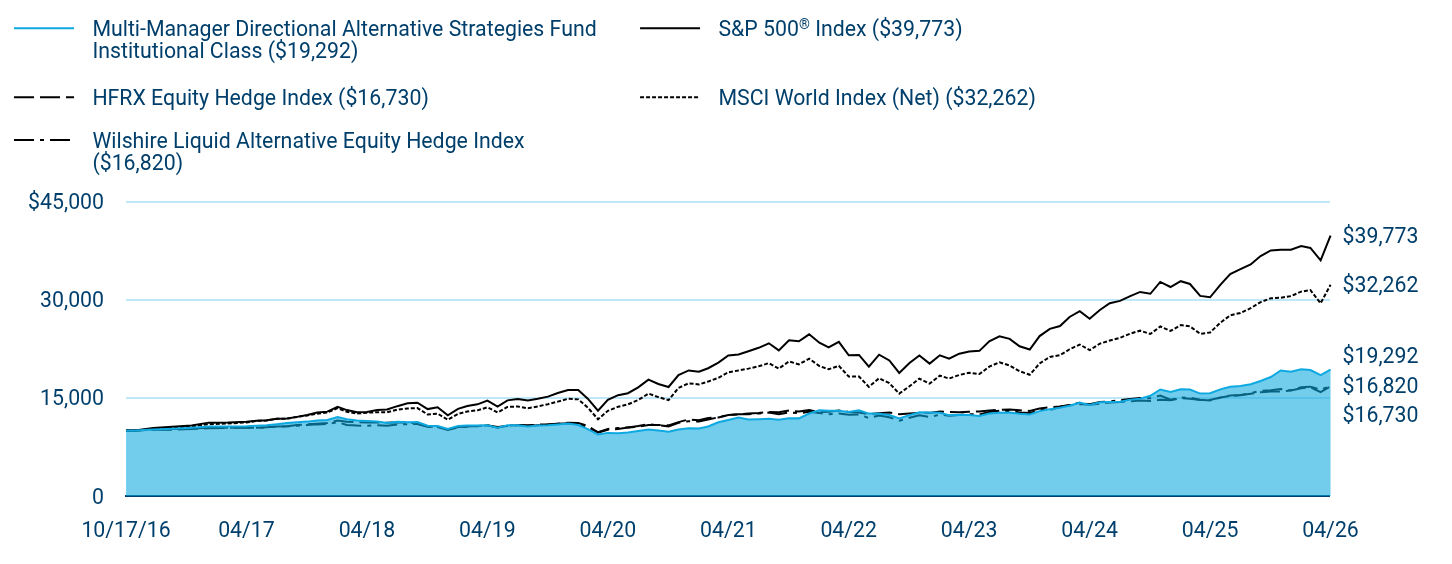
Table Summary
|
Multi-Manager Directional Alternative Strategies Fund Institutional Class ($19,292) |
S&P 500® Index ($39,773) |
HFRX Equity Hedge Index ($16,730) |
MSCI World Index (Net) ($32,262) |
Wilshire Liquid Alternative Equity Hedge Index ($16,820) |
10/17/16 |
$10,000 |
$10,000 |
$10,000 |
$10,000 |
$10,000 |
10/31/16 |
$10,000 |
$10,002 |
$9,972 |
$10,022 |
$10,015 |
11/30/16 |
$10,150 |
$10,372 |
$10,119 |
$10,166 |
$10,197 |
12/31/16 |
$10,256 |
$10,577 |
$10,137 |
$10,409 |
$10,226 |
01/31/17 |
$10,417 |
$10,778 |
$10,222 |
$10,661 |
$10,310 |
02/28/17 |
$10,618 |
$11,206 |
$10,342 |
$10,956 |
$10,419 |
03/31/17 |
$10,608 |
$11,219 |
$10,410 |
$11,073 |
$10,425 |
04/30/17 |
$10,638 |
$11,334 |
$10,485 |
$11,237 |
$10,468 |
05/31/17 |
$10,748 |
$11,494 |
$10,425 |
$11,475 |
$10,393 |
06/30/17 |
$10,788 |
$11,566 |
$10,515 |
$11,519 |
$10,497 |
07/31/17 |
$10,969 |
$11,803 |
$10,607 |
$11,794 |
$10,600 |
08/31/17 |
$11,139 |
$11,840 |
$10,659 |
$11,811 |
$10,637 |
09/30/17 |
$11,260 |
$12,084 |
$10,853 |
$12,076 |
$10,741 |
10/31/17 |
$11,360 |
$12,366 |
$10,938 |
$12,304 |
$10,833 |
11/30/17 |
$11,531 |
$12,745 |
$11,034 |
$12,571 |
$10,939 |
12/31/17 |
$11,602 |
$12,887 |
$11,148 |
$12,741 |
$11,002 |
01/31/18 |
$12,068 |
$13,625 |
$11,528 |
$13,414 |
$11,279 |
02/28/18 |
$11,719 |
$13,122 |
$11,357 |
$12,858 |
$10,853 |
03/31/18 |
$11,549 |
$12,789 |
$11,279 |
$12,578 |
$10,750 |
04/30/18 |
$11,454 |
$12,838 |
$11,217 |
$12,722 |
$10,730 |
05/31/18 |
$11,369 |
$13,147 |
$11,250 |
$12,802 |
$10,796 |
06/30/18 |
$11,136 |
$13,228 |
$11,175 |
$12,796 |
$10,737 |
07/31/18 |
$11,327 |
$13,720 |
$11,256 |
$13,196 |
$10,911 |
08/31/18 |
$11,274 |
$14,167 |
$11,230 |
$13,359 |
$10,976 |
09/30/18 |
$11,306 |
$14,248 |
$11,048 |
$13,433 |
$10,993 |
10/31/18 |
$10,745 |
$13,274 |
$10,612 |
$12,447 |
$10,564 |
11/30/18 |
$10,702 |
$13,545 |
$10,545 |
$12,588 |
$10,596 |
12/31/18 |
$10,233 |
$12,322 |
$10,098 |
$11,631 |
$10,176 |
01/31/19 |
$10,679 |
$13,309 |
$10,494 |
$12,536 |
$10,538 |
02/28/19 |
$10,759 |
$13,736 |
$10,616 |
$12,913 |
$10,617 |
03/31/19 |
$10,759 |
$14,003 |
$10,700 |
$13,083 |
$10,648 |
04/30/19 |
$10,806 |
$14,570 |
$10,772 |
$13,546 |
$10,799 |
05/31/19 |
$10,440 |
$13,644 |
$10,555 |
$12,765 |
$10,440 |
06/30/19 |
$10,791 |
$14,606 |
$10,702 |
$13,606 |
$10,759 |
07/31/19 |
$10,822 |
$14,816 |
$10,816 |
$13,673 |
$10,850 |
08/31/19 |
$10,615 |
$14,581 |
$10,798 |
$13,394 |
$10,728 |
09/30/19 |
$10,759 |
$14,854 |
$10,893 |
$13,679 |
$10,820 |
10/31/19 |
$10,822 |
$15,176 |
$10,949 |
$14,027 |
$10,897 |
11/30/19 |
$10,934 |
$15,727 |
$11,046 |
$14,417 |
$11,038 |
12/31/19 |
$11,068 |
$16,201 |
$11,180 |
$14,849 |
$11,111 |
01/31/20 |
$10,844 |
$16,195 |
$11,143 |
$14,759 |
$10,984 |
02/29/20 |
$10,217 |
$14,862 |
$10,717 |
$13,511 |
$10,469 |
03/31/20 |
$9,382 |
$13,026 |
$9,690 |
$11,723 |
$9,755 |
04/30/20 |
$9,639 |
$14,696 |
$10,125 |
$13,004 |
$10,236 |
05/31/20 |
$9,591 |
$15,396 |
$10,249 |
$13,632 |
$10,369 |
06/30/20 |
$9,687 |
$15,702 |
$10,476 |
$13,993 |
$10,474 |
07/31/20 |
$9,928 |
$16,588 |
$10,562 |
$14,662 |
$10,704 |
08/31/20 |
$10,169 |
$17,780 |
$10,848 |
$15,642 |
$10,973 |
09/30/20 |
$10,008 |
$17,104 |
$10,851 |
$15,102 |
$10,792 |
10/31/20 |
$9,815 |
$16,649 |
$10,792 |
$14,639 |
$10,636 |
11/30/20 |
$10,153 |
$18,472 |
$11,287 |
$16,511 |
$11,195 |
12/31/20 |
$10,362 |
$19,182 |
$11,694 |
$17,211 |
$11,419 |
01/31/21 |
$10,313 |
$18,989 |
$11,572 |
$17,040 |
$11,372 |
02/28/21 |
$10,619 |
$19,512 |
$11,901 |
$17,476 |
$11,673 |
03/31/21 |
$11,261 |
$20,367 |
$12,004 |
$18,058 |
$12,026 |
04/30/21 |
$11,615 |
$21,454 |
$12,364 |
$18,898 |
$12,351 |
05/31/21 |
$12,000 |
$21,604 |
$12,468 |
$19,171 |
$12,489 |
06/30/21 |
$11,679 |
$22,108 |
$12,613 |
$19,456 |
$12,490 |
07/31/21 |
$11,727 |
$22,633 |
$12,672 |
$19,805 |
$12,582 |
08/31/21 |
$11,807 |
$23,321 |
$12,841 |
$20,298 |
$12,737 |
09/30/21 |
$11,631 |
$22,237 |
$12,775 |
$19,455 |
$12,470 |
10/31/21 |
$11,888 |
$23,794 |
$13,051 |
$20,557 |
$12,793 |
11/30/21 |
$11,856 |
$23,630 |
$12,894 |
$20,106 |
$12,637 |
12/31/21 |
$12,600 |
$24,689 |
$13,114 |
$20,966 |
$12,876 |
01/31/22 |
$13,084 |
$23,411 |
$12,836 |
$19,856 |
$12,676 |
02/28/22 |
$13,015 |
$22,710 |
$12,880 |
$19,354 |
$12,478 |
03/31/22 |
$13,033 |
$23,553 |
$13,075 |
$19,885 |
$12,584 |
04/30/22 |
$12,825 |
$21,499 |
$12,847 |
$18,233 |
$12,403 |
05/31/22 |
$13,102 |
$21,539 |
$12,751 |
$18,247 |
$12,433 |
06/30/22 |
$12,583 |
$19,761 |
$12,495 |
$16,667 |
$11,917 |
07/31/22 |
$12,566 |
$21,583 |
$12,645 |
$17,990 |
$12,274 |
08/31/22 |
$12,376 |
$20,703 |
$12,740 |
$17,238 |
$12,028 |
09/30/22 |
$11,857 |
$18,796 |
$12,485 |
$15,635 |
$11,495 |
10/31/22 |
$12,358 |
$20,318 |
$12,614 |
$16,758 |
$11,946 |
11/30/22 |
$12,791 |
$21,453 |
$12,705 |
$17,923 |
$12,345 |
12/31/22 |
$12,769 |
$20,217 |
$12,696 |
$17,162 |
$12,058 |
01/31/23 |
$12,712 |
$21,488 |
$12,894 |
$18,377 |
$12,427 |
02/28/23 |
$12,345 |
$20,963 |
$12,815 |
$17,935 |
$12,250 |
03/31/23 |
$12,422 |
$21,733 |
$12,798 |
$18,489 |
$12,370 |
04/30/23 |
$12,384 |
$22,072 |
$12,876 |
$18,813 |
$12,506 |
05/31/23 |
$12,210 |
$22,168 |
$12,909 |
$18,625 |
$12,456 |
06/30/23 |
$12,596 |
$23,633 |
$13,072 |
$19,752 |
$12,823 |
07/31/23 |
$12,712 |
$24,392 |
$13,164 |
$20,415 |
$13,018 |
08/31/23 |
$12,750 |
$24,004 |
$13,200 |
$19,928 |
$12,974 |
09/30/23 |
$12,577 |
$22,859 |
$13,100 |
$19,068 |
$12,758 |
10/31/23 |
$12,461 |
$22,379 |
$12,979 |
$18,515 |
$12,662 |
11/30/23 |
$12,962 |
$24,422 |
$13,359 |
$20,250 |
$13,148 |
12/31/23 |
$13,266 |
$25,532 |
$13,572 |
$21,245 |
$13,115 |
01/31/24 |
$13,481 |
$25,961 |
$13,661 |
$21,500 |
$13,640 |
02/29/24 |
$13,795 |
$27,347 |
$13,847 |
$22,411 |
$13,920 |
03/31/24 |
$14,265 |
$28,227 |
$14,033 |
$23,131 |
$14,252 |
04/30/24 |
$13,912 |
$27,074 |
$13,921 |
$22,272 |
$14,012 |
05/31/24 |
$14,324 |
$28,417 |
$14,095 |
$23,267 |
$14,340 |
06/30/24 |
$14,343 |
$29,436 |
$14,265 |
$23,740 |
$14,465 |
07/31/24 |
$14,383 |
$29,795 |
$14,366 |
$24,158 |
$14,619 |
08/31/24 |
$14,716 |
$30,517 |
$14,477 |
$24,797 |
$14,830 |
09/30/24 |
$14,872 |
$31,169 |
$14,587 |
$25,251 |
$14,964 |
10/31/24 |
$15,304 |
$30,886 |
$14,494 |
$24,750 |
$14,928 |
11/30/24 |
$16,264 |
$32,699 |
$14,687 |
$25,886 |
$15,341 |
12/31/24 |
$15,900 |
$31,920 |
$14,635 |
$25,211 |
$14,693 |
01/31/25 |
$16,289 |
$32,809 |
$14,943 |
$26,101 |
$15,031 |
02/28/25 |
$16,267 |
$32,381 |
$14,864 |
$25,913 |
$15,005 |
03/31/25 |
$15,642 |
$30,556 |
$14,666 |
$24,759 |
$14,694 |
04/30/25 |
$15,706 |
$30,349 |
$14,666 |
$24,979 |
$14,596 |
05/31/25 |
$16,289 |
$32,259 |
$15,052 |
$26,458 |
$15,021 |
06/30/25 |
$16,677 |
$33,900 |
$15,267 |
$27,600 |
$15,339 |
07/31/25 |
$16,785 |
$34,661 |
$15,387 |
$27,955 |
$15,418 |
08/31/25 |
$17,066 |
$35,363 |
$15,617 |
$28,684 |
$15,711 |
09/30/25 |
$17,562 |
$36,654 |
$15,845 |
$29,606 |
$16,043 |
10/31/25 |
$18,166 |
$37,512 |
$15,953 |
$30,199 |
$16,155 |
11/30/25 |
$19,180 |
$37,604 |
$15,959 |
$30,284 |
$16,324 |
12/31/25 |
$18,973 |
$37,627 |
$16,107 |
$30,529 |
$16,142 |
01/31/26 |
$19,372 |
$38,173 |
$16,471 |
$31,212 |
$16,624 |
02/28/26 |
$19,239 |
$37,883 |
$16,606 |
$31,441 |
$16,699 |
03/31/26 |
$18,468 |
$35,996 |
$15,868 |
$29,438 |
$16,227 |
04/30/26 |
$19,292 |
$39,773 |
$16,730 |
$32,262 |
$16,820 |
|
| Average Annual Return [Table Text Block] |
Table Summary
Average Annual Total Returns (%) |
1 year |
5 years |
Since Fund Inception |
Institutional ClassFootnote Reference(a)Footnote Reference(b) |
22.83 |
10.68 |
7.14 |
S&P 500® Index |
31.05 |
13.14 |
15.58 |
HFRX Equity Hedge Index |
14.07 |
6.24 |
5.55 |
MSCI World Index (Net) |
29.16 |
11.29 |
13.07 |
Wilshire Liquid Alternative Equity Hedge Index |
15.23 |
6.37 |
5.61 | |
| No Deduction of Taxes [Text Block] |
Performance does not reflect the deduction of taxes that a shareholder may pay on fund distributions or on the redemptions of fund shares.
|
| Updated Performance Information Location [Text Block] |
columbiathreadneedleus.com/investment-products/mutual-funds
|
| AssetsNet |
$ 317,004,520
|
| Holdings Count | Holding |
860
|
| Advisory Fees Paid, Amount |
$ 4,153,501
|
| InvestmentCompanyPortfolioTurnover |
308.00%
|
| Additional Fund Statistics [Text Block] |
Table Summary
Fund net assets |
$317,004,520 |
Total number of portfolio holdings |
860 |
Management services fees (represents 1.41% of Fund average net assets) |
$4,153,501 |
Portfolio turnover for the reporting period |
308% | |
| Holdings [Text Block] |
Table Summary
Information Technology |
26.6% |
Financials |
13.5% |
Health Care |
12.9% |
Industrials |
12.2% |
Consumer Discretionary |
6.1% |
Other |
21.2% |
Health Care |
(12.3%) |
Information Technology |
(6.1%) |
Consumer Discretionary |
(4.6%) |
Financials |
(3.7%) |
Industrials |
(2.4%) |
Other |
(5.4%) |
Table Summary
|
Long |
Equity Risk |
49.1% |
|
Short |
Equity Risk |
55.0% |
Table Summary
Common Stocks |
92.5% |
Money Market Funds |
2.1% |
Call Option Contracts Purchased |
1.2% |
Other |
0.9% |
Common Stocks |
(34.5%) |
Exchange-Traded Equity Funds |
(2.3%) |
Other |
(0.0%)Footnote Reference* |
| Footnote |
Description |
Footnote* |
Percentage rounds to less than 0.1% or (0.1)%. | |
| Material Fund Change [Text Block] |
This is a summary of the changes to the Fund. For more complete information, you may review the Fund’s prospectus, which is available at columbiathreadneedleus.com/resources/literature or upon request at 1-800-345-6611. Effective March 12, 2026 (the Effective Date), Los Angeles Capital Management LLC assumed day-to-day management of a portion of the Fund’s portfolio. |
| Material Fund Change Adviser [Text Block] |
Effective March 12, 2026 (the Effective Date), Los Angeles Capital Management LLC assumed day-to-day management of a portion of the Fund’s portfolio.
|
| Summary of Change Legend [Text Block] |
This is a summary of the changes to the Fund. For more complete information, you may review the Fund’s prospectus, which is available at columbiathreadneedleus.com/resources/literature or upon request at 1-800-345-6611.
|
| Updated Prospectus Phone Number |
1-800-345-6611
|
| Updated Prospectus Web Address |
columbiathreadneedleus.com/resources/literature
|