Shareholder Report
Apr. 30, 2026
USD ($)
Holding
What were the Fund costs for the last six months?
(Based on a hypothetical $10,000 investment)
| Class | Costs of a $10,000 investment | Costs paid as a percentage of a $10,000 investment |
| Investor Class (TVFVX) | $74 | 1.36% |
Key Fund Statistics
| Fund net assets | $982,341,603 |
| Total number of portfolio holdings | 37 |
| Total advisory fee paid | $4,085,076 |
| Portfolio turnover rate, as of the end of the reporting period | 13% |
Graphical Representation of Holdings
The tables below show the investment makeup of the Fund as of the report date.
Summary of Investments by Sector*
| Oil & Gas Production & Services | 17.3% |
| Building Products | 9.6% |
| Automotive | 9.5% |
| Metals & Mining | 9.2% |
| Diversified Holding Companies | 8.6% |
| Transportation & Logistics | 7.0% |
| Capital Equipment | 5.8% |
| Banks | 5.4% |
| Energy - Refining & Marketing | 4.1% |
| Media | 2.5% |
| Insurance | 2.3% |
| Materials/Diversified Chemicals | 2.2% |
| Commercial Services | 2.2% |
| Others^ | 4.5% |
| Purchased Options | 0.2% |
| Short-Term Investments | 8.3% |
| Other Assets less Liabilities | 1.3% |
| Total | 100.0% |
| * |
(% of Net Assets) |
| ^ |
Includes Non-U.S. Real Estate Operating Companies, Consumer Products and Brokerages & Exchanges. |
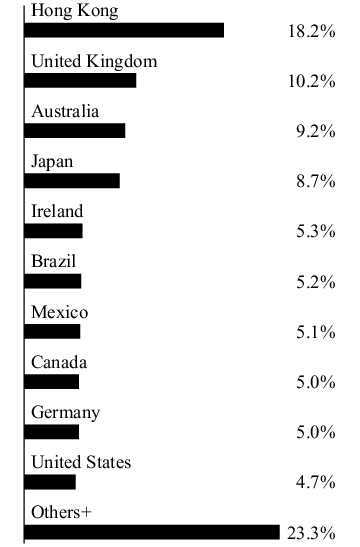
| + |
Includes Ireland, Bermuda, South Korea, Mexico and Philippines. |
Country Concentration*

What were the Fund costs for the last six months?
(Based on a hypothetical $10,000 investment)
| Class | Costs of a $10,000 investment | Costs paid as a percentage of a $10,000 investment |
| Institutional Class (TAVFX) | $61 | 1.11% |
Key Fund Statistics
| Fund net assets | $982,341,603 |
| Total number of portfolio holdings | 37 |
| Total advisory fee paid | $4,085,076 |
| Portfolio turnover rate, as of the end of the reporting period | 13% |
Graphical Representation of Holdings
The tables below show the investment makeup of the Fund as of the report date.
Summary of Investments by Sector*
| Oil & Gas Production & Services | 17.3% |
| Building Products | 9.6% |
| Automotive | 9.5% |
| Metals & Mining | 9.2% |
| Diversified Holding Companies | 8.6% |
| Transportation & Logistics | 7.0% |
| Capital Equipment | 5.8% |
| Banks | 5.4% |
| Energy - Refining & Marketing | 4.1% |
| Media | 2.5% |
| Insurance | 2.3% |
| Materials/Diversified Chemicals | 2.2% |
| Commercial Services | 2.2% |
| Others^ | 4.5% |
| Purchased Options | 0.2% |
| Short-Term Investments | 8.3% |
| Other Assets less Liabilities | 1.3% |
| Total | 100.0% |
| * |
(% of Net Assets) |
| ^ |
Includes Non-U.S. Real Estate Operating Companies, Consumer Products and Brokerages & Exchanges. |
| + |
Includes Ireland, Bermuda, South Korea, Mexico and Philippines. |
Country Concentration*
What were the Fund costs for the last six months?
(Based on a hypothetical $10,000 investment)
| Class | Costs of a $10,000 investment | Costs paid as a percentage of a $10,000 investment |
| Z Class (TAVZX) | $58 | 1.06% |
Key Fund Statistics
| Fund net assets | $982,341,603 |
| Total number of portfolio holdings | 37 |
| Total advisory fee paid | $4,085,076 |
| Portfolio turnover rate, as of the end of the reporting period | 13% |
Graphical Representation of Holdings
The tables below show the investment makeup of the Fund as of the report date.
Summary of Investments by Sector*
| Oil & Gas Production & Services | 17.3% |
| Building Products | 9.6% |
| Automotive | 9.5% |
| Metals & Mining | 9.2% |
| Diversified Holding Companies | 8.6% |
| Transportation & Logistics | 7.0% |
| Capital Equipment | 5.8% |
| Banks | 5.4% |
| Energy - Refining & Marketing | 4.1% |
| Media | 2.5% |
| Insurance | 2.3% |
| Materials/Diversified Chemicals | 2.2% |
| Commercial Services | 2.2% |
| Others^ | 4.5% |
| Purchased Options | 0.2% |
| Short-Term Investments | 8.3% |
| Other Assets less Liabilities | 1.3% |
| Total | 100.0% |
| * |
(% of Net Assets) |
| ^ |
Includes Non-U.S. Real Estate Operating Companies, Consumer Products and Brokerages & Exchanges. |
| + |
Includes Ireland, Bermuda, South Korea, Mexico and Philippines. |
Country Concentration*

What were the Fund costs for the last six months?
(Based on a hypothetical $10,000 investment)
| Class | Costs of a $10,000 investment | Costs paid as a percentage of a $10,000 investment |
| Z Class (TASZX) | $58 | 1.06% |
Key Fund Statistics
| Fund net assets | $200,713,013 |
| Total number of portfolio holdings | 36 |
| Total advisory fee paid, net | $775,681 |
| Portfolio turnover rate, as of the end of the reporting period | 25% |
Graphical Representation of Holdings
The tables below show the investment makeup of the Fund as of the report date.
Summary of Investments by Sector*
| Banks & Thrifts | 15.0% |
| Healthcare | 9.7% |
| Insurance & Reinsurance | 8.7% |
| Financials | 8.0% |
| Oil & Gas Production & Services | 7.1% |
| Industrial Services | 5.8% |
| Consulting & Information Technology Services | 5.2% |
| Materials/Diversified Chemicals | 4.5% |
| Building Products | 3.7% |
| Home Building | 3.6% |
| Consumer Discretionary | 3.6% |
| U.S. Real Estate Operating Companies | 3.5% |
| Industrial Equipment | 3.0% |
| Energy - Refining & Marketing | 2.8% |
| Metals Manufacturing | 2.5% |
| Automotive | 2.5% |
| Others^ | 4.3% |
| Short-Term Investments | 4.7% |
| Other Assets less Liabilities | 1.8% |
| Total | 100.0% |
| * |
(% of Net Assets) |
| ^ |
Includes Commercial Services, Information Technology and Real Estate Services. |
Country Concentration*

What were the Fund costs for the last six months?
(Based on a hypothetical $10,000 investment)
| Class | Costs of a $10,000 investment | Costs paid as a percentage of a $10,000 investment |
| Institutional Class (TASCX) | $63 | 1.16% |
Key Fund Statistics
| Fund net assets | $200,713,013 |
| Total number of portfolio holdings | 36 |
| Total advisory fee paid, net | $775,681 |
| Portfolio turnover rate, as of the end of the reporting period | 25% |
Graphical Representation of Holdings
The tables below show the investment makeup of the Fund as of the report date.
Summary of Investments by Sector*
| Banks & Thrifts | 15.0% |
| Healthcare | 9.7% |
| Insurance & Reinsurance | 8.7% |
| Financials | 8.0% |
| Oil & Gas Production & Services | 7.1% |
| Industrial Services | 5.8% |
| Consulting & Information Technology Services | 5.2% |
| Materials/Diversified Chemicals | 4.5% |
| Building Products | 3.7% |
| Home Building | 3.6% |
| Consumer Discretionary | 3.6% |
| U.S. Real Estate Operating Companies | 3.5% |
| Industrial Equipment | 3.0% |
| Energy - Refining & Marketing | 2.8% |
| Metals Manufacturing | 2.5% |
| Automotive | 2.5% |
| Others^ | 4.3% |
| Short-Term Investments | 4.7% |
| Other Assets less Liabilities | 1.8% |
| Total | 100.0% |
| * |
(% of Net Assets) |
| ^ |
Includes Commercial Services, Information Technology and Real Estate Services. |
Country Concentration*
What were the Fund costs for the last six months?
(Based on a hypothetical $10,000 investment)
| Class | Costs of a $10,000 investment | Costs paid as a percentage of a $10,000 investment |
| Investor Class (TVSVX) | $77 | 1.41% |
Key Fund Statistics
| Fund net assets | $200,713,013 |
| Total number of portfolio holdings | 36 |
| Total advisory fee paid, net | $775,681 |
| Portfolio turnover rate, as of the end of the reporting period | 25% |
Graphical Representation of Holdings
The tables below show the investment makeup of the Fund as of the report date.
Summary of Investments by Sector*
| Banks & Thrifts | 15.0% |
| Healthcare | 9.7% |
| Insurance & Reinsurance | 8.7% |
| Financials | 8.0% |
| Oil & Gas Production & Services | 7.1% |
| Industrial Services | 5.8% |
| Consulting & Information Technology Services | 5.2% |
| Materials/Diversified Chemicals | 4.5% |
| Building Products | 3.7% |
| Home Building | 3.6% |
| Consumer Discretionary | 3.6% |
| U.S. Real Estate Operating Companies | 3.5% |
| Industrial Equipment | 3.0% |
| Energy - Refining & Marketing | 2.8% |
| Metals Manufacturing | 2.5% |
| Automotive | 2.5% |
| Others^ | 4.3% |
| Short-Term Investments | 4.7% |
| Other Assets less Liabilities | 1.8% |
| Total | 100.0% |
| * |
(% of Net Assets) |
| ^ |
Includes Commercial Services, Information Technology and Real Estate Services. |
Country Concentration*

What were the Fund costs for the last six months?
(Based on a hypothetical $10,000 investment)
| Class | Costs of a $10,000 investment | Costs paid as a percentage of a $10,000 investment |
| Investor Class (TVRVX) | $68 | 1.42% |
Key Fund Statistics
| Fund net assets | $305,633,775 |
| Total number of portfolio holdings | 36 |
| Total advisory fee paid, net | $1,548,943 |
| Portfolio turnover rate, as of the end of the reporting period | 9% |
Graphical Representation of Holdings
The tables below show the investment makeup of the Fund as of the report date.
Summary of Investments by Sector*
| Non-U.S. Real Estate Operating Companies | 15.8% |
| U.S. Homebuilder | 13.2% |
| U.S. Real Estate Investment Trusts | 12.5% |
| Consulting/Management | 12.2% |
| Mortgage Finance | 10.2% |
| Non-U.S. Real Estate Investment Trusts | 8.1% |
| U.S. Real Estate Operating Companies | 6.4% |
| Non-U.S. Real Estate Consulting/Management | 4.9% |
| Industrial Services | 4.2% |
| Non-U.S. Homebuilder | 3.1% |
| Hospitality | 2.5% |
| Industrial Distribution | 2.1% |
| Forest Products & Paper | 1.2% |
| Purchased Options** | 0.0% |
| Short-Term Investments | 3.0% |
| Other Assets less Liabilities | 0.6% |
| Total | 100.0% |
| * |
(% of Net Assets) |
| ** |
Amount less than 0.01%. |
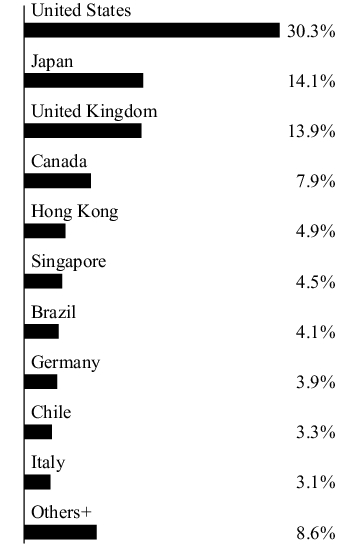
Country Concentration*
What were the Fund costs for the last six months?
(Based on a hypothetical $10,000 investment)
| Class | Costs of a $10,000 investment | Costs paid as a percentage of a $10,000 investment |
| Institutional Class (TAREX) | $56 | 1.17% |
Key Fund Statistics
| Fund net assets | $305,633,775 |
| Total number of portfolio holdings | 36 |
| Total advisory fee paid, net | $1,548,943 |
| Portfolio turnover rate, as of the end of the reporting period | 9% |
Graphical Representation of Holdings
The tables below show the investment makeup of the Fund as of the report date.
Summary of Investments by Sector*
| Non-U.S. Real Estate Operating Companies | 15.8% |
| U.S. Homebuilder | 13.2% |
| U.S. Real Estate Investment Trusts | 12.5% |
| Consulting/Management | 12.2% |
| Mortgage Finance | 10.2% |
| Non-U.S. Real Estate Investment Trusts | 8.1% |
| U.S. Real Estate Operating Companies | 6.4% |
| Non-U.S. Real Estate Consulting/Management | 4.9% |
| Industrial Services | 4.2% |
| Non-U.S. Homebuilder | 3.1% |
| Hospitality | 2.5% |
| Industrial Distribution | 2.1% |
| Forest Products & Paper | 1.2% |
| Purchased Options** | 0.0% |
| Short-Term Investments | 3.0% |
| Other Assets less Liabilities | 0.6% |
| Total | 100.0% |
| * |
(% of Net Assets) |
| ** |
Amount less than 0.01%. |
Country Concentration*

What were the Fund costs for the last six months?
(Based on a hypothetical $10,000 investment)
| Class | Costs of a $10,000 investment | Costs paid as a percentage of a $10,000 investment |
| Z Class (TARZX) | $52 | 1.07% |
Key Fund Statistics
| Fund net assets | $305,633,775 |
| Total number of portfolio holdings | 36 |
| Total advisory fee paid, net | $1,548,943 |
| Portfolio turnover rate, as of the end of the reporting period | 9% |
Graphical Representation of Holdings
The tables below show the investment makeup of the Fund as of the report date.
Summary of Investments by Sector*
| Non-U.S. Real Estate Operating Companies | 15.8% |
| U.S. Homebuilder | 13.2% |
| U.S. Real Estate Investment Trusts | 12.5% |
| Consulting/Management | 12.2% |
| Mortgage Finance | 10.2% |
| Non-U.S. Real Estate Investment Trusts | 8.1% |
| U.S. Real Estate Operating Companies | 6.4% |
| Non-U.S. Real Estate Consulting/Management | 4.9% |
| Industrial Services | 4.2% |
| Non-U.S. Homebuilder | 3.1% |
| Hospitality | 2.5% |
| Industrial Distribution | 2.1% |
| Forest Products & Paper | 1.2% |
| Purchased Options** | 0.0% |
| Short-Term Investments | 3.0% |
| Other Assets less Liabilities | 0.6% |
| Total | 100.0% |
| * |
(% of Net Assets) |
| ** |
Amount less than 0.01%. |
Country Concentration*

What were the Fund costs for the last six months?
(Based on a hypothetical $10,000 investment)
| Class | Costs of a $10,000 investment | Costs paid as a percentage of a $10,000 investment |
| Z Class (REIZX) | $50 | 1.00% |
Key Fund Statistics
| Fund net assets | $111,782,824 |
| Total number of portfolio holdings | 26 |
| Total advisory fee paid, net | $235,211 |
| Portfolio turnover rate, as of the end of the reporting period | 13% |
Graphical Representation of Holdings
The tables below show the investment makeup of the Fund as of the report date.
Summary of Investments by Sector*
| Non-U.S. Real Estate Operating Companies | 62.9% |
| Non-U.S. Real Estate Investment Trusts | 21.8% |
| Non-U.S. Homebuilder | 7.3% |
| Non-U.S. Real Estate Consulting/Management | 3.0% |
| Short-Term Investments | 4.7% |
| Other Assets less Liabilities | 0.3% |
| Total | 100.0% |
| * |
(% of Net Assets) |
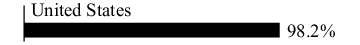
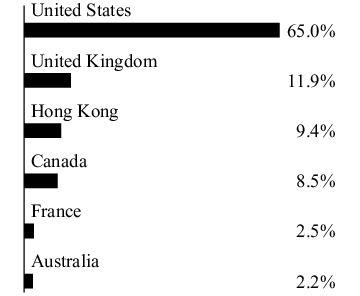
| + |
Includes Netherlands, Luxembourg, Singapore, Belgium, Thailand, Spain and Philippines. |
Country Concentration*

What were the Fund costs for the last six months?
(Based on a hypothetical $10,000 investment)
| Class | Costs of a $10,000 investment | Costs paid as a percentage of a $10,000 investment |
| Institutional Class (REIFX) | $50 | 1.00% |
Key Fund Statistics
| Fund net assets | $111,782,824 |
| Total number of portfolio holdings | 26 |
| Total advisory fee paid, net | $235,211 |
| Portfolio turnover rate, as of the end of the reporting period | 13% |
Graphical Representation of Holdings
The tables below show the investment makeup of the Fund as of the report date.
Summary of Investments by Sector*
| Non-U.S. Real Estate Operating Companies | 62.9% |
| Non-U.S. Real Estate Investment Trusts | 21.8% |
| Non-U.S. Homebuilder | 7.3% |
| Non-U.S. Real Estate Consulting/Management | 3.0% |
| Short-Term Investments | 4.7% |
| Other Assets less Liabilities | 0.3% |
| Total | 100.0% |
| * |
(% of Net Assets) |
| + |
Includes Netherlands, Luxembourg, Singapore, Belgium, Thailand, Spain and Philippines. |
Country Concentration*