Shareholder Report
|
12 Months Ended |
|
Apr. 30, 2026
USD ($)
Holding
|
|---|
| Shareholder Report [Line Items] |
|
| Document Type |
N-CSR
|
| Amendment Flag |
false
|
| Registrant Name |
Columbia Funds Series Trust
|
| Entity Central Index Key |
0001097519
|
| Entity Investment Company Type |
N-1A
|
| Document Period End Date |
Apr. 30, 2026
|
| Shareholder Report Annual or Semi-Annual |
Annual Shareholder Report
|
| C000029800 |
|
| Shareholder Report [Line Items] |
|
| Fund Name |
Columbia California Intermediate Municipal Bond Fund
|
| Class Name |
Class A
|
| Trading Symbol |
NACMX
|
| Annual or Semi-Annual Statement [Text Block] |
This annual shareholder report contains important information about Columbia California Intermediate Municipal Bond Fund (the Fund) for the period of May 1, 2025 to April 30, 2026.
|
| Additional Information [Text Block] |
You can find additional information about the Fund at columbiathreadneedleus.com/resources/literature. You can also request more information by contacting us at 1-800-345-6611.
|
| Additional Information Phone Number |
1-800-345-6611
|
| Additional Information Website |
columbiathreadneedleus.com/resources/literature
|
| Expenses [Text Block] |
What were the Fund costs for the reporting period? (Based on a hypothetical $10,000 investment)
Table Summary
Class |
Cost of a $10,000 investment |
Cost paid as a percentage of a $10,000 investment |
Class A |
$75 |
0.73% | |
| Expenses Paid, Amount |
$ 75
|
| Expense Ratio, Percent |
0.73%
|
| Factors Affecting Performance [Text Block] |
Management's Discussion of Fund Performance The performance of Class A shares for the period presented is shown in the Average Annual Total Returns table. Top Performance ContributorsSector allocation | An overweight allocation to the airport sector and underweight allocations to the state general obligation (GO) bond and prepaid gas sectors contributed to the Fund’s performance relative to its benchmark during the period. Sector selection | Security selection in the prepaid gas and education sectors added to relative performance. Credit quality | Security selection in single-A-rated bonds added to benchmark-relative performance. Overweight allocations to BBB and non-rated bonds also added to relative performance. Yield carry | The Fund’s higher-than-benchmark yield contributed to benchmark-relative performance. Top Performance DetractorsYield curve positioning | The Fund’s yield curve positioning, specifically its overweight to the 20-year maturity space, detracted from benchmark-relative performance. The municipal market delivered strong positive performance across the yield curve as market interest rates declined across the maturity spectrum. The largest rate declines occurred in the short-intermediate space, with bonds under 19 years to maturity realizing larger declines than the longest end of the spectrum, where declines were more modest. The Fund’s overweight position proved to be a headwind as the decline in yield was limited in this space during the period. Sector security selection | Security selection in the local GO, airport, hospital and continuing care retirement community (CCRC) sectors detracted from relative performance. Credit quality | Security selection in BBB-rated bonds detracted from performance, relative to the Fund’s benchmark. |
| Performance Past Does Not Indicate Future [Text] |
The Fund's past performance is not a good predictor of the Fund's future performance.
|
| Line Graph [Table Text Block] |
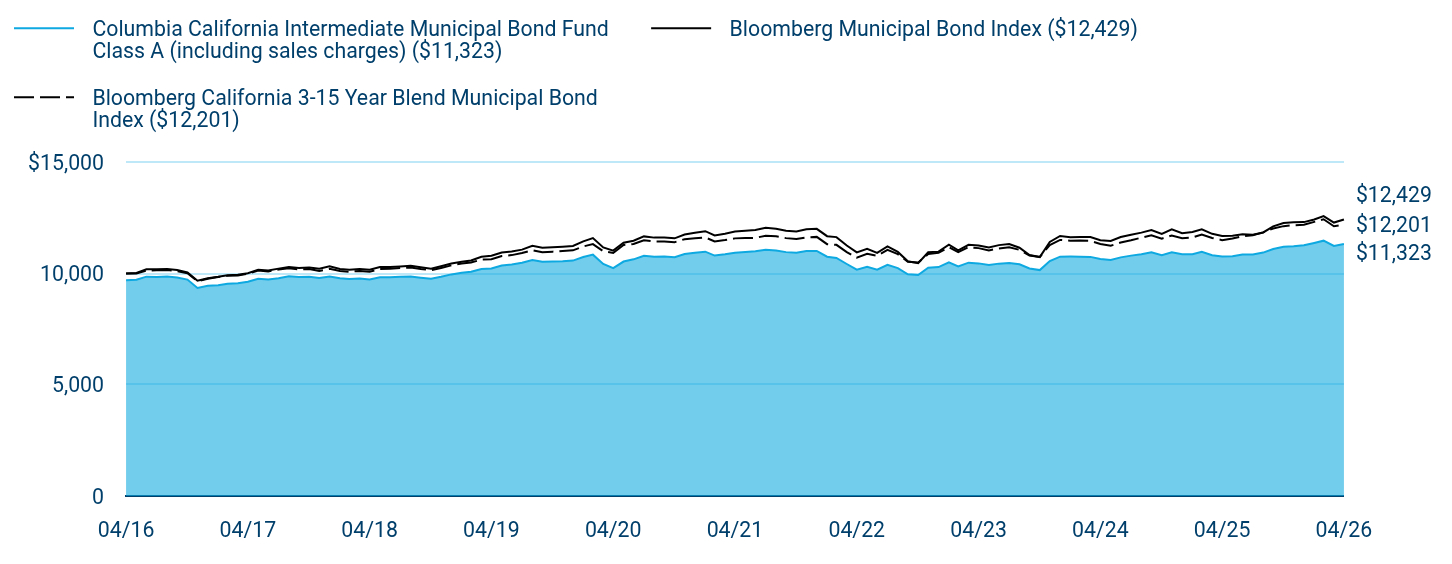
Table Summary
|
Columbia California Intermediate Municipal Bond Fund Class A (including sales charges) ($11,323) |
Bloomberg Municipal Bond Index ($12,429) |
Bloomberg California 3-15 Year Blend Municipal Bond Index ($12,201) |
04/16 |
$9,701 |
$10,000 |
$10,000 |
05/16 |
$9,722 |
$10,027 |
$10,005 |
06/16 |
$9,859 |
$10,187 |
$10,130 |
07/16 |
$9,842 |
$10,193 |
$10,145 |
08/16 |
$9,862 |
$10,207 |
$10,153 |
09/16 |
$9,816 |
$10,156 |
$10,103 |
10/16 |
$9,726 |
$10,049 |
$10,010 |
11/16 |
$9,352 |
$9,674 |
$9,657 |
12/16 |
$9,446 |
$9,788 |
$9,761 |
01/17 |
$9,476 |
$9,852 |
$9,841 |
02/17 |
$9,541 |
$9,921 |
$9,900 |
03/17 |
$9,562 |
$9,942 |
$9,915 |
04/17 |
$9,629 |
$10,014 |
$9,986 |
05/17 |
$9,761 |
$10,173 |
$10,132 |
06/17 |
$9,735 |
$10,137 |
$10,090 |
07/17 |
$9,784 |
$10,219 |
$10,178 |
08/17 |
$9,879 |
$10,297 |
$10,232 |
09/17 |
$9,843 |
$10,244 |
$10,187 |
10/17 |
$9,855 |
$10,269 |
$10,206 |
11/17 |
$9,801 |
$10,214 |
$10,116 |
12/17 |
$9,869 |
$10,321 |
$10,210 |
01/18 |
$9,787 |
$10,200 |
$10,112 |
02/18 |
$9,758 |
$10,169 |
$10,080 |
03/18 |
$9,770 |
$10,207 |
$10,114 |
04/18 |
$9,735 |
$10,170 |
$10,083 |
05/18 |
$9,833 |
$10,287 |
$10,202 |
06/18 |
$9,835 |
$10,295 |
$10,214 |
07/18 |
$9,857 |
$10,320 |
$10,247 |
08/18 |
$9,870 |
$10,347 |
$10,275 |
09/18 |
$9,814 |
$10,280 |
$10,207 |
10/18 |
$9,760 |
$10,217 |
$10,148 |
11/18 |
$9,850 |
$10,330 |
$10,251 |
12/18 |
$9,960 |
$10,453 |
$10,365 |
01/19 |
$10,031 |
$10,532 |
$10,448 |
02/19 |
$10,080 |
$10,589 |
$10,495 |
03/19 |
$10,200 |
$10,756 |
$10,622 |
04/19 |
$10,222 |
$10,797 |
$10,644 |
05/19 |
$10,361 |
$10,946 |
$10,789 |
06/19 |
$10,401 |
$10,986 |
$10,827 |
07/19 |
$10,481 |
$11,074 |
$10,922 |
08/19 |
$10,610 |
$11,249 |
$11,049 |
09/19 |
$10,531 |
$11,159 |
$10,957 |
10/19 |
$10,542 |
$11,179 |
$10,983 |
11/19 |
$10,551 |
$11,207 |
$11,009 |
12/19 |
$10,581 |
$11,241 |
$11,041 |
01/20 |
$10,740 |
$11,443 |
$11,216 |
02/20 |
$10,848 |
$11,591 |
$11,321 |
03/20 |
$10,430 |
$11,170 |
$11,004 |
04/20 |
$10,239 |
$11,030 |
$10,925 |
05/20 |
$10,538 |
$11,381 |
$11,281 |
06/20 |
$10,637 |
$11,475 |
$11,324 |
07/20 |
$10,797 |
$11,668 |
$11,492 |
08/20 |
$10,756 |
$11,613 |
$11,437 |
09/20 |
$10,764 |
$11,616 |
$11,435 |
10/20 |
$10,733 |
$11,581 |
$11,408 |
11/20 |
$10,873 |
$11,755 |
$11,542 |
12/20 |
$10,933 |
$11,827 |
$11,582 |
01/21 |
$10,982 |
$11,902 |
$11,623 |
02/21 |
$10,807 |
$11,713 |
$11,442 |
03/21 |
$10,866 |
$11,786 |
$11,503 |
04/21 |
$10,935 |
$11,884 |
$11,579 |
05/21 |
$10,964 |
$11,920 |
$11,592 |
06/21 |
$11,002 |
$11,953 |
$11,604 |
07/21 |
$11,071 |
$12,052 |
$11,694 |
08/21 |
$11,037 |
$12,008 |
$11,671 |
09/21 |
$10,961 |
$11,921 |
$11,590 |
10/21 |
$10,938 |
$11,886 |
$11,556 |
11/21 |
$11,007 |
$11,987 |
$11,623 |
12/21 |
$11,015 |
$12,007 |
$11,646 |
01/22 |
$10,755 |
$11,678 |
$11,319 |
02/22 |
$10,699 |
$11,636 |
$11,288 |
03/22 |
$10,427 |
$11,259 |
$10,964 |
04/22 |
$10,174 |
$10,947 |
$10,713 |
05/22 |
$10,297 |
$11,110 |
$10,887 |
06/22 |
$10,169 |
$10,928 |
$10,794 |
07/22 |
$10,387 |
$11,217 |
$11,062 |
08/22 |
$10,240 |
$10,971 |
$10,869 |
09/22 |
$9,965 |
$10,550 |
$10,529 |
10/22 |
$9,933 |
$10,462 |
$10,492 |
11/22 |
$10,258 |
$10,952 |
$10,874 |
12/22 |
$10,289 |
$10,983 |
$10,929 |
01/23 |
$10,500 |
$11,298 |
$11,187 |
02/23 |
$10,318 |
$11,043 |
$10,960 |
03/23 |
$10,488 |
$11,288 |
$11,181 |
04/23 |
$10,455 |
$11,262 |
$11,141 |
05/23 |
$10,381 |
$11,165 |
$11,038 |
06/23 |
$10,444 |
$11,276 |
$11,127 |
07/23 |
$10,476 |
$11,321 |
$11,175 |
08/23 |
$10,412 |
$11,158 |
$11,065 |
09/23 |
$10,229 |
$10,831 |
$10,805 |
10/23 |
$10,153 |
$10,739 |
$10,743 |
11/23 |
$10,563 |
$11,420 |
$11,279 |
12/23 |
$10,758 |
$11,686 |
$11,509 |
01/24 |
$10,759 |
$11,626 |
$11,475 |
02/24 |
$10,758 |
$11,641 |
$11,479 |
03/24 |
$10,747 |
$11,641 |
$11,465 |
04/24 |
$10,649 |
$11,497 |
$11,330 |
05/24 |
$10,606 |
$11,463 |
$11,249 |
06/24 |
$10,726 |
$11,639 |
$11,394 |
07/24 |
$10,804 |
$11,745 |
$11,494 |
08/24 |
$10,870 |
$11,837 |
$11,610 |
09/24 |
$10,959 |
$11,954 |
$11,719 |
10/24 |
$10,827 |
$11,780 |
$11,567 |
11/24 |
$10,949 |
$11,984 |
$11,710 |
12/24 |
$10,862 |
$11,809 |
$11,585 |
01/25 |
$10,863 |
$11,868 |
$11,618 |
02/25 |
$10,973 |
$11,986 |
$11,753 |
03/25 |
$10,819 |
$11,783 |
$11,595 |
04/25 |
$10,764 |
$11,688 |
$11,500 |
05/25 |
$10,777 |
$11,695 |
$11,576 |
06/25 |
$10,857 |
$11,768 |
$11,678 |
07/25 |
$10,859 |
$11,744 |
$11,722 |
08/25 |
$10,941 |
$11,846 |
$11,848 |
09/25 |
$11,100 |
$12,121 |
$12,025 |
10/25 |
$11,205 |
$12,271 |
$12,129 |
11/25 |
$11,230 |
$12,299 |
$12,168 |
12/25 |
$11,267 |
$12,310 |
$12,190 |
01/26 |
$11,374 |
$12,426 |
$12,320 |
02/26 |
$11,476 |
$12,581 |
$12,438 |
03/26 |
$11,239 |
$12,289 |
$12,124 |
04/26 |
$11,323 |
$12,429 |
$12,201 |
|
| Average Annual Return [Table Text Block] |
Table Summary
Average Annual Total Returns (%) |
1 year |
5 years |
10 years |
Class A (excluding sales charges) |
5.19 |
0.70 |
1.56 |
Class A (including sales charges) |
2.01 |
0.09 |
1.25 |
Bloomberg Municipal Bond Index |
6.34 |
0.90 |
2.20 |
Bloomberg California 3-15 Year Blend Municipal Bond Index |
6.10 |
1.05 |
2.01 | |
| No Deduction of Taxes [Text Block] |
Performance does not reflect the deduction of taxes that a shareholder may pay on fund distributions or on the redemptions of fund shares.
|
| Updated Performance Information Location [Text Block] |
columbiathreadneedleus.com/investment-products/mutual-funds
|
| AssetsNet |
$ 267,886,881
|
| Holdings Count | Holding |
190
|
| Advisory Fees Paid, Amount |
$ 1,364,386
|
| InvestmentCompanyPortfolioTurnover |
14.00%
|
| Additional Fund Statistics [Text Block] |
Table Summary
Fund net assets |
$267,886,881 |
Total number of portfolio holdings |
190 |
Management services fees (represents 0.47% of Fund average net assets) |
$1,364,386 |
Portfolio turnover for the reporting period |
14% | |
| Holdings [Text Block] |
Table Summary
Municipal Bonds |
98.1% |
Other |
1.0% | |
| Largest Holdings [Text Block] |
Table Summary
Los Angeles Department of Water & Power, Series 2023D 5.000% 07/01/2041 |
2.4% |
Southern California Public Power Authority, Series 2024A 5.000% 04/01/2055 |
2.4% |
Burbank-Glendale-Pasadena Airport Authority Brick Campaign, Series 2024B 5.250% 07/01/2042 |
2.2% |
State of California, Series 2021 5.000% 12/01/2036 |
2.2% |
State of California, Series 2024 5.250% 08/01/2044 |
1.7% |
California State University, Series 2024A 5.000% 11/01/2042 |
1.7% |
Los Angeles Unified School District, Series 2018B-1 5.000% 07/01/2032 |
1.6% |
Foothill-Eastern Transportation Corridor Agency, Series 2015 0.000% 01/15/2033 |
1.5% |
Southern California Public Power Authority, Series 2024 5.000% 07/01/2041 |
1.4% |
San Francisco City & County Airport Commission-San Francisco International Airport, Series 2019 5.000% 05/01/2036 |
1.3% | |
| Material Fund Change [Text Block] |
|
| C000255077 |
|
| Shareholder Report [Line Items] |
|
| Fund Name |
Columbia California Intermediate Municipal Bond Fund
|
| Class Name |
Class S
|
| Trading Symbol |
NCMDX
|
| Annual or Semi-Annual Statement [Text Block] |
This annual shareholder report contains important information about Columbia California Intermediate Municipal Bond Fund (the Fund) for the period of May 1, 2025 to April 30, 2026.
|
| Additional Information [Text Block] |
You can find additional information about the Fund at columbiathreadneedleus.com/resources/literature. You can also request more information by contacting us at 1-800-345-6611.
|
| Additional Information Phone Number |
1-800-345-6611
|
| Additional Information Website |
columbiathreadneedleus.com/resources/literature
|
| Expenses [Text Block] |
What were the Fund costs for the reporting period? (Based on a hypothetical $10,000 investment)
Table Summary
Class |
Cost of a $10,000 investment |
Cost paid as a percentage of a $10,000 investment |
Class S |
$49 |
0.48% | |
| Expenses Paid, Amount |
$ 49
|
| Expense Ratio, Percent |
0.48%
|
| Factors Affecting Performance [Text Block] |
Management's Discussion of Fund Performance The performance of Class S shares for the period presented is shown in the Average Annual Total Returns table. Top Performance ContributorsSector allocation | An overweight allocation to the airport sector and underweight allocations to the state general obligation (GO) bond and prepaid gas sectors contributed to the Fund’s performance relative to its benchmark during the period. Sector selection | Security selection in the prepaid gas and education sectors added to relative performance. Credit quality | Security selection in single-A-rated bonds added to benchmark-relative performance. Overweight allocations to BBB and non-rated bonds also added to relative performance. Yield carry | The Fund’s higher-than-benchmark yield contributed to benchmark-relative performance. Top Performance DetractorsYield curve positioning | The Fund’s yield curve positioning, specifically its overweight to the 20-year maturity space, detracted from benchmark-relative performance. The municipal market delivered strong positive performance across the yield curve as market interest rates declined across the maturity spectrum. The largest rate declines occurred in the short-intermediate space, with bonds under 19 years to maturity realizing larger declines than the longest end of the spectrum, where declines were more modest. The Fund’s overweight position proved to be a headwind as the decline in yield was limited in this space during the period. Sector security selection | Security selection in the local GO, airport, hospital and continuing care retirement community (CCRC) sectors detracted from relative performance. Credit quality | Security selection in BBB-rated bonds detracted from performance, relative to the Fund’s benchmark. |
| Performance Past Does Not Indicate Future [Text] |
The Fund's past performance is not a good predictor of the Fund's future performance.
|
| Line Graph [Table Text Block] |

Table Summary
|
Columbia California Intermediate Municipal Bond Fund Class S ($11,964) |
Bloomberg Municipal Bond Index ($12,429) |
Bloomberg California 3-15 Year Blend Municipal Bond Index ($12,201) |
04/16 |
$10,000 |
$10,000 |
$10,000 |
05/16 |
$10,014 |
$10,027 |
$10,005 |
06/16 |
$10,167 |
$10,187 |
$10,130 |
07/16 |
$10,152 |
$10,193 |
$10,145 |
08/16 |
$10,164 |
$10,207 |
$10,153 |
09/16 |
$10,129 |
$10,156 |
$10,103 |
10/16 |
$10,029 |
$10,049 |
$10,010 |
11/16 |
$9,653 |
$9,674 |
$9,657 |
12/16 |
$9,753 |
$9,788 |
$9,761 |
01/17 |
$9,786 |
$9,852 |
$9,841 |
02/17 |
$9,845 |
$9,921 |
$9,900 |
03/17 |
$9,878 |
$9,942 |
$9,915 |
04/17 |
$9,949 |
$10,014 |
$9,986 |
05/17 |
$10,088 |
$10,173 |
$10,132 |
06/17 |
$10,054 |
$10,137 |
$10,090 |
07/17 |
$10,116 |
$10,219 |
$10,178 |
08/17 |
$10,207 |
$10,297 |
$10,232 |
09/17 |
$10,172 |
$10,244 |
$10,187 |
10/17 |
$10,187 |
$10,269 |
$10,206 |
11/17 |
$10,132 |
$10,214 |
$10,116 |
12/17 |
$10,205 |
$10,321 |
$10,210 |
01/18 |
$10,132 |
$10,200 |
$10,112 |
02/18 |
$10,094 |
$10,169 |
$10,080 |
03/18 |
$10,119 |
$10,207 |
$10,114 |
04/18 |
$10,084 |
$10,170 |
$10,083 |
05/18 |
$10,178 |
$10,287 |
$10,202 |
06/18 |
$10,182 |
$10,295 |
$10,214 |
07/18 |
$10,207 |
$10,320 |
$10,247 |
08/18 |
$10,233 |
$10,347 |
$10,275 |
09/18 |
$10,177 |
$10,280 |
$10,207 |
10/18 |
$10,123 |
$10,217 |
$10,148 |
11/18 |
$10,218 |
$10,330 |
$10,251 |
12/18 |
$10,325 |
$10,453 |
$10,365 |
01/19 |
$10,411 |
$10,532 |
$10,448 |
02/19 |
$10,454 |
$10,589 |
$10,495 |
03/19 |
$10,591 |
$10,756 |
$10,622 |
04/19 |
$10,615 |
$10,797 |
$10,644 |
05/19 |
$10,762 |
$10,946 |
$10,789 |
06/19 |
$10,796 |
$10,986 |
$10,827 |
07/19 |
$10,892 |
$11,074 |
$10,922 |
08/19 |
$11,029 |
$11,249 |
$11,049 |
09/19 |
$10,949 |
$11,159 |
$10,957 |
10/19 |
$10,962 |
$11,179 |
$10,983 |
11/19 |
$10,974 |
$11,207 |
$11,009 |
12/19 |
$10,997 |
$11,241 |
$11,041 |
01/20 |
$11,176 |
$11,443 |
$11,216 |
02/20 |
$11,290 |
$11,591 |
$11,321 |
03/20 |
$10,846 |
$11,170 |
$11,004 |
04/20 |
$10,649 |
$11,030 |
$10,925 |
05/20 |
$10,974 |
$11,381 |
$11,281 |
06/20 |
$11,079 |
$11,475 |
$11,324 |
07/20 |
$11,248 |
$11,668 |
$11,492 |
08/20 |
$11,208 |
$11,613 |
$11,437 |
09/20 |
$11,208 |
$11,616 |
$11,435 |
10/20 |
$11,189 |
$11,581 |
$11,408 |
11/20 |
$11,337 |
$11,755 |
$11,542 |
12/20 |
$11,401 |
$11,827 |
$11,582 |
01/21 |
$11,456 |
$11,902 |
$11,623 |
02/21 |
$11,275 |
$11,713 |
$11,442 |
03/21 |
$11,328 |
$11,786 |
$11,503 |
04/21 |
$11,413 |
$11,884 |
$11,579 |
05/21 |
$11,446 |
$11,920 |
$11,592 |
06/21 |
$11,477 |
$11,953 |
$11,604 |
07/21 |
$11,563 |
$12,052 |
$11,694 |
08/21 |
$11,529 |
$12,008 |
$11,671 |
09/21 |
$11,442 |
$11,921 |
$11,590 |
10/21 |
$11,420 |
$11,886 |
$11,556 |
11/21 |
$11,505 |
$11,987 |
$11,623 |
12/21 |
$11,516 |
$12,007 |
$11,646 |
01/22 |
$11,235 |
$11,678 |
$11,319 |
02/22 |
$11,189 |
$11,636 |
$11,288 |
03/22 |
$10,907 |
$11,259 |
$10,964 |
04/22 |
$10,644 |
$10,947 |
$10,713 |
05/22 |
$10,775 |
$11,110 |
$10,887 |
06/22 |
$10,643 |
$10,928 |
$10,794 |
07/22 |
$10,874 |
$11,217 |
$11,062 |
08/22 |
$10,721 |
$10,971 |
$10,869 |
09/22 |
$10,435 |
$10,550 |
$10,529 |
10/22 |
$10,403 |
$10,462 |
$10,492 |
11/22 |
$10,746 |
$10,952 |
$10,874 |
12/22 |
$10,793 |
$10,983 |
$10,929 |
01/23 |
$11,017 |
$11,298 |
$11,187 |
02/23 |
$10,827 |
$11,043 |
$10,960 |
03/23 |
$11,008 |
$11,288 |
$11,181 |
04/23 |
$10,965 |
$11,262 |
$11,141 |
05/23 |
$10,889 |
$11,165 |
$11,038 |
06/23 |
$10,969 |
$11,276 |
$11,127 |
07/23 |
$10,994 |
$11,321 |
$11,175 |
08/23 |
$10,929 |
$11,158 |
$11,065 |
09/23 |
$10,738 |
$10,831 |
$10,805 |
10/23 |
$10,672 |
$10,739 |
$10,743 |
11/23 |
$11,095 |
$11,420 |
$11,279 |
12/23 |
$11,302 |
$11,686 |
$11,509 |
01/24 |
$11,305 |
$11,626 |
$11,475 |
02/24 |
$11,306 |
$11,641 |
$11,479 |
03/24 |
$11,297 |
$11,641 |
$11,465 |
04/24 |
$11,208 |
$11,497 |
$11,330 |
05/24 |
$11,165 |
$11,463 |
$11,249 |
06/24 |
$11,294 |
$11,639 |
$11,394 |
07/24 |
$11,366 |
$11,745 |
$11,494 |
08/24 |
$11,438 |
$11,837 |
$11,610 |
09/24 |
$11,535 |
$11,954 |
$11,719 |
10/24 |
$11,398 |
$11,780 |
$11,567 |
11/24 |
$11,540 |
$11,984 |
$11,710 |
12/24 |
$11,450 |
$11,809 |
$11,585 |
01/25 |
$11,443 |
$11,868 |
$11,618 |
02/25 |
$11,561 |
$11,986 |
$11,753 |
03/25 |
$11,412 |
$11,783 |
$11,595 |
04/25 |
$11,344 |
$11,688 |
$11,500 |
05/25 |
$11,372 |
$11,695 |
$11,576 |
06/25 |
$11,447 |
$11,768 |
$11,678 |
07/25 |
$11,452 |
$11,744 |
$11,722 |
08/25 |
$11,540 |
$11,846 |
$11,848 |
09/25 |
$11,724 |
$12,121 |
$12,025 |
10/25 |
$11,837 |
$12,271 |
$12,129 |
11/25 |
$11,866 |
$12,299 |
$12,168 |
12/25 |
$11,908 |
$12,310 |
$12,190 |
01/26 |
$12,010 |
$12,426 |
$12,320 |
02/26 |
$12,133 |
$12,581 |
$12,438 |
03/26 |
$11,885 |
$12,289 |
$12,124 |
04/26 |
$11,964 |
$12,429 |
$12,201 |
|
| Average Annual Return [Table Text Block] |
Table Summary
Average Annual Total Returns (%) |
1 year |
5 years |
10 years |
Class SFootnote Reference(a) |
5.46 |
0.95 |
1.81 |
Bloomberg Municipal Bond Index |
6.34 |
0.90 |
2.20 |
Bloomberg California 3-15 Year Blend Municipal Bond Index |
6.10 |
1.05 |
2.01 | |
| No Deduction of Taxes [Text Block] |
Performance does not reflect the deduction of taxes that a shareholder may pay on fund distributions or on the redemptions of fund shares.
|
| Updated Performance Information Location [Text Block] |
columbiathreadneedleus.com/investment-products/mutual-funds
|
| AssetsNet |
$ 267,886,881
|
| Holdings Count | Holding |
190
|
| Advisory Fees Paid, Amount |
$ 1,364,386
|
| InvestmentCompanyPortfolioTurnover |
14.00%
|
| Additional Fund Statistics [Text Block] |
Table Summary
Fund net assets |
$267,886,881 |
Total number of portfolio holdings |
190 |
Management services fees (represents 0.47% of Fund average net assets) |
$1,364,386 |
Portfolio turnover for the reporting period |
14% | |
| Holdings [Text Block] |
Table Summary
Municipal Bonds |
98.1% |
Other |
1.0% | |
| Largest Holdings [Text Block] |
Table Summary
Los Angeles Department of Water & Power, Series 2023D 5.000% 07/01/2041 |
2.4% |
Southern California Public Power Authority, Series 2024A 5.000% 04/01/2055 |
2.4% |
Burbank-Glendale-Pasadena Airport Authority Brick Campaign, Series 2024B 5.250% 07/01/2042 |
2.2% |
State of California, Series 2021 5.000% 12/01/2036 |
2.2% |
State of California, Series 2024 5.250% 08/01/2044 |
1.7% |
California State University, Series 2024A 5.000% 11/01/2042 |
1.7% |
Los Angeles Unified School District, Series 2018B-1 5.000% 07/01/2032 |
1.6% |
Foothill-Eastern Transportation Corridor Agency, Series 2015 0.000% 01/15/2033 |
1.5% |
Southern California Public Power Authority, Series 2024 5.000% 07/01/2041 |
1.4% |
San Francisco City & County Airport Commission-San Francisco International Airport, Series 2019 5.000% 05/01/2036 |
1.3% | |
| Material Fund Change [Text Block] |
|
| C000122571 |
|
| Shareholder Report [Line Items] |
|
| Fund Name |
Columbia California Intermediate Municipal Bond Fund
|
| Class Name |
Institutional 2 Class
|
| Trading Symbol |
CNBRX
|
| Annual or Semi-Annual Statement [Text Block] |
This annual shareholder report contains important information about Columbia California Intermediate Municipal Bond Fund (the Fund) for the period of May 1, 2025 to April 30, 2026.
|
| Additional Information [Text Block] |
You can find additional information about the Fund at columbiathreadneedleus.com/resources/literature. You can also request more information by contacting us at 1-800-345-6611.
|
| Additional Information Phone Number |
1-800-345-6611
|
| Additional Information Website |
columbiathreadneedleus.com/resources/literature
|
| Expenses [Text Block] |
What were the Fund costs for the reporting period? (Based on a hypothetical $10,000 investment)
Table Summary
Class |
Cost of a $10,000 investment |
Cost paid as a percentage of a $10,000 investment |
Institutional 2 Class |
$48 |
0.47% | |
| Expenses Paid, Amount |
$ 48
|
| Expense Ratio, Percent |
0.47%
|
| Factors Affecting Performance [Text Block] |
Management's Discussion of Fund Performance The performance of Institutional 2 Class shares for the period presented is shown in the Average Annual Total Returns table. Top Performance ContributorsSector allocation | An overweight allocation to the airport sector and underweight allocations to the state general obligation (GO) bond and prepaid gas sectors contributed to the Fund’s performance relative to its benchmark during the period. Sector selection | Security selection in the prepaid gas and education sectors added to relative performance. Credit quality | Security selection in single-A-rated bonds added to benchmark-relative performance. Overweight allocations to BBB and non-rated bonds also added to relative performance. Yield carry | The Fund’s higher-than-benchmark yield contributed to benchmark-relative performance. Top Performance DetractorsYield curve positioning | The Fund’s yield curve positioning, specifically its overweight to the 20-year maturity space, detracted from benchmark-relative performance. The municipal market delivered strong positive performance across the yield curve as market interest rates declined across the maturity spectrum. The largest rate declines occurred in the short-intermediate space, with bonds under 19 years to maturity realizing larger declines than the longest end of the spectrum, where declines were more modest. The Fund’s overweight position proved to be a headwind as the decline in yield was limited in this space during the period. Sector security selection | Security selection in the local GO, airport, hospital and continuing care retirement community (CCRC) sectors detracted from relative performance. Credit quality | Security selection in BBB-rated bonds detracted from performance, relative to the Fund’s benchmark. |
| Performance Past Does Not Indicate Future [Text] |
The Fund's past performance is not a good predictor of the Fund's future performance.
|
| Line Graph [Table Text Block] |
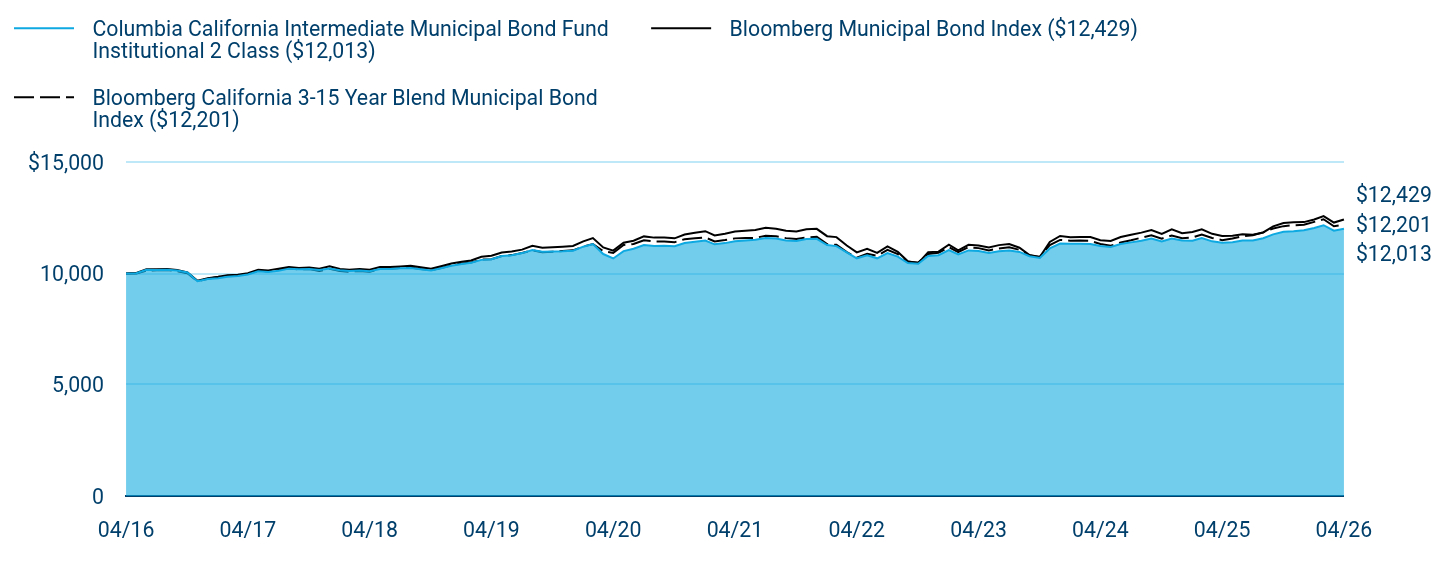
Table Summary
|
Columbia California Intermediate Municipal Bond Fund Institutional 2 Class ($12,013) |
Bloomberg Municipal Bond Index ($12,429) |
Bloomberg California 3-15 Year Blend Municipal Bond Index ($12,201) |
04/16 |
$10,000 |
$10,000 |
$10,000 |
05/16 |
$10,014 |
$10,027 |
$10,005 |
06/16 |
$10,169 |
$10,187 |
$10,130 |
07/16 |
$10,154 |
$10,193 |
$10,145 |
08/16 |
$10,168 |
$10,207 |
$10,153 |
09/16 |
$10,133 |
$10,156 |
$10,103 |
10/16 |
$10,043 |
$10,049 |
$10,010 |
11/16 |
$9,656 |
$9,674 |
$9,657 |
12/16 |
$9,757 |
$9,788 |
$9,761 |
01/17 |
$9,792 |
$9,852 |
$9,841 |
02/17 |
$9,851 |
$9,921 |
$9,900 |
03/17 |
$9,886 |
$9,942 |
$9,915 |
04/17 |
$9,958 |
$10,014 |
$9,986 |
05/17 |
$10,098 |
$10,173 |
$10,132 |
06/17 |
$10,073 |
$10,137 |
$10,090 |
07/17 |
$10,127 |
$10,219 |
$10,178 |
08/17 |
$10,219 |
$10,297 |
$10,232 |
09/17 |
$10,194 |
$10,244 |
$10,187 |
10/17 |
$10,200 |
$10,269 |
$10,206 |
11/17 |
$10,155 |
$10,214 |
$10,116 |
12/17 |
$10,219 |
$10,321 |
$10,210 |
01/18 |
$10,145 |
$10,200 |
$10,112 |
02/18 |
$10,108 |
$10,169 |
$10,080 |
03/18 |
$10,133 |
$10,207 |
$10,114 |
04/18 |
$10,099 |
$10,170 |
$10,083 |
05/18 |
$10,204 |
$10,287 |
$10,202 |
06/18 |
$10,208 |
$10,295 |
$10,214 |
07/18 |
$10,234 |
$10,320 |
$10,247 |
08/18 |
$10,250 |
$10,347 |
$10,275 |
09/18 |
$10,195 |
$10,280 |
$10,207 |
10/18 |
$10,141 |
$10,217 |
$10,148 |
11/18 |
$10,237 |
$10,330 |
$10,251 |
12/18 |
$10,344 |
$10,453 |
$10,365 |
01/19 |
$10,432 |
$10,532 |
$10,448 |
02/19 |
$10,485 |
$10,589 |
$10,495 |
03/19 |
$10,613 |
$10,756 |
$10,622 |
04/19 |
$10,638 |
$10,797 |
$10,644 |
05/19 |
$10,786 |
$10,946 |
$10,789 |
06/19 |
$10,821 |
$10,986 |
$10,827 |
07/19 |
$10,917 |
$11,074 |
$10,922 |
08/19 |
$11,055 |
$11,249 |
$11,049 |
09/19 |
$10,975 |
$11,159 |
$10,957 |
10/19 |
$10,989 |
$11,179 |
$10,983 |
11/19 |
$11,002 |
$11,207 |
$11,009 |
12/19 |
$11,026 |
$11,241 |
$11,041 |
01/20 |
$11,206 |
$11,443 |
$11,216 |
02/20 |
$11,321 |
$11,591 |
$11,321 |
03/20 |
$10,875 |
$11,170 |
$11,004 |
04/20 |
$10,677 |
$11,030 |
$10,925 |
05/20 |
$11,005 |
$11,381 |
$11,281 |
06/20 |
$11,111 |
$11,475 |
$11,324 |
07/20 |
$11,282 |
$11,668 |
$11,492 |
08/20 |
$11,241 |
$11,613 |
$11,437 |
09/20 |
$11,242 |
$11,616 |
$11,435 |
10/20 |
$11,223 |
$11,581 |
$11,408 |
11/20 |
$11,372 |
$11,755 |
$11,542 |
12/20 |
$11,427 |
$11,827 |
$11,582 |
01/21 |
$11,482 |
$11,902 |
$11,623 |
02/21 |
$11,311 |
$11,713 |
$11,442 |
03/21 |
$11,366 |
$11,786 |
$11,503 |
04/21 |
$11,452 |
$11,884 |
$11,579 |
05/21 |
$11,485 |
$11,920 |
$11,592 |
06/21 |
$11,517 |
$11,953 |
$11,604 |
07/21 |
$11,593 |
$12,052 |
$11,694 |
08/21 |
$11,571 |
$12,008 |
$11,671 |
09/21 |
$11,483 |
$11,921 |
$11,590 |
10/21 |
$11,461 |
$11,886 |
$11,556 |
11/21 |
$11,548 |
$11,987 |
$11,623 |
12/21 |
$11,559 |
$12,007 |
$11,646 |
01/22 |
$11,277 |
$11,678 |
$11,319 |
02/22 |
$11,231 |
$11,636 |
$11,288 |
03/22 |
$10,947 |
$11,259 |
$10,964 |
04/22 |
$10,682 |
$10,947 |
$10,713 |
05/22 |
$10,814 |
$11,110 |
$10,887 |
06/22 |
$10,682 |
$10,928 |
$10,794 |
07/22 |
$10,914 |
$11,217 |
$11,062 |
08/22 |
$10,761 |
$10,971 |
$10,869 |
09/22 |
$10,473 |
$10,550 |
$10,529 |
10/22 |
$10,441 |
$10,462 |
$10,492 |
11/22 |
$10,786 |
$10,952 |
$10,874 |
12/22 |
$10,822 |
$10,983 |
$10,929 |
01/23 |
$11,048 |
$11,298 |
$11,187 |
02/23 |
$10,857 |
$11,043 |
$10,960 |
03/23 |
$11,039 |
$11,288 |
$11,181 |
04/23 |
$11,007 |
$11,262 |
$11,141 |
05/23 |
$10,919 |
$11,165 |
$11,038 |
06/23 |
$11,000 |
$11,276 |
$11,127 |
07/23 |
$11,036 |
$11,321 |
$11,175 |
08/23 |
$10,970 |
$11,158 |
$11,065 |
09/23 |
$10,778 |
$10,831 |
$10,805 |
10/23 |
$10,701 |
$10,739 |
$10,743 |
11/23 |
$11,126 |
$11,420 |
$11,279 |
12/23 |
$11,346 |
$11,686 |
$11,509 |
01/24 |
$11,338 |
$11,626 |
$11,475 |
02/24 |
$11,339 |
$11,641 |
$11,479 |
03/24 |
$11,330 |
$11,641 |
$11,465 |
04/24 |
$11,240 |
$11,497 |
$11,330 |
05/24 |
$11,197 |
$11,463 |
$11,249 |
06/24 |
$11,326 |
$11,639 |
$11,394 |
07/24 |
$11,399 |
$11,745 |
$11,494 |
08/24 |
$11,472 |
$11,837 |
$11,610 |
09/24 |
$11,569 |
$11,954 |
$11,719 |
10/24 |
$11,443 |
$11,780 |
$11,567 |
11/24 |
$11,575 |
$11,984 |
$11,710 |
12/24 |
$11,485 |
$11,809 |
$11,585 |
01/25 |
$11,477 |
$11,868 |
$11,618 |
02/25 |
$11,596 |
$11,986 |
$11,753 |
03/25 |
$11,446 |
$11,783 |
$11,595 |
04/25 |
$11,378 |
$11,688 |
$11,500 |
05/25 |
$11,406 |
$11,695 |
$11,576 |
06/25 |
$11,481 |
$11,768 |
$11,678 |
07/25 |
$11,486 |
$11,744 |
$11,722 |
08/25 |
$11,587 |
$11,846 |
$11,848 |
09/25 |
$11,760 |
$12,121 |
$12,025 |
10/25 |
$11,874 |
$12,271 |
$12,129 |
11/25 |
$11,902 |
$12,299 |
$12,168 |
12/25 |
$11,945 |
$12,310 |
$12,190 |
01/26 |
$12,048 |
$12,426 |
$12,320 |
02/26 |
$12,171 |
$12,581 |
$12,438 |
03/26 |
$11,922 |
$12,289 |
$12,124 |
04/26 |
$12,013 |
$12,429 |
$12,201 |
|
| Average Annual Return [Table Text Block] |
Table Summary
Average Annual Total Returns (%) |
1 year |
5 years |
10 years |
Institutional 2 Class |
5.59 |
0.96 |
1.85 |
Bloomberg Municipal Bond Index |
6.34 |
0.90 |
2.20 |
Bloomberg California 3-15 Year Blend Municipal Bond Index |
6.10 |
1.05 |
2.01 | |
| No Deduction of Taxes [Text Block] |
Performance does not reflect the deduction of taxes that a shareholder may pay on fund distributions or on the redemptions of fund shares.
|
| Updated Performance Information Location [Text Block] |
columbiathreadneedleus.com/investment-products/mutual-funds
|
| AssetsNet |
$ 267,886,881
|
| Holdings Count | Holding |
190
|
| Advisory Fees Paid, Amount |
$ 1,364,386
|
| InvestmentCompanyPortfolioTurnover |
14.00%
|
| Additional Fund Statistics [Text Block] |
Table Summary
Fund net assets |
$267,886,881 |
Total number of portfolio holdings |
190 |
Management services fees (represents 0.47% of Fund average net assets) |
$1,364,386 |
Portfolio turnover for the reporting period |
14% | |
| Holdings [Text Block] |
Table Summary
Municipal Bonds |
98.1% |
Other |
1.0% | |
| Largest Holdings [Text Block] |
Table Summary
Los Angeles Department of Water & Power, Series 2023D 5.000% 07/01/2041 |
2.4% |
Southern California Public Power Authority, Series 2024A 5.000% 04/01/2055 |
2.4% |
Burbank-Glendale-Pasadena Airport Authority Brick Campaign, Series 2024B 5.250% 07/01/2042 |
2.2% |
State of California, Series 2021 5.000% 12/01/2036 |
2.2% |
State of California, Series 2024 5.250% 08/01/2044 |
1.7% |
California State University, Series 2024A 5.000% 11/01/2042 |
1.7% |
Los Angeles Unified School District, Series 2018B-1 5.000% 07/01/2032 |
1.6% |
Foothill-Eastern Transportation Corridor Agency, Series 2015 0.000% 01/15/2033 |
1.5% |
Southern California Public Power Authority, Series 2024 5.000% 07/01/2041 |
1.4% |
San Francisco City & County Airport Commission-San Francisco International Airport, Series 2019 5.000% 05/01/2036 |
1.3% | |
| Material Fund Change [Text Block] |
|
| C000174633 |
|
| Shareholder Report [Line Items] |
|
| Fund Name |
Columbia California Intermediate Municipal Bond Fund
|
| Class Name |
Institutional 3 Class
|
| Trading Symbol |
CCBYX
|
| Annual or Semi-Annual Statement [Text Block] |
This annual shareholder report contains important information about Columbia California Intermediate Municipal Bond Fund (the Fund) for the period of May 1, 2025 to April 30, 2026.
|
| Additional Information [Text Block] |
You can find additional information about the Fund at columbiathreadneedleus.com/resources/literature. You can also request more information by contacting us at 1-800-345-6611.
|
| Additional Information Phone Number |
1-800-345-6611
|
| Additional Information Website |
columbiathreadneedleus.com/resources/literature
|
| Expenses [Text Block] |
What were the Fund costs for the reporting period? (Based on a hypothetical $10,000 investment)
Table Summary
Class |
Cost of a $10,000 investment |
Cost paid as a percentage of a $10,000 investment |
Institutional 3 Class |
$43 |
0.42% | |
| Expenses Paid, Amount |
$ 43
|
| Expense Ratio, Percent |
0.42%
|
| Factors Affecting Performance [Text Block] |
Management's Discussion of Fund Performance The performance of Institutional 3 Class shares for the period presented is shown in the Average Annual Total Returns table. Top Performance ContributorsSector allocation | An overweight allocation to the airport sector and underweight allocations to the state general obligation (GO) bond and prepaid gas sectors contributed to the Fund’s performance relative to its benchmark during the period. Sector selection | Security selection in the prepaid gas and education sectors added to relative performance. Credit quality | Security selection in single-A-rated bonds added to benchmark-relative performance. Overweight allocations to BBB and non-rated bonds also added to relative performance. Yield carry | The Fund’s higher-than-benchmark yield contributed to benchmark-relative performance. Top Performance DetractorsYield curve positioning | The Fund’s yield curve positioning, specifically its overweight to the 20-year maturity space, detracted from benchmark-relative performance. The municipal market delivered strong positive performance across the yield curve as market interest rates declined across the maturity spectrum. The largest rate declines occurred in the short-intermediate space, with bonds under 19 years to maturity realizing larger declines than the longest end of the spectrum, where declines were more modest. The Fund’s overweight position proved to be a headwind as the decline in yield was limited in this space during the period. Sector security selection | Security selection in the local GO, airport, hospital and continuing care retirement community (CCRC) sectors detracted from relative performance. Credit quality | Security selection in BBB-rated bonds detracted from performance, relative to the Fund’s benchmark. |
| Performance Past Does Not Indicate Future [Text] |
The Fund's past performance is not a good predictor of the Fund's future performance.
|
| Line Graph [Table Text Block] |

Table Summary
|
Columbia California Intermediate Municipal Bond Fund Institutional 3 Class ($12,059) |
Bloomberg Municipal Bond Index ($12,429) |
Bloomberg California 3-15 Year Blend Municipal Bond Index ($12,201) |
04/16 |
$10,000 |
$10,000 |
$10,000 |
05/16 |
$10,014 |
$10,027 |
$10,005 |
06/16 |
$10,167 |
$10,187 |
$10,130 |
07/16 |
$10,152 |
$10,193 |
$10,145 |
08/16 |
$10,164 |
$10,207 |
$10,153 |
09/16 |
$10,129 |
$10,156 |
$10,103 |
10/16 |
$10,029 |
$10,049 |
$10,010 |
11/16 |
$9,653 |
$9,674 |
$9,657 |
12/16 |
$9,753 |
$9,788 |
$9,761 |
01/17 |
$9,786 |
$9,852 |
$9,841 |
02/17 |
$9,845 |
$9,921 |
$9,900 |
03/17 |
$9,878 |
$9,942 |
$9,915 |
04/17 |
$9,951 |
$10,014 |
$9,986 |
05/17 |
$10,091 |
$10,173 |
$10,132 |
06/17 |
$10,067 |
$10,137 |
$10,090 |
07/17 |
$10,121 |
$10,219 |
$10,178 |
08/17 |
$10,223 |
$10,297 |
$10,232 |
09/17 |
$10,189 |
$10,244 |
$10,187 |
10/17 |
$10,204 |
$10,269 |
$10,206 |
11/17 |
$10,150 |
$10,214 |
$10,116 |
12/17 |
$10,224 |
$10,321 |
$10,210 |
01/18 |
$10,142 |
$10,200 |
$10,112 |
02/18 |
$10,115 |
$10,169 |
$10,080 |
03/18 |
$10,130 |
$10,207 |
$10,114 |
04/18 |
$10,096 |
$10,170 |
$10,083 |
05/18 |
$10,202 |
$10,287 |
$10,202 |
06/18 |
$10,206 |
$10,295 |
$10,214 |
07/18 |
$10,233 |
$10,320 |
$10,247 |
08/18 |
$10,249 |
$10,347 |
$10,275 |
09/18 |
$10,194 |
$10,280 |
$10,207 |
10/18 |
$10,141 |
$10,217 |
$10,148 |
11/18 |
$10,237 |
$10,330 |
$10,251 |
12/18 |
$10,355 |
$10,453 |
$10,365 |
01/19 |
$10,433 |
$10,532 |
$10,448 |
02/19 |
$10,487 |
$10,589 |
$10,495 |
03/19 |
$10,615 |
$10,756 |
$10,622 |
04/19 |
$10,640 |
$10,797 |
$10,644 |
05/19 |
$10,789 |
$10,946 |
$10,789 |
06/19 |
$10,834 |
$10,986 |
$10,827 |
07/19 |
$10,920 |
$11,074 |
$10,922 |
08/19 |
$11,059 |
$11,249 |
$11,049 |
09/19 |
$10,979 |
$11,159 |
$10,957 |
10/19 |
$10,994 |
$11,179 |
$10,983 |
11/19 |
$11,007 |
$11,207 |
$11,009 |
12/19 |
$11,041 |
$11,241 |
$11,041 |
01/20 |
$11,211 |
$11,443 |
$11,216 |
02/20 |
$11,327 |
$11,591 |
$11,321 |
03/20 |
$10,893 |
$11,170 |
$11,004 |
04/20 |
$10,695 |
$11,030 |
$10,925 |
05/20 |
$11,013 |
$11,381 |
$11,281 |
06/20 |
$11,119 |
$11,475 |
$11,324 |
07/20 |
$11,290 |
$11,668 |
$11,492 |
08/20 |
$11,250 |
$11,613 |
$11,437 |
09/20 |
$11,252 |
$11,616 |
$11,435 |
10/20 |
$11,233 |
$11,581 |
$11,408 |
11/20 |
$11,383 |
$11,755 |
$11,542 |
12/20 |
$11,448 |
$11,827 |
$11,582 |
01/21 |
$11,504 |
$11,902 |
$11,623 |
02/21 |
$11,323 |
$11,713 |
$11,442 |
03/21 |
$11,378 |
$11,786 |
$11,503 |
04/21 |
$11,465 |
$11,884 |
$11,579 |
05/21 |
$11,498 |
$11,920 |
$11,592 |
06/21 |
$11,530 |
$11,953 |
$11,604 |
07/21 |
$11,618 |
$12,052 |
$11,694 |
08/21 |
$11,585 |
$12,008 |
$11,671 |
09/21 |
$11,498 |
$11,921 |
$11,590 |
10/21 |
$11,488 |
$11,886 |
$11,556 |
11/21 |
$11,564 |
$11,987 |
$11,623 |
12/21 |
$11,576 |
$12,007 |
$11,646 |
01/22 |
$11,305 |
$11,678 |
$11,319 |
02/22 |
$11,249 |
$11,636 |
$11,288 |
03/22 |
$10,965 |
$11,259 |
$10,964 |
04/22 |
$10,701 |
$10,947 |
$10,713 |
05/22 |
$10,834 |
$11,110 |
$10,887 |
06/22 |
$10,702 |
$10,928 |
$10,794 |
07/22 |
$10,945 |
$11,217 |
$11,062 |
08/22 |
$10,782 |
$10,971 |
$10,869 |
09/22 |
$10,494 |
$10,550 |
$10,529 |
10/22 |
$10,463 |
$10,462 |
$10,492 |
11/22 |
$10,809 |
$10,952 |
$10,874 |
12/22 |
$10,856 |
$10,983 |
$10,929 |
01/23 |
$11,082 |
$11,298 |
$11,187 |
02/23 |
$10,892 |
$11,043 |
$10,960 |
03/23 |
$11,063 |
$11,288 |
$11,181 |
04/23 |
$11,032 |
$11,262 |
$11,141 |
05/23 |
$10,955 |
$11,165 |
$11,038 |
06/23 |
$11,037 |
$11,276 |
$11,127 |
07/23 |
$11,062 |
$11,321 |
$11,175 |
08/23 |
$10,997 |
$11,158 |
$11,065 |
09/23 |
$10,805 |
$10,831 |
$10,805 |
10/23 |
$10,740 |
$10,739 |
$10,743 |
11/23 |
$11,166 |
$11,420 |
$11,279 |
12/23 |
$11,375 |
$11,686 |
$11,509 |
01/24 |
$11,379 |
$11,626 |
$11,475 |
02/24 |
$11,381 |
$11,641 |
$11,479 |
03/24 |
$11,373 |
$11,641 |
$11,465 |
04/24 |
$11,283 |
$11,497 |
$11,330 |
05/24 |
$11,240 |
$11,463 |
$11,249 |
06/24 |
$11,371 |
$11,639 |
$11,394 |
07/24 |
$11,444 |
$11,745 |
$11,494 |
08/24 |
$11,518 |
$11,837 |
$11,610 |
09/24 |
$11,615 |
$11,954 |
$11,719 |
10/24 |
$11,478 |
$11,780 |
$11,567 |
11/24 |
$11,622 |
$11,984 |
$11,710 |
12/24 |
$11,532 |
$11,809 |
$11,585 |
01/25 |
$11,525 |
$11,868 |
$11,618 |
02/25 |
$11,645 |
$11,986 |
$11,753 |
03/25 |
$11,495 |
$11,783 |
$11,595 |
04/25 |
$11,428 |
$11,688 |
$11,500 |
05/25 |
$11,457 |
$11,695 |
$11,576 |
06/25 |
$11,532 |
$11,768 |
$11,678 |
07/25 |
$11,538 |
$11,744 |
$11,722 |
08/25 |
$11,628 |
$11,846 |
$11,848 |
09/25 |
$11,813 |
$12,121 |
$12,025 |
10/25 |
$11,928 |
$12,271 |
$12,129 |
11/25 |
$11,957 |
$12,299 |
$12,168 |
12/25 |
$12,000 |
$12,310 |
$12,190 |
01/26 |
$12,104 |
$12,426 |
$12,320 |
02/26 |
$12,228 |
$12,581 |
$12,438 |
03/26 |
$11,979 |
$12,289 |
$12,124 |
04/26 |
$12,059 |
$12,429 |
$12,201 |
|
| Average Annual Return [Table Text Block] |
Table Summary
Average Annual Total Returns (%) |
1 year |
5 years |
10 years |
Institutional 3 ClassFootnote Reference(a) |
5.52 |
1.02 |
1.89 |
Bloomberg Municipal Bond Index |
6.34 |
0.90 |
2.20 |
Bloomberg California 3-15 Year Blend Municipal Bond Index |
6.10 |
1.05 |
2.01 | |
| No Deduction of Taxes [Text Block] |
Performance does not reflect the deduction of taxes that a shareholder may pay on fund distributions or on the redemptions of fund shares.
|
| Updated Performance Information Location [Text Block] |
columbiathreadneedleus.com/investment-products/mutual-funds
|
| AssetsNet |
$ 267,886,881
|
| Holdings Count | Holding |
190
|
| Advisory Fees Paid, Amount |
$ 1,364,386
|
| InvestmentCompanyPortfolioTurnover |
14.00%
|
| Additional Fund Statistics [Text Block] |
Table Summary
Fund net assets |
$267,886,881 |
Total number of portfolio holdings |
190 |
Management services fees (represents 0.47% of Fund average net assets) |
$1,364,386 |
Portfolio turnover for the reporting period |
14% | |
| Holdings [Text Block] |
Table Summary
Municipal Bonds |
98.1% |
Other |
1.0% | |
| Largest Holdings [Text Block] |
Table Summary
Los Angeles Department of Water & Power, Series 2023D 5.000% 07/01/2041 |
2.4% |
Southern California Public Power Authority, Series 2024A 5.000% 04/01/2055 |
2.4% |
Burbank-Glendale-Pasadena Airport Authority Brick Campaign, Series 2024B 5.250% 07/01/2042 |
2.2% |
State of California, Series 2021 5.000% 12/01/2036 |
2.2% |
State of California, Series 2024 5.250% 08/01/2044 |
1.7% |
California State University, Series 2024A 5.000% 11/01/2042 |
1.7% |
Los Angeles Unified School District, Series 2018B-1 5.000% 07/01/2032 |
1.6% |
Foothill-Eastern Transportation Corridor Agency, Series 2015 0.000% 01/15/2033 |
1.5% |
Southern California Public Power Authority, Series 2024 5.000% 07/01/2041 |
1.4% |
San Francisco City & County Airport Commission-San Francisco International Airport, Series 2019 5.000% 05/01/2036 |
1.3% | |
| Material Fund Change [Text Block] |
|
| C000029803 |
|
| Shareholder Report [Line Items] |
|
| Fund Name |
Columbia California Intermediate Municipal Bond Fund
|
| Class Name |
Institutional Class
|
| Trading Symbol |
NCMAX
|
| Annual or Semi-Annual Statement [Text Block] |
This annual shareholder report contains important information about Columbia California Intermediate Municipal Bond Fund (the Fund) for the period of May 1, 2025 to April 30, 2026.
|
| Additional Information [Text Block] |
You can find additional information about the Fund at columbiathreadneedleus.com/resources/literature. You can also request more information by contacting us at 1-800-345-6611.
|
| Additional Information Phone Number |
1-800-345-6611
|
| Additional Information Website |
columbiathreadneedleus.com/resources/literature
|
| Expenses [Text Block] |
What were the Fund costs for the reporting period? (Based on a hypothetical $10,000 investment)
Table Summary
Class |
Cost of a $10,000 investment |
Cost paid as a percentage of a $10,000 investment |
Institutional Class |
$49 |
0.48% | |
| Expenses Paid, Amount |
$ 49
|
| Expense Ratio, Percent |
0.48%
|
| Factors Affecting Performance [Text Block] |
Management's Discussion of Fund Performance The performance of Institutional Class shares for the period presented is shown in the Average Annual Total Returns table. Top Performance ContributorsSector allocation | An overweight allocation to the airport sector and underweight allocations to the state general obligation (GO) bond and prepaid gas sectors contributed to the Fund’s performance relative to its benchmark during the period. Sector selection | Security selection in the prepaid gas and education sectors added to relative performance. Credit quality | Security selection in single-A-rated bonds added to benchmark-relative performance. Overweight allocations to BBB and non-rated bonds also added to relative performance. Yield carry | The Fund’s higher-than-benchmark yield contributed to benchmark-relative performance. Top Performance DetractorsYield curve positioning | The Fund’s yield curve positioning, specifically its overweight to the 20-year maturity space, detracted from benchmark-relative performance. The municipal market delivered strong positive performance across the yield curve as market interest rates declined across the maturity spectrum. The largest rate declines occurred in the short-intermediate space, with bonds under 19 years to maturity realizing larger declines than the longest end of the spectrum, where declines were more modest. The Fund’s overweight position proved to be a headwind as the decline in yield was limited in this space during the period. Sector security selection | Security selection in the local GO, airport, hospital and continuing care retirement community (CCRC) sectors detracted from relative performance. Credit quality | Security selection in BBB-rated bonds detracted from performance, relative to the Fund’s benchmark. |
| Performance Past Does Not Indicate Future [Text] |
The Fund's past performance is not a good predictor of the Fund's future performance.
|
| Line Graph [Table Text Block] |

Table Summary
|
Columbia California Intermediate Municipal Bond Fund Institutional Class ($11,964) |
Bloomberg Municipal Bond Index ($12,429) |
Bloomberg California 3-15 Year Blend Municipal Bond Index ($12,201) |
04/16 |
$10,000 |
$10,000 |
$10,000 |
05/16 |
$10,014 |
$10,027 |
$10,005 |
06/16 |
$10,167 |
$10,187 |
$10,130 |
07/16 |
$10,152 |
$10,193 |
$10,145 |
08/16 |
$10,164 |
$10,207 |
$10,153 |
09/16 |
$10,129 |
$10,156 |
$10,103 |
10/16 |
$10,029 |
$10,049 |
$10,010 |
11/16 |
$9,653 |
$9,674 |
$9,657 |
12/16 |
$9,753 |
$9,788 |
$9,761 |
01/17 |
$9,786 |
$9,852 |
$9,841 |
02/17 |
$9,845 |
$9,921 |
$9,900 |
03/17 |
$9,878 |
$9,942 |
$9,915 |
04/17 |
$9,949 |
$10,014 |
$9,986 |
05/17 |
$10,088 |
$10,173 |
$10,132 |
06/17 |
$10,054 |
$10,137 |
$10,090 |
07/17 |
$10,116 |
$10,219 |
$10,178 |
08/17 |
$10,207 |
$10,297 |
$10,232 |
09/17 |
$10,172 |
$10,244 |
$10,187 |
10/17 |
$10,187 |
$10,269 |
$10,206 |
11/17 |
$10,132 |
$10,214 |
$10,116 |
12/17 |
$10,205 |
$10,321 |
$10,210 |
01/18 |
$10,132 |
$10,200 |
$10,112 |
02/18 |
$10,094 |
$10,169 |
$10,080 |
03/18 |
$10,119 |
$10,207 |
$10,114 |
04/18 |
$10,084 |
$10,170 |
$10,083 |
05/18 |
$10,178 |
$10,287 |
$10,202 |
06/18 |
$10,182 |
$10,295 |
$10,214 |
07/18 |
$10,207 |
$10,320 |
$10,247 |
08/18 |
$10,233 |
$10,347 |
$10,275 |
09/18 |
$10,177 |
$10,280 |
$10,207 |
10/18 |
$10,123 |
$10,217 |
$10,148 |
11/18 |
$10,218 |
$10,330 |
$10,251 |
12/18 |
$10,325 |
$10,453 |
$10,365 |
01/19 |
$10,411 |
$10,532 |
$10,448 |
02/19 |
$10,454 |
$10,589 |
$10,495 |
03/19 |
$10,591 |
$10,756 |
$10,622 |
04/19 |
$10,615 |
$10,797 |
$10,644 |
05/19 |
$10,762 |
$10,946 |
$10,789 |
06/19 |
$10,796 |
$10,986 |
$10,827 |
07/19 |
$10,892 |
$11,074 |
$10,922 |
08/19 |
$11,029 |
$11,249 |
$11,049 |
09/19 |
$10,949 |
$11,159 |
$10,957 |
10/19 |
$10,962 |
$11,179 |
$10,983 |
11/19 |
$10,974 |
$11,207 |
$11,009 |
12/19 |
$10,997 |
$11,241 |
$11,041 |
01/20 |
$11,176 |
$11,443 |
$11,216 |
02/20 |
$11,290 |
$11,591 |
$11,321 |
03/20 |
$10,846 |
$11,170 |
$11,004 |
04/20 |
$10,649 |
$11,030 |
$10,925 |
05/20 |
$10,974 |
$11,381 |
$11,281 |
06/20 |
$11,079 |
$11,475 |
$11,324 |
07/20 |
$11,248 |
$11,668 |
$11,492 |
08/20 |
$11,208 |
$11,613 |
$11,437 |
09/20 |
$11,208 |
$11,616 |
$11,435 |
10/20 |
$11,189 |
$11,581 |
$11,408 |
11/20 |
$11,337 |
$11,755 |
$11,542 |
12/20 |
$11,401 |
$11,827 |
$11,582 |
01/21 |
$11,456 |
$11,902 |
$11,623 |
02/21 |
$11,275 |
$11,713 |
$11,442 |
03/21 |
$11,328 |
$11,786 |
$11,503 |
04/21 |
$11,413 |
$11,884 |
$11,579 |
05/21 |
$11,446 |
$11,920 |
$11,592 |
06/21 |
$11,477 |
$11,953 |
$11,604 |
07/21 |
$11,563 |
$12,052 |
$11,694 |
08/21 |
$11,529 |
$12,008 |
$11,671 |
09/21 |
$11,442 |
$11,921 |
$11,590 |
10/21 |
$11,420 |
$11,886 |
$11,556 |
11/21 |
$11,505 |
$11,987 |
$11,623 |
12/21 |
$11,516 |
$12,007 |
$11,646 |
01/22 |
$11,235 |
$11,678 |
$11,319 |
02/22 |
$11,189 |
$11,636 |
$11,288 |
03/22 |
$10,907 |
$11,259 |
$10,964 |
04/22 |
$10,644 |
$10,947 |
$10,713 |
05/22 |
$10,775 |
$11,110 |
$10,887 |
06/22 |
$10,643 |
$10,928 |
$10,794 |
07/22 |
$10,874 |
$11,217 |
$11,062 |
08/22 |
$10,721 |
$10,971 |
$10,869 |
09/22 |
$10,435 |
$10,550 |
$10,529 |
10/22 |
$10,403 |
$10,462 |
$10,492 |
11/22 |
$10,746 |
$10,952 |
$10,874 |
12/22 |
$10,793 |
$10,983 |
$10,929 |
01/23 |
$11,017 |
$11,298 |
$11,187 |
02/23 |
$10,827 |
$11,043 |
$10,960 |
03/23 |
$11,008 |
$11,288 |
$11,181 |
04/23 |
$10,965 |
$11,262 |
$11,141 |
05/23 |
$10,889 |
$11,165 |
$11,038 |
06/23 |
$10,969 |
$11,276 |
$11,127 |
07/23 |
$10,994 |
$11,321 |
$11,175 |
08/23 |
$10,929 |
$11,158 |
$11,065 |
09/23 |
$10,738 |
$10,831 |
$10,805 |
10/23 |
$10,672 |
$10,739 |
$10,743 |
11/23 |
$11,095 |
$11,420 |
$11,279 |
12/23 |
$11,302 |
$11,686 |
$11,509 |
01/24 |
$11,305 |
$11,626 |
$11,475 |
02/24 |
$11,306 |
$11,641 |
$11,479 |
03/24 |
$11,297 |
$11,641 |
$11,465 |
04/24 |
$11,208 |
$11,497 |
$11,330 |
05/24 |
$11,165 |
$11,463 |
$11,249 |
06/24 |
$11,294 |
$11,639 |
$11,394 |
07/24 |
$11,366 |
$11,745 |
$11,494 |
08/24 |
$11,438 |
$11,837 |
$11,610 |
09/24 |
$11,535 |
$11,954 |
$11,719 |
10/24 |
$11,398 |
$11,780 |
$11,567 |
11/24 |
$11,540 |
$11,984 |
$11,710 |
12/24 |
$11,451 |
$11,809 |
$11,585 |
01/25 |
$11,443 |
$11,868 |
$11,618 |
02/25 |
$11,561 |
$11,986 |
$11,753 |
03/25 |
$11,412 |
$11,783 |
$11,595 |
04/25 |
$11,345 |
$11,688 |
$11,500 |
05/25 |
$11,373 |
$11,695 |
$11,576 |
06/25 |
$11,447 |
$11,768 |
$11,678 |
07/25 |
$11,452 |
$11,744 |
$11,722 |
08/25 |
$11,541 |
$11,846 |
$11,848 |
09/25 |
$11,724 |
$12,121 |
$12,025 |
10/25 |
$11,838 |
$12,271 |
$12,129 |
11/25 |
$11,866 |
$12,299 |
$12,168 |
12/25 |
$11,896 |
$12,310 |
$12,190 |
01/26 |
$12,011 |
$12,426 |
$12,320 |
02/26 |
$12,133 |
$12,581 |
$12,438 |
03/26 |
$11,874 |
$12,289 |
$12,124 |
04/26 |
$11,964 |
$12,429 |
$12,201 |
|
| Average Annual Return [Table Text Block] |
Table Summary
Average Annual Total Returns (%) |
1 year |
5 years |
10 years |
Institutional Class |
5.46 |
0.95 |
1.81 |
Bloomberg Municipal Bond Index |
6.34 |
0.90 |
2.20 |
Bloomberg California 3-15 Year Blend Municipal Bond Index |
6.10 |
1.05 |
2.01 | |
| No Deduction of Taxes [Text Block] |
Performance does not reflect the deduction of taxes that a shareholder may pay on fund distributions or on the redemptions of fund shares.
|
| Updated Performance Information Location [Text Block] |
columbiathreadneedleus.com/investment-products/mutual-funds
|
| AssetsNet |
$ 267,886,881
|
| Holdings Count | Holding |
190
|
| Advisory Fees Paid, Amount |
$ 1,364,386
|
| InvestmentCompanyPortfolioTurnover |
14.00%
|
| Additional Fund Statistics [Text Block] |
Table Summary
Fund net assets |
$267,886,881 |
Total number of portfolio holdings |
190 |
Management services fees (represents 0.47% of Fund average net assets) |
$1,364,386 |
Portfolio turnover for the reporting period |
14% | |
| Holdings [Text Block] |
Table Summary
Municipal Bonds |
98.1% |
Other |
1.0% | |
| Largest Holdings [Text Block] |
Table Summary
Los Angeles Department of Water & Power, Series 2023D 5.000% 07/01/2041 |
2.4% |
Southern California Public Power Authority, Series 2024A 5.000% 04/01/2055 |
2.4% |
Burbank-Glendale-Pasadena Airport Authority Brick Campaign, Series 2024B 5.250% 07/01/2042 |
2.2% |
State of California, Series 2021 5.000% 12/01/2036 |
2.2% |
State of California, Series 2024 5.250% 08/01/2044 |
1.7% |
California State University, Series 2024A 5.000% 11/01/2042 |
1.7% |
Los Angeles Unified School District, Series 2018B-1 5.000% 07/01/2032 |
1.6% |
Foothill-Eastern Transportation Corridor Agency, Series 2015 0.000% 01/15/2033 |
1.5% |
Southern California Public Power Authority, Series 2024 5.000% 07/01/2041 |
1.4% |
San Francisco City & County Airport Commission-San Francisco International Airport, Series 2019 5.000% 05/01/2036 |
1.3% | |
| Material Fund Change [Text Block] |
|
| C000029792 |
|
| Shareholder Report [Line Items] |
|
| Fund Name |
Columbia Short Duration Municipal Bond Fund
|
| Class Name |
Class A
|
| Trading Symbol |
NSMMX
|
| Annual or Semi-Annual Statement [Text Block] |
This annual shareholder report contains important information about Columbia Short Duration Municipal Bond Fund (the Fund) for the period of May 1, 2025 to April 30, 2026.
|
| Additional Information [Text Block] |
You can find additional information about the Fund at columbiathreadneedleus.com/resources/literature. You can also request more information by contacting us at 1-800-345-6611.
|
| Additional Information Phone Number |
1-800-345-6611
|
| Additional Information Website |
columbiathreadneedleus.com/resources/literature
|
| Expenses [Text Block] |
What were the Fund costs for the reporting period? (Based on a hypothetical $10,000 investment)
Table Summary
Class |
Cost of a $10,000 investment |
Cost paid as a percentage of a $10,000 investment |
Class A |
$65 |
0.64% | |
| Expenses Paid, Amount |
$ 65
|
| Expense Ratio, Percent |
0.64%
|
| Factors Affecting Performance [Text Block] |
Management's Discussion of Fund Performance The performance of Class A shares for the period presented is shown in the Average Annual Total Returns table. Top Performance ContributorsYield curve positioning | Overweight positioning to bonds with maturities of less than one year was additive to relative performance during the period. Security selection | Security selection in the airport, local general obligation (GO), education and lease sectors added to the Fund’s relative performance during the period. Credit quality | Security selection in AA-rated bonds added to benchmark-relative performance. Overweight allocations to lower-rated investment-grade (A and BBB), BB and non-rated bonds also contributed to relative performance. Yield carry | The Fund’s exposure to higher-yielding bonds added to benchmark-relative performance. Sector allocation | An overweight to the industrial development revenue sector added to performance relative to the Fund’s benchmark. Top Performance DetractorsSecurity selection | Security selection in industrial development revenue bonds detracted from the Fund’s relative performance during the period. Credit quality | Security selection in BBB-rated bonds detracted from benchmark-relative performance. |
| Performance Past Does Not Indicate Future [Text] |
The Fund's past performance is not a good predictor of the Fund's future performance.
|
| Line Graph [Table Text Block] |
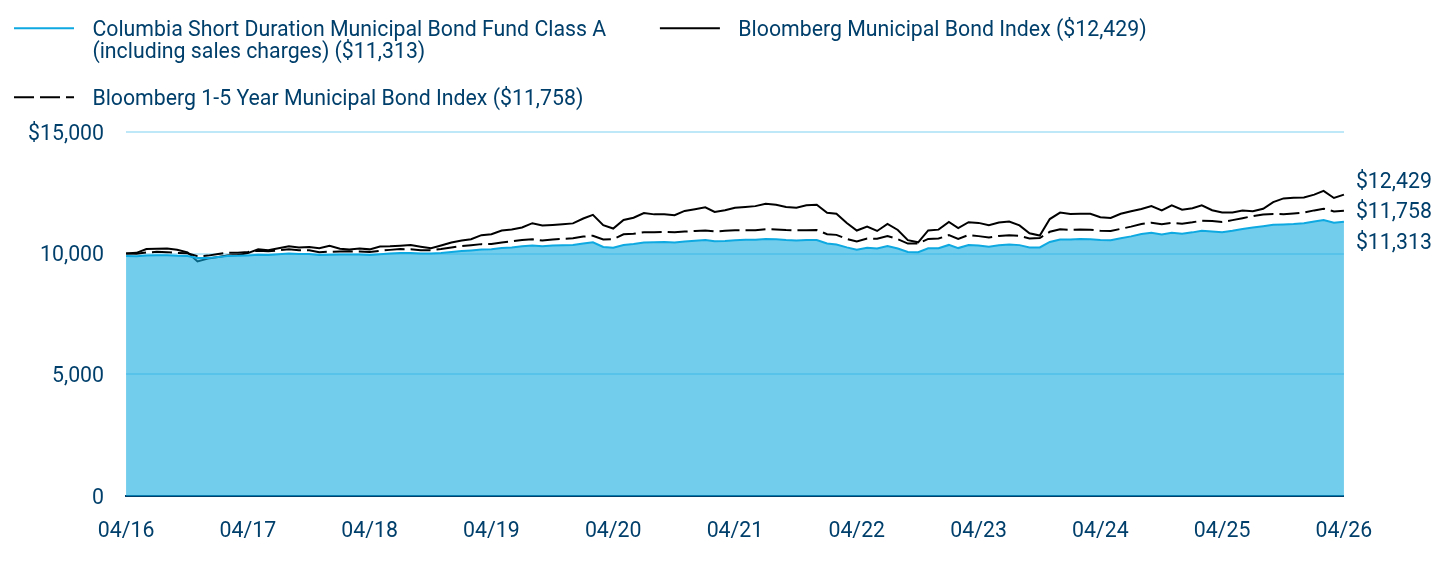
Table Summary
|
Columbia Short Duration Municipal Bond Fund Class A (including sales charges) ($11,313) |
Bloomberg Municipal Bond Index ($12,429) |
Bloomberg 1-5 Year Municipal Bond Index ($11,758) |
04/16 |
$9,896 |
$10,000 |
$10,000 |
05/16 |
$9,882 |
$10,027 |
$9,993 |
06/16 |
$9,917 |
$10,187 |
$10,041 |
07/16 |
$9,932 |
$10,193 |
$10,068 |
08/16 |
$9,929 |
$10,207 |
$10,056 |
09/16 |
$9,908 |
$10,156 |
$10,020 |
10/16 |
$9,897 |
$10,049 |
$10,009 |
11/16 |
$9,810 |
$9,674 |
$9,883 |
12/16 |
$9,819 |
$9,788 |
$9,912 |
01/17 |
$9,857 |
$9,852 |
$9,979 |
02/17 |
$9,894 |
$9,921 |
$10,033 |
03/17 |
$9,903 |
$9,942 |
$10,032 |
04/17 |
$9,921 |
$10,014 |
$10,063 |
05/17 |
$9,949 |
$10,173 |
$10,113 |
06/17 |
$9,937 |
$10,137 |
$10,088 |
07/17 |
$9,973 |
$10,219 |
$10,131 |
08/17 |
$10,002 |
$10,297 |
$10,170 |
09/17 |
$9,982 |
$10,244 |
$10,137 |
10/17 |
$9,983 |
$10,269 |
$10,136 |
11/17 |
$9,935 |
$10,214 |
$10,052 |
12/17 |
$9,945 |
$10,321 |
$10,072 |
01/18 |
$9,956 |
$10,200 |
$10,086 |
02/18 |
$9,955 |
$10,169 |
$10,089 |
03/18 |
$9,955 |
$10,207 |
$10,082 |
04/18 |
$9,937 |
$10,170 |
$10,057 |
05/18 |
$9,967 |
$10,287 |
$10,112 |
06/18 |
$9,997 |
$10,295 |
$10,149 |
07/18 |
$10,019 |
$10,320 |
$10,180 |
08/18 |
$10,022 |
$10,347 |
$10,176 |
09/18 |
$9,995 |
$10,280 |
$10,138 |
10/18 |
$9,998 |
$10,217 |
$10,134 |
11/18 |
$10,021 |
$10,330 |
$10,185 |
12/18 |
$10,064 |
$10,453 |
$10,250 |
01/19 |
$10,106 |
$10,532 |
$10,307 |
02/19 |
$10,128 |
$10,589 |
$10,341 |
03/19 |
$10,161 |
$10,756 |
$10,386 |
04/19 |
$10,174 |
$10,797 |
$10,389 |
05/19 |
$10,228 |
$10,946 |
$10,456 |
06/19 |
$10,251 |
$10,986 |
$10,502 |
07/19 |
$10,294 |
$11,074 |
$10,560 |
08/19 |
$10,328 |
$11,249 |
$10,589 |
09/19 |
$10,301 |
$11,159 |
$10,536 |
10/19 |
$10,325 |
$11,179 |
$10,580 |
11/19 |
$10,337 |
$11,207 |
$10,603 |
12/19 |
$10,350 |
$11,241 |
$10,625 |
01/20 |
$10,412 |
$11,443 |
$10,696 |
02/20 |
$10,463 |
$11,591 |
$10,734 |
03/20 |
$10,267 |
$11,170 |
$10,581 |
04/20 |
$10,239 |
$11,030 |
$10,595 |
05/20 |
$10,349 |
$11,381 |
$10,791 |
06/20 |
$10,389 |
$11,475 |
$10,813 |
07/20 |
$10,450 |
$11,668 |
$10,878 |
08/20 |
$10,460 |
$11,613 |
$10,876 |
09/20 |
$10,469 |
$11,616 |
$10,889 |
10/20 |
$10,458 |
$11,581 |
$10,872 |
11/20 |
$10,496 |
$11,755 |
$10,904 |
12/20 |
$10,525 |
$11,827 |
$10,925 |
01/21 |
$10,553 |
$11,902 |
$10,951 |
02/21 |
$10,500 |
$11,713 |
$10,907 |
03/21 |
$10,518 |
$11,786 |
$10,934 |
04/21 |
$10,545 |
$11,884 |
$10,958 |
05/21 |
$10,562 |
$11,920 |
$10,961 |
06/21 |
$10,569 |
$11,953 |
$10,962 |
07/21 |
$10,595 |
$12,052 |
$10,998 |
08/21 |
$10,589 |
$12,008 |
$10,994 |
09/21 |
$10,554 |
$11,921 |
$10,970 |
10/21 |
$10,538 |
$11,886 |
$10,955 |
11/21 |
$10,553 |
$11,987 |
$10,961 |
12/21 |
$10,558 |
$12,007 |
$10,965 |
01/22 |
$10,413 |
$11,678 |
$10,797 |
02/22 |
$10,368 |
$11,636 |
$10,768 |
03/22 |
$10,251 |
$11,259 |
$10,600 |
04/22 |
$10,156 |
$10,947 |
$10,498 |
05/22 |
$10,235 |
$11,110 |
$10,619 |
06/22 |
$10,202 |
$10,928 |
$10,608 |
07/22 |
$10,303 |
$11,217 |
$10,724 |
08/22 |
$10,203 |
$10,971 |
$10,590 |
09/22 |
$10,062 |
$10,550 |
$10,409 |
10/22 |
$10,054 |
$10,462 |
$10,408 |
11/22 |
$10,211 |
$10,952 |
$10,601 |
12/22 |
$10,216 |
$10,983 |
$10,617 |
01/23 |
$10,353 |
$11,298 |
$10,759 |
02/23 |
$10,223 |
$11,043 |
$10,605 |
03/23 |
$10,351 |
$11,288 |
$10,762 |
04/23 |
$10,326 |
$11,262 |
$10,716 |
05/23 |
$10,281 |
$11,165 |
$10,659 |
06/23 |
$10,339 |
$11,276 |
$10,723 |
07/23 |
$10,367 |
$11,321 |
$10,748 |
08/23 |
$10,345 |
$11,158 |
$10,724 |
09/23 |
$10,249 |
$10,831 |
$10,622 |
10/23 |
$10,247 |
$10,739 |
$10,636 |
11/23 |
$10,474 |
$11,420 |
$10,894 |
12/23 |
$10,578 |
$11,686 |
$10,997 |
01/24 |
$10,578 |
$11,626 |
$10,977 |
02/24 |
$10,598 |
$11,641 |
$10,989 |
03/24 |
$10,587 |
$11,641 |
$10,976 |
04/24 |
$10,556 |
$11,497 |
$10,938 |
05/24 |
$10,546 |
$11,463 |
$10,929 |
06/24 |
$10,630 |
$11,639 |
$11,015 |
07/24 |
$10,705 |
$11,745 |
$11,107 |
08/24 |
$10,804 |
$11,837 |
$11,213 |
09/24 |
$10,859 |
$11,954 |
$11,269 |
10/24 |
$10,788 |
$11,780 |
$11,206 |
11/24 |
$10,853 |
$11,984 |
$11,263 |
12/24 |
$10,814 |
$11,809 |
$11,225 |
01/25 |
$10,871 |
$11,868 |
$11,285 |
02/25 |
$10,935 |
$11,986 |
$11,354 |
03/25 |
$10,907 |
$11,783 |
$11,337 |
04/25 |
$10,877 |
$11,688 |
$11,297 |
05/25 |
$10,935 |
$11,695 |
$11,376 |
06/25 |
$11,012 |
$11,768 |
$11,457 |
07/25 |
$11,068 |
$11,744 |
$11,541 |
08/25 |
$11,125 |
$11,846 |
$11,612 |
09/25 |
$11,183 |
$12,121 |
$11,632 |
10/25 |
$11,198 |
$12,271 |
$11,618 |
11/25 |
$11,211 |
$12,299 |
$11,647 |
12/25 |
$11,247 |
$12,310 |
$11,686 |
01/26 |
$11,316 |
$12,426 |
$11,777 |
02/26 |
$11,382 |
$12,581 |
$11,848 |
03/26 |
$11,265 |
$12,289 |
$11,736 |
04/26 |
$11,313 |
$12,429 |
$11,758 |
|
| Average Annual Return [Table Text Block] |
Table Summary
Average Annual Total Returns (%) |
1 year |
5 years |
10 years |
Class A (excluding sales charges)Footnote Reference(a) |
4.00 |
1.42 |
1.35 |
Class A (including sales charges)Footnote Reference(a) |
2.98 |
1.20 |
1.24 |
Bloomberg Municipal Bond Index |
6.34 |
0.90 |
2.20 |
Bloomberg 1-5 Year Municipal Bond Index |
4.09 |
1.42 |
1.63 | |
| No Deduction of Taxes [Text Block] |
Performance does not reflect the deduction of taxes that a shareholder may pay on fund distributions or on the redemptions of fund shares.
|
| Updated Performance Information Location [Text Block] |
columbiathreadneedleus.com/investment-products/mutual-funds
|
| AssetsNet |
$ 248,877,830
|
| Holdings Count | Holding |
172
|
| Advisory Fees Paid, Amount |
$ 1,285,710
|
| InvestmentCompanyPortfolioTurnover |
26.00%
|
| Additional Fund Statistics [Text Block] |
Table Summary
Fund net assets |
$248,877,830 |
Total number of portfolio holdings |
172 |
Management services fees (represents 0.43% of Fund average net assets) |
$1,285,710 |
Portfolio turnover for the reporting period |
26% | |
| Holdings [Text Block] |
Table Summary
New York |
13.0% |
Texas |
12.9% |
California |
8.0% |
New Jersey |
5.7% |
Alabama |
5.3% |
Washington |
4.9% |
Michigan |
4.0% |
Florida |
3.2% |
Pennsylvania |
3.2% |
Missouri |
2.7% |
Table Summary
Municipal Bonds |
95.4% |
Municipal Short Term |
3.6% |
Other |
0.4% | |
| Material Fund Change [Text Block] |
|
| C000255076 |
|
| Shareholder Report [Line Items] |
|
| Fund Name |
Columbia Short Duration Municipal Bond Fund
|
| Class Name |
Class S
|
| Trading Symbol |
NSMDX
|
| Annual or Semi-Annual Statement [Text Block] |
This annual shareholder report contains important information about Columbia Short Duration Municipal Bond Fund (the Fund) for the period of May 1, 2025 to April 30, 2026.
|
| Additional Information [Text Block] |
You can find additional information about the Fund at columbiathreadneedleus.com/resources/literature. You can also request more information by contacting us at 1-800-345-6611.
|
| Additional Information Phone Number |
1-800-345-6611
|
| Additional Information Website |
columbiathreadneedleus.com/resources/literature
|
| Expenses [Text Block] |
What were the Fund costs for the reporting period? (Based on a hypothetical $10,000 investment)
Table Summary
Class |
Cost of a $10,000 investment |
Cost paid as a percentage of a $10,000 investment |
Class S |
$40 |
0.39% | |
| Expenses Paid, Amount |
$ 40
|
| Expense Ratio, Percent |
0.39%
|
| Factors Affecting Performance [Text Block] |
Management's Discussion of Fund Performance The performance of Class S shares for the period presented is shown in the Average Annual Total Returns table. Top Performance ContributorsYield curve positioning | Overweight positioning to bonds with maturities of less than one year was additive to relative performance during the period. Security selection | Security selection in the airport, local general obligation (GO), education and lease sectors added to the Fund’s relative performance during the period. Credit quality | Security selection in AA-rated bonds added to benchmark-relative performance. Overweight allocations to lower-rated investment-grade (A and BBB), BB and non-rated bonds also contributed to relative performance. Yield carry | The Fund’s exposure to higher-yielding bonds added to benchmark-relative performance. Sector allocation | An overweight to the industrial development revenue sector added to performance relative to the Fund’s benchmark. Top Performance DetractorsSecurity selection | Security selection in industrial development revenue bonds detracted from the Fund’s relative performance during the period. Credit quality | Security selection in BBB-rated bonds detracted from benchmark-relative performance. |
| Performance Past Does Not Indicate Future [Text] |
The Fund's past performance is not a good predictor of the Fund's future performance.
|
| Line Graph [Table Text Block] |
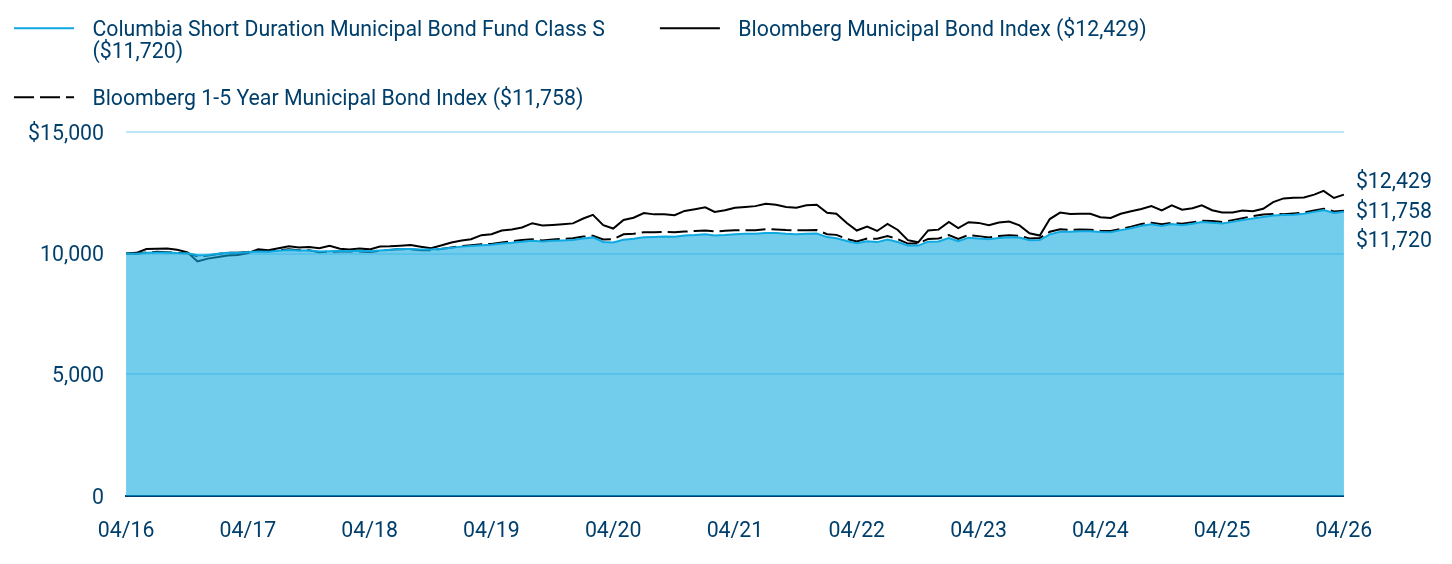
Table Summary
|
Columbia Short Duration Municipal Bond Fund Class S ($11,720) |
Bloomberg Municipal Bond Index ($12,429) |
Bloomberg 1-5 Year Municipal Bond Index ($11,758) |
04/16 |
$10,000 |
$10,000 |
$10,000 |
05/16 |
$9,989 |
$10,027 |
$9,993 |
06/16 |
$10,026 |
$10,187 |
$10,041 |
07/16 |
$10,044 |
$10,193 |
$10,068 |
08/16 |
$10,042 |
$10,207 |
$10,056 |
09/16 |
$10,023 |
$10,156 |
$10,020 |
10/16 |
$10,014 |
$10,049 |
$10,009 |
11/16 |
$9,928 |
$9,674 |
$9,883 |
12/16 |
$9,940 |
$9,788 |
$9,912 |
01/17 |
$9,990 |
$9,852 |
$9,979 |
02/17 |
$10,029 |
$9,921 |
$10,033 |
03/17 |
$10,031 |
$9,942 |
$10,032 |
04/17 |
$10,051 |
$10,014 |
$10,063 |
05/17 |
$10,081 |
$10,173 |
$10,113 |
06/17 |
$10,071 |
$10,137 |
$10,088 |
07/17 |
$10,110 |
$10,219 |
$10,131 |
08/17 |
$10,141 |
$10,297 |
$10,170 |
09/17 |
$10,123 |
$10,244 |
$10,137 |
10/17 |
$10,126 |
$10,269 |
$10,136 |
11/17 |
$10,079 |
$10,214 |
$10,052 |
12/17 |
$10,091 |
$10,321 |
$10,072 |
01/18 |
$10,105 |
$10,200 |
$10,086 |
02/18 |
$10,106 |
$10,169 |
$10,089 |
03/18 |
$10,108 |
$10,207 |
$10,082 |
04/18 |
$10,092 |
$10,170 |
$10,057 |
05/18 |
$10,125 |
$10,287 |
$10,112 |
06/18 |
$10,157 |
$10,295 |
$10,149 |
07/18 |
$10,181 |
$10,320 |
$10,180 |
08/18 |
$10,186 |
$10,347 |
$10,176 |
09/18 |
$10,161 |
$10,280 |
$10,138 |
10/18 |
$10,166 |
$10,217 |
$10,134 |
11/18 |
$10,191 |
$10,330 |
$10,185 |
12/18 |
$10,237 |
$10,453 |
$10,250 |
01/19 |
$10,283 |
$10,532 |
$10,307 |
02/19 |
$10,307 |
$10,589 |
$10,341 |
03/19 |
$10,343 |
$10,756 |
$10,386 |
04/19 |
$10,358 |
$10,797 |
$10,389 |
05/19 |
$10,415 |
$10,946 |
$10,456 |
06/19 |
$10,440 |
$10,986 |
$10,502 |
07/19 |
$10,487 |
$11,074 |
$10,560 |
08/19 |
$10,524 |
$11,249 |
$10,589 |
09/19 |
$10,498 |
$11,159 |
$10,536 |
10/19 |
$10,525 |
$11,179 |
$10,580 |
11/19 |
$10,539 |
$11,207 |
$10,603 |
12/19 |
$10,554 |
$11,241 |
$10,625 |
01/20 |
$10,620 |
$11,443 |
$10,696 |
02/20 |
$10,664 |
$11,591 |
$10,734 |
03/20 |
$10,476 |
$11,170 |
$10,581 |
04/20 |
$10,450 |
$11,030 |
$10,595 |
05/20 |
$10,565 |
$11,381 |
$10,791 |
06/20 |
$10,608 |
$11,475 |
$10,813 |
07/20 |
$10,672 |
$11,668 |
$10,878 |
08/20 |
$10,684 |
$11,613 |
$10,876 |
09/20 |
$10,696 |
$11,616 |
$10,889 |
10/20 |
$10,687 |
$11,581 |
$10,872 |
11/20 |
$10,739 |
$11,755 |
$10,904 |
12/20 |
$10,760 |
$11,827 |
$10,925 |
01/21 |
$10,791 |
$11,902 |
$10,951 |
02/21 |
$10,739 |
$11,713 |
$10,907 |
03/21 |
$10,759 |
$11,786 |
$10,934 |
04/21 |
$10,789 |
$11,884 |
$10,958 |
05/21 |
$10,809 |
$11,920 |
$10,961 |
06/21 |
$10,818 |
$11,953 |
$10,962 |
07/21 |
$10,848 |
$12,052 |
$10,998 |
08/21 |
$10,844 |
$12,008 |
$10,994 |
09/21 |
$10,810 |
$11,921 |
$10,970 |
10/21 |
$10,796 |
$11,886 |
$10,955 |
11/21 |
$10,813 |
$11,987 |
$10,961 |
12/21 |
$10,821 |
$12,007 |
$10,965 |
01/22 |
$10,675 |
$11,678 |
$10,797 |
02/22 |
$10,630 |
$11,636 |
$10,768 |
03/22 |
$10,513 |
$11,259 |
$10,600 |
04/22 |
$10,418 |
$10,947 |
$10,498 |
05/22 |
$10,501 |
$11,110 |
$10,619 |
06/22 |
$10,469 |
$10,928 |
$10,608 |
07/22 |
$10,575 |
$11,217 |
$10,724 |
08/22 |
$10,474 |
$10,971 |
$10,590 |
09/22 |
$10,332 |
$10,550 |
$10,409 |
10/22 |
$10,326 |
$10,462 |
$10,408 |
11/22 |
$10,489 |
$10,952 |
$10,601 |
12/22 |
$10,497 |
$10,983 |
$10,617 |
01/23 |
$10,640 |
$11,298 |
$10,759 |
02/23 |
$10,508 |
$11,043 |
$10,605 |
03/23 |
$10,653 |
$11,288 |
$10,762 |
04/23 |
$10,618 |
$11,262 |
$10,716 |
05/23 |
$10,585 |
$11,165 |
$10,659 |
06/23 |
$10,636 |
$11,276 |
$10,723 |
07/23 |
$10,668 |
$11,321 |
$10,748 |
08/23 |
$10,657 |
$11,158 |
$10,724 |
09/23 |
$10,550 |
$10,831 |
$10,622 |
10/23 |
$10,551 |
$10,739 |
$10,636 |
11/23 |
$10,787 |
$11,420 |
$10,894 |
12/23 |
$10,896 |
$11,686 |
$10,997 |
01/24 |
$10,898 |
$11,626 |
$10,977 |
02/24 |
$10,920 |
$11,641 |
$10,989 |
03/24 |
$10,912 |
$11,641 |
$10,976 |
04/24 |
$10,882 |
$11,497 |
$10,938 |
05/24 |
$10,874 |
$11,463 |
$10,929 |
06/24 |
$10,963 |
$11,639 |
$11,015 |
07/24 |
$11,042 |
$11,745 |
$11,107 |
08/24 |
$11,147 |
$11,837 |
$11,213 |
09/24 |
$11,207 |
$11,954 |
$11,269 |
10/24 |
$11,134 |
$11,780 |
$11,206 |
11/24 |
$11,215 |
$11,984 |
$11,263 |
12/24 |
$11,166 |
$11,809 |
$11,225 |
01/25 |
$11,227 |
$11,868 |
$11,285 |
02/25 |
$11,296 |
$11,986 |
$11,354 |
03/25 |
$11,269 |
$11,783 |
$11,337 |
04/25 |
$11,241 |
$11,688 |
$11,297 |
05/25 |
$11,303 |
$11,695 |
$11,376 |
06/25 |
$11,385 |
$11,768 |
$11,457 |
07/25 |
$11,445 |
$11,744 |
$11,541 |
08/25 |
$11,507 |
$11,846 |
$11,612 |
09/25 |
$11,569 |
$12,121 |
$11,632 |
10/25 |
$11,586 |
$12,271 |
$11,618 |
11/25 |
$11,602 |
$12,299 |
$11,647 |
12/25 |
$11,642 |
$12,310 |
$11,686 |
01/26 |
$11,716 |
$12,426 |
$11,777 |
02/26 |
$11,787 |
$12,581 |
$11,848 |
03/26 |
$11,668 |
$12,289 |
$11,736 |
04/26 |
$11,720 |
$12,429 |
$11,758 |
|
| Average Annual Return [Table Text Block] |
Table Summary
Average Annual Total Returns (%) |
1 year |
5 years |
10 years |
Class SFootnote Reference(a)Footnote Reference(b) |
4.26 |
1.67 |
1.60 |
Bloomberg Municipal Bond Index |
6.34 |
0.90 |
2.20 |
Bloomberg 1-5 Year Municipal Bond Index |
4.09 |
1.42 |
1.63 | |
| No Deduction of Taxes [Text Block] |
Performance does not reflect the deduction of taxes that a shareholder may pay on fund distributions or on the redemptions of fund shares.
|
| Updated Performance Information Location [Text Block] |
columbiathreadneedleus.com/investment-products/mutual-funds
|
| AssetsNet |
$ 248,877,830
|
| Holdings Count | Holding |
172
|
| Advisory Fees Paid, Amount |
$ 1,285,710
|
| InvestmentCompanyPortfolioTurnover |
26.00%
|
| Additional Fund Statistics [Text Block] |
Table Summary
Fund net assets |
$248,877,830 |
Total number of portfolio holdings |
172 |
Management services fees (represents 0.43% of Fund average net assets) |
$1,285,710 |
Portfolio turnover for the reporting period |
26% | |
| Holdings [Text Block] |
Table Summary
New York |
13.0% |
Texas |
12.9% |
California |
8.0% |
New Jersey |
5.7% |
Alabama |
5.3% |
Washington |
4.9% |
Michigan |
4.0% |
Florida |
3.2% |
Pennsylvania |
3.2% |
Missouri |
2.7% |
Table Summary
Municipal Bonds |
95.4% |
Municipal Short Term |
3.6% |
Other |
0.4% | |
| Material Fund Change [Text Block] |
|
| C000122570 |
|
| Shareholder Report [Line Items] |
|
| Fund Name |
Columbia Short Duration Municipal Bond Fund
|
| Class Name |
Institutional 2 Class
|
| Trading Symbol |
CNNRX
|
| Annual or Semi-Annual Statement [Text Block] |
This annual shareholder report contains important information about Columbia Short Duration Municipal Bond Fund (the Fund) for the period of May 1, 2025 to April 30, 2026.
|
| Additional Information [Text Block] |
You can find additional information about the Fund at columbiathreadneedleus.com/resources/literature. You can also request more information by contacting us at 1-800-345-6611.
|
| Additional Information Phone Number |
1-800-345-6611
|
| Additional Information Website |
columbiathreadneedleus.com/resources/literature
|
| Expenses [Text Block] |
What were the Fund costs for the reporting period? (Based on a hypothetical $10,000 investment)
Table Summary
Class |
Cost of a $10,000 investment |
Cost paid as a percentage of a $10,000 investment |
Institutional 2 Class |
$35 |
0.34% | |
| Expenses Paid, Amount |
$ 35
|
| Expense Ratio, Percent |
0.34%
|
| Factors Affecting Performance [Text Block] |
Management's Discussion of Fund Performance The performance of Institutional 2 Class shares for the period presented is shown in the Average Annual Total Returns table. Top Performance ContributorsYield curve positioning | Overweight positioning to bonds with maturities of less than one year was additive to relative performance during the period. Security selection | Security selection in the airport, local general obligation (GO), education and lease sectors added to the Fund’s relative performance during the period. Credit quality | Security selection in AA-rated bonds added to benchmark-relative performance. Overweight allocations to lower-rated investment-grade (A and BBB), BB and non-rated bonds also contributed to relative performance. Yield carry | The Fund’s exposure to higher-yielding bonds added to benchmark-relative performance. Sector allocation | An overweight to the industrial development revenue sector added to performance relative to the Fund’s benchmark. Top Performance DetractorsSecurity selection | Security selection in industrial development revenue bonds detracted from the Fund’s relative performance during the period. Credit quality | Security selection in BBB-rated bonds detracted from benchmark-relative performance. |
| Performance Past Does Not Indicate Future [Text] |
The Fund's past performance is not a good predictor of the Fund's future performance.
|
| Line Graph [Table Text Block] |
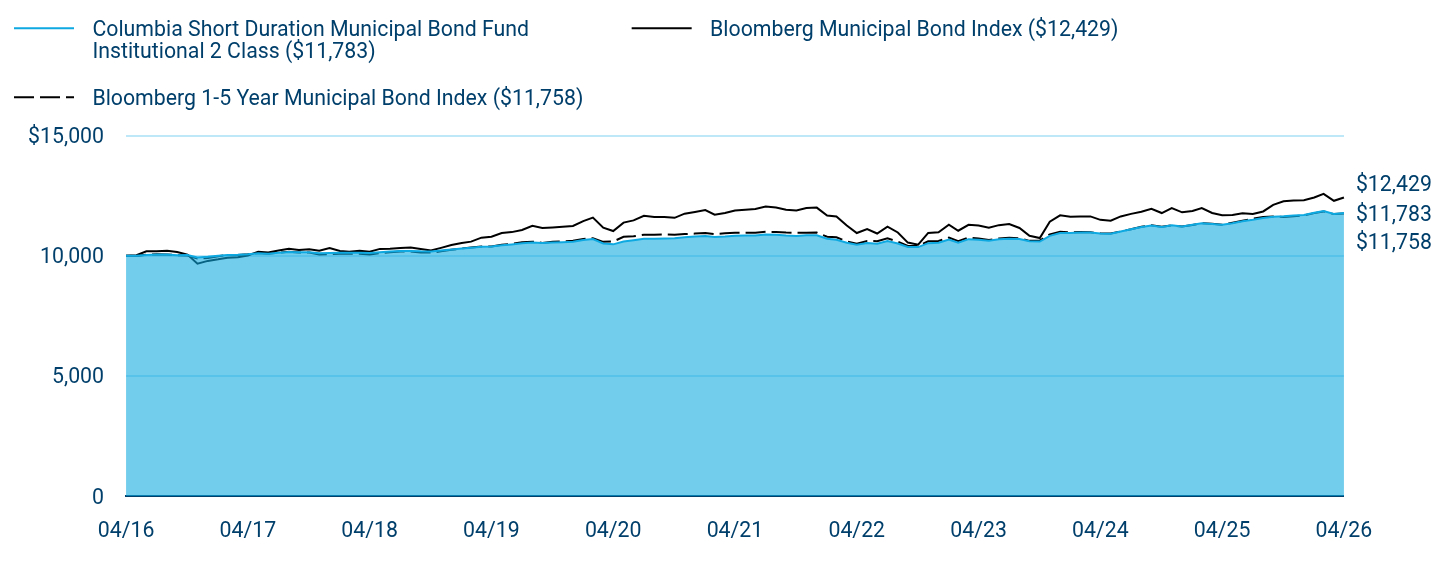
Table Summary
|
Columbia Short Duration Municipal Bond Fund Institutional 2 Class ($11,783) |
Bloomberg Municipal Bond Index ($12,429) |
Bloomberg 1-5 Year Municipal Bond Index ($11,758) |
04/16 |
$10,000 |
$10,000 |
$10,000 |
05/16 |
$9,999 |
$10,027 |
$9,993 |
06/16 |
$10,037 |
$10,187 |
$10,041 |
07/16 |
$10,056 |
$10,193 |
$10,068 |
08/16 |
$10,056 |
$10,207 |
$10,056 |
09/16 |
$10,027 |
$10,156 |
$10,020 |
10/16 |
$10,029 |
$10,049 |
$10,009 |
11/16 |
$9,934 |
$9,674 |
$9,883 |
12/16 |
$9,956 |
$9,788 |
$9,912 |
01/17 |
$9,997 |
$9,852 |
$9,979 |
02/17 |
$10,037 |
$9,921 |
$10,033 |
03/17 |
$10,040 |
$9,942 |
$10,032 |
04/17 |
$10,061 |
$10,014 |
$10,063 |
05/17 |
$10,102 |
$10,173 |
$10,113 |
06/17 |
$10,083 |
$10,137 |
$10,088 |
07/17 |
$10,123 |
$10,219 |
$10,131 |
08/17 |
$10,155 |
$10,297 |
$10,170 |
09/17 |
$10,147 |
$10,244 |
$10,137 |
10/17 |
$10,149 |
$10,269 |
$10,136 |
11/17 |
$10,103 |
$10,214 |
$10,052 |
12/17 |
$10,116 |
$10,321 |
$10,072 |
01/18 |
$10,129 |
$10,200 |
$10,086 |
02/18 |
$10,131 |
$10,169 |
$10,089 |
03/18 |
$10,123 |
$10,207 |
$10,082 |
04/18 |
$10,117 |
$10,170 |
$10,057 |
05/18 |
$10,150 |
$10,287 |
$10,112 |
06/18 |
$10,183 |
$10,295 |
$10,149 |
07/18 |
$10,198 |
$10,320 |
$10,180 |
08/18 |
$10,204 |
$10,347 |
$10,176 |
09/18 |
$10,188 |
$10,280 |
$10,138 |
10/18 |
$10,184 |
$10,217 |
$10,134 |
11/18 |
$10,220 |
$10,330 |
$10,185 |
12/18 |
$10,266 |
$10,453 |
$10,250 |
01/19 |
$10,302 |
$10,532 |
$10,307 |
02/19 |
$10,337 |
$10,589 |
$10,341 |
03/19 |
$10,373 |
$10,756 |
$10,386 |
04/19 |
$10,389 |
$10,797 |
$10,389 |
05/19 |
$10,436 |
$10,946 |
$10,456 |
06/19 |
$10,473 |
$10,986 |
$10,502 |
07/19 |
$10,519 |
$11,074 |
$10,560 |
08/19 |
$10,557 |
$11,249 |
$10,589 |
09/19 |
$10,532 |
$11,159 |
$10,536 |
10/19 |
$10,549 |
$11,179 |
$10,580 |
11/19 |
$10,564 |
$11,207 |
$10,603 |
12/19 |
$10,589 |
$11,241 |
$10,625 |
01/20 |
$10,656 |
$11,443 |
$10,696 |
02/20 |
$10,700 |
$11,591 |
$10,734 |
03/20 |
$10,512 |
$11,170 |
$10,581 |
04/20 |
$10,476 |
$11,030 |
$10,595 |
05/20 |
$10,591 |
$11,381 |
$10,791 |
06/20 |
$10,646 |
$11,475 |
$10,813 |
07/20 |
$10,710 |
$11,668 |
$10,878 |
08/20 |
$10,713 |
$11,613 |
$10,876 |
09/20 |
$10,724 |
$11,616 |
$10,889 |
10/20 |
$10,726 |
$11,581 |
$10,872 |
11/20 |
$10,768 |
$11,755 |
$10,904 |
12/20 |
$10,800 |
$11,827 |
$10,925 |
01/21 |
$10,821 |
$11,902 |
$10,951 |
02/21 |
$10,780 |
$11,713 |
$10,907 |
03/21 |
$10,800 |
$11,786 |
$10,934 |
04/21 |
$10,831 |
$11,884 |
$10,958 |
05/21 |
$10,841 |
$11,920 |
$10,961 |
06/21 |
$10,850 |
$11,953 |
$10,962 |
07/21 |
$10,890 |
$12,052 |
$10,998 |
08/21 |
$10,877 |
$12,008 |
$10,994 |
09/21 |
$10,842 |
$11,921 |
$10,970 |
10/21 |
$10,829 |
$11,886 |
$10,955 |
11/21 |
$10,857 |
$11,987 |
$10,961 |
12/21 |
$10,855 |
$12,007 |
$10,965 |
01/22 |
$10,709 |
$11,678 |
$10,797 |
02/22 |
$10,664 |
$11,636 |
$10,768 |
03/22 |
$10,547 |
$11,259 |
$10,600 |
04/22 |
$10,462 |
$10,947 |
$10,498 |
05/22 |
$10,535 |
$11,110 |
$10,619 |
06/22 |
$10,504 |
$10,928 |
$10,608 |
07/22 |
$10,611 |
$11,217 |
$10,724 |
08/22 |
$10,510 |
$10,971 |
$10,590 |
09/22 |
$10,367 |
$10,550 |
$10,409 |
10/22 |
$10,362 |
$10,462 |
$10,408 |
11/22 |
$10,526 |
$10,952 |
$10,601 |
12/22 |
$10,545 |
$10,983 |
$10,617 |
01/23 |
$10,679 |
$11,298 |
$10,759 |
02/23 |
$10,547 |
$11,043 |
$10,605 |
03/23 |
$10,693 |
$11,288 |
$10,762 |
04/23 |
$10,669 |
$11,262 |
$10,716 |
05/23 |
$10,625 |
$11,165 |
$10,659 |
06/23 |
$10,688 |
$11,276 |
$10,723 |
07/23 |
$10,709 |
$11,321 |
$10,748 |
08/23 |
$10,699 |
$11,158 |
$10,724 |
09/23 |
$10,602 |
$10,831 |
$10,622 |
10/23 |
$10,593 |
$10,739 |
$10,636 |
11/23 |
$10,831 |
$11,420 |
$10,894 |
12/23 |
$10,952 |
$11,686 |
$10,997 |
01/24 |
$10,944 |
$11,626 |
$10,977 |
02/24 |
$10,967 |
$11,641 |
$10,989 |
03/24 |
$10,969 |
$11,641 |
$10,976 |
04/24 |
$10,928 |
$11,497 |
$10,938 |
05/24 |
$10,921 |
$11,463 |
$10,929 |
06/24 |
$11,011 |
$11,639 |
$11,015 |
07/24 |
$11,102 |
$11,745 |
$11,107 |
08/24 |
$11,197 |
$11,837 |
$11,213 |
09/24 |
$11,258 |
$11,954 |
$11,269 |
10/24 |
$11,197 |
$11,780 |
$11,206 |
11/24 |
$11,268 |
$11,984 |
$11,263 |
12/24 |
$11,219 |
$11,809 |
$11,225 |
01/25 |
$11,292 |
$11,868 |
$11,285 |
02/25 |
$11,350 |
$11,986 |
$11,354 |
03/25 |
$11,324 |
$11,783 |
$11,337 |
04/25 |
$11,296 |
$11,688 |
$11,297 |
05/25 |
$11,359 |
$11,695 |
$11,376 |
06/25 |
$11,442 |
$11,768 |
$11,457 |
07/25 |
$11,502 |
$11,744 |
$11,541 |
08/25 |
$11,576 |
$11,846 |
$11,612 |
09/25 |
$11,628 |
$12,121 |
$11,632 |
10/25 |
$11,646 |
$12,271 |
$11,618 |
11/25 |
$11,674 |
$12,299 |
$11,647 |
12/25 |
$11,703 |
$12,310 |
$11,686 |
01/26 |
$11,790 |
$12,426 |
$11,777 |
02/26 |
$11,861 |
$12,581 |
$11,848 |
03/26 |
$11,742 |
$12,289 |
$11,736 |
04/26 |
$11,783 |
$12,429 |
$11,758 |
|
| Average Annual Return [Table Text Block] |
Table Summary
Average Annual Total Returns (%) |
1 year |
5 years |
10 years |
Institutional 2 ClassFootnote Reference(a) |
4.32 |
1.70 |
1.65 |
Bloomberg Municipal Bond Index |
6.34 |
0.90 |
2.20 |
Bloomberg 1-5 Year Municipal Bond Index |
4.09 |
1.42 |
1.63 | |
| No Deduction of Taxes [Text Block] |
Performance does not reflect the deduction of taxes that a shareholder may pay on fund distributions or on the redemptions of fund shares.
|
| Updated Performance Information Location [Text Block] |
columbiathreadneedleus.com/investment-products/mutual-funds
|
| AssetsNet |
$ 248,877,830
|
| Holdings Count | Holding |
172
|
| Advisory Fees Paid, Amount |
$ 1,285,710
|
| InvestmentCompanyPortfolioTurnover |
26.00%
|
| Additional Fund Statistics [Text Block] |
Table Summary
Fund net assets |
$248,877,830 |
Total number of portfolio holdings |
172 |
Management services fees (represents 0.43% of Fund average net assets) |
$1,285,710 |
Portfolio turnover for the reporting period |
26% | |
| Holdings [Text Block] |
Table Summary
New York |
13.0% |
Texas |
12.9% |
California |
8.0% |
New Jersey |
5.7% |
Alabama |
5.3% |
Washington |
4.9% |
Michigan |
4.0% |
Florida |
3.2% |
Pennsylvania |
3.2% |
Missouri |
2.7% |
Table Summary
Municipal Bonds |
95.4% |
Municipal Short Term |
3.6% |
Other |
0.4% | |
| Material Fund Change [Text Block] |
|
| C000174632 |
|
| Shareholder Report [Line Items] |
|
| Fund Name |
Columbia Short Duration Municipal Bond Fund
|
| Class Name |
Institutional 3 Class
|
| Trading Symbol |
CSMYX
|
| Annual or Semi-Annual Statement [Text Block] |
This annual shareholder report contains important information about Columbia Short Duration Municipal Bond Fund (the Fund) for the period of May 1, 2025 to April 30, 2026.
|
| Additional Information [Text Block] |
You can find additional information about the Fund at columbiathreadneedleus.com/resources/literature. You can also request more information by contacting us at 1-800-345-6611.
|
| Additional Information Phone Number |
1-800-345-6611
|
| Additional Information Website |
columbiathreadneedleus.com/resources/literature
|
| Expenses [Text Block] |
What were the Fund costs for the reporting period? (Based on a hypothetical $10,000 investment)
Table Summary
Class |
Cost of a $10,000 investment |
Cost paid as a percentage of a $10,000 investment |
Institutional 3 Class |
$33 |
0.32% | |
| Expenses Paid, Amount |
$ 33
|
| Expense Ratio, Percent |
0.32%
|
| Factors Affecting Performance [Text Block] |
Management's Discussion of Fund Performance The performance of Institutional 3 Class shares for the period presented is shown in the Average Annual Total Returns table. Top Performance ContributorsYield curve positioning | Overweight positioning to bonds with maturities of less than one year was additive to relative performance during the period. Security selection | Security selection in the airport, local general obligation (GO), education and lease sectors added to the Fund’s relative performance during the period. Credit quality | Security selection in AA-rated bonds added to benchmark-relative performance. Overweight allocations to lower-rated investment-grade (A and BBB), BB and non-rated bonds also contributed to relative performance. Yield carry | The Fund’s exposure to higher-yielding bonds added to benchmark-relative performance. Sector allocation | An overweight to the industrial development revenue sector added to performance relative to the Fund’s benchmark. Top Performance DetractorsSecurity selection | Security selection in industrial development revenue bonds detracted from the Fund’s relative performance during the period. Credit quality | Security selection in BBB-rated bonds detracted from benchmark-relative performance. |
| Performance Past Does Not Indicate Future [Text] |
The Fund's past performance is not a good predictor of the Fund's future performance.
|
| Line Graph [Table Text Block] |

Table Summary
|
Columbia Short Duration Municipal Bond Fund Institutional 3 Class ($11,809) |
Bloomberg Municipal Bond Index ($12,429) |
Bloomberg 1-5 Year Municipal Bond Index ($11,758) |
04/16 |
$10,000 |
$10,000 |
$10,000 |
05/16 |
$9,989 |
$10,027 |
$9,993 |
06/16 |
$10,026 |
$10,187 |
$10,041 |
07/16 |
$10,044 |
$10,193 |
$10,068 |
08/16 |
$10,042 |
$10,207 |
$10,056 |
09/16 |
$10,023 |
$10,156 |
$10,020 |
10/16 |
$10,014 |
$10,049 |
$10,009 |
11/16 |
$9,928 |
$9,674 |
$9,883 |
12/16 |
$9,940 |
$9,788 |
$9,912 |
01/17 |
$9,990 |
$9,852 |
$9,979 |
02/17 |
$10,029 |
$9,921 |
$10,033 |
03/17 |
$10,032 |
$9,942 |
$10,032 |
04/17 |
$10,053 |
$10,014 |
$10,063 |
05/17 |
$10,085 |
$10,173 |
$10,113 |
06/17 |
$10,076 |
$10,137 |
$10,088 |
07/17 |
$10,116 |
$10,219 |
$10,131 |
08/17 |
$10,139 |
$10,297 |
$10,170 |
09/17 |
$10,122 |
$10,244 |
$10,137 |
10/17 |
$10,125 |
$10,269 |
$10,136 |
11/17 |
$10,088 |
$10,214 |
$10,052 |
12/17 |
$10,102 |
$10,321 |
$10,072 |
01/18 |
$10,115 |
$10,200 |
$10,086 |
02/18 |
$10,117 |
$10,169 |
$10,089 |
03/18 |
$10,110 |
$10,207 |
$10,082 |
04/18 |
$10,095 |
$10,170 |
$10,057 |
05/18 |
$10,138 |
$10,287 |
$10,112 |
06/18 |
$10,162 |
$10,295 |
$10,149 |
07/18 |
$10,186 |
$10,320 |
$10,180 |
08/18 |
$10,193 |
$10,347 |
$10,176 |
09/18 |
$10,178 |
$10,280 |
$10,138 |
10/18 |
$10,174 |
$10,217 |
$10,134 |
11/18 |
$10,210 |
$10,330 |
$10,185 |
12/18 |
$10,257 |
$10,453 |
$10,250 |
01/19 |
$10,293 |
$10,532 |
$10,307 |
02/19 |
$10,328 |
$10,589 |
$10,341 |
03/19 |
$10,364 |
$10,756 |
$10,386 |
04/19 |
$10,381 |
$10,797 |
$10,389 |
05/19 |
$10,429 |
$10,946 |
$10,456 |
06/19 |
$10,465 |
$10,986 |
$10,502 |
07/19 |
$10,512 |
$11,074 |
$10,560 |
08/19 |
$10,550 |
$11,249 |
$10,589 |
09/19 |
$10,526 |
$11,159 |
$10,536 |
10/19 |
$10,543 |
$11,179 |
$10,580 |
11/19 |
$10,558 |
$11,207 |
$10,603 |
12/19 |
$10,584 |
$11,241 |
$10,625 |
01/20 |
$10,651 |
$11,443 |
$10,696 |
02/20 |
$10,696 |
$11,591 |
$10,734 |
03/20 |
$10,508 |
$11,170 |
$10,581 |
04/20 |
$10,472 |
$11,030 |
$10,595 |
05/20 |
$10,588 |
$11,381 |
$10,791 |
06/20 |
$10,643 |
$11,475 |
$10,813 |
07/20 |
$10,708 |
$11,668 |
$10,878 |
08/20 |
$10,711 |
$11,613 |
$10,876 |
09/20 |
$10,723 |
$11,616 |
$10,889 |
10/20 |
$10,725 |
$11,581 |
$10,872 |
11/20 |
$10,767 |
$11,755 |
$10,904 |
12/20 |
$10,800 |
$11,827 |
$10,925 |
01/21 |
$10,822 |
$11,902 |
$10,951 |
02/21 |
$10,781 |
$11,713 |
$10,907 |
03/21 |
$10,802 |
$11,786 |
$10,934 |
04/21 |
$10,833 |
$11,884 |
$10,958 |
05/21 |
$10,843 |
$11,920 |
$10,961 |
06/21 |
$10,853 |
$11,953 |
$10,962 |
07/21 |
$10,893 |
$12,052 |
$10,998 |
08/21 |
$10,880 |
$12,008 |
$10,994 |
09/21 |
$10,846 |
$11,921 |
$10,970 |
10/21 |
$10,833 |
$11,886 |
$10,955 |
11/21 |
$10,862 |
$11,987 |
$10,961 |
12/21 |
$10,871 |
$12,007 |
$10,965 |
01/22 |
$10,714 |
$11,678 |
$10,797 |
02/22 |
$10,681 |
$11,636 |
$10,768 |
03/22 |
$10,554 |
$11,259 |
$10,600 |
04/22 |
$10,469 |
$10,947 |
$10,498 |
05/22 |
$10,553 |
$11,110 |
$10,619 |
06/22 |
$10,522 |
$10,928 |
$10,608 |
07/22 |
$10,619 |
$11,217 |
$10,724 |
08/22 |
$10,529 |
$10,971 |
$10,590 |
09/22 |
$10,386 |
$10,550 |
$10,409 |
10/22 |
$10,371 |
$10,462 |
$10,408 |
11/22 |
$10,536 |
$10,952 |
$10,601 |
12/22 |
$10,555 |
$10,983 |
$10,617 |
01/23 |
$10,690 |
$11,298 |
$10,759 |
02/23 |
$10,568 |
$11,043 |
$10,605 |
03/23 |
$10,705 |
$11,288 |
$10,762 |
04/23 |
$10,681 |
$11,262 |
$10,716 |
05/23 |
$10,638 |
$11,165 |
$10,659 |
06/23 |
$10,701 |
$11,276 |
$10,723 |
07/23 |
$10,723 |
$11,321 |
$10,748 |
08/23 |
$10,713 |
$11,158 |
$10,724 |
09/23 |
$10,617 |
$10,831 |
$10,622 |
10/23 |
$10,608 |
$10,739 |
$10,636 |
11/23 |
$10,846 |
$11,420 |
$10,894 |
12/23 |
$10,967 |
$11,686 |
$10,997 |
01/24 |
$10,971 |
$11,626 |
$10,977 |
02/24 |
$10,983 |
$11,641 |
$10,989 |
03/24 |
$10,986 |
$11,641 |
$10,976 |
04/24 |
$10,956 |
$11,497 |
$10,938 |
05/24 |
$10,938 |
$11,463 |
$10,929 |
06/24 |
$11,029 |
$11,639 |
$11,015 |
07/24 |
$11,121 |
$11,745 |
$11,107 |
08/24 |
$11,216 |
$11,837 |
$11,213 |
09/24 |
$11,277 |
$11,954 |
$11,269 |
10/24 |
$11,217 |
$11,780 |
$11,206 |
11/24 |
$11,288 |
$11,984 |
$11,263 |
12/24 |
$11,239 |
$11,809 |
$11,225 |
01/25 |
$11,313 |
$11,868 |
$11,285 |
02/25 |
$11,382 |
$11,986 |
$11,354 |
03/25 |
$11,345 |
$11,783 |
$11,337 |
04/25 |
$11,317 |
$11,688 |
$11,297 |
05/25 |
$11,380 |
$11,695 |
$11,376 |
06/25 |
$11,464 |
$11,768 |
$11,457 |
07/25 |
$11,525 |
$11,744 |
$11,541 |
08/25 |
$11,599 |
$11,846 |
$11,612 |
09/25 |
$11,663 |
$12,121 |
$11,632 |
10/25 |
$11,670 |
$12,271 |
$11,618 |
11/25 |
$11,698 |
$12,299 |
$11,647 |
12/25 |
$11,727 |
$12,310 |
$11,686 |
01/26 |
$11,814 |
$12,426 |
$11,777 |
02/26 |
$11,886 |
$12,581 |
$11,848 |
03/26 |
$11,767 |
$12,289 |
$11,736 |
04/26 |
$11,809 |
$12,429 |
$11,758 |
|
| Average Annual Return [Table Text Block] |
Table Summary
Average Annual Total Returns (%) |
1 year |
5 years |
10 years |
Institutional 3 ClassFootnote Reference(a)Footnote Reference(b) |
4.34 |
1.74 |
1.68 |
Bloomberg Municipal Bond Index |
6.34 |
0.90 |
2.20 |
Bloomberg 1-5 Year Municipal Bond Index |
4.09 |
1.42 |
1.63 | |
| No Deduction of Taxes [Text Block] |
Performance does not reflect the deduction of taxes that a shareholder may pay on fund distributions or on the redemptions of fund shares.
|
| Updated Performance Information Location [Text Block] |
columbiathreadneedleus.com/investment-products/mutual-funds
|
| AssetsNet |
$ 248,877,830
|
| Holdings Count | Holding |
172
|
| Advisory Fees Paid, Amount |
$ 1,285,710
|
| InvestmentCompanyPortfolioTurnover |
26.00%
|
| Additional Fund Statistics [Text Block] |
Table Summary
Fund net assets |
$248,877,830 |
Total number of portfolio holdings |
172 |
Management services fees (represents 0.43% of Fund average net assets) |
$1,285,710 |
Portfolio turnover for the reporting period |
26% | |
| Holdings [Text Block] |
Table Summary
New York |
13.0% |
Texas |
12.9% |
California |
8.0% |
New Jersey |
5.7% |
Alabama |
5.3% |
Washington |
4.9% |
Michigan |
4.0% |
Florida |
3.2% |
Pennsylvania |
3.2% |
Missouri |
2.7% |
Table Summary
Municipal Bonds |
95.4% |
Municipal Short Term |
3.6% |
Other |
0.4% | |
| Material Fund Change [Text Block] |
|
| C000029795 |
|
| Shareholder Report [Line Items] |
|
| Fund Name |
Columbia Short Duration Municipal Bond Fund
|
| Class Name |
Institutional Class
|
| Trading Symbol |
NSMIX
|
| Annual or Semi-Annual Statement [Text Block] |
This annual shareholder report contains important information about Columbia Short Duration Municipal Bond Fund (the Fund) for the period of May 1, 2025 to April 30, 2026.
|
| Additional Information [Text Block] |
You can find additional information about the Fund at columbiathreadneedleus.com/resources/literature. You can also request more information by contacting us at 1-800-345-6611.
|
| Additional Information Phone Number |
1-800-345-6611
|
| Additional Information Website |
columbiathreadneedleus.com/resources/literature
|
| Expenses [Text Block] |
What were the Fund costs for the reporting period? (Based on a hypothetical $10,000 investment)
Table Summary
Class |
Cost of a $10,000 investment |
Cost paid as a percentage of a $10,000 investment |
Institutional Class |
$40 |
0.39% | |
| Expenses Paid, Amount |
$ 40
|
| Expense Ratio, Percent |
0.39%
|
| Factors Affecting Performance [Text Block] |
Management's Discussion of Fund Performance The performance of Institutional Class shares for the period presented is shown in the Average Annual Total Returns table. Top Performance ContributorsYield curve positioning | Overweight positioning to bonds with maturities of less than one year was additive to relative performance during the period. Security selection | Security selection in the airport, local general obligation (GO), education and lease sectors added to the Fund’s relative performance during the period. Credit quality | Security selection in AA-rated bonds added to benchmark-relative performance. Overweight allocations to lower-rated investment-grade (A and BBB), BB and non-rated bonds also contributed to relative performance. Yield carry | The Fund’s exposure to higher-yielding bonds added to benchmark-relative performance. Sector allocation | An overweight to the industrial development revenue sector added to performance relative to the Fund’s benchmark. Top Performance DetractorsSecurity selection | Security selection in industrial development revenue bonds detracted from the Fund’s relative performance during the period. Credit quality | Security selection in BBB-rated bonds detracted from benchmark-relative performance. |
| Performance Past Does Not Indicate Future [Text] |
The Fund's past performance is not a good predictor of the Fund's future performance.
|
| Line Graph [Table Text Block] |
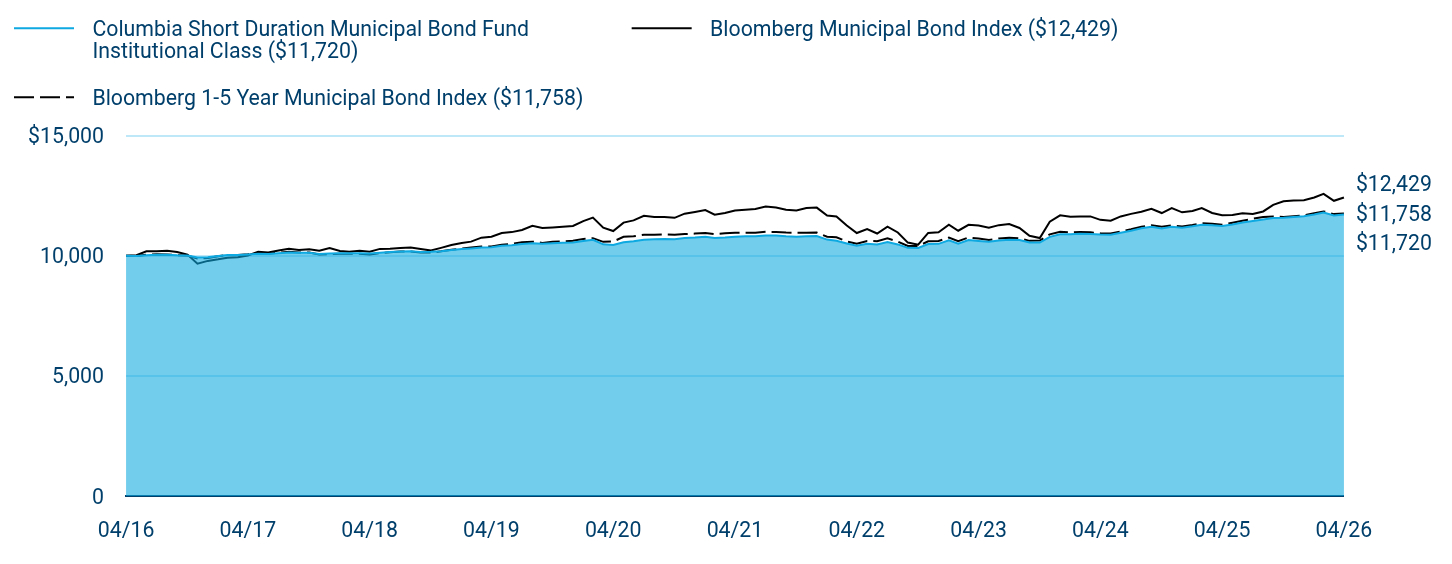
Table Summary
|
Columbia Short Duration Municipal Bond Fund Institutional Class ($11,720) |
Bloomberg Municipal Bond Index ($12,429) |
Bloomberg 1-5 Year Municipal Bond Index ($11,758) |
04/16 |
$10,000 |
$10,000 |
$10,000 |
05/16 |
$9,989 |
$10,027 |
$9,993 |
06/16 |
$10,026 |
$10,187 |
$10,041 |
07/16 |
$10,044 |
$10,193 |
$10,068 |
08/16 |
$10,042 |
$10,207 |
$10,056 |
09/16 |
$10,023 |
$10,156 |
$10,020 |
10/16 |
$10,014 |
$10,049 |
$10,009 |
11/16 |
$9,928 |
$9,674 |
$9,883 |
12/16 |
$9,940 |
$9,788 |
$9,912 |
01/17 |
$9,990 |
$9,852 |
$9,979 |
02/17 |
$10,029 |
$9,921 |
$10,033 |
03/17 |
$10,031 |
$9,942 |
$10,032 |
04/17 |
$10,051 |
$10,014 |
$10,063 |
05/17 |
$10,081 |
$10,173 |
$10,113 |
06/17 |
$10,071 |
$10,137 |
$10,088 |
07/17 |
$10,110 |
$10,219 |
$10,131 |
08/17 |
$10,141 |
$10,297 |
$10,170 |
09/17 |
$10,123 |
$10,244 |
$10,137 |
10/17 |
$10,126 |
$10,269 |
$10,136 |
11/17 |
$10,079 |
$10,214 |
$10,052 |
12/17 |
$10,091 |
$10,321 |
$10,072 |
01/18 |
$10,105 |
$10,200 |
$10,086 |
02/18 |
$10,106 |
$10,169 |
$10,089 |
03/18 |
$10,108 |
$10,207 |
$10,082 |
04/18 |
$10,092 |
$10,170 |
$10,057 |
05/18 |
$10,125 |
$10,287 |
$10,112 |
06/18 |
$10,157 |
$10,295 |
$10,149 |
07/18 |
$10,181 |
$10,320 |
$10,180 |
08/18 |
$10,186 |
$10,347 |
$10,176 |
09/18 |
$10,161 |
$10,280 |
$10,138 |
10/18 |
$10,166 |
$10,217 |
$10,134 |
11/18 |
$10,191 |
$10,330 |
$10,185 |
12/18 |
$10,237 |
$10,453 |
$10,250 |
01/19 |
$10,283 |
$10,532 |
$10,307 |
02/19 |
$10,307 |
$10,589 |
$10,341 |
03/19 |
$10,343 |
$10,756 |
$10,386 |
04/19 |
$10,358 |
$10,797 |
$10,389 |
05/19 |
$10,415 |
$10,946 |
$10,456 |
06/19 |
$10,440 |
$10,986 |
$10,502 |
07/19 |
$10,487 |
$11,074 |
$10,560 |
08/19 |
$10,524 |
$11,249 |
$10,589 |
09/19 |
$10,498 |
$11,159 |
$10,536 |
10/19 |
$10,525 |
$11,179 |
$10,580 |
11/19 |
$10,539 |
$11,207 |
$10,603 |
12/19 |
$10,554 |
$11,241 |
$10,625 |
01/20 |
$10,620 |
$11,443 |
$10,696 |
02/20 |
$10,664 |
$11,591 |
$10,734 |
03/20 |
$10,476 |
$11,170 |
$10,581 |
04/20 |
$10,450 |
$11,030 |
$10,595 |
05/20 |
$10,565 |
$11,381 |
$10,791 |
06/20 |
$10,608 |
$11,475 |
$10,813 |
07/20 |
$10,672 |
$11,668 |
$10,878 |
08/20 |
$10,684 |
$11,613 |
$10,876 |
09/20 |
$10,696 |
$11,616 |
$10,889 |
10/20 |
$10,687 |
$11,581 |
$10,872 |
11/20 |
$10,739 |
$11,755 |
$10,904 |
12/20 |
$10,760 |
$11,827 |
$10,925 |
01/21 |
$10,791 |
$11,902 |
$10,951 |
02/21 |
$10,739 |
$11,713 |
$10,907 |
03/21 |
$10,759 |
$11,786 |
$10,934 |
04/21 |
$10,789 |
$11,884 |
$10,958 |
05/21 |
$10,809 |
$11,920 |
$10,961 |
06/21 |
$10,818 |
$11,953 |
$10,962 |
07/21 |
$10,848 |
$12,052 |
$10,998 |
08/21 |
$10,844 |
$12,008 |
$10,994 |
09/21 |
$10,810 |
$11,921 |
$10,970 |
10/21 |
$10,796 |
$11,886 |
$10,955 |
11/21 |
$10,813 |
$11,987 |
$10,961 |
12/21 |
$10,821 |
$12,007 |
$10,965 |
01/22 |
$10,675 |
$11,678 |
$10,797 |
02/22 |
$10,630 |
$11,636 |
$10,768 |
03/22 |
$10,513 |
$11,259 |
$10,600 |
04/22 |
$10,418 |
$10,947 |
$10,498 |
05/22 |
$10,501 |
$11,110 |
$10,619 |
06/22 |
$10,469 |
$10,928 |
$10,608 |
07/22 |
$10,575 |
$11,217 |
$10,724 |
08/22 |
$10,474 |
$10,971 |
$10,590 |
09/22 |
$10,332 |
$10,550 |
$10,409 |
10/22 |
$10,326 |
$10,462 |
$10,408 |
11/22 |
$10,489 |
$10,952 |
$10,601 |
12/22 |
$10,497 |
$10,983 |
$10,617 |
01/23 |
$10,640 |
$11,298 |
$10,759 |
02/23 |
$10,508 |
$11,043 |
$10,605 |
03/23 |
$10,653 |
$11,288 |
$10,762 |
04/23 |
$10,618 |
$11,262 |
$10,716 |
05/23 |
$10,585 |
$11,165 |
$10,659 |
06/23 |
$10,636 |
$11,276 |
$10,723 |
07/23 |
$10,668 |
$11,321 |
$10,748 |
08/23 |
$10,657 |
$11,158 |
$10,724 |
09/23 |
$10,550 |
$10,831 |
$10,622 |
10/23 |
$10,551 |
$10,739 |
$10,636 |
11/23 |
$10,787 |
$11,420 |
$10,894 |
12/23 |
$10,896 |
$11,686 |
$10,997 |
01/24 |
$10,898 |
$11,626 |
$10,977 |
02/24 |
$10,920 |
$11,641 |
$10,989 |
03/24 |
$10,912 |
$11,641 |
$10,976 |
04/24 |
$10,882 |
$11,497 |
$10,938 |
05/24 |
$10,874 |
$11,463 |
$10,929 |
06/24 |
$10,963 |
$11,639 |
$11,015 |
07/24 |
$11,042 |
$11,745 |
$11,107 |
08/24 |
$11,147 |
$11,837 |
$11,213 |
09/24 |
$11,207 |
$11,954 |
$11,269 |
10/24 |
$11,135 |
$11,780 |
$11,206 |
11/24 |
$11,205 |
$11,984 |
$11,263 |
12/24 |
$11,167 |
$11,809 |
$11,225 |
01/25 |
$11,228 |
$11,868 |
$11,285 |
02/25 |
$11,297 |
$11,986 |
$11,354 |
03/25 |
$11,269 |
$11,783 |
$11,337 |
04/25 |
$11,241 |
$11,688 |
$11,297 |
05/25 |
$11,303 |
$11,695 |
$11,376 |
06/25 |
$11,386 |
$11,768 |
$11,457 |
07/25 |
$11,445 |
$11,744 |
$11,541 |
08/25 |
$11,507 |
$11,846 |
$11,612 |
09/25 |
$11,570 |
$12,121 |
$11,632 |
10/25 |
$11,587 |
$12,271 |
$11,618 |
11/25 |
$11,614 |
$12,299 |
$11,647 |
12/25 |
$11,642 |
$12,310 |
$11,686 |
01/26 |
$11,717 |
$12,426 |
$11,777 |
02/26 |
$11,799 |
$12,581 |
$11,848 |
03/26 |
$11,680 |
$12,289 |
$11,736 |
04/26 |
$11,720 |
$12,429 |
$11,758 |
|
| Average Annual Return [Table Text Block] |
Table Summary
Average Annual Total Returns (%) |
1 year |
5 years |
10 years |
Institutional ClassFootnote Reference(a) |
4.26 |
1.67 |
1.60 |
Bloomberg Municipal Bond Index |
6.34 |
0.90 |
2.20 |
Bloomberg 1-5 Year Municipal Bond Index |
4.09 |
1.42 |
1.63 | |
| No Deduction of Taxes [Text Block] |
Performance does not reflect the deduction of taxes that a shareholder may pay on fund distributions or on the redemptions of fund shares.
|
| Updated Performance Information Location [Text Block] |
columbiathreadneedleus.com/investment-products/mutual-funds
|
| AssetsNet |
$ 248,877,830
|
| Holdings Count | Holding |
172
|
| Advisory Fees Paid, Amount |
$ 1,285,710
|
| InvestmentCompanyPortfolioTurnover |
26.00%
|
| Additional Fund Statistics [Text Block] |
Table Summary
Fund net assets |
$248,877,830 |
Total number of portfolio holdings |
172 |
Management services fees (represents 0.43% of Fund average net assets) |
$1,285,710 |
Portfolio turnover for the reporting period |
26% | |
| Holdings [Text Block] |
Table Summary
New York |
13.0% |
Texas |
12.9% |
California |
8.0% |
New Jersey |
5.7% |
Alabama |
5.3% |
Washington |
4.9% |
Michigan |
4.0% |
Florida |
3.2% |
Pennsylvania |
3.2% |
Missouri |
2.7% |
Table Summary
Municipal Bonds |
95.4% |
Municipal Short Term |
3.6% |
Other |
0.4% | |
| Material Fund Change [Text Block] |
|