Shareholder Report
Apr. 30, 2026
USD ($)
Holding
What were the Fund costs for the last year ?
(based on a hypothetical $10,000 investment)
| Class name | Costs of a $10,000 investment |
Costs paid as a percentage of a $10,000 investment |
| $106 | 0.85% |
How did the Fund perform last year ?
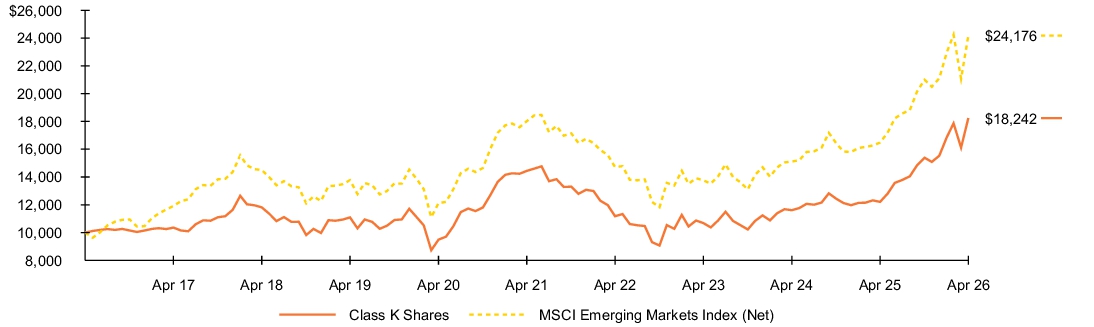
- For the reporting period ended April 30, 2026, the Fund’s Class K Shares returned 49.42%.
- For the same period, the Fund’s benchmark, the MSCI Emerging Markets Index (Net) returned 46.68%.
What contributed to performance?
The Fund delivered strong absolute returns, supported primarily by macro, sentiment, and quality-related insights. Macro and industry thematic positioning made the strongest contributions, led by trend-following measures that successfully captured leadership in semiconductors and technology hardware, as well as broader themes related to the artificial intelligence supply chain. Sentiment insights, which adapted well to changing market conditions, also helped results. Quality-related insights further boosted returns through positioning in companies with improving balance sheet characteristics and stronger earnings quality. Information technology was by far the largest contributor from a sector perspective, with additional gains in financials, industrials, and materials. Country performance was strongest in Taiwan and South Korea, led by holdings in semiconductors, computer equipment, and diversified financials. The Fund's cash position had no material impact on performance.
What detracted from performance?
While the Fund’s overall performance was strong, traditional valuation measures detracted. The shortfall was most notable in companies with weaker sales and earnings characteristics. Certain quality and linkage-based insights (i.e., comparisons of similar companies) also hurt results, with the largest effect coming from those associated with Chinese consumer demand, mobile usage trends, and green innovation themes. Positioning in the consumer discretionary, healthcare, and consumer staples sectors weighed on returns, while India was a modest detractor at the country level.
The views expressed reflect the opinions of BlackRock as of the date of this report and are subject to change based on changes in market, economic or other conditions. These views are not intended to be a forecast of future events and are no guarantee of future results.
Fund performance
Cumulative performance: May 1, 2016 through April 30, 2026
Initial investment of $10,000
See “Average annual total returns” for additional information on fund performance.
| Average annual total returns | ||||||
| 1 Year | 5 Years | 10 Years | ||||
| 49.42 | % | 4.78 | % | 6.20 | % | |
| 46.68 | 6.05 | 9.23 |
| Key Fund statistics | |
| $64,410,900 | |
| 432 | |
| $0 | |
| 224% |
What did the Fund invest in?
(as of April 30, 2026)
| Geographic allocation | ||
| Country/Geographic Region | Percent of Net Assets |
|
| 26.0 | % | |
| 20.4 | ||
| 17.2 | ||
| 11.1 | ||
| 5.6 | ||
| 3.5 | ||
| 2.8 | ||
| 2.5 | ||
| 2.0 | ||
| 1.3 | ||
| 7.0 | ||
| 0.6 | ||
| Ten largest countries/geographic regions are presented. Additional countries/geographic regions are found in Other. |
What were the Fund costs for the last year ?
(based on a hypothetical $10,000 investment)
| Class name | Costs of a $10,000 investment |
Costs paid as a percentage of a $10,000 investment |
| $240 | 1.94% |
How did the Fund perform last year ?
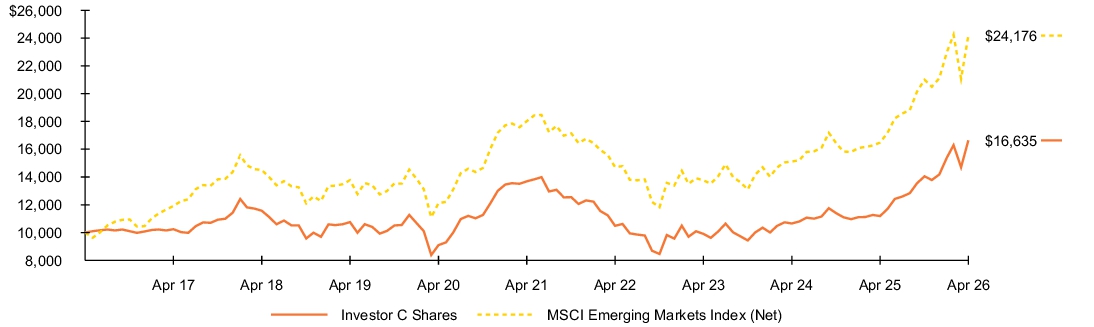
- For the reporting period ended April 30, 2026, the Fund’s Investor C Shares returned 47.64%.
- For the same period, the Fund’s benchmark, the MSCI Emerging Markets Index (Net) returned 46.68%.
What contributed to performance?
The Fund delivered strong absolute returns, supported primarily by macro, sentiment, and quality-related insights. Macro and industry thematic positioning made the strongest contributions, led by trend-following measures that successfully captured leadership in semiconductors and technology hardware, as well as broader themes related to the artificial intelligence supply chain. Sentiment insights, which adapted well to changing market conditions, also helped results. Quality-related insights further boosted returns through positioning in companies with improving balance sheet characteristics and stronger earnings quality. Information technology was by far the largest contributor from a sector perspective, with additional gains in financials, industrials, and materials. Country performance was strongest in Taiwan and South Korea, led by holdings in semiconductors, computer equipment, and diversified financials. The Fund's cash position had no material impact on performance.
What detracted from performance?
While the Fund’s overall performance was strong, traditional valuation measures detracted. The shortfall was most notable in companies with weaker sales and earnings characteristics. Certain quality and linkage-based insights (i.e., comparisons of similar companies) also hurt results, with the largest effect coming from those associated with Chinese consumer demand, mobile usage trends, and green innovation themes. Positioning in the consumer discretionary, healthcare, and consumer staples sectors weighed on returns, while India was a modest detractor at the country level.
The views expressed reflect the opinions of BlackRock as of the date of this report and are subject to change based on changes in market, economic or other conditions. These views are not intended to be a forecast of future events and are no guarantee of future results.
Fund performance
Cumulative performance: May 1, 2016 through April 30, 2026
Initial investment of $10,000
See “Average annual total returns” for additional information on fund performance.
| Average annual total returns | ||||||
| 1 Year | 5 Years | 10 Years | ||||
| 47.64 | % | 3.67 | % | 5.22 | % | |
| 46.64 | 3.67 | 5.22 | ||||
| 46.68 | 6.05 | 9.23 |
| Key Fund statistics | |
| $64,410,900 | |
| 432 | |
| $0 | |
| 224% |
What did the Fund invest in?
(as of April 30, 2026)
| Geographic allocation | ||
| Country/Geographic Region | Percent of Net Assets |
|
| 26.0 | % | |
| 20.4 | ||
| 17.2 | ||
| 11.1 | ||
| 5.6 | ||
| 3.5 | ||
| 2.8 | ||
| 2.5 | ||
| 2.0 | ||
| 1.3 | ||
| 7.0 | ||
| 0.6 | ||
| Ten largest countries/geographic regions are presented. Additional countries/geographic regions are found in Other. |
What were the Fund costs for the last year ?
(based on a hypothetical $10,000 investment)
| Class name | Costs of a $10,000 investment |
Costs paid as a percentage of a $10,000 investment |
| $148 | 1.19% |
How did the Fund perform last year ?
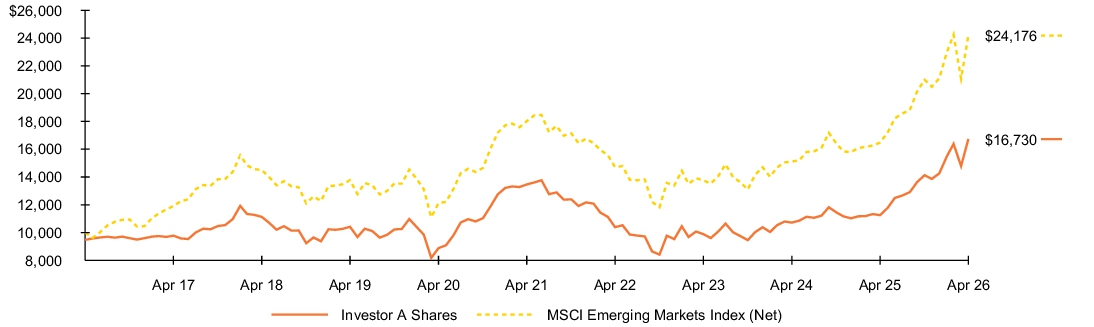
- For the reporting period ended April 30, 2026, the Fund’s Investor A Shares returned 48.69%.
- For the same period, the Fund’s benchmark, the MSCI Emerging Markets Index (Net) returned 46.68%.
What contributed to performance?
The Fund delivered strong absolute returns, supported primarily by macro, sentiment, and quality-related insights. Macro and industry thematic positioning made the strongest contributions, led by trend-following measures that successfully captured leadership in semiconductors and technology hardware, as well as broader themes related to the artificial intelligence supply chain. Sentiment insights, which adapted well to changing market conditions, also helped results. Quality-related insights further boosted returns through positioning in companies with improving balance sheet characteristics and stronger earnings quality. Information technology was by far the largest contributor from a sector perspective, with additional gains in financials, industrials, and materials. Country performance was strongest in Taiwan and South Korea, led by holdings in semiconductors, computer equipment, and diversified financials. The Fund's cash position had no material impact on performance.
What detracted from performance?
While the Fund’s overall performance was strong, traditional valuation measures detracted. The shortfall was most notable in companies with weaker sales and earnings characteristics. Certain quality and linkage-based insights (i.e., comparisons of similar companies) also hurt results, with the largest effect coming from those associated with Chinese consumer demand, mobile usage trends, and green innovation themes. Positioning in the consumer discretionary, healthcare, and consumer staples sectors weighed on returns, while India was a modest detractor at the country level.
The views expressed reflect the opinions of BlackRock as of the date of this report and are subject to change based on changes in market, economic or other conditions. These views are not intended to be a forecast of future events and are no guarantee of future results.
Fund performance
Cumulative performance: May 1, 2016 through April 30, 2026
Initial investment of $10,000
See “Average annual total returns” for additional information on fund performance.
| Average annual total returns | ||||||
| 1 Year | 5 Years | 10 Years | ||||
| 48.69 | % | 4.44 | % | 5.85 | % | |
| 40.88 | 3.32 | 5.28 | ||||
| 46.68 | 6.05 | 9.23 |
| Key Fund statistics | |
| $64,410,900 | |
| 432 | |
| $0 | |
| 224% |
What did the Fund invest in?
(as of April 30, 2026)
| Geographic allocation | ||
| Country/Geographic Region | Percent of Net Assets |
|
| 26.0 | % | |
| 20.4 | ||
| 17.2 | ||
| 11.1 | ||
| 5.6 | ||
| 3.5 | ||
| 2.8 | ||
| 2.5 | ||
| 2.0 | ||
| 1.3 | ||
| 7.0 | ||
| 0.6 | ||
| Ten largest countries/geographic regions are presented. Additional countries/geographic regions are found in Other. |
What were the Fund costs for the last year ?
(based on a hypothetical $10,000 investment)
| Class name | Costs of a $10,000 investment |
Costs paid as a percentage of a $10,000 investment |
| $110 | 0.88% |
How did the Fund perform last year ?
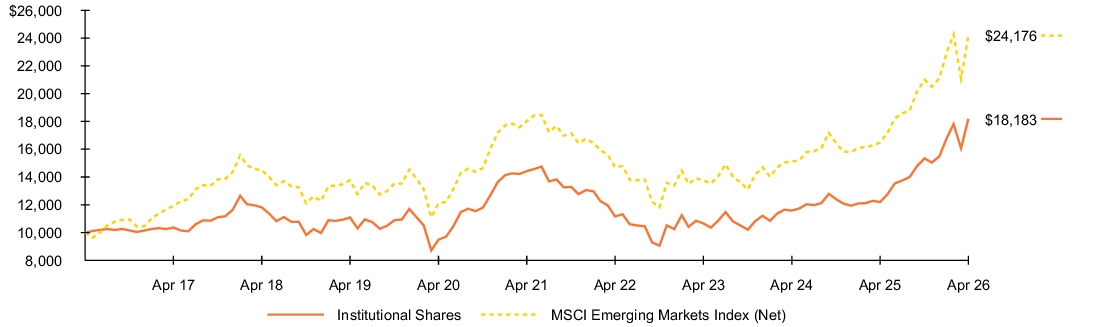
- For the reporting period ended April 30, 2026, the Fund’s Institutional Shares returned 49.07%.
- For the same period, the Fund’s benchmark, the MSCI Emerging Markets Index (Net) returned 46.68%.
What contributed to performance?
The Fund delivered strong absolute returns, supported primarily by macro, sentiment, and quality-related insights. Macro and industry thematic positioning made the strongest contributions, led by trend-following measures that successfully captured leadership in semiconductors and technology hardware, as well as broader themes related to the artificial intelligence supply chain. Sentiment insights, which adapted well to changing market conditions, also helped results. Quality-related insights further boosted returns through positioning in companies with improving balance sheet characteristics and stronger earnings quality. Information technology was by far the largest contributor from a sector perspective, with additional gains in financials, industrials, and materials. Country performance was strongest in Taiwan and South Korea, led by holdings in semiconductors, computer equipment, and diversified financials. The Fund's cash position had no material impact on performance.
What detracted from performance?
While the Fund’s overall performance was strong, traditional valuation measures detracted. The shortfall was most notable in companies with weaker sales and earnings characteristics. Certain quality and linkage-based insights (i.e., comparisons of similar companies) also hurt results, with the largest effect coming from those associated with Chinese consumer demand, mobile usage trends, and green innovation themes. Positioning in the consumer discretionary, healthcare, and consumer staples sectors weighed on returns, while India was a modest detractor at the country level.
The views expressed reflect the opinions of BlackRock as of the date of this report and are subject to change based on changes in market, economic or other conditions. These views are not intended to be a forecast of future events and are no guarantee of future results.
Fund performance
Cumulative performance: May 1, 2016 through April 30, 2026
Initial investment of $10,000
See “Average annual total returns” for additional information on fund performance.
| Average annual total returns | ||||||
| 1 Year | 5 Years | 10 Years | ||||
| 49.07 | % | 4.74 | % | 6.16 | % | |
| 46.68 | 6.05 | 9.23 |
| Key Fund statistics | |
| $64,410,900 | |
| 432 | |
| $0 | |
| 224% |
What did the Fund invest in?
(as of April 30, 2026)
| Geographic allocation | ||
| Country/Geographic Region | Percent of Net Assets |
|
| 26.0 | % | |
| 20.4 | ||
| 17.2 | ||
| 11.1 | ||
| 5.6 | ||
| 3.5 | ||
| 2.8 | ||
| 2.5 | ||
| 2.0 | ||
| 1.3 | ||
| 7.0 | ||
| 0.6 | ||
| Ten largest countries/geographic regions are presented. Additional countries/geographic regions are found in Other. |
What were the Fund costs for the last year ?
(based on a hypothetical $10,000 investment)
| Class name | Costs of a $10,000 investment |
Costs paid as a percentage of a $10,000 investment |
| $147 | 1.34% |
How did the Fund perform last year ?
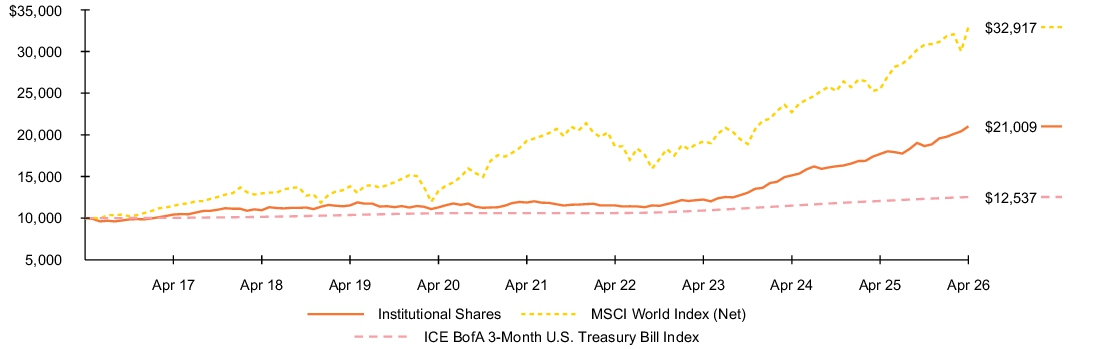
- For the reporting period ended April 30, 2026, the Fund’s Institutional Shares returned 18.68%.
- For the same period, the Fund’s benchmark, the MSCI World Index (Net) returned 29.16% and the ICE BofA 3-Month U.S. Treasury Bill Index returned 3.95%
What contributed to performance?
Sentiment insights were the strongest contributors to absolute performance. The measures successfully adapted to multiple market trends, including artificial intelligence, fiscal stimulus, inflation, and geopolitical developments, particularly the Iran conflict toward the end of the period. Linkage-based measures (i.e., comparisons of similar companies) and trend-following insights were particularly effective in identifying changing market leadership. Long positions, together with stock selection in Europe, made the largest contribution in this segment of the Fund. Macro thematic insights also contributed positively, especially through positioning in energy, infrastructure, and trade-related themes. Positioning in the financials and energy sectors added to returns through selective longs in banks and industrial-related companies against shorts in insurance, diversified financial, and trade-sensitive businesses.
The Fund used derivatives to implement its stock selection strategy more efficiently. The use of derivatives did not have a material impact on results. The Fund's cash position had no material impact on performance.
What detracted from performance?
Fundamental insights detracted early in the reporting period as speculative market leadership and momentum-driven rallies acted as a headwind for more defensive positioning. The weakness was most notable in traditional valuation and quality measures, as investors aggressively rotated toward perceived artificial intelligence winners and higher-beta growth stocks. Measures tied to profitability, earnings expectations, and company management sentiment also struggled amid rapidly changing investor preferences. However, fundamental insights rebounded late in the period as rising geopolitical tensions associated with the Iran conflict led investors to refocus on earnings resilience, valuations, and defensive characteristics.
The views expressed reflect the opinions of BlackRock as of the date of this report and are subject to change based on changes in market, economic or other conditions. These views are not intended to be a forecast of future events and are no guarantee of future results.
Fund performance
Cumulative performance: May 1, 2016 through April 30, 2026
Initial investment of $10,000
See “Average annual total returns” for additional information on fund performance.
| Average annual total returns | ||||||
| 1 Year | 5 Years | 10 Years | ||||
| 18.68 | % | 12.08 | % | 7.71 | % | |
| 29.16 | 11.29 | 12.65 | ||||
| 3.95 | 3.40 | 2.29 |
On December 1, 2023, the Fund began to compare its performance to the standard pricing time of the ICE BofA 3-Month U.S. Treasury Bill Index (the “Index”). Index data prior to March 1, 2021 is for the Index’s standard pricing time of 3pm. Index data from March 1, 2021 through November 30, 2023 is for a custom 4pm pricing variant of the Index. Index returns beginning on December 1, 2023 reflect the Index’s new standard pricing time of 4pm. The change of the Index’s standard pricing time from 3pm to 4pm resulted in the discontinuation of the custom 4pm pricing variant used from March 1, 2021 through November 30, 2023.
| Key Fund statistics | |
| $11,357,741,388 | |
| 12,843 | |
| $85,637,747 | |
| 113% |
What did the Fund invest in?
(as of April 30, 2026)
| Geographic allocation | ||||||
| Percent of Total Investments(a) | ||||||
| Country/Geographic Region | Long | Short | Total | |||
| 19.9 | % | 18.5 | % | 38.4 | % | |
| 10.2 | 10.1 | 20.3 | ||||
| 3.6 | 3.5 | 7.1 | ||||
| 2.6 | 2.4 | 5.0 | ||||
| 2.1 | 1.8 | 3.9 | ||||
| 1.9 | 2.0 | 3.9 | ||||
| 1.7 | 2.1 | 3.8 | ||||
| 1.1 | 1.2 | 2.3 | ||||
| 1.0 | 1.3 | 2.3 | ||||
| 0.9 | 1.1 | 2.0 | ||||
| 5.6 | 5.4 | 11.0 | ||||
| 50.6 | 49.4 | 100.0 | ||||
| Include the gross market values of long and short securities of the underlying derivative contracts and excludes short-term securities and options, if any. |
| Ten largest countries/geographic regions are presented. Additional countries/geographic regions are found in Other. |
What were the Fund costs for the last year ?
(based on a hypothetical $10,000 investment)
| Class name | Costs of a $10,000 investment |
Costs paid as a percentage of a $10,000 investment |
| $174 | 1.59% |
How did the Fund perform last year ?
- For the reporting period ended April 30, 2026, the Fund’s Investor A Shares returned 18.43%.
- For the same period, the Fund’s benchmark, the MSCI World Index (Net) returned 29.16% and the ICE BofA 3-Month U.S. Treasury Bill Index returned 3.95%
What contributed to performance?
Sentiment insights were the strongest contributors to absolute performance. The measures successfully adapted to multiple market trends, including artificial intelligence, fiscal stimulus, inflation, and geopolitical developments, particularly the Iran conflict toward the end of the period. Linkage-based measures (i.e., comparisons of similar companies) and trend-following insights were particularly effective in identifying changing market leadership. Long positions, together with stock selection in Europe, made the largest contribution in this segment of the Fund. Macro thematic insights also contributed positively, especially through positioning in energy, infrastructure, and trade-related themes. Positioning in the financials and energy sectors added to returns through selective longs in banks and industrial-related companies against shorts in insurance, diversified financial, and trade-sensitive businesses.
The Fund used derivatives to implement its stock selection strategy more efficiently. The use of derivatives did not have a material impact on results. The Fund's cash position had no material impact on performance.
What detracted from performance?
Fundamental insights detracted early in the reporting period as speculative market leadership and momentum-driven rallies acted as a headwind for more defensive positioning. The weakness was most notable in traditional valuation and quality measures, as investors aggressively rotated toward perceived artificial intelligence winners and higher-beta growth stocks. Measures tied to profitability, earnings expectations, and company management sentiment also struggled amid rapidly changing investor preferences. However, fundamental insights rebounded late in the period as rising geopolitical tensions associated with the Iran conflict led investors to refocus on earnings resilience, valuations, and defensive characteristics.
The views expressed reflect the opinions of BlackRock as of the date of this report and are subject to change based on changes in market, economic or other conditions. These views are not intended to be a forecast of future events and are no guarantee of future results.
Fund performance
Cumulative performance: May 1, 2016 through April 30, 2026
Initial investment of $10,000

See “Average annual total returns” for additional information on fund performance.
| Average annual total returns | ||||||
| 1 Year | 5 Years | 10 Years | ||||
| 18.43 | % | 11.80 | % | 7.43 | % | |
| 12.21 | 10.60 | 6.85 | ||||
| 29.16 | 11.29 | 12.65 | ||||
| 3.95 | 3.40 | 2.29 |
On December 1, 2023, the Fund began to compare its performance to the standard pricing time of the ICE BofA 3-Month U.S. Treasury Bill Index (the “Index”). Index data prior to March 1, 2021 is for the Index’s standard pricing time of 3pm. Index data from March 1, 2021 through November 30, 2023 is for a custom 4pm pricing variant of the Index. Index returns beginning on December 1, 2023 reflect the Index’s new standard pricing time of 4pm. The change of the Index’s standard pricing time from 3pm to 4pm resulted in the discontinuation of the custom 4pm pricing variant used from March 1, 2021 through November 30, 2023.
| Key Fund statistics | |
| $11,357,741,388 | |
| 12,843 | |
| $85,637,747 | |
| 113% |
What did the Fund invest in?
(as of April 30, 2026)
| Geographic allocation | ||||||
| Percent of Total Investments(a) | ||||||
| Country/Geographic Region | Long | Short | Total | |||
| 19.9 | % | 18.5 | % | 38.4 | % | |
| 10.2 | 10.1 | 20.3 | ||||
| 3.6 | 3.5 | 7.1 | ||||
| 2.6 | 2.4 | 5.0 | ||||
| 2.1 | 1.8 | 3.9 | ||||
| 1.9 | 2.0 | 3.9 | ||||
| 1.7 | 2.1 | 3.8 | ||||
| 1.1 | 1.2 | 2.3 | ||||
| 1.0 | 1.3 | 2.3 | ||||
| 0.9 | 1.1 | 2.0 | ||||
| 5.6 | 5.4 | 11.0 | ||||
| 50.6 | 49.4 | 100.0 | ||||
| Include the gross market values of long and short securities of the underlying derivative contracts and excludes short-term securities and options, if any. |
| Ten largest countries/geographic regions are presented. Additional countries/geographic regions are found in Other. |
What were the Fund costs for the last year ?
(based on a hypothetical $10,000 investment)
| Class name | Costs of a $10,000 investment |
Costs paid as a percentage of a $10,000 investment |
| $250 | 2.30% |
How did the Fund perform last year ?
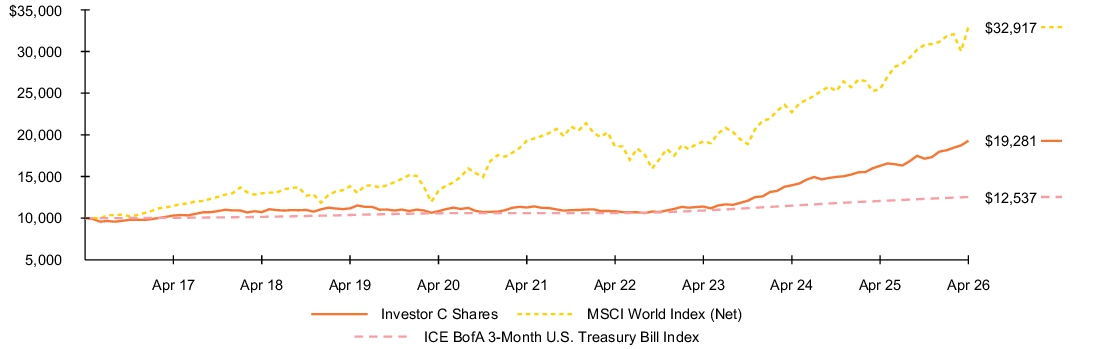
- For the reporting period ended April 30, 2026, the Fund’s Investor C Shares returned 17.54%.
- For the same period, the Fund’s benchmark, the MSCI World Index (Net) returned 29.16% and the ICE BofA 3-Month U.S. Treasury Bill Index returned 3.95%
What contributed to performance?
Sentiment insights were the strongest contributors to absolute performance. The measures successfully adapted to multiple market trends, including artificial intelligence, fiscal stimulus, inflation, and geopolitical developments, particularly the Iran conflict toward the end of the period. Linkage-based measures (i.e., comparisons of similar companies) and trend-following insights were particularly effective in identifying changing market leadership. Long positions, together with stock selection in Europe, made the largest contribution in this segment of the Fund. Macro thematic insights also contributed positively, especially through positioning in energy, infrastructure, and trade-related themes. Positioning in the financials and energy sectors added to returns through selective longs in banks and industrial-related companies against shorts in insurance, diversified financial, and trade-sensitive businesses.
The Fund used derivatives to implement its stock selection strategy more efficiently. The use of derivatives did not have a material impact on results. The Fund's cash position had no material impact on performance.
What detracted from performance?
Fundamental insights detracted early in the reporting period as speculative market leadership and momentum-driven rallies acted as a headwind for more defensive positioning. The weakness was most notable in traditional valuation and quality measures, as investors aggressively rotated toward perceived artificial intelligence winners and higher-beta growth stocks. Measures tied to profitability, earnings expectations, and company management sentiment also struggled amid rapidly changing investor preferences. However, fundamental insights rebounded late in the period as rising geopolitical tensions associated with the Iran conflict led investors to refocus on earnings resilience, valuations, and defensive characteristics.
The views expressed reflect the opinions of BlackRock as of the date of this report and are subject to change based on changes in market, economic or other conditions. These views are not intended to be a forecast of future events and are no guarantee of future results.
Fund performance
Cumulative performance: May 1, 2016 through April 30, 2026
Initial investment of $10,000
See “Average annual total returns” for additional information on fund performance.
| Average annual total returns | ||||||
| 1 Year | 5 Years | 10 Years | ||||
| 17.54 | % | 10.98 | % | 6.79 | % | |
| 16.54 | 10.98 | 6.79 | ||||
| 29.16 | 11.29 | 12.65 | ||||
| 3.95 | 3.40 | 2.29 |
On December 1, 2023, the Fund began to compare its performance to the standard pricing time of the ICE BofA 3-Month U.S. Treasury Bill Index (the “Index”). Index data prior to March 1, 2021 is for the Index’s standard pricing time of 3pm. Index data from March 1, 2021 through November 30, 2023 is for a custom 4pm pricing variant of the Index. Index returns beginning on December 1, 2023 reflect the Index’s new standard pricing time of 4pm. The change of the Index’s standard pricing time from 3pm to 4pm resulted in the discontinuation of the custom 4pm pricing variant used from March 1, 2021 through November 30, 2023.
| Key Fund statistics | |
| $11,357,741,388 | |
| 12,843 | |
| $85,637,747 | |
| 113% |
What did the Fund invest in?
(as of April 30, 2026)
| Geographic allocation | ||||||
| Percent of Total Investments(a) | ||||||
| Country/Geographic Region | Long | Short | Total | |||
| 19.9 | % | 18.5 | % | 38.4 | % | |
| 10.2 | 10.1 | 20.3 | ||||
| 3.6 | 3.5 | 7.1 | ||||
| 2.6 | 2.4 | 5.0 | ||||
| 2.1 | 1.8 | 3.9 | ||||
| 1.9 | 2.0 | 3.9 | ||||
| 1.7 | 2.1 | 3.8 | ||||
| 1.1 | 1.2 | 2.3 | ||||
| 1.0 | 1.3 | 2.3 | ||||
| 0.9 | 1.1 | 2.0 | ||||
| 5.6 | 5.4 | 11.0 | ||||
| 50.6 | 49.4 | 100.0 | ||||
| Include the gross market values of long and short securities of the underlying derivative contracts and excludes short-term securities and options, if any. |
| Ten largest countries/geographic regions are presented. Additional countries/geographic regions are found in Other. |
What were the Fund costs for the last year ?
(based on a hypothetical $10,000 investment)
| Class name | Costs of a $10,000 investment |
Costs paid as a percentage of a $10,000 investment |
| $136 | 1.24% |
How did the Fund perform last year ?
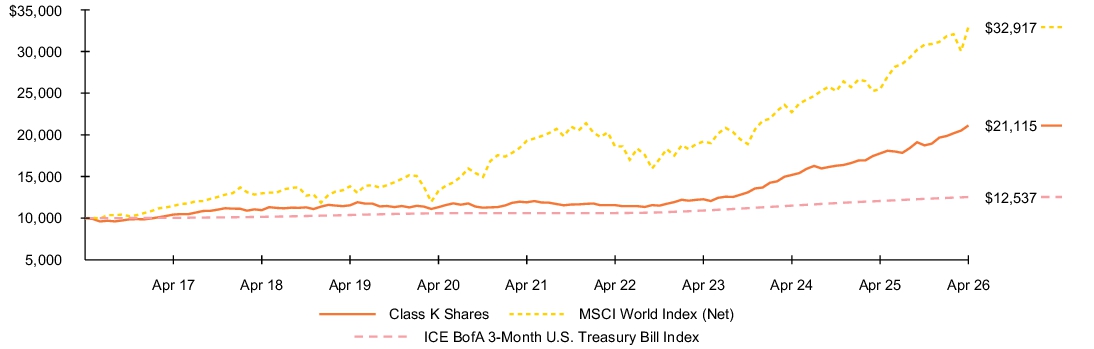
- For the reporting period ended April 30, 2026, the Fund’s Class K Shares returned 18.84%.
- For the same period, the Fund’s benchmark, the MSCI World Index (Net) returned 29.16% and the ICE BofA 3-Month U.S. Treasury Bill Index returned 3.95%
What contributed to performance?
Sentiment insights were the strongest contributors to absolute performance. The measures successfully adapted to multiple market trends, including artificial intelligence, fiscal stimulus, inflation, and geopolitical developments, particularly the Iran conflict toward the end of the period. Linkage-based measures (i.e., comparisons of similar companies) and trend-following insights were particularly effective in identifying changing market leadership. Long positions, together with stock selection in Europe, made the largest contribution in this segment of the Fund. Macro thematic insights also contributed positively, especially through positioning in energy, infrastructure, and trade-related themes. Positioning in the financials and energy sectors added to returns through selective longs in banks and industrial-related companies against shorts in insurance, diversified financial, and trade-sensitive businesses.
The Fund used derivatives to implement its stock selection strategy more efficiently. The use of derivatives did not have a material impact on results. The Fund's cash position had no material impact on performance.
What detracted from performance?
Fundamental insights detracted early in the reporting period as speculative market leadership and momentum-driven rallies acted as a headwind for more defensive positioning. The weakness was most notable in traditional valuation and quality measures, as investors aggressively rotated toward perceived artificial intelligence winners and higher-beta growth stocks. Measures tied to profitability, earnings expectations, and company management sentiment also struggled amid rapidly changing investor preferences. However, fundamental insights rebounded late in the period as rising geopolitical tensions associated with the Iran conflict led investors to refocus on earnings resilience, valuations, and defensive characteristics.
The views expressed reflect the opinions of BlackRock as of the date of this report and are subject to change based on changes in market, economic or other conditions. These views are not intended to be a forecast of future events and are no guarantee of future results.
Fund performance
Cumulative performance: May 1, 2016 through April 30, 2026
Initial investment of $10,000
See “Average annual total returns” for additional information on fund performance.
| Average annual total returns | ||||||
| 1 Year | 5 Years | 10 Years | ||||
| 18.84 | % | 12.15 | % | 7.76 | % | |
| 29.16 | 11.29 | 12.65 | ||||
| 3.95 | 3.40 | 2.29 |
On December 1, 2023, the Fund began to compare its performance to the standard pricing time of the ICE BofA 3-Month U.S. Treasury Bill Index (the “Index”). Index data prior to March 1, 2021 is for the Index’s standard pricing time of 3pm. Index data from March 1, 2021 through November 30, 2023 is for a custom 4pm pricing variant of the Index. Index returns beginning on December 1, 2023 reflect the Index’s new standard pricing time of 4pm. The change of the Index’s standard pricing time from 3pm to 4pm resulted in the discontinuation of the custom 4pm pricing variant used from March 1, 2021 through November 30, 2023.
| Key Fund statistics | |
| $11,357,741,388 | |
| 12,843 | |
| $85,637,747 | |
| 113% |
What did the Fund invest in?
(as of April 30, 2026)
| Geographic allocation | ||||||
| Percent of Total Investments(a) | ||||||
| Country/Geographic Region | Long | Short | Total | |||
| 19.9 | % | 18.5 | % | 38.4 | % | |
| 10.2 | 10.1 | 20.3 | ||||
| 3.6 | 3.5 | 7.1 | ||||
| 2.6 | 2.4 | 5.0 | ||||
| 2.1 | 1.8 | 3.9 | ||||
| 1.9 | 2.0 | 3.9 | ||||
| 1.7 | 2.1 | 3.8 | ||||
| 1.1 | 1.2 | 2.3 | ||||
| 1.0 | 1.3 | 2.3 | ||||
| 0.9 | 1.1 | 2.0 | ||||
| 5.6 | 5.4 | 11.0 | ||||
| 50.6 | 49.4 | 100.0 | ||||
| Include the gross market values of long and short securities of the underlying derivative contracts and excludes short-term securities and options, if any. |
| Ten largest countries/geographic regions are presented. Additional countries/geographic regions are found in Other. |
What were the Fund costs for the last year ?
(based on a hypothetical $10,000 investment)
| Class name | Costs of a $10,000 investment |
Costs paid as a percentage of a $10,000 investment |
| $89 | 0.81% |
How did the Fund perform last year ?
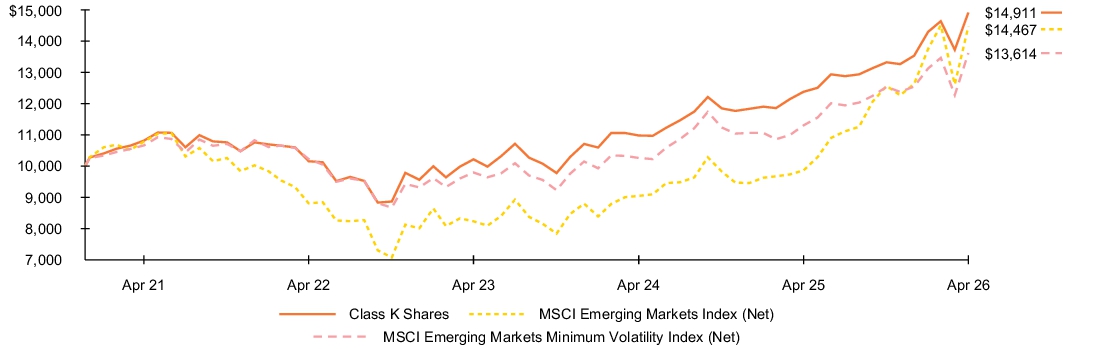
- For the reporting period ended April 30, 2026, the Fund’s Class K Shares returned 20.47%.
- For the same period, the Fund’s benchmark, the MSCI Emerging Markets Index (Net) returned 46.68% and the MSCI Emerging Markets Minimum Volatility Index (Net) returned 20.45%.
What contributed to performance?
The Fund delivered positive absolute returns over the reporting period, supported primarily by quality, sentiment, and macro thematic insights. Quality-related measures were the strongest contributors, particularly those focused on operating cash flow strength, earnings quality, and disciplined balance sheet characteristics. Sentiment insights also helped results, as the assessment of analyst revisions, broker sentiment, and flow-related measures adapted well to changing market conditions. Macro thematic positioning further contributed through country and industry-level insights that gauge yield curve dynamics, foreign exchange reserves, and inventory-related trends. Information technology and financials were the largest contributors from a sector perspective, with additional gains from communication services, energy, and industrials. Country performance was strongest in Taiwan, South Korea, and China, highlighted by holdings in semiconductors, banks, and energy stocks.
What detracted from performance?
While the Fund’s overall performance was positive, traditional valuation measures—particularly those tied to cash flow and sales-based valuation characteristics—detracted. Certain country-level thematic insights also struggled, with flow, energy production, and long-term reversion related measures representing the largest detractors. Healthcare, consumer discretionary, and consumer staples were the most notable detractors in terms of sectors, while India was the leading detractor at the country level.
The views expressed reflect the opinions of BlackRock as of the date of this report and are subject to change based on changes in market, economic or other conditions. These views are not intended to be a forecast of future events and are no guarantee of future results.
Fund performance
Cumulative performance: December 21, 2020 through April 30, 2026
Initial investment of $10,000
See “Average annual total returns” for additional information on fund performance.
| Average annual total returns | ||||||
| 1 Year | 5 Years | Since Fund Inception |
||||
| 20.47 | % | 6.64 | % | 7.74 | % | |
| 46.68 | 6.05 | 7.13 | ||||
| 20.45 | 5.01 | 5.93 |
| Key Fund statistics | |
| $13,605,322 | |
| 188 | |
| $0 | |
| 211% |
What did the Fund invest in?
(as of April 30, 2026)
| Geographic allocation | ||
| Country/Geographic Region | Percent of Net Assets |
|
| 20.3 | % | |
| 17.1 | ||
| 13.9 | ||
| 10.8 | ||
| 7.4 | ||
| 4.8 | ||
| 4.2 | ||
| 3.9 | ||
| 2.5 | ||
| 2.3 | ||
| 12.9 | ||
| (0.1 | ) | |
| Ten largest holdings | ||
| Security(a) | Percent of Net Assets |
|
| 1.8 | % | |
| 1.6 | ||
| 1.5 | ||
| 1.5 | ||
| 1.5 | ||
| 1.5 | ||
| 1.5 | ||
| 1.5 | ||
| 1.5 | ||
| 1.5 | ||
| Excludes short-term securities. |
| Ten largest countries/geographic regions are presented. Additional countries/geographic regions are found in Other. |
| Ten largest holdings | ||
| Security(a) | Percent of Net Assets |
|
| 1.8 | % | |
| 1.6 | ||
| 1.5 | ||
| 1.5 | ||
| 1.5 | ||
| 1.5 | ||
| 1.5 | ||
| 1.5 | ||
| 1.5 | ||
| 1.5 | ||
What were the Fund costs for the last year ?
(based on a hypothetical $10,000 investment)
| Class name | Costs of a $10,000 investment |
Costs paid as a percentage of a $10,000 investment |
| $122 | 1.11% |
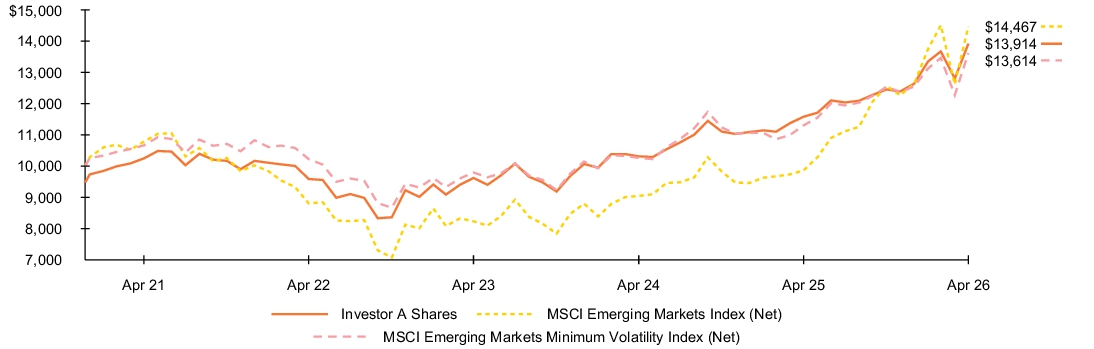
How did the Fund perform last year ?
- For the reporting period ended April 30, 2026, the Fund’s Investor A Shares returned 20.17%.
- For the same period, the Fund’s benchmark, the MSCI Emerging Markets Index (Net) returned 46.68% and the MSCI Emerging Markets Minimum Volatility Index (Net) returned 20.45%.
What contributed to performance?
The Fund delivered positive absolute returns over the reporting period, supported primarily by quality, sentiment, and macro thematic insights. Quality-related measures were the strongest contributors, particularly those focused on operating cash flow strength, earnings quality, and disciplined balance sheet characteristics. Sentiment insights also helped results, as the assessment of analyst revisions, broker sentiment, and flow-related measures adapted well to changing market conditions. Macro thematic positioning further contributed through country and industry-level insights that gauge yield curve dynamics, foreign exchange reserves, and inventory-related trends. Information technology and financials were the largest contributors from a sector perspective, with additional gains from communication services, energy, and industrials. Country performance was strongest in Taiwan, South Korea, and China, highlighted by holdings in semiconductors, banks, and energy stocks.
What detracted from performance?
While the Fund’s overall performance was positive, traditional valuation measures—particularly those tied to cash flow and sales-based valuation characteristics—detracted. Certain country-level thematic insights also struggled, with flow, energy production, and long-term reversion related measures representing the largest detractors. Healthcare, consumer discretionary, and consumer staples were the most notable detractors in terms of sectors, while India was the leading detractor at the country level.
The views expressed reflect the opinions of BlackRock as of the date of this report and are subject to change based on changes in market, economic or other conditions. These views are not intended to be a forecast of future events and are no guarantee of future results.
Fund performance
Cumulative performance: December 21, 2020 through April 30, 2026
Initial investment of $10,000
See “Average annual total returns” for additional information on fund performance.
| Average annual total returns | ||||||
| 1 Year | 5 Years | Since Fund Inception |
||||
| 20.17 | % | 6.31 | % | 7.44 | % | |
| 13.86 | 5.17 | 6.36 | ||||
| 46.68 | 6.05 | 7.13 | ||||
| 20.45 | 5.01 | 5.93 |
| Key Fund statistics | |
| $13,605,322 | |
| 188 | |
| $0 | |
| 211% |
What did the Fund invest in?
(as of April 30, 2026)
| Geographic allocation | ||
| Country/Geographic Region | Percent of Net Assets |
|
| 20.3 | % | |
| 17.1 | ||
| 13.9 | ||
| 10.8 | ||
| 7.4 | ||
| 4.8 | ||
| 4.2 | ||
| 3.9 | ||
| 2.5 | ||
| 2.3 | ||
| 12.9 | ||
| (0.1 | ) | |
| Ten largest holdings | ||
| Security(a) | Percent of Net Assets |
|
| 1.8 | % | |
| 1.6 | ||
| 1.5 | ||
| 1.5 | ||
| 1.5 | ||
| 1.5 | ||
| 1.5 | ||
| 1.5 | ||
| 1.5 | ||
| 1.5 | ||
| Excludes short-term securities. |
| Ten largest countries/geographic regions are presented. Additional countries/geographic regions are found in Other. |
| Ten largest holdings | ||
| Security(a) | Percent of Net Assets |
|
| 1.8 | % | |
| 1.6 | ||
| 1.5 | ||
| 1.5 | ||
| 1.5 | ||
| 1.5 | ||
| 1.5 | ||
| 1.5 | ||
| 1.5 | ||
| 1.5 | ||
What were the Fund costs for the last year ?
(based on a hypothetical $10,000 investment)
| Class name | Costs of a $10,000 investment |
Costs paid as a percentage of a $10,000 investment |
| $94 | 0.85% |
How did the Fund perform last year ?
- For the reporting period ended April 30, 2026, the Fund’s Institutional Shares returned 20.41%.
- For the same period, the Fund’s benchmark, the MSCI Emerging Markets Index (Net) returned 46.68% and the MSCI Emerging Markets Minimum Volatility Index (Net) returned 20.45%.
What contributed to performance?
The Fund delivered positive absolute returns over the reporting period, supported primarily by quality, sentiment, and macro thematic insights. Quality-related measures were the strongest contributors, particularly those focused on operating cash flow strength, earnings quality, and disciplined balance sheet characteristics. Sentiment insights also helped results, as the assessment of analyst revisions, broker sentiment, and flow-related measures adapted well to changing market conditions. Macro thematic positioning further contributed through country and industry-level insights that gauge yield curve dynamics, foreign exchange reserves, and inventory-related trends. Information technology and financials were the largest contributors from a sector perspective, with additional gains from communication services, energy, and industrials. Country performance was strongest in Taiwan, South Korea, and China, highlighted by holdings in semiconductors, banks, and energy stocks.
What detracted from performance?
While the Fund’s overall performance was positive, traditional valuation measures—particularly those tied to cash flow and sales-based valuation characteristics—detracted. Certain country-level thematic insights also struggled, with flow, energy production, and long-term reversion related measures representing the largest detractors. Healthcare, consumer discretionary, and consumer staples were the most notable detractors in terms of sectors, while India was the leading detractor at the country level.
The views expressed reflect the opinions of BlackRock as of the date of this report and are subject to change based on changes in market, economic or other conditions. These views are not intended to be a forecast of future events and are no guarantee of future results.
Fund performance
Cumulative performance: December 21, 2020 through April 30, 2026
Initial investment of $10,000

See “Average annual total returns” for additional information on fund performance.
| Average annual total returns | ||||||
| 1 Year | 5 Years | Since Fund Inception |
||||
| 20.41 | % | 6.61 | % | 7.72 | % | |
| 46.68 | 6.05 | 7.13 | ||||
| 20.45 | 5.01 | 5.93 |
| Key Fund statistics | |
| $13,605,322 | |
| 188 | |
| $0 | |
| 211% |
What did the Fund invest in?
(as of April 30, 2026)
| Geographic allocation | ||
| Country/Geographic Region | Percent of Net Assets |
|
| 20.3 | % | |
| 17.1 | ||
| 13.9 | ||
| 10.8 | ||
| 7.4 | ||
| 4.8 | ||
| 4.2 | ||
| 3.9 | ||
| 2.5 | ||
| 2.3 | ||
| 12.9 | ||
| (0.1 | ) | |
| Ten largest holdings | ||
| Security(a) | Percent of Net Assets |
|
| 1.8 | % | |
| 1.6 | ||
| 1.5 | ||
| 1.5 | ||
| 1.5 | ||
| 1.5 | ||
| 1.5 | ||
| 1.5 | ||
| 1.5 | ||
| 1.5 | ||
| Excludes short-term securities. |
| Ten largest countries/geographic regions are presented. Additional countries/geographic regions are found in Other. |
| Ten largest holdings | ||
| Security(a) | Percent of Net Assets |
|
| 1.8 | % | |
| 1.6 | ||
| 1.5 | ||
| 1.5 | ||
| 1.5 | ||
| 1.5 | ||
| 1.5 | ||
| 1.5 | ||
| 1.5 | ||
| 1.5 | ||