v3.26.1
Shareholder Report
12 Months Ended
Apr. 30, 2026
USD ($)
Holdings
Shareholder Report [Line Items]  
Document Type N-CSR
Amendment Flag false
Registrant Name Tidal Trust I
Entity Central Index Key 0001742912
Entity Investment Company Type N-1A
Document Period End Date Apr. 30, 2026
Shareholder Report Annual or Semi-Annual annual shareholder report
ZEGA Buy and Hedge ETF  
Shareholder Report [Line Items]  
Fund Name ZEGA Buy and Hedge ETF
Class Name ZEGA Buy and Hedge ETF
Trading Symbol ZHDG
Security Exchange Name NYSEArca
Annual or Semi-Annual Statement [Text Block] This annual shareholder report contains important information about the ZEGA Buy and Hedge ETF (the "Fund") for the period May 1, 2025 to April 30, 2026.
Shareholder Report Annual or Semi-Annual annual shareholder report
Additional Information [Text Block] You can find additional information about the Fund at www.zegaetfs.com/zhdg-zega-buy-hedge-etf/. You can also request this information by contacting us at (833) 415-4006 or by writing the Fund at ZEGA Buy and Hedge ETF, c/o U.S. Bank Global Fund Services, P.O. Box 701, Milwaukee, Wisconsin 53201-0701.
Material Fund Change Notice [Text Block] This report describes changes to the Fund that occurred during the reporting period.
Additional Information Phone Number (833) 415-4006
Additional Information Website www.zegaetfs.com/zhdg-zega-buy-hedge-etf/
Expenses [Text Block]

What were the Fund costs for the past year?

(based on a hypothetical $10,000 investment)

Fund Name
Costs of a $10,000 investment
Costs paid as a percentage of a $10,000 investment
ZEGA Buy and Hedge ETF
$105
0.95%

Expenses Paid, Amount $ 105
Expense Ratio, Percent 0.95%
Factors Affecting Performance [Text Block]

How did the Fund perform last year?

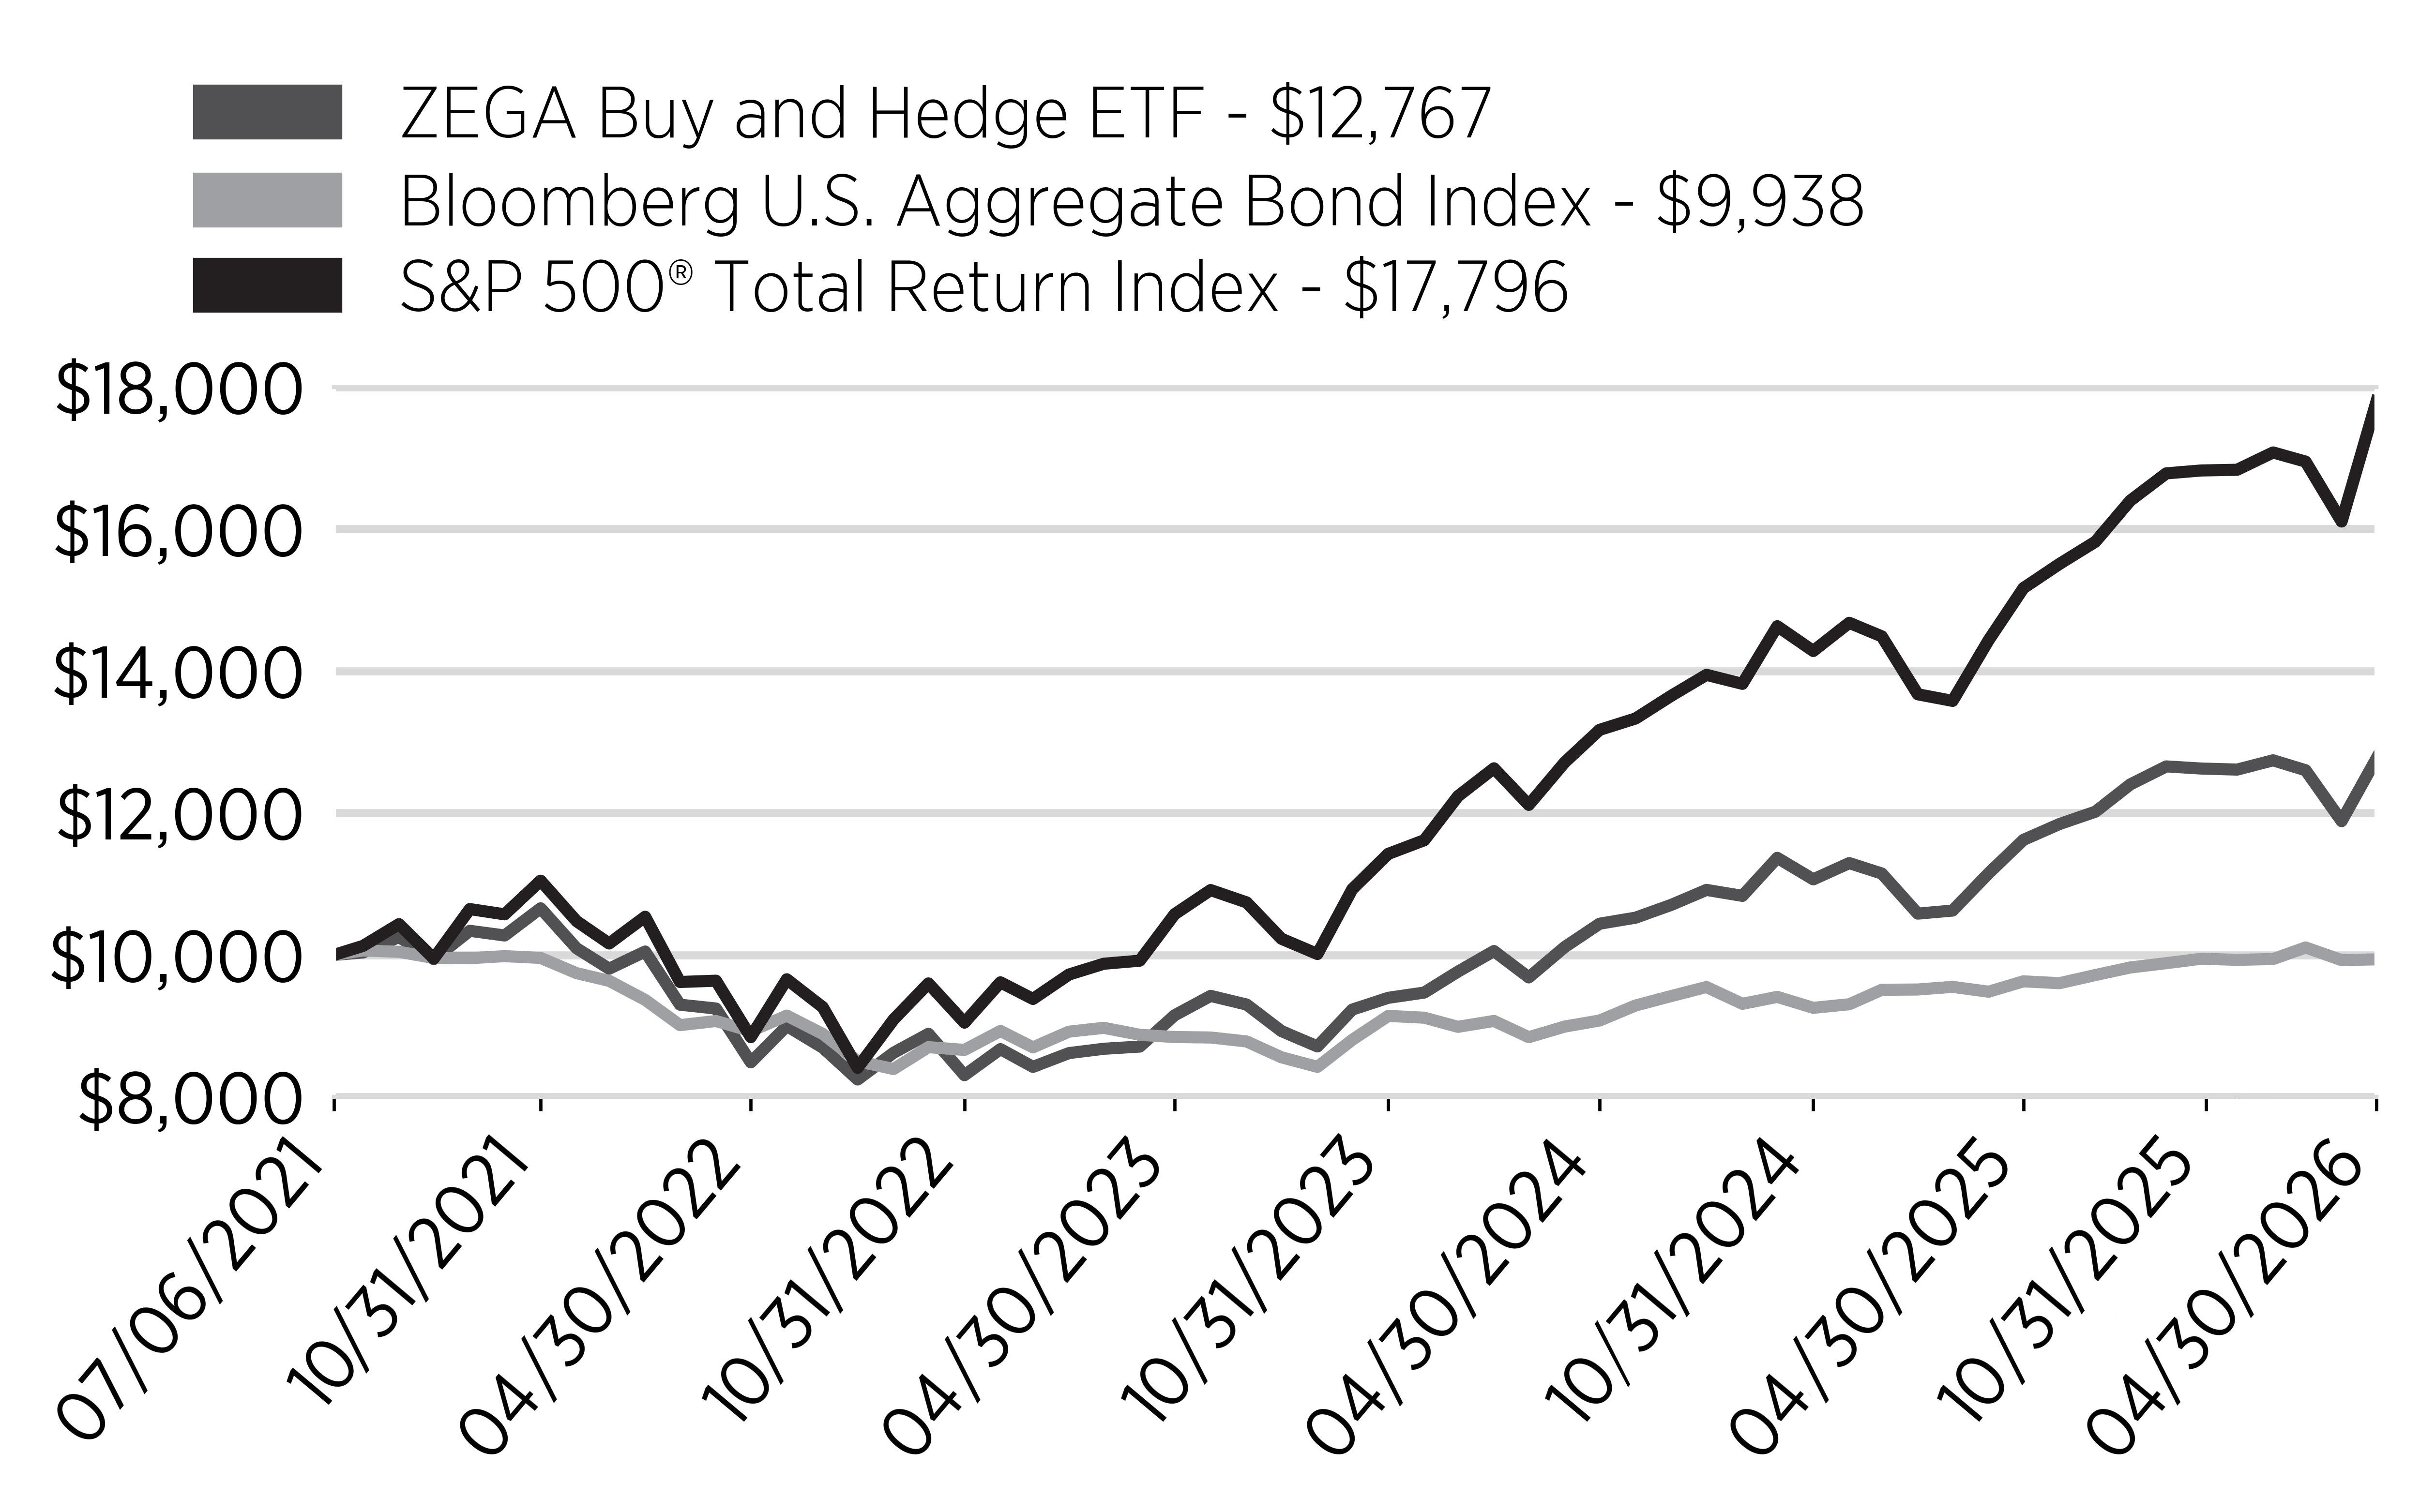
For the fiscal year ended April 30, 2026, the Fund gained 20.15% which outperformed the Bloomberg U.S. Aggregate Bond Index's return of 4.06%. The Fund underperformed the S&P 500® Total Return Index, which returned 31.05% during the fiscal year.

The Fund is an actively-managed exchange-traded fund (“ETF”) that seeks to provide exposure to the U.S. large capitalization equity market, while mitigating overall market downside risk in the event of a major market decline.

What Factors Influenced Performance?

1.     Macroeconomic Environment: During the fiscal year, markets were supported by continued economic expansion and a resilient labor market, while investors navigated persistent inflation, elevated interest rates, and geopolitical uncertainty. This environment favored risk-managed equity exposure, allowing the Fund to participate in equity market gains while maintaining downside protection.

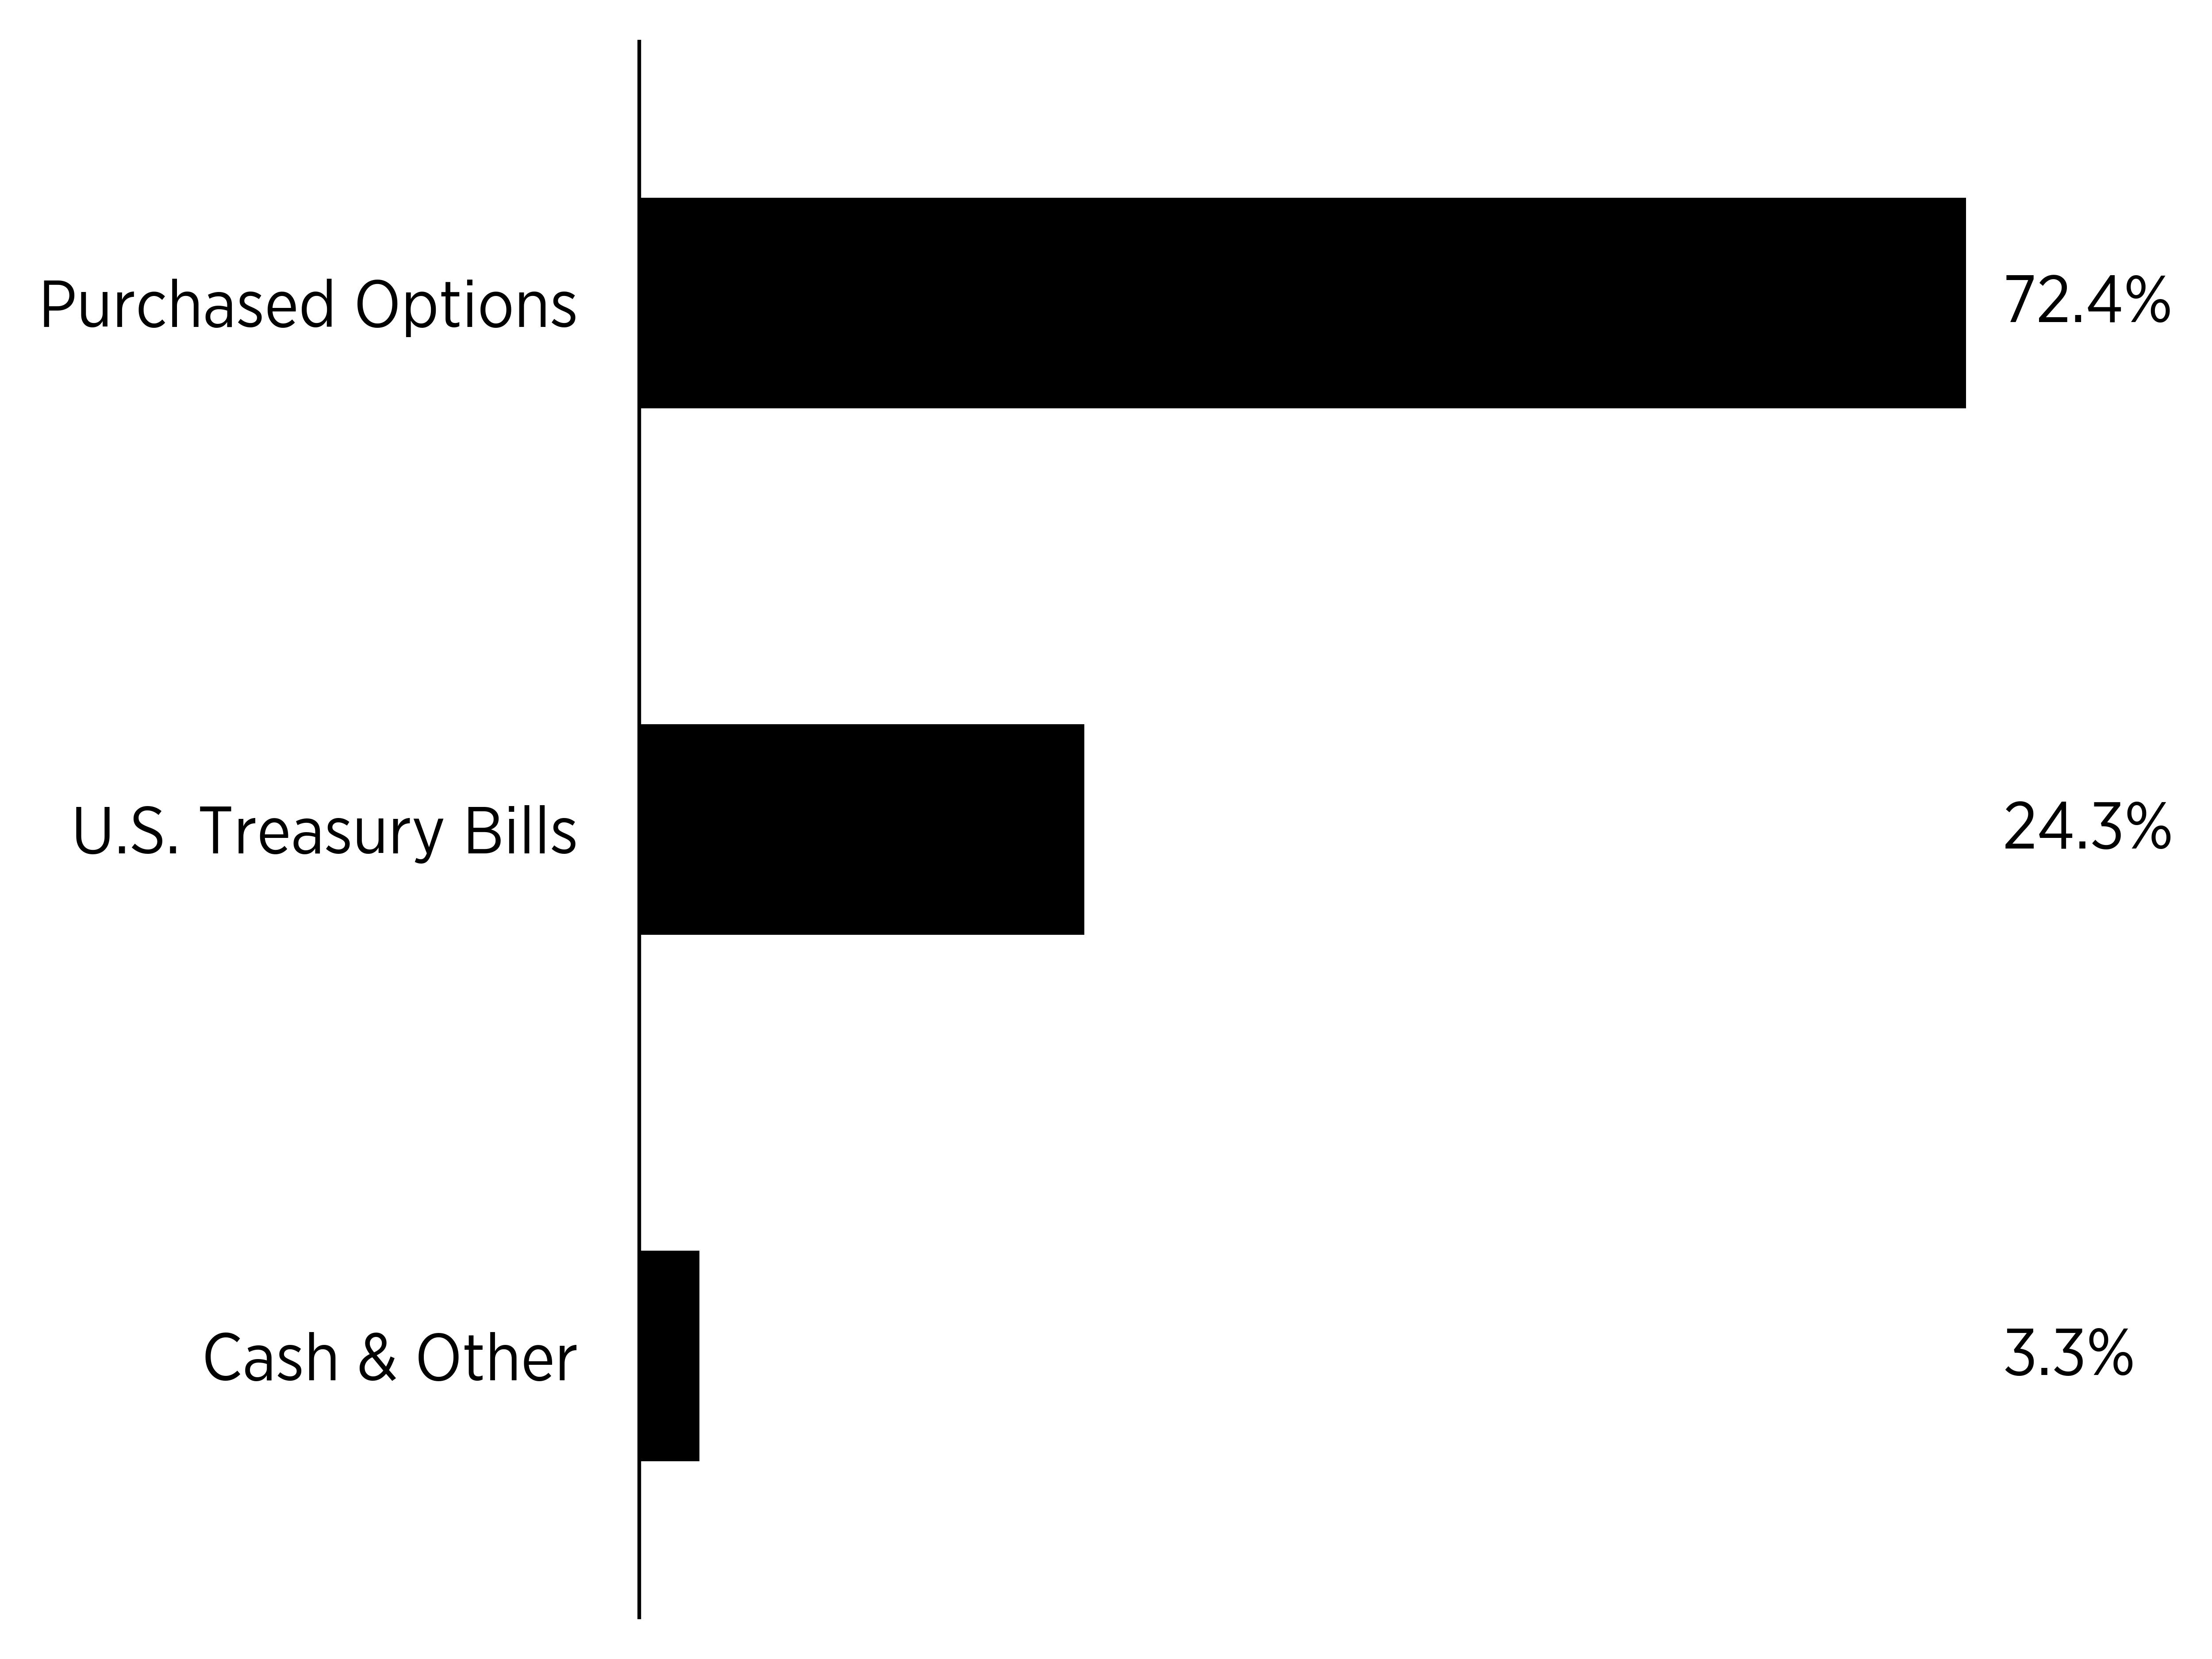
2.    Portfolio Composition: As of April 30, 2026, the Fund’s holdings included a significant allocation to a State Street SPDR S&P 500 ETF call option which comprised over 100% of the portfolio’s weight due to leverage.  The Fund also utilizes SPY put options as a hedge against broad market declines. These put positions are actively managed and rolled higher in strike price during periods of market appreciation, with the objective of limiting drawdowns to no more than 10% over any rolling 12-month period. Additionally, the Fund held various U.S. Treasury securities and cash equivalents, which provided income and helped manage risk.

3.    Risk-Adjusted Metrics: The Fund’s Sharpe ratio as of April 30, 2026, was 1.48, indicating a favorable return relative to its risk.  Other metrics, such as the Sortino ratio of 1.47 and Omega ratio of 1.28, further suggest that the Fund managed to achieve returns with controlled downside risk.

In summary, the Fund’s performance during the fiscal year was shaped by strategic options positioning, macroeconomic factors, and a diversified portfolio aimed at balancing growth and risk mitigation.

Performance Past Does Not Indicate Future [Text] The Fund's past performance is not a good indicator of how the Fund will perform in the future.
Line Graph [Table Text Block]

Cumulative Performance

(Initial Investment of $10,000)

Date
ZEGA Buy and Hedge ETF - $12,767
Bloomberg U.S. Aggregate Bond Index - $9,938
S&P 500® Total Return Index - $17,796
7/6/2021
10000
10000
10000
7/31/2021
10035
10063
10127
8/31/2021
10252
10044
10434
9/30/2021
9941
9957
9949
10/31/2021
10340
9954
10646
11/30/2021
10274
9983
10572
12/31/2021
10657
9958
11046
1/31/2022
10093
9743
10475
2/28/2022
9806
9635
10161
3/31/2022
10048
9367
10538
4/30/2022
9299
9011
9619
5/31/2022
9245
9069
9637
6/30/2022
8487
8927
8842
7/31/2022
8999
9145
9657
8/31/2022
8693
8887
9263
9/30/2022
8245
8503
8410
10/31/2022
8622
8393
9091
11/30/2022
8889
8701
9599
12/31/2022
8306
8662
9046
1/31/2023
8673
8929
9614
2/28/2023
8423
8698
9380
3/31/2023
8617
8919
9724
4/30/2023
8678
8973
9876
5/31/2023
8709
8875
9919
6/30/2023
9150
8843
10574
7/31/2023
9423
8837
10914
8/31/2023
9301
8781
10740
9/30/2023
8927
8558
10228
10/31/2023
8711
8423
10013
11/30/2023
9230
8804
10927
12/31/2023
9396
9141
11424
1/31/2024
9470
9116
11616
2/29/2024
9765
8987
12236
3/31/2024
10055
9070
12629
4/30/2024
9683
8841
12114
5/31/2024
10112
8991
12714
6/30/2024
10440
9076
13171
7/31/2024
10525
9288
13331
8/31/2024
10707
9422
13654
9/30/2024
10916
9548
13946
10/31/2024
10832
9311
13819
11/30/2024
11368
9409
14631
12/31/2024
11065
9255
14282
1/31/2025
11294
9305
14679
2/28/2025
11147
9509
14488
3/31/2025
10582
9513
13672
4/30/2025
10625
9550
13579
5/31/2025
11150
9482
14434
6/30/2025
11621
9628
15168
7/31/2025
11844
9602
15508
8/31/2025
12018
9717
15822
9/30/2025
12402
9823
16400
10/31/2025
12656
9884
16784
11/30/2025
12626
9946
16825
12/31/2025
12611
9931
16835
1/31/2026
12742
9942
17079
2/28/2026
12602
10105
16950
3/31/2026
11885
9927
16106
4/30/2026
12767
9938
17796
line
Average Annual Return [Table Text Block]

Annual Performance

Average Annual Returns for the
Periods Ended April 30, 2026
1 Year
Inception
(7/6/2021)
ZEGA Buy and Hedge ETF
20.15%
5.20%
Bloomberg U.S. Aggregate Bond Index
4.06%
-0.13%
S&P 500® Total Return Index
31.05%
12.71%
Performance Inception Date Jul. 06, 2021
No Deduction of Taxes [Text Block] The graph and table do not reflect the deduction of taxes that a shareholder would pay on fund distributions or redemption of fund shares.
Material Change Description [Text Block] This is a summary of certain changes to the Fund. For more complete information, you may review the Fund's prospectus.
Material Change Date Aug. 01, 2025
Updated Performance Information Location [Text Block] Visit www.zegaetfs.com/zhdg-zega-buy-hedge-etf/ for more recent performance information.
Net Assets $ 34,183,000
Holdings Count | Holdings 9
Advisory Fees Paid, Amount $ 295,240
Investment Company, Portfolio Turnover 106.00%
Additional Fund Statistics [Text Block]

Key Fund Statistics

(as of April 30, 2026)

Fund Size (Thousands)
$34,183
Number of Holdings
9
Total Advisory Fee Paid
$295,240
Portfolio Turnover Rate
106%
Holdings [Text Block]

What did the Fund invest in?

(as of April 30, 2026)

Sector Breakdown

(% of total net assets)

sector
%
Purchased Options
72.4%
U.S. Treasury Bills
24.3%
Cash & Other
3.3%
bar


Largest Holdings [Text Block]
Top Holdings
(% of total net assets)
State Street SPDR S&P 500 ETF Trust,
Expiration: 12/31/2026; Exercise Price: $220.01
71.9
U.S. Treasury Bill, 7/9/2026, 3.63%
8.5
U.S. Treasury Bill, 9/3/2026, 3.64%
6.4
U.S. Treasury Bill, 8/6/2026, 3.63%
5.5
U.S. Treasury Bill, 6/11/2026, 3.57%
3.9
State Street SPDR S&P 500 ETF Trust,
Expiration: 6/30/2026; Exercise Price: $640.00
0.4
State Street SPDR S&P 500 ETF Trust,
Expiration: 9/18/2026; Exercise Price: $615.00
0.2
Material Fund Change [Text Block]

How has the Fund Changed?

Effective August 1, 2025, U.S. Bancorp Fund Services, LLC, doing business as Global Fund Services, no longer serves as the Sub-Administrator for each series of Tidal Trust I, including the Fund.