Shareholder Report
Apr. 30, 2026
USD ($)
$ / shares
May 31, 2024
|
Fund Name
|
Costs of a $10,000 investment
|
Costs paid as a percentage of a $10,000 investment
|
|
F/m Emerald Special Situations ETF
|
$142
|
0.99%
|
WHAT WERE THE FUND COSTS FOR THE PAST YEAR? (based on a hypothetical $10,000 investment)
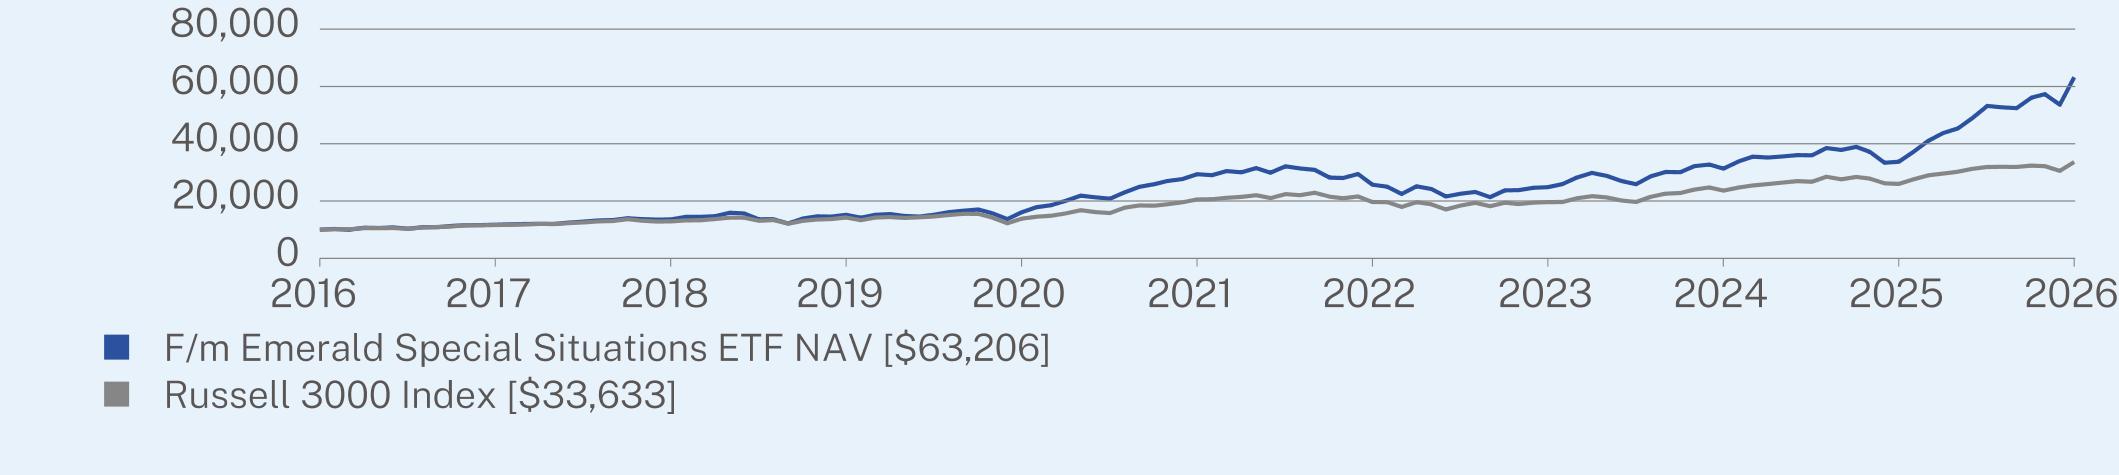
HOW DID THE FUND PERFORM LAST YEAR AND WHAT AFFECTED ITS PERFORMANCE?
The Fund generated a trailing 12 month return of 87.47% at NAV, materially outperforming the benchmark Russell 3000 return of 29.41%.
The reported performance of the Fund is comprised of two distinct periods: pre-10/6/25, and post-10/6/25. Prior to 10/6/25, performance was driven by the Emerald Insights Fund (the “Insights Fund”), an all-cap mutual fund representing a “best-ideas” strategy generated by the fundamental, bottom-up investment process of Emerald Mutual Fund Advisers Trust (“Emerald”). On 10/6/25, the Insights Fund reorganized into its current form, the F/m Emerald Special Situations ETF, a concentrated, market-cap agnostic ETF focused on companies with idiosyncratic return drivers. While the Insights Fund was benchmark aware, the Fund does not cover larger benchmark positions unless they exhibit characteristics that would qualify them for the portfolio, lessening benchmark correlation, highlighting Emerald’s research-driven process.
WHAT FACTORS INFLUENCED PERFORMANCE?
Prior to the transition, the Fund materially outpaced the Russell 3000 through a combination of stock selection and sector allocation. AI ecosystem beneficiaries, including exposure to the “Magnificent 7,” largely dictated by the benchmark, provided significant contribution to returns. Beyond mega-cap technology holdings, semiconductor exposure was meaningful as AI infrastructure demand accelerated, while the portfolio also captured the AI theme across the supply chain through optical components and telecommunications equipment, areas tied directly to hyperscaler datacenter buildouts. Energy equipment and services also outperformed, with power infrastructure and oilfield services names rising on tightening utilization and a broader re-rating of the energy services cycle. Industrials allocation contributed across defense and aerospace and engineering and contracting services, while healthcare added meaningful outperformance. Across these sectors, stock selection was the primary driver of excess return, with allocation effect providing a secondary but meaningful contribution.
Post the transition, outperformance continued with stock selection being the primary driver of outperformance. The prior secular themes across AI infrastructure, power, healthcare, and industrials remained central to portfolio positioning. However, by design, there was a near-elimination of Magnificent 7 and mega-cap technology exposure, which freed portfolio capacity for deployment into other, less-followed, non-benchmark correlated holdings. The timing of this reduction proved beneficial as many of the mega-cap names struggled during the latter period.
For the year, the three largest sector-level contributors were Industrials, Technology, and Telecommunications, with Energy and Health Care rounding out a top five that collectively account for most of the Fund’s outperformance. Stock selection drove the majority of outperformance, with allocation a secondary driver. Partially offsetting these gains - Consumer Discretionary, Basic Materials, and Financials detracted from relative performance. In aggregate, these detractors were contained relative to the breadth of outperformance generated elsewhere in the portfolio.
The breadth and composition of the outperformance without some of the largest benchmark constituents helps demonstrate the fund operates as a genuinely active, benchmark-agnostic vehicle. Contribution from stock selection exceeded the contribution from sector allocation and spanned the majority of sectors in the portfolio. The result is a return profile that we believe is largely uncorrelated with the structure of the Russell 3000.
|
|
1 Year
|
5 Year
|
10 Year
|
|
F/m Emerald Special Situations ETF NAV
|
87.47
|
16.57
|
20.25
|
|
Russell 3000 Index
|
29.41
|
10.34
|
12.90
|
ANNUAL AVERAGE TOTAL RETURN (%)
Visit https://www.emeraldetfs.com/spit for more recent performance information.
|
Net Assets
|
$29,246,458
|
|
Number of Holdings
|
49
|
|
Net Advisory Fee
|
$103,102
|
|
Portfolio Turnover
|
111%
|
KEY FUND STATISTICS (as of April 30, 2026)
WHAT DID THE FUND INVEST IN? (as of April 30, 2026)
|
Top Sectors
|
(% of Net Assets)
|
|
Industrials
|
23.0%
|
|
Health Care
|
20.2%
|
|
Technology
|
17.7%
|
|
Energy
|
13.2%
|
|
Consumer Discretionary
|
10.4%
|
|
Telecommunications
|
3.7%
|
|
Financials
|
3.4%
|
|
Utilities
|
2.8%
|
|
Basic Materials
|
1.7%
|
|
Consumer Staples
|
1.4%
|
|
Top 10 Holdings
|
(% of Net Assets)
|
|
Credo Technology Group Holding Ltd.
|
6.4%
|
|
TETRA Technologies, Inc.
|
4.4%
|
|
Bloom Energy Corp.
|
3.8%
|
|
Solaris Energy Infrastructure, Inc.
|
3.4%
|
|
American Superconductor Corp.
|
3.3%
|
|
Cardinal Infrastructure Group, Inc.
|
3.1%
|
|
Nektar Therapeutics
|
3.1%
|
|
Amazon.com, Inc.
|
3.0%
|
|
Guardant Health, Inc.
|
3.0%
|
|
Excelerate Energy, Inc.
|
2.8%
|