Shareholder Report
Apr. 30, 2026
USD ($)
Holding
What were the Fund costs for the last year?
(based on a hypothetical $10,000 investment)
| Fund name | Costs of a $10,000 investment |
Costs paid as a percentage of a $10,000 investment |
| $43 | 0.38% |
How did the Fund perform last year?
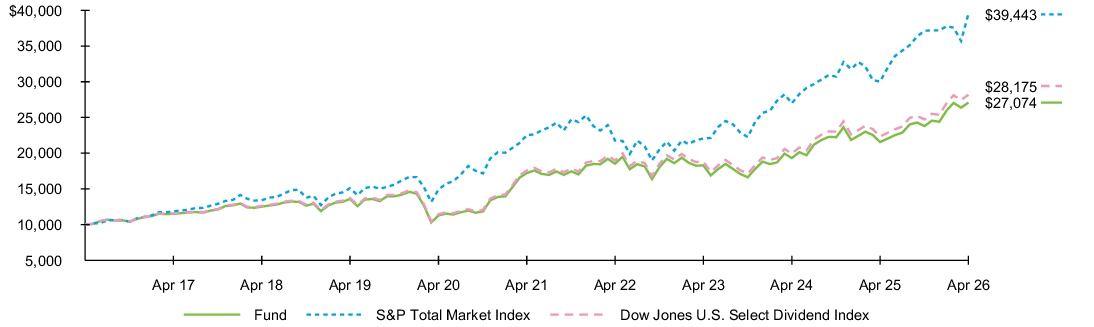
- For the reporting period ended April 30, 2026, the Fund returned 25.57%.
- For the same period, the S&P Total Market Index returned 31.37% and the Dow Jones U.S. Select Dividend Index returned 26.12%.
What contributed to performance?
The financials sector was the largest contributor to the Fund’s return during the reporting period. Both regional and diversified banking firms advanced on improving investor sentiment, resilient credit conditions, stabilizing deposit trends, and a more favorable interest rate environment. Improving market conditions, higher assets under management, and stronger investor sentiment toward capital markets and wealth management businesses benefited the asset management and custody banks segment. Within the utilities sector, electric utilities companies gained on increasing power demand, ongoing grid modernization and electrification investment, and growing electricity needs tied to data center and artificial intelligence related infrastructure development. Meanwhile, the energy sector benefited from resilient oil and fuel demand, and as geopolitical tensions in the Middle East pushed the price of oil significantly higher near the end of the reporting period.
What detracted from performance?
There were no significant detractors from the Fund’s return during the reporting period.
The views expressed reflect the opinions of BlackRock as of the date of this report and are subject to change based on changes in market, economic or other conditions. These views are not intended to be a forecast of future events and are no guarantee of future results.
Fund performance
Cumulative performance: May 1, 2016 through April 30, 2026
Initial investment of $10,000
See “Average annual total returns” for additional information on fund performance.
Average annual total returns
| 1 Year | 5 Years | 10 Years | |||
| 25.57 | % | 9.48 | % | 10.47 | % |
| 31.37 | 11.86 | 14.71 | |||
| 26.12 | 9.91 | 10.91 |
Key Fund statistics
| $22,856,482,919 |
| 104 |
| $78,644,176 |
| 23% |
What did the Fund invest in?
(as of April 30, 2026)
Sector allocation
| Sector | Percent of Total Investments(a) |
|
| 24.9 | % | |
| 24.2 | ||
| 13.5 | ||
| 9.1 | ||
| 6.0 | ||
| 6.0 | ||
| 5.8 | ||
| 5.0 | ||
| 3.4 | ||
| 2.1 |
Ten largest holdings
| Security | Percent of Total Investments(a) |
|
| 2.3 | % | |
| 2.2 | ||
| 2.0 | ||
| 1.9 | ||
| 1.8 | ||
| 1.8 | ||
| 1.6 | ||
| 1.5 | ||
| 1.5 | ||
| 1.5 |
| Excludes money market funds. |
Ten largest holdings
| Security | Percent of Total Investments(a) |
|
| 2.3 | % | |
| 2.2 | ||
| 2.0 | ||
| 1.9 | ||
| 1.8 | ||
| 1.8 | ||
| 1.6 | ||
| 1.5 | ||
| 1.5 | ||
| 1.5 |
| Excludes money market funds. |
This report describes changes to the Fund that occurred during the reporting period.
What were the Fund costs for the last year?
(based on a hypothetical $10,000 investment)
| Fund name | Costs of a $10,000 investment |
Costs paid as a percentage of a $10,000 investment |
| $3 | 0.03% |
How did the Fund perform last year?
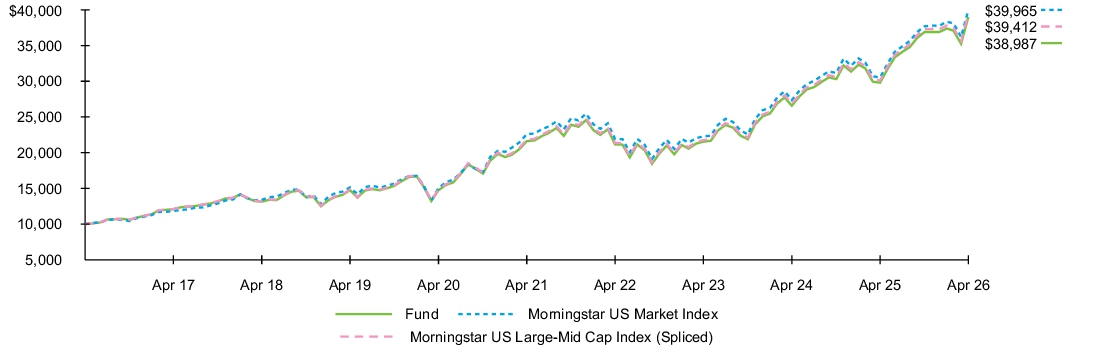
- For the reporting period ended April 30, 2026, the Fund returned 30.83%.
- For the same period, the Morningstar US Market Index returned 30.96% and the Morningstar US Large-Mid Cap Index (Spliced) returned 30.90%.
What contributed to performance?
Information technology stocks were the largest contributors to the Fund’s return during the reporting period. Semiconductor and semiconductor equipment firms were driven by robust demand for artificial intelligence ("AI"), cloud computing, and data center infrastructure. Makers of high-performance AI chips were standout performers, as their products have become essential infrastructure for cloud providers and businesses adopting AI at scale. Technology hardware and equipment stocks also contributed, led by a consumer facing technology company, which gained amid resilient consumer demand and growing services revenue, while specialized component makers benefited from surging AI data center buildout. Further, an interactive media and services company in the communication sector benefited from accelerating ad revenue growth, aided by AI-driven search expansion, alongside expanding cloud services. Industrials stocks added to performance, benefiting from U.S. reshoring initiatives, infrastructure investment, and solid aerospace and defense demand amid ongoing geopolitical uncertainty.
What detracted from performance?
There were no significant detractors from the Fund’s performance during the reporting period.
The views expressed reflect the opinions of BlackRock as of the date of this report and are subject to change based on changes in market, economic or other conditions. These views are not intended to be a forecast of future events and are no guarantee of future results.
Fund performance
Cumulative performance: May 1, 2016 through April 30, 2026
Initial investment of $10,000
See “Average annual total returns” for additional information on fund performance.
Average annual total returns
| 1 Year | 5 Years | 10 Years | |||
| 30.83 | % | 12.52 | % | 14.58 | % |
| 30.96 | 12.08 | 14.86 | |||
| 30.90 | 12.54 | 14.70 |
Key Fund statistics
| $1,223,224,164 |
| 539 |
| $335,495 |
| 8% |
What did the Fund invest in?
(as of April 30, 2026)
Sector allocation
| Sector | Percent of Total Investments(a) |
|
| 34.8 | % | |
| 11.9 | ||
| 11.2 | ||
| 10.0 | ||
| 9.2 | ||
| 8.6 | ||
| 4.8 | ||
| 3.5 | ||
| 2.3 | ||
| 1.9 | ||
| 1.8 |
Ten largest holdings
| Security | Percent of Total Investments(a) |
|
| 7.5 | % | |
| 6.3 | ||
| 4.8 | ||
| 4.2 | ||
| 3.6 | ||
| 3.1 | ||
| 3.1 | ||
| 2.1 | ||
| 1.7 | ||
| 1.4 |
| Excludes money market funds. |
Ten largest holdings
| Security | Percent of Total Investments(a) |
|
| 7.5 | % | |
| 6.3 | ||
| 4.8 | ||
| 4.2 | ||
| 3.6 | ||
| 3.1 | ||
| 3.1 | ||
| 2.1 | ||
| 1.7 | ||
| 1.4 |
| Excludes money market funds. |
Material fund changes
This is a summary of certain changes to the Fund since April 30, 2025. For more complete information, you may review the Fund’s next prospectus, which we expect to be available approximately 120 days after April 30, 2026 at blackrock.com/fundreports or upon request by contacting us at 1-800-iShares (1-800-474-2737).
Effective November 24, 2025, the Fund updated its investment policy to indicate that it intends to be “diversified,” as defined in the Investment Company Act of 1940, in approximately the same proportion as its Underlying Index is diversified. Therefore, shareholder approval will not be sought if the Fund crosses from diversified to non‑diversified status due solely to a change in the relative market capitalization or index weighting of the constituents of its Underlying Index.
Effective November 24, 2025, the Fund updated its investment policy to indicate that it intends to be “diversified,” as defined in the Investment Company Act of 1940, in approximately the same proportion as its Underlying Index is diversified. Therefore, shareholder approval will not be sought if the Fund crosses from diversified to non‑diversified status due solely to a change in the relative market capitalization or index weighting of the constituents of its Underlying Index.
This is a summary of certain changes to the Fund since April 30, 2025. For more complete information, you may review the Fund’s next prospectus, which we expect to be available approximately 120 days after April 30, 2026 at blackrock.com/fundreports or upon request by contacting us at 1-800-iShares (1-800-474-2737).
What were the Fund costs for the last year?
(based on a hypothetical $10,000 investment)
| Fund name | Costs of a $10,000 investment |
Costs paid as a percentage of a $10,000 investment |
| $5 | 0.04% |
How did the Fund perform last year?
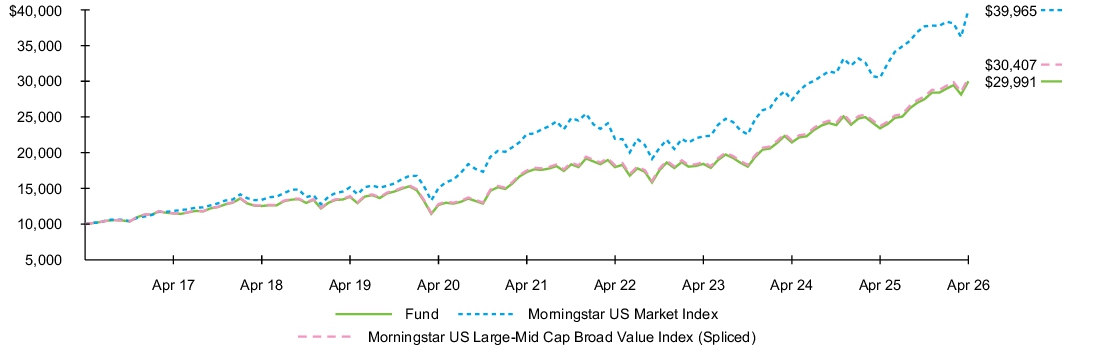
- For the reporting period ended April 30, 2026, the Fund returned 28.10%.
- For the same period, the Morningstar US Market Index returned 30.96% and the Morningstar US Large-Mid Cap Broad Value Index (Spliced) returned 28.15%.
What contributed to performance?
Information technology stocks were the largest contributors to the Fund’s return during the reporting period. Stocks in the semiconductors segment advanced as sustained artificial intelligence (“AI”)-related data center investment supported demand for high-bandwidth memory chips and advanced semiconductor manufacturing capacity. In the technology hardware, storage, and peripherals segment, a consumer-focused technology hardware company gained on continued demand for its smartphone lineup, while expanding software and subscription services revenue supported profitability and margins. Within the communication services sector, an interactive media and services company advanced on accelerating advertising revenue growth, driven in part by AI-enhanced search capabilities and continued cloud services expansion. Industrials stocks also added to performance, benefiting from U.S. reshoring initiatives, infrastructure investment, and solid aerospace and defense demand amid ongoing geopolitical uncertainty.
What detracted from performance?
During the reporting period, software and services stocks detracted from the Fund’s return, amid concerns over elevated AI infrastructure spending and uncertainty around the timing of investment returns, which pressured valuations.
The views expressed reflect the opinions of BlackRock as of the date of this report and are subject to change based on changes in market, economic or other conditions. These views are not intended to be a forecast of future events and are no guarantee of future results.
Fund performance
Cumulative performance: May 1, 2016 through April 30, 2026
Initial investment of $10,000
See “Average annual total returns” for additional information on fund performance.
Average annual total returns
| 1 Year | 5 Years | 10 Years | |||
| 28.10 | % | 11.65 | % | 11.61 | % |
| 30.96 | 12.08 | 14.86 | |||
| 28.15 | 11.68 | 11.76 |
Key Fund statistics
| $1,240,656,121 |
| 385 |
| $447,849 |
| 30% |
What did the Fund invest in?
(as of April 30, 2026)
Sector allocation
| Sector | Percent of Total Investments(a) |
|
| 20.6 | % | |
| 17.5 | ||
| 11.6 | ||
| 9.6 | ||
| 9.5 | ||
| 8.3 | ||
| 7.9 | ||
| 6.5 | ||
| 3.8 | ||
| 2.6 | ||
| 2.1 |
Ten largest holdings
| Security | Percent of Total Investments(a) |
|
| 6.3 | % | |
| 5.2 | ||
| 2.7 | ||
| 2.7 | ||
| 2.6 | ||
| 2.2 | ||
| 2.0 | ||
| 1.9 | ||
| 1.7 | ||
| 1.5 |
| Excludes money market funds. |
Ten largest holdings
| Security | Percent of Total Investments(a) |
|
| 6.3 | % | |
| 5.2 | ||
| 2.7 | ||
| 2.7 | ||
| 2.6 | ||
| 2.2 | ||
| 2.0 | ||
| 1.9 | ||
| 1.7 | ||
| 1.5 |
| Excludes money market funds. |
What were the Fund costs for the last year?
(based on a hypothetical $10,000 investment)
| Fund name | Costs of a $10,000 investment |
Costs paid as a percentage of a $10,000 investment |
| $7 | 0.06% |
How did the Fund perform last year?
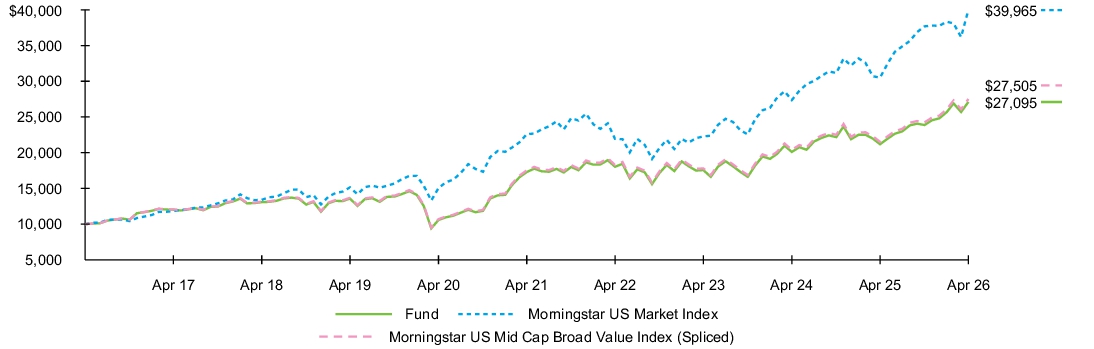
- For the reporting period ended April 30, 2026, the Fund returned 27.87%.
- For the same period, the Morningstar US Market Index returned 30.96% and the Morningstar US Mid Cap Broad Value Index (Spliced) returned 27.88%.
What contributed to performance?
Mid-cap value-oriented energy stocks were the largest contributors to the Fund’s return during the reporting period. Companies across the energy value chain benefited from steady U.S. oil production growth and resilient demand, and higher oil prices late in the reporting period amid renewed geopolitical tensions in the Middle East that heightened supply concerns. In the information technology sector, technology hardware and storage companies gained due to improving cloud and artificial intelligence (“AI”)-related infrastructure demand, alongside a recovery in enterprise and data center spending trends. Additionally, stocks in the semiconductors and semiconductor equipment subsector advanced due to improving sentiment toward automotive, industrial, and AI-related chip demand. Financial stocks were supported by stable credit conditions, improving capital markets activity, and solid client asset flows at banking and asset servicing institutions.
What detracted from performance?
During the reporting period, there were no significant detractors from the Fund’s return.
The views expressed reflect the opinions of BlackRock as of the date of this report and are subject to change based on changes in market, economic or other conditions. These views are not intended to be a forecast of future events and are no guarantee of future results.
Fund performance
Cumulative performance: May 1, 2016 through April 30, 2026
Initial investment of $10,000
See “Average annual total returns” for additional information on fund performance.
Average annual total returns
| 1 Year | 5 Years | 10 Years | |||
| 27.87 | % | 9.40 | % | 10.48 | % |
| 30.96 | 12.08 | 14.86 | |||
| 27.88 | 9.43 | 10.65 |
Key Fund statistics
| $1,033,018,780 |
| 279 |
| $511,492 |
| 40% |
What did the Fund invest in?
(as of April 30, 2026)
Sector allocation
| Sector | Percent of Total Investments(a) |
|
| 16.8 | % | |
| 12.6 | ||
| 12.5 | ||
| 10.0 | ||
| 8.9 | ||
| 8.5 | ||
| 8.1 | ||
| 7.3 | ||
| 7.2 | ||
| 5.6 | ||
| 2.5 |
Ten largest holdings
| Security | Percent of Total Investments(a) |
|
| 1.6 | % | |
| 1.3 | ||
| 1.2 | ||
| 1.2 | ||
| 1.2 | ||
| 1.2 | ||
| 1.2 | ||
| 1.1 | ||
| 1.1 | ||
| 1.1 |
| Excludes money market funds. |
Ten largest holdings
| Security | Percent of Total Investments(a) |
|
| 1.6 | % | |
| 1.3 | ||
| 1.2 | ||
| 1.2 | ||
| 1.2 | ||
| 1.2 | ||
| 1.2 | ||
| 1.1 | ||
| 1.1 | ||
| 1.1 |
| Excludes money market funds. |
What were the Fund costs for the last year?
(based on a hypothetical $10,000 investment)
| Fund name | Costs of a $10,000 investment |
Costs paid as a percentage of a $10,000 investment |
| $5 | 0.04% |
How did the Fund perform last year?
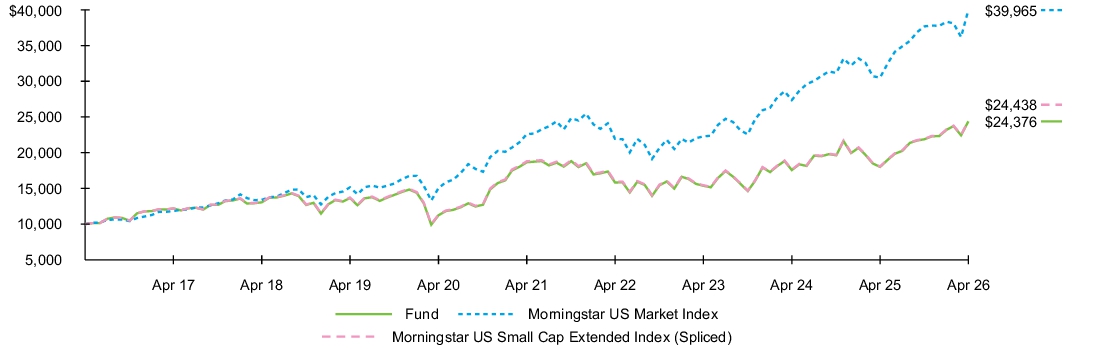
- For the reporting period ended April 30, 2026, the Fund returned 35.32%.
- For the same period, the Morningstar US Market Index returned 30.96% and the Morningstar US Small Cap Extended Index (Spliced) returned 35.23%.
What contributed to performance?
During the reporting period, small-cap industrials stocks contributed the most to the Fund’s performance, driven by U.S. reshoring efforts, infrastructure spending, and robust aerospace and defense demand, amid heightened geopolitical tensions. Machinery companies benefited from factory automation, electrification and artificial intelligence (“AI”) related data center buildouts. In the information technology sector, technology hardware, storage and peripherals companies advanced as accelerating AI-related infrastructure investment and increasing data center network demand supported spending on optical connectivity, storage, and networking solutions. Meanwhile, semiconductor stocks advanced on continued AI-related investment and improving demand trends. Within the financials sector, regional banks were supported by resilient credit conditions, stabilizing deposit trends, and improving investor sentiment toward the banking sector. Financial services and capital markets companies also advanced, driven by steady capital markets activity, and improving demand for advisory and wealth management services.
What detracted from performance?
There were no significant detractors from the Fund’s return during the reporting period.
The views expressed reflect the opinions of BlackRock as of the date of this report and are subject to change based on changes in market, economic or other conditions. These views are not intended to be a forecast of future events and are no guarantee of future results.
Fund performance
Cumulative performance: May 1, 2016 through April 30, 2026
Initial investment of $10,000
See “Average annual total returns” for additional information on fund performance.
Average annual total returns
| 1 Year | 5 Years | 10 Years | |||
| 35.32 | % | 5.49 | % | 9.32 | % |
| 30.96 | 12.08 | 14.86 | |||
| 35.23 | 5.39 | 9.35 |
Key Fund statistics
| $268,767,923 |
| 1,554 |
| $99,325 |
| 30% |
What did the Fund invest in?
(as of April 30, 2026)
Sector allocation
| Sector | Percent of Total Investments(a) |
|
| 19.5 | % | |
| 17.0 | ||
| 13.4 | ||
| 13.1 | ||
| 11.5 | ||
| 7.1 | ||
| 5.5 | ||
| 4.8 | ||
| 3.1 | ||
| 2.5 | ||
| 2.5 |
Ten largest holdings
| Security | Percent of Total Investments(a) |
|
| 1.1 | % | |
| 0.4 | ||
| 0.4 | ||
| 0.3 | ||
| 0.3 | ||
| 0.3 | ||
| 0.3 | ||
| 0.3 | ||
| 0.3 | ||
| 0.3 |
| Excludes money market funds. |
Ten largest holdings
| Security | Percent of Total Investments(a) |
|
| 1.1 | % | |
| 0.4 | ||
| 0.4 | ||
| 0.3 | ||
| 0.3 | ||
| 0.3 | ||
| 0.3 | ||
| 0.3 | ||
| 0.3 | ||
| 0.3 |
| Excludes money market funds. |
What were the Fund costs for the last year?
(based on a hypothetical $10,000 investment)
| Fund name | Costs of a $10,000 investment |
Costs paid as a percentage of a $10,000 investment |
| $9 | 0.08% |
How did the Fund perform last year?
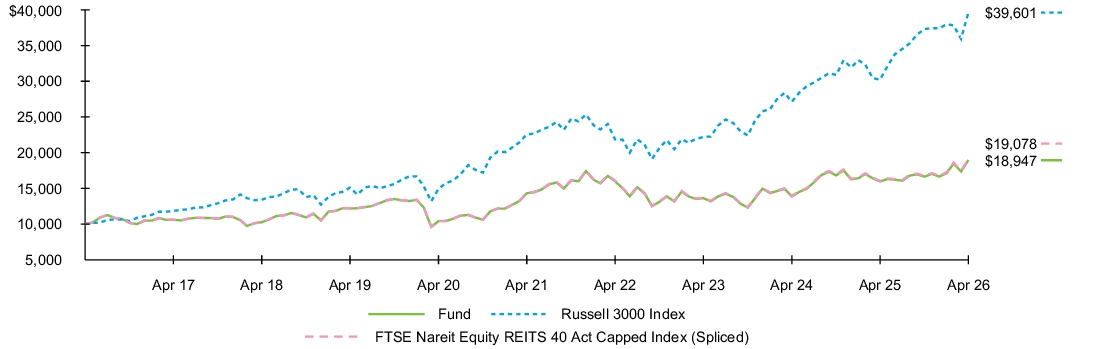
- For the reporting period ended April 30, 2026, the Fund returned 18.67%.
- For the same period, the Russell 3000 Index returned 31.01% and the FTSE Nareit Equity REITS 40 Act Capped Index (Spliced) returned 18.79%.
What contributed to performance?
During the reporting period, healthcare real estate investment trusts (“REITs”) contributed the most to the Fund’s return, driven by strong demand for senior housing as aging demographics and limited new supply supported occupancy gains, rental rate growth, and improving operating fundamentals. Retail REITs also performed well, benefiting from resilient consumer spending, improving tenant demand, and strong occupancy trends that supported rental income growth and leasing activity at high-quality retail properties. Meanwhile, industrial REITs advanced as demand for warehouse and logistics space was supported by e-commerce growth, supply-chain reshoring initiatives, and rising investment in artificial intelligence-related infrastructure and data center development. Rising cloud computing and artificial intelligence-related demand supported leasing activity, pricing power, and continued investment in data center REITs.
What detracted from performance?
There were no significant detractors from the Fund’s return during the reporting period.
The views expressed reflect the opinions of BlackRock as of the date of this report and are subject to change based on changes in market, economic or other conditions. These views are not intended to be a forecast of future events and are no guarantee of future results.
Fund performance
Cumulative performance: May 1, 2016 through April 30, 2026
Initial investment of $10,000
See “Average annual total returns” for additional information on fund performance.
Average annual total returns
| 1 Year | 5 Years | 10 Years | |||
| 18.67 | % | 5.77 | % | 6.60 | % |
| 31.01 | 11.91 | 14.75 | |||
| 18.79 | 5.85 | 6.67 |
Key Fund statistics
| $3,789,227,044 |
| 129 |
| $2,569,331 |
| 12% |
What did the Fund invest in?
(as of April 30, 2026)
Industry allocation
| Industry | Percent of Total Investments(a) |
|
| 28.3 | % | |
| 18.2 | ||
| 17.5 | ||
| 14.7 | ||
| 12.1 | ||
| 3.4 | ||
| 3.1 | ||
| 2.7 |
Ten largest holdings
| Security | Percent of Total Investments(a) |
|
| 8.3 | % | |
| 7.5 | ||
| 6.5 | ||
| 4.5 | ||
| 4.4 | ||
| 4.2 | ||
| 4.0 | ||
| 3.6 | ||
| 3.2 | ||
| 2.7 |
| Excludes money market funds. |
Ten largest holdings
| Security | Percent of Total Investments(a) |
|
| 8.3 | % | |
| 7.5 | ||
| 6.5 | ||
| 4.5 | ||
| 4.4 | ||
| 4.2 | ||
| 4.0 | ||
| 3.6 | ||
| 3.2 | ||
| 2.7 |
| Excludes money market funds. |
What were the Fund costs for the last year?
(based on a hypothetical $10,000 investment)
| Fund name | Costs of a $10,000 investment |
Costs paid as a percentage of a $10,000 investment |
| $9 | 0.08% |
How did the Fund perform last year?
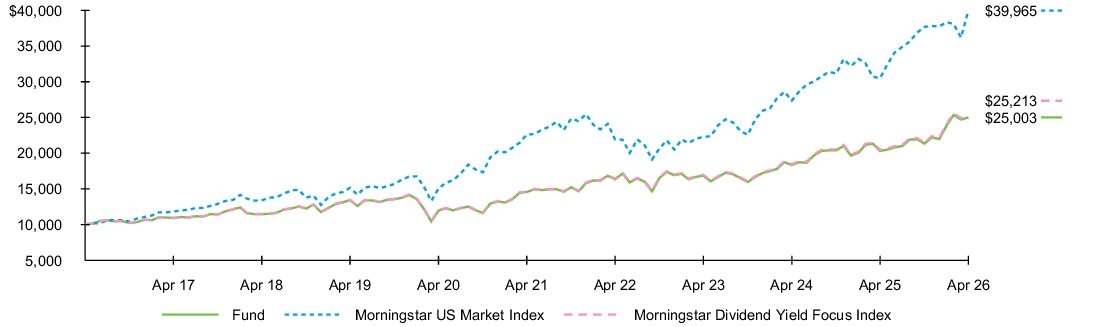
- For the reporting period ended April 30, 2026, the Fund returned 23.11%.
- For the same period, the Morningstar US Market Index returned 30.96% and the Morningstar Dividend Yield Focus Index returned 23.26%.
What contributed to performance?
The energy sector contributed to the Fund’s return during the reporting period, as oil prices experienced strong gains due to Middle East tensions and supply concerns at the Strait of Hormuz. Integrated oil and gas names gained amid resilient oil prices, disciplined capital spending, and strong cash flow generation. Oil and gas exploration and production names also advanced on stronger crude oil and natural gas prices. Biotechnology and pharmaceutical companies within the healthcare sector also contributed, benefiting from resilient demand for branded therapeutics and continued innovation across immunology and oncology portfolios. Additionally, as large pharmaceutical firms faced upcoming patent expirations on key drugs, many pursued acquisitions of emerging biotechnology companies to strengthen their development pipelines. The information technology sector increased on continued enterprise networking investment, resilient demand for analog and connectivity chips, and growing support from artificial intelligence driven infrastructure buildouts.
What detracted from performance?
There were no significant detractors from the Fund’s return during the reporting period.
The views expressed reflect the opinions of BlackRock as of the date of this report and are subject to change based on changes in market, economic or other conditions. These views are not intended to be a forecast of future events and are no guarantee of future results.
Fund performance
Cumulative performance: May 1, 2016 through April 30, 2026
Initial investment of $10,000
See “Average annual total returns” for additional information on fund performance.
Average annual total returns
| 1 Year | 5 Years | 10 Years | |||
| 23.11 | % | 11.41 | % | 9.60 | % |
| 30.96 | 12.08 | 14.86 | |||
| 23.26 | 11.51 | 9.69 |
Key Fund statistics
| $13,564,565,253 |
| 79 |
| $9,568,649 |
| 65% |
What did the Fund invest in?
(as of April 30, 2026)
Sector allocation
| Sector | Percent of Total Investments(a) |
|
| 24.1 | % | |
| 22.2 | ||
| 16.5 | ||
| 11.0 | ||
| 9.3 | ||
| 7.6 | ||
| 6.1 | ||
| 2.0 | ||
| 1.2 |
Ten largest holdings
| Security | Percent of Total Investments(a) |
|
| 8.4 | % | |
| 6.4 | ||
| 5.7 | ||
| 5.5 | ||
| 4.5 | ||
| 4.2 | ||
| 4.1 | ||
| 3.9 | ||
| 3.8 | ||
| 3.8 |
| Excludes money market funds. |
Ten largest holdings
| Security | Percent of Total Investments(a) |
|
| 8.4 | % | |
| 6.4 | ||
| 5.7 | ||
| 5.5 | ||
| 4.5 | ||
| 4.2 | ||
| 4.1 | ||
| 3.9 | ||
| 3.8 | ||
| 3.8 |
| Excludes money market funds. |
What were the Fund costs for the last year?
(based on a hypothetical $10,000 investment)
| Fund name | Costs of a $10,000 investment |
Costs paid as a percentage of a $10,000 investment |
| $9 | 0.08% |
How did the Fund perform last year?
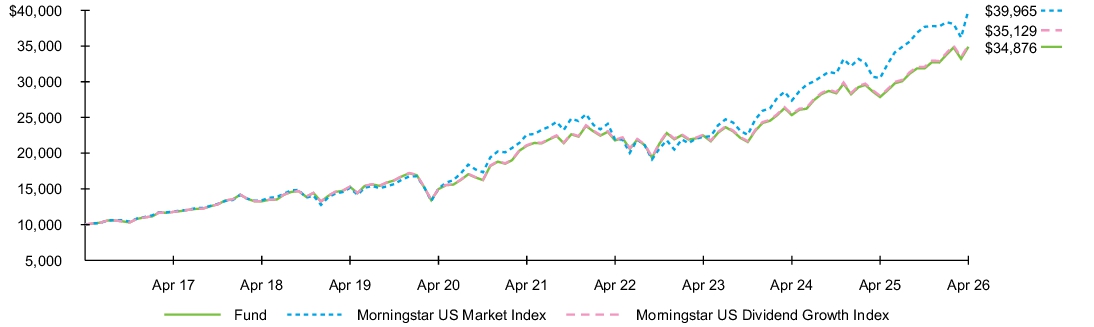
- For the reporting period ended April 30, 2026, the Fund returned 25.16%.
- For the same period, the Morningstar US Market Index returned 30.96% and the Morningstar US Dividend Growth Index returned 25.29%.
What contributed to performance?
During the reporting period, stocks in the information technology sector contributed the most to the Fund’s return. Semiconductors and semiconductor equipment companies benefited from continued artificial intelligence (“AI”)-related infrastructure investment, which supported demand for networking semiconductors, advanced chip manufacturing equipment, and high-performance computing solutions. Technology hardware and equipment stocks advanced on continued enterprise infrastructure spending, and growing demand for AI-enabled networking solutions. Within the financials sector, larger diversified banks gained on resilient economic activity, stable credit conditions, and improving capital markets activity, which supported investment banking, trading, and lending trends. Meanwhile, improved investment banking activity, healthy trading volumes, and continued strength in wealth and asset management businesses benefited investment banking and brokerage firms. The industrials sector contributed amid continued investment in infrastructure, electrification, aerospace and defense, and data center-related end markets.
What detracted from performance?
There were no significant detractors from the Fund’s return during the reporting period.
The views expressed reflect the opinions of BlackRock as of the date of this report and are subject to change based on changes in market, economic or other conditions. These views are not intended to be a forecast of future events and are no guarantee of future results.
Fund performance
Cumulative performance: May 1, 2016 through April 30, 2026
Initial investment of $10,000
See “Average annual total returns” for additional information on fund performance.
Average annual total returns
| 1 Year | 5 Years | 10 Years | |||
| 25.16 | % | 10.63 | % | 13.31 | % |
| 30.96 | 12.08 | 14.86 | |||
| 25.29 | 10.71 | 13.39 |
Key Fund statistics
| $39,700,584,575 |
| 399 |
| $27,893,360 |
| 25% |
What did the Fund invest in?
(as of April 30, 2026)
Sector allocation
| Sector | Percent of Total Investments(a) |
|
| 21.2 | % | |
| 18.5 | ||
| 16.4 | ||
| 11.6 | ||
| 11.5 | ||
| 7.0 | ||
| 5.6 | ||
| 5.5 | ||
| 2.6 | ||
| 0.1 |
Ten largest holdings
| Security | Percent of Total Investments(a) |
|
| 3.3 | % | |
| 3.1 | ||
| 2.9 | ||
| 2.9 | ||
| 2.9 | ||
| 2.7 | ||
| 2.5 | ||
| 2.3 | ||
| 2.1 | ||
| 1.9 |
| Excludes money market funds. |
Ten largest holdings
| Security | Percent of Total Investments(a) |
|
| 3.3 | % | |
| 3.1 | ||
| 2.9 | ||
| 2.9 | ||
| 2.9 | ||
| 2.7 | ||
| 2.5 | ||
| 2.3 | ||
| 2.1 | ||
| 1.9 |
| Excludes money market funds. |
What were the Fund costs for the last year?
(based on a hypothetical $10,000 investment)
| Fund name | Costs of a $10,000 investment |
Costs paid as a percentage of a $10,000 investment |
| $6 | 0.05% |
How did the Fund perform last year?
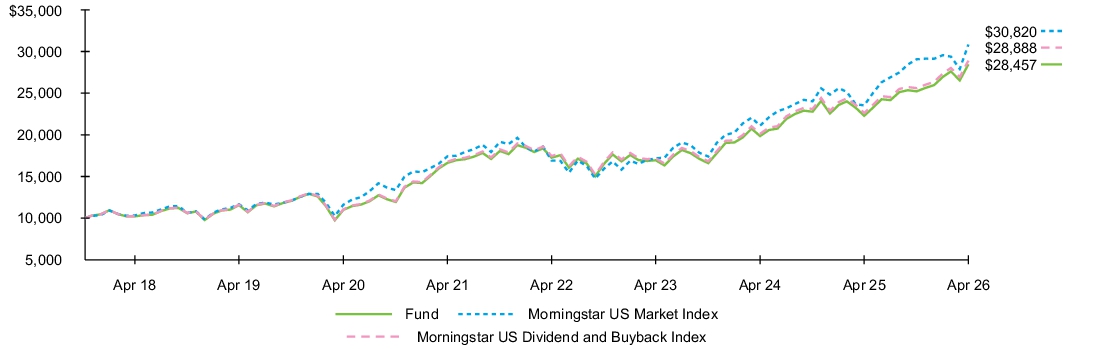
- For the reporting period ended April 30, 2026, the Fund returned 27.69%.
- For the same period, the Morningstar US Market Index returned 30.96% and the Morningstar US Dividend and Buyback Index returned 27.73%.
What contributed to performance?
The information technology sector was the largest contributor to the Fund’s return during the reporting period. Technology hardware and equipment firms advanced on continued enterprise and cloud infrastructure spending, supported by growing demand for networking, storage, and data center solutions tied to artificial intelligence (“AI”)-related investments. Within the semiconductors segment, firms gained on continued investment in AI-related infrastructure and communications equipment. Diversified banks in the financials sector benefited from resilient economic activity, stable credit trends, and improving capital markets activity. The energy sector contributed as oil prices experienced strong gains due to Middle East tensions and supply concerns at the Strait of Hormuz.
What detracted from performance?
IT services firms in the information technology sector detracted from the Fund’s performance during the reporting period. These firms faced negative sentiment due to moderating enterprise spending trends, slower discretionary consulting demand, and investor concerns that generative AI could disrupt portions of traditional IT services and consulting businesses.
The views expressed reflect the opinions of BlackRock as of the date of this report and are subject to change based on changes in market, economic or other conditions. These views are not intended to be a forecast of future events and are no guarantee of future results.
Fund performance
Cumulative performance: November 7, 2017 through April 30, 2026
Initial investment of $10,000
See “Average annual total returns” for additional information on fund performance.
Average annual total returns
| 1 Year | 5 Years | Since Fund Inception |
|||
| 27.69 | % | 11.34 | % | 13.13 | % |
| 30.96 | 12.08 | 14.19 | |||
| 27.73 | 11.46 | 13.33 |
Key Fund statistics
| $1,350,604,267 |
| 405 |
| $545,632 |
| 38% |
What did the Fund invest in?
(as of April 30, 2026)
Sector allocation
| Sector | Percent of Total Investments(a) |
|
| 25.9 | % | |
| 19.0 | ||
| 10.3 | ||
| 9.4 | ||
| 9.3 | ||
| 8.5 | ||
| 5.0 | ||
| 4.7 | ||
| 3.4 | ||
| 2.3 | ||
| 2.2 |
Ten largest holdings
| Security | Percent of Total Investments(a) |
|
| 5.1 | % | |
| 4.5 | ||
| 4.0 | ||
| 3.4 | ||
| 2.7 | ||
| 2.1 | ||
| 2.0 | ||
| 2.0 | ||
| 1.9 | ||
| 1.9 |
| Excludes money market funds. |
Ten largest holdings
| Security | Percent of Total Investments(a) |
|
| 5.1 | % | |
| 4.5 | ||
| 4.0 | ||
| 3.4 | ||
| 2.7 | ||
| 2.1 | ||
| 2.0 | ||
| 2.0 | ||
| 1.9 | ||
| 1.9 |
| Excludes money market funds. |