Shareholder Report
Apr. 30, 2026
USD ($)
Holding
What were the Fund costs for the last year?
(Based on a hypothetical $10,000 investment)
| Share Class Name | Costs of a $10,000 investment | Costs paid as a percentage of a $10,000 investment |
| Investor Class | $143 | 1.30% |
What factors influenced Fund performance during the reporting period?
During the 12-month reporting period ended April 30, 2026, the Fund’s performance relative to the FTSE Global Core Infrastructure 50/50 Index (Net) was affected by sector allocation and security selection. Market conditions reflected rising electricity demand driven by continued data center expansion, supporting the Fund’s positioning in utilities and other infrastructure assets that benefited from accelerating investment and earnings growth. Although geopolitical tensions and trade policy uncertainty contributed to market volatility, the Fund’s diversified exposure across utilities, transportation and midstream infrastructure, supported by inflation-linked and regulated revenue streams, further bolstered relative returns.
The following table outlines the key factors (securities, sectors, industries, market events and/or other characteristics) that materially affected the Fund’s performance during the reporting period.
| Key Factor | Summary | Impact |
| Communications: Americas | Positive stock selection, including an out-of-index position in data center owner Equinix, Inc., and underweight exposure to tower companies | Contributed |
| Transportation: Continental Europe | Strong selection among European toll road and airport stocks, particularly Ferrovial NV and Flughafen Zurich AG | Contributed |
| Utilities: Americas | Positive stock selection, particularly Constellation Energy Corp., The AES Corporation and Entergy Corp. | Contributed |
| Midstream: Americas | Positive stock selection undermined by underweight exposure to one of the best-performing sectors globally | Detracted |
| Transportation: Americas | Positive stock selection partially offset by underweight exposure to North American railroads | Detracted |
Fund Performance
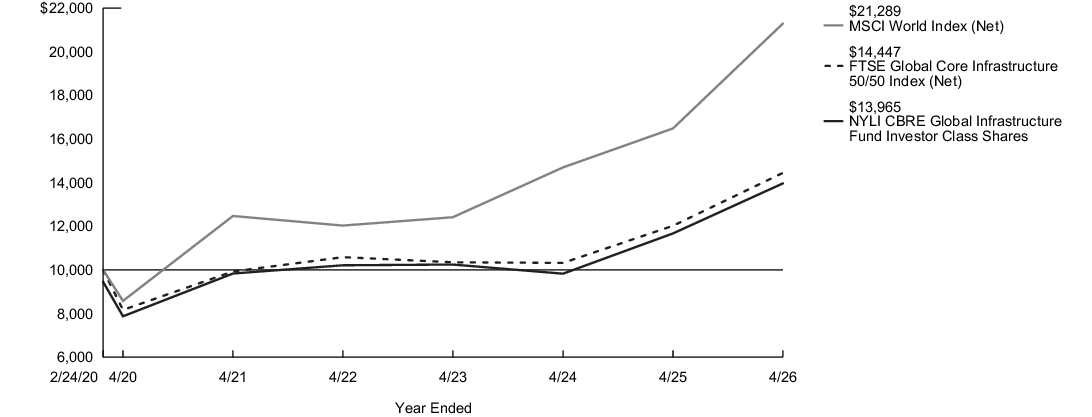
The following graph compares the initial and subsequent account values at the end of each of the most recently completed 10 fiscal years of the Fund (or for the life of the Fund, if shorter). It assumes a $10,000 initial investment at the beginning of the first fiscal year in an appropriate, broad-based securities market index and other indexes, if applicable, for the same period and reflects the deduction of all sales charges, where applicable.
| Average Annual Total Returns for the Year Ended April 30, 2026 | Inception Date |
One Year |
Five Years |
Since Inception |
| Investor Class Shares - Including sales charges | 2/24/2020 | 13.66% | 6.17% | 5.54% |
| Investor Class Shares - Excluding sales charges | 19.64% | 7.27% | 6.51% | |
| MSCI World Index (Net)1 | 29.16% | 11.29% | 12.98% | |
| FTSE Global Core Infrastructure 50/50 Index (Net)2 | 20.18% | 7.79% | 6.12% | |
| Morningstar Infrastructure Category Average3 | 28.63% | 9.66% | 7.40% |
| 1. |
The Fund has selected the MSCI World Index (Net) to represent a broad measure of market performance. The MSCI World Index (Net) is a free float-adjusted market capitalization weighted index that is designed to measure the equity market performance of developed markets. |
| 2. |
The FTSE Global Core Infrastructure 50/50 Index (Net), which is generally representative of the market sectors or types of investments in which the Fund invests, is a market-capitalization-weighted index of worldwide infrastructure and infrastructure-related securities. Constituent weights are adjusted semi-annually according to three broad industry sectors: 50% utilities, 30% transportation, and a 20% mix of other sectors. |
| 3. |
The Morningstar Infrastructure Category Average is representative of funds that invest more than 60% of their assets in stocks of companies engaged in infrastructure activities. Industries considered to be part of the infrastructure sector include: oil & gas midstream; waste management; airports; integrated shipping; railroads; shipping & ports; trucking; engineering & construction; infrastructure operations; and the utilities sector. Results are based on average total returns of similar funds with all dividends and capital gain distributions reinvested. |
Key Fund Statistics
| Fund's net assets | $1,712,810,084 |
| Total number of portfolio holdings | 54 |
| Total advisory fees paid | $10,488,990 |
| Portfolio turnover rate | 79% |
Graphical Representation of Holdings
The tables below show the investment makeup of the Fund; percentages indicated are based on the Fund's net assets.
Top Ten Holdings and/or Issuers*
| Xcel Energy, Inc. | 4.5% |
| Canadian National Railway Co. | 4.5% |
| Enbridge, Inc. | 4.4% |
| Atmos Energy Corp. | 4.1% |
| WEC Energy Group, Inc. | 4.0% |
| PPL Corp. | 3.8% |
| SSE plc | 3.7% |
| American Electric Power Co., Inc. | 3.7% |
| Ferrovial SE | 3.6% |
| Southern Co. (The) | 3.4% |
| * Excluding short-term investments |
Top Countries
| United States | 58.6% |
| Canada | 12.1% |
| United Kingdom | 6.6% |
| Netherlands | 3.6% |
| France | 3.3% |
| Germany | 3.2% |
| Spain | 3.1% |
| Japan | 3.0% |
| Mexico | 2.6% |
| New Zealand | 2.0% |
| Other | 1.9% |
Top Ten Holdings and/or Issuers*
| Xcel Energy, Inc. | 4.5% |
| Canadian National Railway Co. | 4.5% |
| Enbridge, Inc. | 4.4% |
| Atmos Energy Corp. | 4.1% |
| WEC Energy Group, Inc. | 4.0% |
| PPL Corp. | 3.8% |
| SSE plc | 3.7% |
| American Electric Power Co., Inc. | 3.7% |
| Ferrovial SE | 3.6% |
| Southern Co. (The) | 3.4% |
| * Excluding short-term investments |
What were the Fund costs for the last year?
(Based on a hypothetical $10,000 investment)
| Share Class Name | Costs of a $10,000 investment | Costs paid as a percentage of a $10,000 investment |
| Class R6 | $99 | 0.90% |
What factors influenced Fund performance during the reporting period?
During the 12-month reporting period ended April 30, 2026, the Fund’s performance relative to the FTSE Global Core Infrastructure 50/50 Index (Net) was affected by sector allocation and security selection. Market conditions reflected rising electricity demand driven by continued data center expansion, supporting the Fund’s positioning in utilities and other infrastructure assets that benefited from accelerating investment and earnings growth. Although geopolitical tensions and trade policy uncertainty contributed to market volatility, the Fund’s diversified exposure across utilities, transportation and midstream infrastructure, supported by inflation-linked and regulated revenue streams, further bolstered relative returns.
The following table outlines the key factors (securities, sectors, industries, market events and/or other characteristics) that materially affected the Fund’s performance during the reporting period.
| Key Factor | Summary | Impact |
| Communications: Americas | Positive stock selection, including an out-of-index position in data center owner Equinix, Inc., and underweight exposure to tower companies | Contributed |
| Transportation: Continental Europe | Strong selection among European toll road and airport stocks, particularly Ferrovial NV and Flughafen Zurich AG | Contributed |
| Utilities: Americas | Positive stock selection, particularly Constellation Energy Corp., The AES Corporation and Entergy Corp. | Contributed |
| Midstream: Americas | Positive stock selection undermined by underweight exposure to one of the best-performing sectors globally | Detracted |
| Transportation: Americas | Positive stock selection partially offset by underweight exposure to North American railroads | Detracted |
Fund Performance
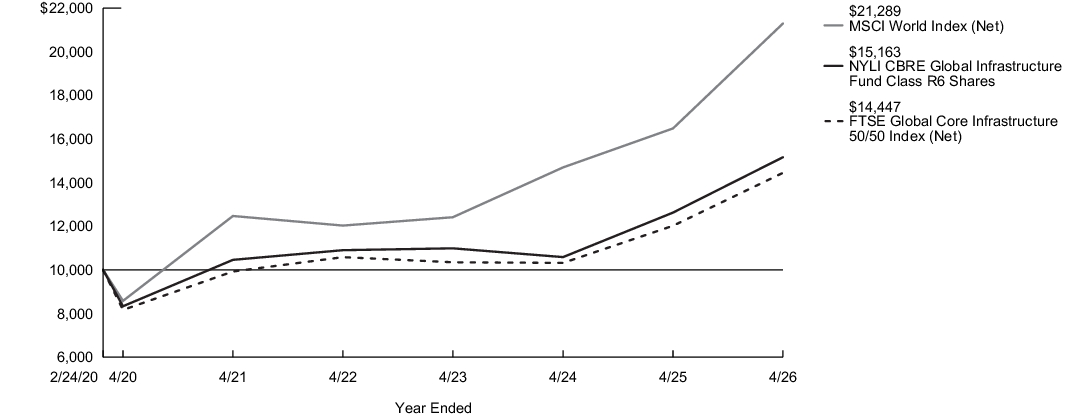
The following graph compares the initial and subsequent account values at the end of each of the most recently completed 10 fiscal years of the Fund (or for the life of the Fund, if shorter). It assumes a $10,000 initial investment at the beginning of the first fiscal year in an appropriate, broad-based securities market index and other indexes, if applicable, for the same period and reflects the deduction of all sales charges, where applicable.
| Average Annual Total Returns for the Year Ended April 30, 2026 | Inception Date |
One Year |
Five Years |
Since Inception |
| Class R6 Shares | 2/24/2020 | 20.10% | 7.71% | 6.96% |
| MSCI World Index (Net)1 | 29.16% | 11.29% | 12.98% | |
| FTSE Global Core Infrastructure 50/50 Index (Net)2 | 20.18% | 7.79% | 6.12% | |
| Morningstar Infrastructure Category Average3 | 28.63% | 9.66% | 7.40% |
| 1. |
The Fund has selected the MSCI World Index (Net) to represent a broad measure of market performance. The MSCI World Index (Net) is a free float-adjusted market capitalization weighted index that is designed to measure the equity market performance of developed markets. |
| 2. |
The FTSE Global Core Infrastructure 50/50 Index (Net), which is generally representative of the market sectors or types of investments in which the Fund invests, is a market-capitalization-weighted index of worldwide infrastructure and infrastructure-related securities. Constituent weights are adjusted semi-annually according to three broad industry sectors: 50% utilities, 30% transportation, and a 20% mix of other sectors. |
| 3. |
The Morningstar Infrastructure Category Average is representative of funds that invest more than 60% of their assets in stocks of companies engaged in infrastructure activities. Industries considered to be part of the infrastructure sector include: oil & gas midstream; waste management; airports; integrated shipping; railroads; shipping & ports; trucking; engineering & construction; infrastructure operations; and the utilities sector. Results are based on average total returns of similar funds with all dividends and capital gain distributions reinvested. |
Key Fund Statistics
| Fund's net assets | $1,712,810,084 |
| Total number of portfolio holdings | 54 |
| Total advisory fees paid | $10,488,990 |
| Portfolio turnover rate | 79% |
Graphical Representation of Holdings
The tables below show the investment makeup of the Fund; percentages indicated are based on the Fund's net assets.
Top Ten Holdings and/or Issuers*
| Xcel Energy, Inc. | 4.5% |
| Canadian National Railway Co. | 4.5% |
| Enbridge, Inc. | 4.4% |
| Atmos Energy Corp. | 4.1% |
| WEC Energy Group, Inc. | 4.0% |
| PPL Corp. | 3.8% |
| SSE plc | 3.7% |
| American Electric Power Co., Inc. | 3.7% |
| Ferrovial SE | 3.6% |
| Southern Co. (The) | 3.4% |
| * Excluding short-term investments |
Top Countries
| United States | 58.6% |
| Canada | 12.1% |
| United Kingdom | 6.6% |
| Netherlands | 3.6% |
| France | 3.3% |
| Germany | 3.2% |
| Spain | 3.1% |
| Japan | 3.0% |
| Mexico | 2.6% |
| New Zealand | 2.0% |
| Other | 1.9% |
Top Ten Holdings and/or Issuers*
| Xcel Energy, Inc. | 4.5% |
| Canadian National Railway Co. | 4.5% |
| Enbridge, Inc. | 4.4% |
| Atmos Energy Corp. | 4.1% |
| WEC Energy Group, Inc. | 4.0% |
| PPL Corp. | 3.8% |
| SSE plc | 3.7% |
| American Electric Power Co., Inc. | 3.7% |
| Ferrovial SE | 3.6% |
| Southern Co. (The) | 3.4% |
| * Excluding short-term investments |
What were the Fund costs for the last year?
(Based on a hypothetical $10,000 investment)
| Share Class Name | Costs of a $10,000 investment | Costs paid as a percentage of a $10,000 investment1 |
| Class I | $107 | 0.97% |
| 1. | Reflects fee waivers and/or expense reimbursements, without which expenses would have been higher. |
What factors influenced Fund performance during the reporting period?
During the 12-month reporting period ended April 30, 2026, the Fund’s performance relative to the FTSE Global Core Infrastructure 50/50 Index (Net) was affected by sector allocation and security selection. Market conditions reflected rising electricity demand driven by continued data center expansion, supporting the Fund’s positioning in utilities and other infrastructure assets that benefited from accelerating investment and earnings growth. Although geopolitical tensions and trade policy uncertainty contributed to market volatility, the Fund’s diversified exposure across utilities, transportation and midstream infrastructure, supported by inflation-linked and regulated revenue streams, further bolstered relative returns.
The following table outlines the key factors (securities, sectors, industries, market events and/or other characteristics) that materially affected the Fund’s performance during the reporting period.
| Key Factor | Summary | Impact |
| Communications: Americas | Positive stock selection, including an out-of-index position in data center owner Equinix, Inc., and underweight exposure to tower companies | Contributed |
| Transportation: Continental Europe | Strong selection among European toll road and airport stocks, particularly Ferrovial NV and Flughafen Zurich AG | Contributed |
| Utilities: Americas | Positive stock selection, particularly Constellation Energy Corp., The AES Corporation and Entergy Corp. | Contributed |
| Midstream: Americas | Positive stock selection undermined by underweight exposure to one of the best-performing sectors globally | Detracted |
| Transportation: Americas | Positive stock selection partially offset by underweight exposure to North American railroads | Detracted |
Fund Performance
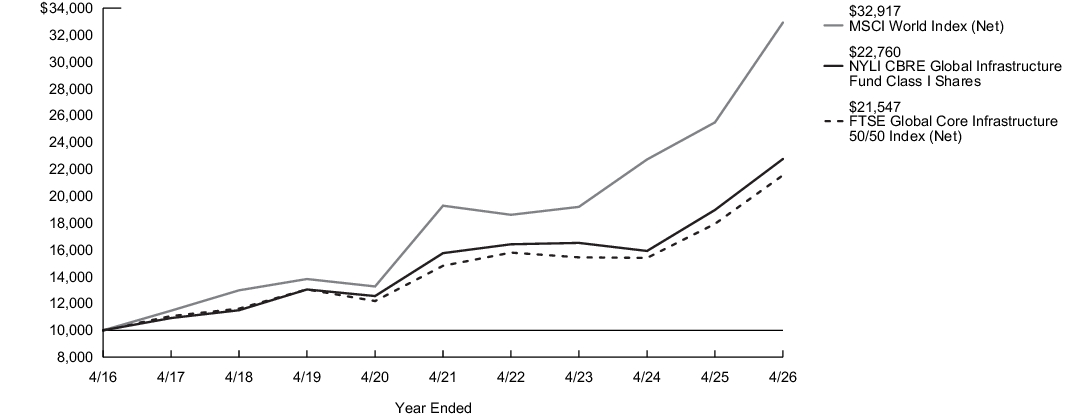
The following graph compares the initial and subsequent account values at the end of each of the most recently completed 10 fiscal years of the Fund (or for the life of the Fund, if shorter). It assumes a $10,000 initial investment at the beginning of the first fiscal year in an appropriate, broad-based securities market index and other indexes, if applicable, for the same period and reflects the deduction of all sales charges, where applicable. Effective February 21, 2020, the Voya CBRE Global Infrastructure Fund (the "Predecessor Fund") was reorganized into the Fund. As accounting successor to the Predecessor Fund, the Fund has assumed the Predecessor Fund’s historical performance. Therefore, the performance information shown below includes that of the Predecessor Fund, which had a different fee structure than the Fund.
| Average Annual Total Returns for the Year Ended April 30, 2026 | Inception Date |
One Year |
Five Years |
Ten Years |
| Class I Shares | 6/28/2013 | 20.01% | 7.64% | 8.57% |
| MSCI World Index (Net)1 | 29.16% | 11.29% | 12.65% | |
| FTSE Global Core Infrastructure 50/50 Index (Net)2 | 20.18% | 7.79% | 7.98% | |
| Morningstar Infrastructure Category Average3 | 28.63% | 9.66% | 8.96% |
| 1. |
The Fund has selected the MSCI World Index (Net) to represent a broad measure of market performance. The MSCI World Index (Net) is a free float-adjusted market capitalization weighted index that is designed to measure the equity market performance of developed markets. |
| 2. |
The FTSE Global Core Infrastructure 50/50 Index (Net), which is generally representative of the market sectors or types of investments in which the Fund invests, is a market-capitalization-weighted index of worldwide infrastructure and infrastructure-related securities. Constituent weights are adjusted semi-annually according to three broad industry sectors: 50% utilities, 30% transportation, and a 20% mix of other sectors. |
| 3. |
The Morningstar Infrastructure Category Average is representative of funds that invest more than 60% of their assets in stocks of companies engaged in infrastructure activities. Industries considered to be part of the infrastructure sector include: oil & gas midstream; waste management; airports; integrated shipping; railroads; shipping & ports; trucking; engineering & construction; infrastructure operations; and the utilities sector. Results are based on average total returns of similar funds with all dividends and capital gain distributions reinvested. |
Key Fund Statistics
| Fund's net assets | $1,712,810,084 |
| Total number of portfolio holdings | 54 |
| Total advisory fees paid | $10,488,990 |
| Portfolio turnover rate | 79% |
Graphical Representation of Holdings
The tables below show the investment makeup of the Fund; percentages indicated are based on the Fund's net assets.
Top Ten Holdings and/or Issuers*
| Xcel Energy, Inc. | 4.5% |
| Canadian National Railway Co. | 4.5% |
| Enbridge, Inc. | 4.4% |
| Atmos Energy Corp. | 4.1% |
| WEC Energy Group, Inc. | 4.0% |
| PPL Corp. | 3.8% |
| SSE plc | 3.7% |
| American Electric Power Co., Inc. | 3.7% |
| Ferrovial SE | 3.6% |
| Southern Co. (The) | 3.4% |
| * Excluding short-term investments |
Top Countries
| United States | 58.6% |
| Canada | 12.1% |
| United Kingdom | 6.6% |
| Netherlands | 3.6% |
| France | 3.3% |
| Germany | 3.2% |
| Spain | 3.1% |
| Japan | 3.0% |
| Mexico | 2.6% |
| New Zealand | 2.0% |
| Other | 1.9% |
Top Ten Holdings and/or Issuers*
| Xcel Energy, Inc. | 4.5% |
| Canadian National Railway Co. | 4.5% |
| Enbridge, Inc. | 4.4% |
| Atmos Energy Corp. | 4.1% |
| WEC Energy Group, Inc. | 4.0% |
| PPL Corp. | 3.8% |
| SSE plc | 3.7% |
| American Electric Power Co., Inc. | 3.7% |
| Ferrovial SE | 3.6% |
| Southern Co. (The) | 3.4% |
| * Excluding short-term investments |
What were the Fund costs for the last year?
(Based on a hypothetical $10,000 investment)
| Share Class Name | Costs of a $10,000 investment | Costs paid as a percentage of a $10,000 investment |
| Class C | $224 | 2.05% |
What factors influenced Fund performance during the reporting period?
During the 12-month reporting period ended April 30, 2026, the Fund’s performance relative to the FTSE Global Core Infrastructure 50/50 Index (Net) was affected by sector allocation and security selection. Market conditions reflected rising electricity demand driven by continued data center expansion, supporting the Fund’s positioning in utilities and other infrastructure assets that benefited from accelerating investment and earnings growth. Although geopolitical tensions and trade policy uncertainty contributed to market volatility, the Fund’s diversified exposure across utilities, transportation and midstream infrastructure, supported by inflation-linked and regulated revenue streams, further bolstered relative returns.
The following table outlines the key factors (securities, sectors, industries, market events and/or other characteristics) that materially affected the Fund’s performance during the reporting period.
| Key Factor | Summary | Impact |
| Communications: Americas | Positive stock selection, including an out-of-index position in data center owner Equinix, Inc., and underweight exposure to tower companies | Contributed |
| Transportation: Continental Europe | Strong selection among European toll road and airport stocks, particularly Ferrovial NV and Flughafen Zurich AG | Contributed |
| Utilities: Americas | Positive stock selection, particularly Constellation Energy Corp., The AES Corporation and Entergy Corp. | Contributed |
| Midstream: Americas | Positive stock selection undermined by underweight exposure to one of the best-performing sectors globally | Detracted |
| Transportation: Americas | Positive stock selection partially offset by underweight exposure to North American railroads | Detracted |
Fund Performance
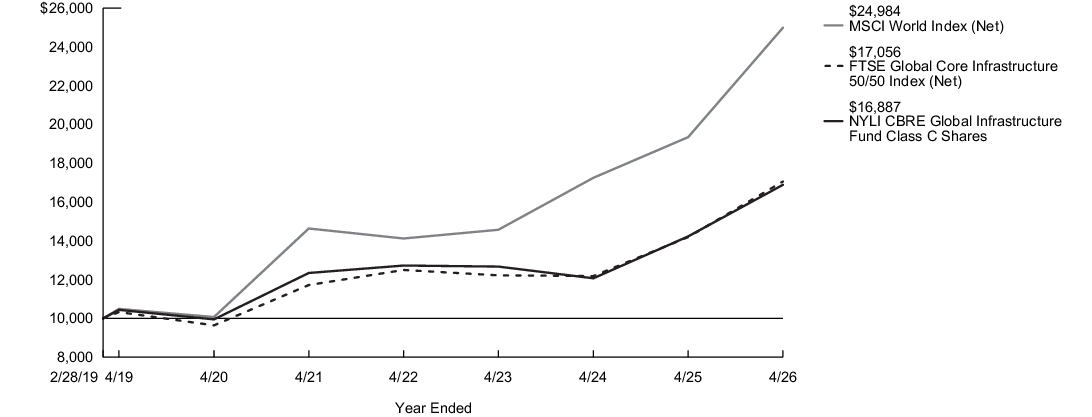
The following graph compares the initial and subsequent account values at the end of each of the most recently completed 10 fiscal years of the Fund (or for the life of the Fund, if shorter). It assumes a $10,000 initial investment at the beginning of the first fiscal year in an appropriate, broad-based securities market index and other indexes, if applicable, for the same period and reflects the deduction of all sales charges, where applicable. Effective February 21, 2020, the Voya CBRE Global Infrastructure Fund (the "Predecessor Fund") was reorganized into the Fund. As accounting successor to the Predecessor Fund, the Fund has assumed the Predecessor Fund’s historical performance. Therefore, the performance information shown below includes that of the Predecessor Fund, which had a different fee structure than the Fund.
| Average Annual Total Returns for the Year Ended April 30, 2026 | Inception Date |
One Year |
Five Years |
Since Inception |
| Class C Shares - Including sales charges | 2/28/2019 | 17.69% | 6.47% | 7.58% |
| Class C Shares - Excluding sales charges | 18.69% | 6.47% | 7.58% | |
| MSCI World Index (Net)1 | 29.16% | 11.29% | 13.63% | |
| FTSE Global Core Infrastructure 50/50 Index (Net)2 | 20.18% | 7.79% | 7.73% | |
| Morningstar Infrastructure Category Average3 | 28.63% | 9.66% | 9.10% |
| 1. |
The Fund has selected the MSCI World Index (Net) to represent a broad measure of market performance. The MSCI World Index (Net) is a free float-adjusted market capitalization weighted index that is designed to measure the equity market performance of developed markets. |
| 2. |
The FTSE Global Core Infrastructure 50/50 Index (Net), which is generally representative of the market sectors or types of investments in which the Fund invests, is a market-capitalization-weighted index of worldwide infrastructure and infrastructure-related securities. Constituent weights are adjusted semi-annually according to three broad industry sectors: 50% utilities, 30% transportation, and a 20% mix of other sectors. |
| 3. |
The Morningstar Infrastructure Category Average is representative of funds that invest more than 60% of their assets in stocks of companies engaged in infrastructure activities. Industries considered to be part of the infrastructure sector include: oil & gas midstream; waste management; airports; integrated shipping; railroads; shipping & ports; trucking; engineering & construction; infrastructure operations; and the utilities sector. Results are based on average total returns of similar funds with all dividends and capital gain distributions reinvested. |
Key Fund Statistics
| Fund's net assets | $1,712,810,084 |
| Total number of portfolio holdings | 54 |
| Total advisory fees paid | $10,488,990 |
| Portfolio turnover rate | 79% |
Graphical Representation of Holdings
The tables below show the investment makeup of the Fund; percentages indicated are based on the Fund's net assets.
Top Ten Holdings and/or Issuers*
| Xcel Energy, Inc. | 4.5% |
| Canadian National Railway Co. | 4.5% |
| Enbridge, Inc. | 4.4% |
| Atmos Energy Corp. | 4.1% |
| WEC Energy Group, Inc. | 4.0% |
| PPL Corp. | 3.8% |
| SSE plc | 3.7% |
| American Electric Power Co., Inc. | 3.7% |
| Ferrovial SE | 3.6% |
| Southern Co. (The) | 3.4% |
| * Excluding short-term investments |
Top Countries
| United States | 58.6% |
| Canada | 12.1% |
| United Kingdom | 6.6% |
| Netherlands | 3.6% |
| France | 3.3% |
| Germany | 3.2% |
| Spain | 3.1% |
| Japan | 3.0% |
| Mexico | 2.6% |
| New Zealand | 2.0% |
| Other | 1.9% |
Top Ten Holdings and/or Issuers*
| Xcel Energy, Inc. | 4.5% |
| Canadian National Railway Co. | 4.5% |
| Enbridge, Inc. | 4.4% |
| Atmos Energy Corp. | 4.1% |
| WEC Energy Group, Inc. | 4.0% |
| PPL Corp. | 3.8% |
| SSE plc | 3.7% |
| American Electric Power Co., Inc. | 3.7% |
| Ferrovial SE | 3.6% |
| Southern Co. (The) | 3.4% |
| * Excluding short-term investments |
What were the Fund costs for the last year?
(Based on a hypothetical $10,000 investment)
| Share Class Name | Costs of a $10,000 investment | Costs paid as a percentage of a $10,000 investment |
| Class A | $142 | 1.29% |
What factors influenced Fund performance during the reporting period?
During the 12-month reporting period ended April 30, 2026, the Fund’s performance relative to the FTSE Global Core Infrastructure 50/50 Index (Net) was affected by sector allocation and security selection. Market conditions reflected rising electricity demand driven by continued data center expansion, supporting the Fund’s positioning in utilities and other infrastructure assets that benefited from accelerating investment and earnings growth. Although geopolitical tensions and trade policy uncertainty contributed to market volatility, the Fund’s diversified exposure across utilities, transportation and midstream infrastructure, supported by inflation-linked and regulated revenue streams, further bolstered relative returns.
The following table outlines the key factors (securities, sectors, industries, market events and/or other characteristics) that materially affected the Fund’s performance during the reporting period.
| Key Factor | Summary | Impact |
| Communications: Americas | Positive stock selection, including an out-of-index position in data center owner Equinix, Inc., and underweight exposure to tower companies | Contributed |
| Transportation: Continental Europe | Strong selection among European toll road and airport stocks, particularly Ferrovial NV and Flughafen Zurich AG | Contributed |
| Utilities: Americas | Positive stock selection, particularly Constellation Energy Corp., The AES Corporation and Entergy Corp. | Contributed |
| Midstream: Americas | Positive stock selection undermined by underweight exposure to one of the best-performing sectors globally | Detracted |
| Transportation: Americas | Positive stock selection partially offset by underweight exposure to North American railroads | Detracted |
Fund Performance
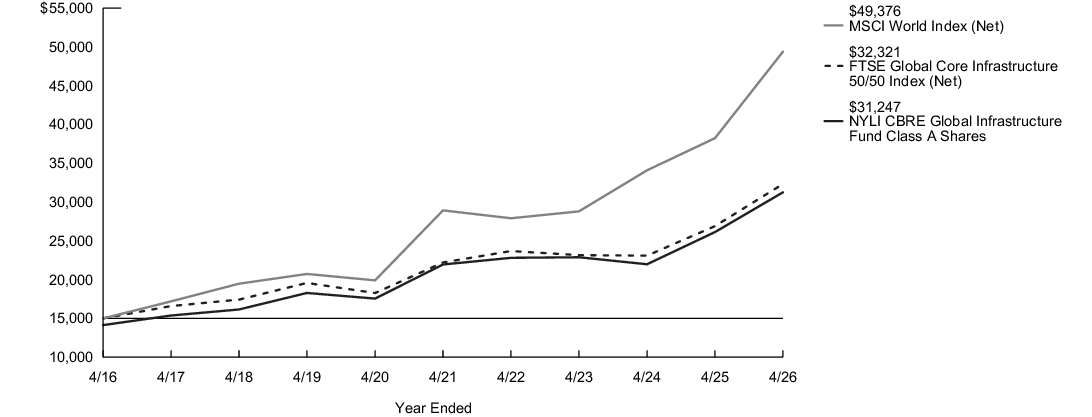
The following graph compares the initial and subsequent account values at the end of each of the most recently completed 10 fiscal years of the Fund (or for the life of the Fund, if shorter). It assumes a $15,000 initial investment at the beginning of the first fiscal year in an appropriate, broad-based securities market index and other indexes, if applicable, for the same period and reflects the deduction of all sales charges, where applicable. Effective February 21, 2020, the Voya CBRE Global Infrastructure Fund (the "Predecessor Fund") was reorganized into the Fund. As accounting successor to the Predecessor Fund, the Fund has assumed the Predecessor Fund’s historical performance. Therefore, the performance information shown below includes that of the Predecessor Fund, which had a different fee structure than the Fund.
| Average Annual Total Returns for the Year Ended April 30, 2026 | Inception Date |
One Year |
Five Years |
Ten Years |
| Class A Shares - Including sales charges | 10/16/2013 | 13.02% | 6.11% | 7.61% |
| Class A Shares - Excluding sales charges | 19.59% | 7.32% | 8.25% | |
| MSCI World Index (Net)1 | 29.16% | 11.29% | 12.65% | |
| FTSE Global Core Infrastructure 50/50 Index (Net)2 | 20.18% | 7.79% | 7.98% | |
| Morningstar Infrastructure Category Average3 | 28.63% | 9.66% | 8.96% |
| 1. |
The Fund has selected the MSCI World Index (Net) to represent a broad measure of market performance. The MSCI World Index (Net) is a free float-adjusted market capitalization weighted index that is designed to measure the equity market performance of developed markets. |
| 2. |
The FTSE Global Core Infrastructure 50/50 Index (Net), which is generally representative of the market sectors or types of investments in which the Fund invests, is a market-capitalization-weighted index of worldwide infrastructure and infrastructure-related securities. Constituent weights are adjusted semi-annually according to three broad industry sectors: 50% utilities, 30% transportation, and a 20% mix of other sectors. |
| 3. |
The Morningstar Infrastructure Category Average is representative of funds that invest more than 60% of their assets in stocks of companies engaged in infrastructure activities. Industries considered to be part of the infrastructure sector include: oil & gas midstream; waste management; airports; integrated shipping; railroads; shipping & ports; trucking; engineering & construction; infrastructure operations; and the utilities sector. Results are based on average total returns of similar funds with all dividends and capital gain distributions reinvested. |
Key Fund Statistics
| Fund's net assets | $1,712,810,084 |
| Total number of portfolio holdings | 54 |
| Total advisory fees paid | $10,488,990 |
| Portfolio turnover rate | 79% |
Graphical Representation of Holdings
The tables below show the investment makeup of the Fund; percentages indicated are based on the Fund's net assets.
Top Ten Holdings and/or Issuers*
| Xcel Energy, Inc. | 4.5% |
| Canadian National Railway Co. | 4.5% |
| Enbridge, Inc. | 4.4% |
| Atmos Energy Corp. | 4.1% |
| WEC Energy Group, Inc. | 4.0% |
| PPL Corp. | 3.8% |
| SSE plc | 3.7% |
| American Electric Power Co., Inc. | 3.7% |
| Ferrovial SE | 3.6% |
| Southern Co. (The) | 3.4% |
| * Excluding short-term investments |
Top Countries
| United States | 58.6% |
| Canada | 12.1% |
| United Kingdom | 6.6% |
| Netherlands | 3.6% |
| France | 3.3% |
| Germany | 3.2% |
| Spain | 3.1% |
| Japan | 3.0% |
| Mexico | 2.6% |
| New Zealand | 2.0% |
| Other | 1.9% |
Top Ten Holdings and/or Issuers*
| Xcel Energy, Inc. | 4.5% |
| Canadian National Railway Co. | 4.5% |
| Enbridge, Inc. | 4.4% |
| Atmos Energy Corp. | 4.1% |
| WEC Energy Group, Inc. | 4.0% |
| PPL Corp. | 3.8% |
| SSE plc | 3.7% |
| American Electric Power Co., Inc. | 3.7% |
| Ferrovial SE | 3.6% |
| Southern Co. (The) | 3.4% |
| * Excluding short-term investments |
What were the Fund costs for the last year?
(Based on a hypothetical $10,000 investment)
| Share Class Name | Costs of a $10,000 investment | Costs paid as a percentage of a $10,000 investment1 |
| Class A | $126 | 1.18% |
| 1. | Reflects fee waivers and/or expense reimbursements, without which expenses would have been higher. |
What factors influenced Fund performance during the reporting period?
During the 12-month reporting period ended April 30, 2026, the Fund’s performance relative to the FTSE Nareit All Equity REITs Index was driven by strong sector allocation offset by a drag from negative stock selection. Sector allocation benefited from overweight exposure to health care and data centers, as well as an underweight allocation to the underperforming residential sector. Stock selection detracted from relative performance, primarily due to an overweight position in net lease gaming company VICI Properties Inc., partially offset by overweight exposure to senior housing companies Welltower Inc., American Healthcare REIT, Inc., and Janus Living, Inc.
The following table outlines the key factors (securities, sectors, industries, market events and/or other characteristics) that materially affected the Fund’s performance during the reporting period.
| Key Factor | Summary | Impact |
| Health Care Sector | Overweight exposure to an outperforming sector | Contributed |
| Welltower Inc. | Overweight exposure to an outperforming security | Contributed |
| Residential Sector | Underweight exposure to an underperforming sector | Contributed |
| Vornado Realty | Overweight exposure to an underperforming security | Detracted |
| Hotel Sector | Stock selection in the sector was a detractor | Detracted |
| VICI Properties Inc. | Overweight exposure to an underperforming security | Detracted |
Fund Performance
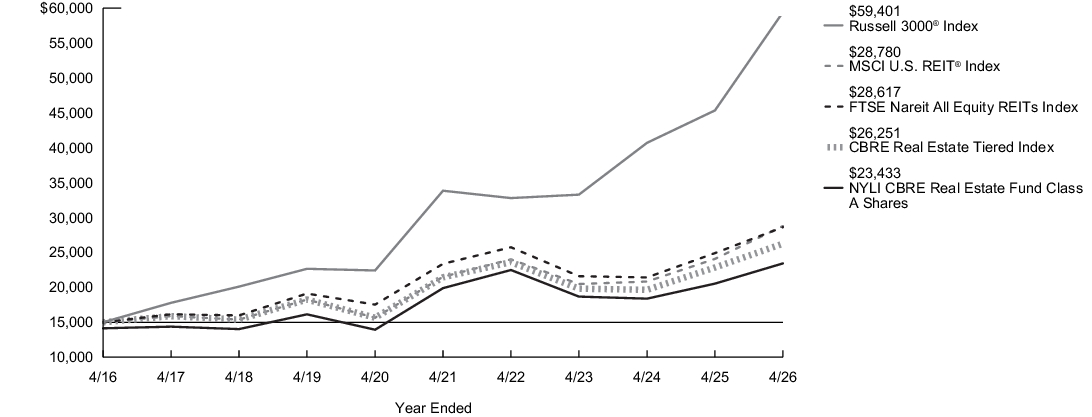
The following graph compares the initial and subsequent account values at the end of each of the most recently completed 10 fiscal years of the Fund (or for the life of the Fund, if shorter). It assumes a $15,000 initial investment at the beginning of the first fiscal year in an appropriate, broad-based securities market index and other indexes, if applicable, for the same period and reflects the deduction of all sales charges, where applicable. Effective February 21, 2020, the Voya Real Estate Fund (the "Predecessor Fund") was reorganized into the Fund. As accounting successor to the Predecessor Fund, the Fund has assumed the Predecessor Fund’s historical performance. Therefore, the performance information shown below includes that of the Predecessor Fund, which had a different fee structure than the Fund.
| Average Annual Total Returns for the Year Ended April 30, 2026 | Inception Date |
One Year |
Five Years |
Ten Years |
| Class A Shares - Including sales charges | 12/20/2002 | 7.83% | 2.17% | 4.56% |
| Class A Shares - Excluding sales charges | 14.10% | 3.33% | 5.18% | |
| Russell 3000®Index1 | 31.01% | 11.91% | 14.75% | |
| FTSE Nareit All Equity REITs Index2 | 14.89% | 4.13% | 6.67% | |
| CBRE Real Estate Tiered Index3 | 14.89% | 4.13% | 5.76% | |
| MSCI U.S. REIT®Index4 | 19.53% | 5.99% | 6.73% | |
| Morningstar Real Estate Category Average5 | 14.73% | 3.81% | 5.85% |
| 1. |
The Fund has selected the Russell 3000® Index to represent a broad measure of market performance. The Russell 3000® Index measures the performance of the largest 3,000 U.S. companies representing approximately 98% of the investable U.S. equity market. |
| 2. |
The FTSE Nareit All Equity REITs Index, which is generally representative of the market sectors or types of investments in which the Fund invests, is a free-float adjusted, market capitalization-weighted index of U.S. equity REITs. Constituents of the index include all tax-qualified REITs with more than 50 percent of total assets in qualifying real estate assets other than mortgages secured by real property. |
| 3. |
The returns for the CBRE Real Estate Tiered Index, which is generally representative of the market sectors or types of investments in which the Fund invests, represent the returns of the MSCI U.S. REIT® Index prior to January 1, 2021 and the returns of the FTSE Nareit All Equity REITs Index thereafter. |
| 4. |
The MSCI U.S. REIT® Index, which is generally representative of the market sectors or types of investments in which the Fund invests, is a free float adjusted market capitalization weighted index that is comprised of Equity REITs. The MSCI U.S. REIT® Index is based on the MSCI USA Investable Market Index, its parent index, which captures the large, mid and small cap segments of the U.S. market. |
| 5. |
The Morningstar Real Estate Category Average is representative of funds that invest primarily in real estate investment trusts of various types. REITs are companies that develop and manage real estate properties. There are several different types of REITs, including apartment, factory-outlet, healthcare, hotel, industrial, mortgage, office, and shopping center REITs. Some funds in this category also invest in real estate operating companies. Results are based on average total returns of similar funds with all dividends and capital gain distributions reinvested. |
Key Fund Statistics
| Fund's net assets | $224,576,923 |
| Total number of portfolio holdings | 44 |
| Total advisory fees paid | $1,008,772 |
| Portfolio turnover rate | 79% |
Graphical Representation of Holdings
The tables below show the investment makeup of the Fund; percentages indicated are based on the Fund's net assets.
Top Ten Holdings and/or Issuers*
| Welltower, Inc. | 12.4% |
| Equinix, Inc. | 10.1% |
| American Tower Corp. | 7.8% |
| Prologis, Inc. | 6.7% |
| Simon Property Group, Inc. | 5.4% |
| Iron Mountain, Inc. | 3.5% |
| CubeSmart | 3.2% |
| EastGroup Properties, Inc. | 3.1% |
| Brixmor Property Group, Inc. | 3.0% |
| Equity Residential | 2.9% |
| * Excluding short-term investments |
Sector Composition
| Healthcare Facilities | 16.6% |
| Technology Datacenters | 15.6% |
| Industrial Properties | 15.0% |
| Residential | 10.4% |
| Technology Towers | 10.2% |
| Net Lease Properties | 10.2% |
| Enclosed Malls | 6.4% |
| Self Storage Property | 4.9% |
| Community Shopping Centers | 4.4% |
| Hotels | 2.2% |
| Other | 4.1% |
Top Ten Holdings and/or Issuers*
| Welltower, Inc. | 12.4% |
| Equinix, Inc. | 10.1% |
| American Tower Corp. | 7.8% |
| Prologis, Inc. | 6.7% |
| Simon Property Group, Inc. | 5.4% |
| Iron Mountain, Inc. | 3.5% |
| CubeSmart | 3.2% |
| EastGroup Properties, Inc. | 3.1% |
| Brixmor Property Group, Inc. | 3.0% |
| Equity Residential | 2.9% |
| * Excluding short-term investments |
What were the Fund costs for the last year?
(Based on a hypothetical $10,000 investment)
| Share Class Name | Costs of a $10,000 investment | Costs paid as a percentage of a $10,000 investment1 |
| Class C | $206 | 1.93% |
| 1. | Reflects fee waivers and/or expense reimbursements, without which expenses would have been higher. |
What factors influenced Fund performance during the reporting period?
During the 12-month reporting period ended April 30, 2026, the Fund’s performance relative to the FTSE Nareit All Equity REITs Index was driven by strong sector allocation offset by a drag from negative stock selection. Sector allocation benefited from overweight exposure to health care and data centers, as well as an underweight allocation to the underperforming residential sector. Stock selection detracted from relative performance, primarily due to an overweight position in net lease gaming company VICI Properties Inc., partially offset by overweight exposure to senior housing companies Welltower Inc., American Healthcare REIT, Inc., and Janus Living, Inc.
The following table outlines the key factors (securities, sectors, industries, market events and/or other characteristics) that materially affected the Fund’s performance during the reporting period.
| Key Factor | Summary | Impact |
| Health Care Sector | Overweight exposure to an outperforming sector | Contributed |
| Welltower Inc. | Overweight exposure to an outperforming security | Contributed |
| Residential Sector | Underweight exposure to an underperforming sector | Contributed |
| Vornado Realty | Overweight exposure to an underperforming security | Detracted |
| Hotel Sector | Stock selection in the sector was a detractor | Detracted |
| VICI Properties Inc. | Overweight exposure to an underperforming security | Detracted |
Fund Performance
The following graph compares the initial and subsequent account values at the end of each of the most recently completed 10 fiscal years of the Fund (or for the life of the Fund, if shorter). It assumes a $10,000 initial investment at the beginning of the first fiscal year in an appropriate, broad-based securities market index and other indexes, if applicable, for the same period and reflects the deduction of all sales charges, where applicable. Effective February 21, 2020, the Voya Real Estate Fund (the "Predecessor Fund") was reorganized into the Fund. As accounting successor to the Predecessor Fund, the Fund has assumed the Predecessor Fund’s historical performance. Therefore, the performance information shown below includes that of the Predecessor Fund, which had a different fee structure than the Fund.

| Average Annual Total Returns for the Year Ended April 30, 2026 | Inception Date |
One Year |
Five Years |
Ten Years |
| Class C Shares - Including sales charges | 1/17/2003 | 12.38% | 2.58% | 4.40% |
| Class C Shares - Excluding sales charges | 13.38% | 2.58% | 4.40% | |
| Russell 3000®Index1 | 31.01% | 11.91% | 14.75% | |
| FTSE Nareit All Equity REITs Index2 | 14.89% | 4.13% | 6.67% | |
| CBRE Real Estate Tiered Index3 | 14.89% | 4.13% | 5.76% | |
| MSCI U.S. REIT®Index4 | 19.53% | 5.99% | 6.73% | |
| Morningstar Real Estate Category Average5 | 14.73% | 3.81% | 5.85% |
| 1. |
The Fund has selected the Russell 3000® Index to represent a broad measure of market performance. The Russell 3000® Index measures the performance of the largest 3,000 U.S. companies representing approximately 98% of the investable U.S. equity market. |
| 2. |
The FTSE Nareit All Equity REITs Index, which is generally representative of the market sectors or types of investments in which the Fund invests, is a free-float adjusted, market capitalization-weighted index of U.S. equity REITs. Constituents of the index include all tax-qualified REITs with more than 50 percent of total assets in qualifying real estate assets other than mortgages secured by real property. |
| 3. |
The returns for the CBRE Real Estate Tiered Index, which is generally representative of the market sectors or types of investments in which the Fund invests, represent the returns of the MSCI U.S. REIT® Index prior to January 1, 2021 and the returns of the FTSE Nareit All Equity REITs Index thereafter. |
| 4. |
The MSCI U.S. REIT® Index, which is generally representative of the market sectors or types of investments in which the Fund invests, is a free float adjusted market capitalization weighted index that is comprised of Equity REITs. The MSCI U.S. REIT® Index is based on the MSCI USA Investable Market Index, its parent index, which captures the large, mid and small cap segments of the U.S. market. |
| 5. |
The Morningstar Real Estate Category Average is representative of funds that invest primarily in real estate investment trusts of various types. REITs are companies that develop and manage real estate properties. There are several different types of REITs, including apartment, factory-outlet, healthcare, hotel, industrial, mortgage, office, and shopping center REITs. Some funds in this category also invest in real estate operating companies. Results are based on average total returns of similar funds with all dividends and capital gain distributions reinvested. |
Key Fund Statistics
| Fund's net assets | $224,576,923 |
| Total number of portfolio holdings | 44 |
| Total advisory fees paid | $1,008,772 |
| Portfolio turnover rate | 79% |
Graphical Representation of Holdings
The tables below show the investment makeup of the Fund; percentages indicated are based on the Fund's net assets.
Top Ten Holdings and/or Issuers*
| Welltower, Inc. | 12.4% |
| Equinix, Inc. | 10.1% |
| American Tower Corp. | 7.8% |
| Prologis, Inc. | 6.7% |
| Simon Property Group, Inc. | 5.4% |
| Iron Mountain, Inc. | 3.5% |
| CubeSmart | 3.2% |
| EastGroup Properties, Inc. | 3.1% |
| Brixmor Property Group, Inc. | 3.0% |
| Equity Residential | 2.9% |
| * Excluding short-term investments |
Sector Composition
| Healthcare Facilities | 16.6% |
| Technology Datacenters | 15.6% |
| Industrial Properties | 15.0% |
| Residential | 10.4% |
| Technology Towers | 10.2% |
| Net Lease Properties | 10.2% |
| Enclosed Malls | 6.4% |
| Self Storage Property | 4.9% |
| Community Shopping Centers | 4.4% |
| Hotels | 2.2% |
| Other | 4.1% |
Top Ten Holdings and/or Issuers*
| Welltower, Inc. | 12.4% |
| Equinix, Inc. | 10.1% |
| American Tower Corp. | 7.8% |
| Prologis, Inc. | 6.7% |
| Simon Property Group, Inc. | 5.4% |
| Iron Mountain, Inc. | 3.5% |
| CubeSmart | 3.2% |
| EastGroup Properties, Inc. | 3.1% |
| Brixmor Property Group, Inc. | 3.0% |
| Equity Residential | 2.9% |
| * Excluding short-term investments |
What were the Fund costs for the last year?
(Based on a hypothetical $10,000 investment)
| Share Class Name | Costs of a $10,000 investment | Costs paid as a percentage of a $10,000 investment1 |
| Class I | $89 | 0.83% |
| 1. | Reflects fee waivers and/or expense reimbursements, without which expenses would have been higher. |
What factors influenced Fund performance during the reporting period?
During the 12-month reporting period ended April 30, 2026, the Fund’s performance relative to the FTSE Nareit All Equity REITs Index was driven by strong sector allocation offset by a drag from negative stock selection. Sector allocation benefited from overweight exposure to health care and data centers, as well as an underweight allocation to the underperforming residential sector. Stock selection detracted from relative performance, primarily due to an overweight position in net lease gaming company VICI Properties Inc., partially offset by overweight exposure to senior housing companies Welltower Inc., American Healthcare REIT, Inc., and Janus Living, Inc.
The following table outlines the key factors (securities, sectors, industries, market events and/or other characteristics) that materially affected the Fund’s performance during the reporting period.
| Key Factor | Summary | Impact |
| Health Care Sector | Overweight exposure to an outperforming sector | Contributed |
| Welltower Inc. | Overweight exposure to an outperforming security | Contributed |
| Residential Sector | Underweight exposure to an underperforming sector | Contributed |
| Vornado Realty | Overweight exposure to an underperforming security | Detracted |
| Hotel Sector | Stock selection in the sector was a detractor | Detracted |
| VICI Properties Inc. | Overweight exposure to an underperforming security | Detracted |
Fund Performance
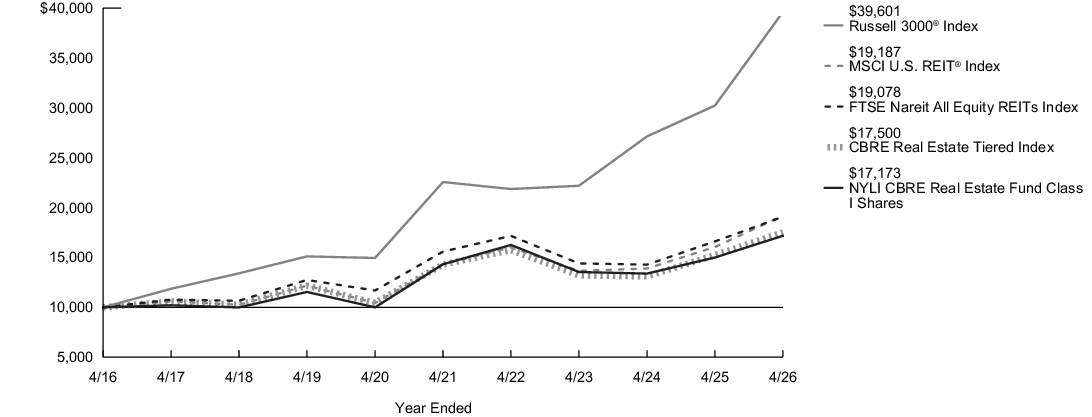
The following graph compares the initial and subsequent account values at the end of each of the most recently completed 10 fiscal years of the Fund (or for the life of the Fund, if shorter). It assumes a $10,000 initial investment at the beginning of the first fiscal year in an appropriate, broad-based securities market index and other indexes, if applicable, for the same period and reflects the deduction of all sales charges, where applicable. Effective February 21, 2020, the Voya Real Estate Fund (the "Predecessor Fund") was reorganized into the Fund. As accounting successor to the Predecessor Fund, the Fund has assumed the Predecessor Fund’s historical performance. Therefore, the performance information shown below includes that of the Predecessor Fund, which had a different fee structure than the Fund.
| Average Annual Total Returns for the Year Ended April 30, 2026 | Inception Date |
One Year |
Five Years |
Ten Years |
| Class I Shares | 12/31/1996 | 14.53% | 3.71% | 5.56% |
| Russell 3000®Index1 | 31.01% | 11.91% | 14.75% | |
| FTSE Nareit All Equity REITs Index2 | 14.89% | 4.13% | 6.67% | |
| CBRE Real Estate Tiered Index3 | 14.89% | 4.13% | 5.76% | |
| MSCI U.S. REIT®Index4 | 19.53% | 5.99% | 6.73% | |
| Morningstar Real Estate Category Average5 | 14.73% | 3.81% | 5.85% |
| 1. |
The Fund has selected the Russell 3000® Index to represent a broad measure of market performance. The Russell 3000® Index measures the performance of the largest 3,000 U.S. companies representing approximately 98% of the investable U.S. equity market. |
| 2. |
The FTSE Nareit All Equity REITs Index, which is generally representative of the market sectors or types of investments in which the Fund invests, is a free-float adjusted, market capitalization-weighted index of U.S. equity REITs. Constituents of the index include all tax-qualified REITs with more than 50 percent of total assets in qualifying real estate assets other than mortgages secured by real property. |
| 3. |
The returns for the CBRE Real Estate Tiered Index, which is generally representative of the market sectors or types of investments in which the Fund invests, represent the returns of the MSCI U.S. REIT® Index prior to January 1, 2021 and the returns of the FTSE Nareit All Equity REITs Index thereafter. |
| 4. |
The MSCI U.S. REIT® Index, which is generally representative of the market sectors or types of investments in which the Fund invests, is a free float adjusted market capitalization weighted index that is comprised of Equity REITs. The MSCI U.S. REIT® Index is based on the MSCI USA Investable Market Index, its parent index, which captures the large, mid and small cap segments of the U.S. market. |
| 5. |
The Morningstar Real Estate Category Average is representative of funds that invest primarily in real estate investment trusts of various types. REITs are companies that develop and manage real estate properties. There are several different types of REITs, including apartment, factory-outlet, healthcare, hotel, industrial, mortgage, office, and shopping center REITs. Some funds in this category also invest in real estate operating companies. Results are based on average total returns of similar funds with all dividends and capital gain distributions reinvested. |
Key Fund Statistics
| Fund's net assets | $224,576,923 |
| Total number of portfolio holdings | 44 |
| Total advisory fees paid | $1,008,772 |
| Portfolio turnover rate | 79% |
Graphical Representation of Holdings
The tables below show the investment makeup of the Fund; percentages indicated are based on the Fund's net assets.
Top Ten Holdings and/or Issuers*
| Welltower, Inc. | 12.4% |
| Equinix, Inc. | 10.1% |
| American Tower Corp. | 7.8% |
| Prologis, Inc. | 6.7% |
| Simon Property Group, Inc. | 5.4% |
| Iron Mountain, Inc. | 3.5% |
| CubeSmart | 3.2% |
| EastGroup Properties, Inc. | 3.1% |
| Brixmor Property Group, Inc. | 3.0% |
| Equity Residential | 2.9% |
| * Excluding short-term investments |
Sector Composition
| Healthcare Facilities | 16.6% |
| Technology Datacenters | 15.6% |
| Industrial Properties | 15.0% |
| Residential | 10.4% |
| Technology Towers | 10.2% |
| Net Lease Properties | 10.2% |
| Enclosed Malls | 6.4% |
| Self Storage Property | 4.9% |
| Community Shopping Centers | 4.4% |
| Hotels | 2.2% |
| Other | 4.1% |
Top Ten Holdings and/or Issuers*
| Welltower, Inc. | 12.4% |
| Equinix, Inc. | 10.1% |
| American Tower Corp. | 7.8% |
| Prologis, Inc. | 6.7% |
| Simon Property Group, Inc. | 5.4% |
| Iron Mountain, Inc. | 3.5% |
| CubeSmart | 3.2% |
| EastGroup Properties, Inc. | 3.1% |
| Brixmor Property Group, Inc. | 3.0% |
| Equity Residential | 2.9% |
| * Excluding short-term investments |
What were the Fund costs for the last year?
(Based on a hypothetical $10,000 investment)
| Share Class Name | Costs of a $10,000 investment | Costs paid as a percentage of a $10,000 investment1 |
| Class R6 | $80 | 0.74% |
| 1. | Reflects fee waivers and/or expense reimbursements, without which expenses would have been higher. |
What factors influenced Fund performance during the reporting period?
During the 12-month reporting period ended April 30, 2026, the Fund’s performance relative to the FTSE Nareit All Equity REITs Index was driven by strong sector allocation offset by a drag from negative stock selection. Sector allocation benefited from overweight exposure to health care and data centers, as well as an underweight allocation to the underperforming residential sector. Stock selection detracted from relative performance, primarily due to an overweight position in net lease gaming company VICI Properties Inc., partially offset by overweight exposure to senior housing companies Welltower Inc., American Healthcare REIT, Inc., and Janus Living, Inc.
The following table outlines the key factors (securities, sectors, industries, market events and/or other characteristics) that materially affected the Fund’s performance during the reporting period.
| Key Factor | Summary | Impact |
| Health Care Sector | Overweight exposure to an outperforming sector | Contributed |
| Welltower Inc. | Overweight exposure to an outperforming security | Contributed |
| Residential Sector | Underweight exposure to an underperforming sector | Contributed |
| Vornado Realty | Overweight exposure to an underperforming security | Detracted |
| Hotel Sector | Stock selection in the sector was a detractor | Detracted |
| VICI Properties Inc. | Overweight exposure to an underperforming security | Detracted |
Fund Performance
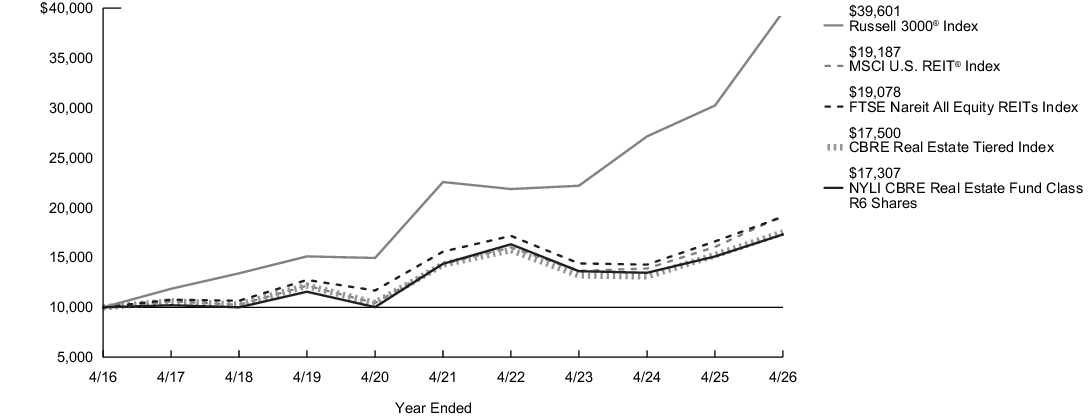
The following graph compares the initial and subsequent account values at the end of each of the most recently completed 10 fiscal years of the Fund (or for the life of the Fund, if shorter). It assumes a $10,000 initial investment at the beginning of the first fiscal year in an appropriate, broad-based securities market index and other indexes, if applicable, for the same period and reflects the deduction of all sales charges, where applicable. Effective February 21, 2020, the Voya Real Estate Fund (the "Predecessor Fund") was reorganized into the Fund. As accounting successor to the Predecessor Fund, the Fund has assumed the Predecessor Fund’s historical performance. Therefore, the performance information shown below includes that of the Predecessor Fund, which had a different fee structure than the Fund.
| Average Annual Total Returns for the Year Ended April 30, 2026 | Inception Date |
One Year |
Five Years |
Ten Years |
| Class R6 Shares | 7/3/2014 | 14.63% | 3.80% | 5.64% |
| Russell 3000®Index1 | 31.01% | 11.91% | 14.75% | |
| FTSE Nareit All Equity REITs Index2 | 14.89% | 4.13% | 6.67% | |
| CBRE Real Estate Tiered Index3 | 14.89% | 4.13% | 5.76% | |
| MSCI U.S. REIT®Index4 | 19.53% | 5.99% | 6.73% | |
| Morningstar Real Estate Category Average5 | 14.73% | 3.81% | 5.85% |
| 1. |
The Fund has selected the Russell 3000® Index to represent a broad measure of market performance. The Russell 3000® Index measures the performance of the largest 3,000 U.S. companies representing approximately 98% of the investable U.S. equity market. |
| 2. |
The FTSE Nareit All Equity REITs Index, which is generally representative of the market sectors or types of investments in which the Fund invests, is a free-float adjusted, market capitalization-weighted index of U.S. equity REITs. Constituents of the index include all tax-qualified REITs with more than 50 percent of total assets in qualifying real estate assets other than mortgages secured by real property. |
| 3. |
The returns for the CBRE Real Estate Tiered Index, which is generally representative of the market sectors or types of investments in which the Fund invests, represent the returns of the MSCI U.S. REIT® Index prior to January 1, 2021 and the returns of the FTSE Nareit All Equity REITs Index thereafter. |
| 4. |
The MSCI U.S. REIT® Index, which is generally representative of the market sectors or types of investments in which the Fund invests, is a free float adjusted market capitalization weighted index that is comprised of Equity REITs. The MSCI U.S. REIT® Index is based on the MSCI USA Investable Market Index, its parent index, which captures the large, mid and small cap segments of the U.S. market. |
| 5. |
The Morningstar Real Estate Category Average is representative of funds that invest primarily in real estate investment trusts of various types. REITs are companies that develop and manage real estate properties. There are several different types of REITs, including apartment, factory-outlet, healthcare, hotel, industrial, mortgage, office, and shopping center REITs. Some funds in this category also invest in real estate operating companies. Results are based on average total returns of similar funds with all dividends and capital gain distributions reinvested. |
Key Fund Statistics
| Fund's net assets | $224,576,923 |
| Total number of portfolio holdings | 44 |
| Total advisory fees paid | $1,008,772 |
| Portfolio turnover rate | 79% |
Graphical Representation of Holdings
The tables below show the investment makeup of the Fund; percentages indicated are based on the Fund's net assets.
Top Ten Holdings and/or Issuers*
| Welltower, Inc. | 12.4% |
| Equinix, Inc. | 10.1% |
| American Tower Corp. | 7.8% |
| Prologis, Inc. | 6.7% |
| Simon Property Group, Inc. | 5.4% |
| Iron Mountain, Inc. | 3.5% |
| CubeSmart | 3.2% |
| EastGroup Properties, Inc. | 3.1% |
| Brixmor Property Group, Inc. | 3.0% |
| Equity Residential | 2.9% |
| * Excluding short-term investments |
Sector Composition
| Healthcare Facilities | 16.6% |
| Technology Datacenters | 15.6% |
| Industrial Properties | 15.0% |
| Residential | 10.4% |
| Technology Towers | 10.2% |
| Net Lease Properties | 10.2% |
| Enclosed Malls | 6.4% |
| Self Storage Property | 4.9% |
| Community Shopping Centers | 4.4% |
| Hotels | 2.2% |
| Other | 4.1% |
Top Ten Holdings and/or Issuers*
| Welltower, Inc. | 12.4% |
| Equinix, Inc. | 10.1% |
| American Tower Corp. | 7.8% |
| Prologis, Inc. | 6.7% |
| Simon Property Group, Inc. | 5.4% |
| Iron Mountain, Inc. | 3.5% |
| CubeSmart | 3.2% |
| EastGroup Properties, Inc. | 3.1% |
| Brixmor Property Group, Inc. | 3.0% |
| Equity Residential | 2.9% |
| * Excluding short-term investments |
What were the Fund costs for the last year?
(Based on a hypothetical $10,000 investment)
| Share Class Name | Costs of a $10,000 investment | Costs paid as a percentage of a $10,000 investment1 |
| Investor Class | $126 | 1.18% |
| 1. | Reflects fee waivers and/or expense reimbursements, without which expenses would have been higher. |
What factors influenced Fund performance during the reporting period?
During the 12-month reporting period ended April 30, 2026, the Fund’s performance relative to the FTSE Nareit All Equity REITs Index was driven by strong sector allocation offset by a drag from negative stock selection. Sector allocation benefited from overweight exposure to health care and data centers, as well as an underweight allocation to the underperforming residential sector. Stock selection detracted from relative performance, primarily due to an overweight position in net lease gaming company VICI Properties Inc., partially offset by overweight exposure to senior housing companies Welltower Inc., American Healthcare REIT, Inc., and Janus Living, Inc.
The following table outlines the key factors (securities, sectors, industries, market events and/or other characteristics) that materially affected the Fund’s performance during the reporting period.
| Key Factor | Summary | Impact |
| Health Care Sector | Overweight exposure to an outperforming sector | Contributed |
| Welltower Inc. | Overweight exposure to an outperforming security | Contributed |
| Residential Sector | Underweight exposure to an underperforming sector | Contributed |
| Vornado Realty | Overweight exposure to an underperforming security | Detracted |
| Hotel Sector | Stock selection in the sector was a detractor | Detracted |
| VICI Properties Inc. | Overweight exposure to an underperforming security | Detracted |
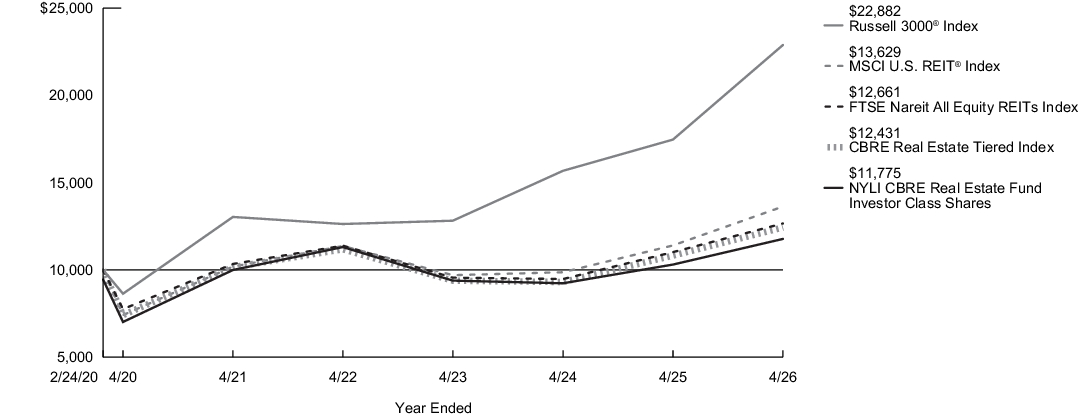
Fund Performance
The following graph compares the initial and subsequent account values at the end of each of the most recently completed 10 fiscal years of the Fund (or for the life of the Fund, if shorter). It assumes a $10,000 initial investment at the beginning of the first fiscal year in an appropriate, broad-based securities market index and other indexes, if applicable, for the same period and reflects the deduction of all sales charges, where applicable.
| Average Annual Total Returns for the Year Ended April 30, 2026 | Inception Date |
One Year |
Five Years |
Since Inception |
| Investor Class Shares - Including sales charges | 2/24/2020 | 8.54% | 2.28% | 2.68% |
| Investor Class Shares - Excluding sales charges | 14.25% | 3.33% | 3.62% | |
| Russell 3000®Index1 | 31.01% | 11.91% | 14.31% | |
| FTSE Nareit All Equity REITs Index2 | 14.89% | 4.13% | 3.88% | |
| CBRE Real Estate Tiered Index3 | 14.89% | 4.13% | 3.58% | |
| MSCI U.S. REIT®Index4 | 19.53% | 5.99% | 5.13% | |
| Morningstar Real Estate Category Average5 | 14.73% | 3.81% | 3.42% |
| 1. |
The Fund has selected the Russell 3000® Index to represent a broad measure of market performance. The Russell 3000® Index measures the performance of the largest 3,000 U.S. companies representing approximately 98% of the investable U.S. equity market. |
| 2. |
The FTSE Nareit All Equity REITs Index, which is generally representative of the market sectors or types of investments in which the Fund invests, is a free-float adjusted, market capitalization-weighted index of U.S. equity REITs. Constituents of the index include all tax-qualified REITs with more than 50 percent of total assets in qualifying real estate assets other than mortgages secured by real property. |
| 3. |
The returns for the CBRE Real Estate Tiered Index, which is generally representative of the market sectors or types of investments in which the Fund invests, represent the returns of the MSCI U.S. REIT® Index prior to January 1, 2021 and the returns of the FTSE Nareit All Equity REITs Index thereafter. |
| 4. |
The MSCI U.S. REIT® Index, which is generally representative of the market sectors or types of investments in which the Fund invests, is a free float adjusted market capitalization weighted index that is comprised of Equity REITs. The MSCI U.S. REIT® Index is based on the MSCI USA Investable Market Index, its parent index, which captures the large, mid and small cap segments of the U.S. market. |
| 5. |
The Morningstar Real Estate Category Average is representative of funds that invest primarily in real estate investment trusts of various types. REITs are companies that develop and manage real estate properties. There are several different types of REITs, including apartment, factory-outlet, healthcare, hotel, industrial, mortgage, office, and shopping center REITs. Some funds in this category also invest in real estate operating companies. Results are based on average total returns of similar funds with all dividends and capital gain distributions reinvested. |
Key Fund Statistics
| Fund's net assets | $224,576,923 |
| Total number of portfolio holdings | 44 |
| Total advisory fees paid | $1,008,772 |
| Portfolio turnover rate | 79% |
Graphical Representation of Holdings
The tables below show the investment makeup of the Fund; percentages indicated are based on the Fund's net assets.
Top Ten Holdings and/or Issuers*
| Welltower, Inc. | 12.4% |
| Equinix, Inc. | 10.1% |
| American Tower Corp. | 7.8% |
| Prologis, Inc. | 6.7% |
| Simon Property Group, Inc. | 5.4% |
| Iron Mountain, Inc. | 3.5% |
| CubeSmart | 3.2% |
| EastGroup Properties, Inc. | 3.1% |
| Brixmor Property Group, Inc. | 3.0% |
| Equity Residential | 2.9% |
| * Excluding short-term investments |
Sector Composition
| Healthcare Facilities | 16.6% |
| Technology Datacenters | 15.6% |
| Industrial Properties | 15.0% |
| Residential | 10.4% |
| Technology Towers | 10.2% |
| Net Lease Properties | 10.2% |
| Enclosed Malls | 6.4% |
| Self Storage Property | 4.9% |
| Community Shopping Centers | 4.4% |
| Hotels | 2.2% |
| Other | 4.1% |
Top Ten Holdings and/or Issuers*
| Welltower, Inc. | 12.4% |
| Equinix, Inc. | 10.1% |
| American Tower Corp. | 7.8% |
| Prologis, Inc. | 6.7% |
| Simon Property Group, Inc. | 5.4% |
| Iron Mountain, Inc. | 3.5% |
| CubeSmart | 3.2% |
| EastGroup Properties, Inc. | 3.1% |
| Brixmor Property Group, Inc. | 3.0% |
| Equity Residential | 2.9% |
| * Excluding short-term investments |
What were the Fund costs for the last year?
(Based on a hypothetical $10,000 investment)
| Share Class Name | Costs of a $10,000 investment | Costs paid as a percentage of a $10,000 investment1,2 |
| SIMPLE Class | $113 | 1.05% |
| 1. | Reflects fee waivers and/or expense reimbursements, without which expenses would have been higher. |
| 2. | Excludes the fees and expenses of the acquired (underlying) funds in which the Fund invested. |
What factors influenced Fund performance during the reporting period?
During the 12-month reporting period ended April 30, 2026, the Fund’s performance relative to the internally maintained blend of indices that are taken into account when managing the Fund, as well as the Conservative Allocation Composite Index, was affected by various allocation and selection factors. Most notably, relative returns benefited from effective asset class positioning, specifically tactical exposure to convertible bonds and emerging market debt alongside an overweight in emerging market equities. An internal skew toward quality small-cap U.S. equities acted as a modest headwind.
The following table outlines the key factors (securities, sectors, industries, market events and/or other characteristics) that materially affected the Fund’s performance during the reporting period.
| Key Factor | Summary | Impact |
| Internal benchmarking | Benefited from granular management approach that included mid- and small-cap stocks, emerging-markets equities and high yield | Contributed |
| Overweight in emerging market equities | Bolstered particularly by ex-China exposure, with noteworthy gains from chip manufacturers (TSMC, Samsung, SK Hynix) | Contributed |
| Off-benchmark exposure to convertible bonds | Sensitivity to growth equities | Contributed |
| Stock/bond blend | A modest but persistent tilt favoring stocks over bonds | Contributed |
| Quality | An emphasis on quality (positive and relatively stable earnings) within small caps during a period in which unprofitable tech with high growth expectations led the market higher | Detracted |
| Developed international exposure | A brief tactical overweight in non-U.S. developed markets, across both large- and small-cap companies | Detracted |
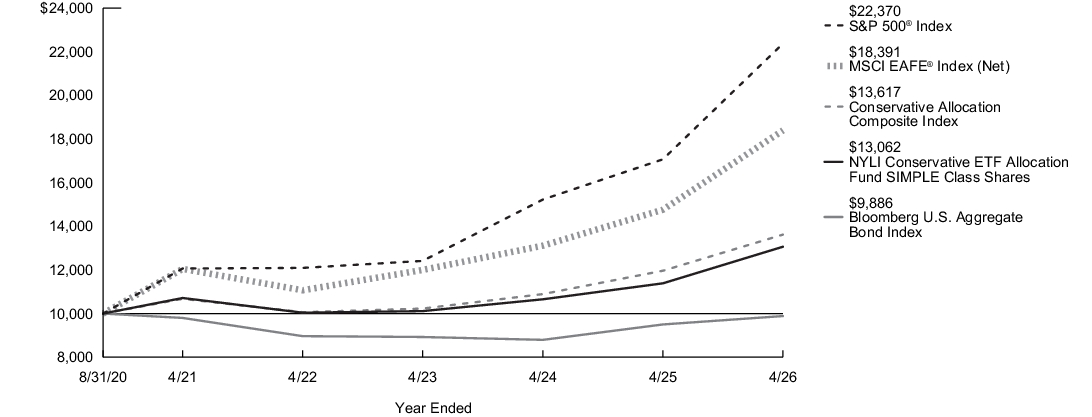
Fund Performance
The following graph compares the initial and subsequent account values at the end of each of the most recently completed 10 fiscal years of the Fund (or for the life of the Fund, if shorter). It assumes a $10,000 initial investment at the beginning of the first fiscal year in an appropriate, broad-based securities market index and other indexes, if applicable, for the same period and reflects the deduction of all sales charges, where applicable.
| Average Annual Total Returns for the Year Ended April 30, 2026 | Inception Date |
One Year |
Five Years |
Since Inception |
| SIMPLE Class Shares | 8/31/2020 | 14.72% | 4.04% | 4.83% |
| Bloomberg U.S. Aggregate Bond Index1 | 4.06% | 0.18% | (0.20)% | |
| S&P 500®Index2 | 31.05% | 13.14% | 15.27% | |
| MSCI EAFE® Index (Net)3 | 24.60% | 8.83% | 11.35% | |
| Conservative Allocation Composite Index4 | 13.83% | 4.99% | 5.60% | |
| Morningstar Global Moderately Conservative Allocation Category Average5 | 15.55% | 4.32% | 5.67% |
| 1. |
The Fund has selected the Bloomberg U.S. Aggregate Bond Index to represent a broad measure of market performance, and is generally representative of the market sectors or types of investments in which the Fund invests. The Bloomberg U.S. Aggregate Bond Index is a broad-based benchmark that measures the investment grade, U.S. dollar-denominated, fixed-rate taxable bond market, including Treasuries, government-related and corporate securities, mortgage-backed securities (agency fixed-rate and hybrid adjustable rate mortgage pass-throughs), asset-backed securities and commercial mortgage-backed securities. |
| 2. |
The S&P 500® Index, which represents a broad measure of market performance, is generally representative of the market sectors or types of investments in which the Fund invests. S&P® and S&P 500® are registered trademarks of Standard & Poor’s Financial Services LLC. The S&P 500® Index is widely regarded as the standard index for measuring large-cap U.S. stock market performance. |
| 3. |
The MSCI EAFE® Index (Net), which is generally representative of the market sectors or types of investments in which the Fund invests, consists of international stocks representing the developed world outside of North America. |
| 4. |
The Conservative Allocation Composite Index, which is generally representative of the market sectors or types of investments in which the Fund invests, consists of the Bloomberg U.S. Aggregate Bond Index, the S&P 500® Index and the MSCI EAFE® Index (Net) weighted 60%, 30% and 10%, respectively. |
| 5. |
The Morningstar Global Moderately Conservative Allocation Category Average is representative of funds in allocation categories that seek to provide both income and capital appreciation by primarily investing in multiple asset classes, including stocks, bonds, and cash. These moderately conservative strategies prioritize the preservation of capital over appreciation. They typically expect volatility similar to a strategic equity exposure between 30% and 50%. Results are based on average total returns of similar funds with all dividends and capital gain distributions reinvested. |
Key Fund Statistics
| Fund's net assets | $61,635,173 |
| Total number of portfolio holdings | 16 |
| Total advisory fees paid | $96,173 |
| Portfolio turnover rate | 55% |
Asset Diversification
(as a Percentage of Net Asset Value)
(as a Percentage of Net Asset Value)
| Fixed Income Funds | 54.3% |
| Equity Funds | 42.5% |
| Short-Term Investments | 5.1% |
| Other Assets, Less Liabilities | (1.9)% |
What were the Fund costs for the last year?
(Based on a hypothetical $10,000 investment)
| Share Class Name | Costs of a $10,000 investment | Costs paid as a percentage of a $10,000 investment1,2 |
| Class R3 | $124 | 1.15% |
| 1. | Reflects fee waivers and/or expense reimbursements, without which expenses would have been higher. |
| 2. | Excludes the fees and expenses of the acquired (underlying) funds in which the Fund invested. |
What factors influenced Fund performance during the reporting period?
During the 12-month reporting period ended April 30, 2026, the Fund’s performance relative to the internally maintained blend of indices that are taken into account when managing the Fund, as well as the Conservative Allocation Composite Index, was affected by various allocation and selection factors. Most notably, relative returns benefited from effective asset class positioning, specifically tactical exposure to convertible bonds and emerging market debt alongside an overweight in emerging market equities. An internal skew toward quality small-cap U.S. equities acted as a modest headwind.
The following table outlines the key factors (securities, sectors, industries, market events and/or other characteristics) that materially affected the Fund’s performance during the reporting period.
| Key Factor | Summary | Impact |
| Internal benchmarking | Benefited from granular management approach that included mid- and small-cap stocks, emerging-markets equities and high yield | Contributed |
| Overweight in emerging market equities | Bolstered particularly by ex-China exposure, with noteworthy gains from chip manufacturers (TSMC, Samsung, SK Hynix) | Contributed |
| Off-benchmark exposure to convertible bonds | Sensitivity to growth equities | Contributed |
| Stock/bond blend | A modest but persistent tilt favoring stocks over bonds | Contributed |
| Quality | An emphasis on quality (positive and relatively stable earnings) within small caps during a period in which unprofitable tech with high growth expectations led the market higher | Detracted |
| Developed international exposure | A brief tactical overweight in non-U.S. developed markets, across both large- and small-cap companies | Detracted |
Fund Performance
The following graph compares the initial and subsequent account values at the end of each of the most recently completed 10 fiscal years of the Fund (or for the life of the Fund, if shorter). It assumes a $10,000 initial investment at the beginning of the first fiscal year in an appropriate, broad-based securities market index and other indexes, if applicable, for the same period and reflects the deduction of all sales charges, where applicable.

| Average Annual Total Returns for the Year Ended April 30, 2026 | Inception Date |
One Year |
Five Years |
Since Inception |
| Class R3 Shares | 6/30/2020 | 14.61% | 3.93% | 5.38% |
| Bloomberg U.S. Aggregate Bond Index1 | 4.06% | 0.18% | (0.08)% | |
| S&P 500®Index2 | 31.05% | 13.14% | 17.27% | |
| MSCI EAFE® Index (Net)3 | 24.60% | 8.83% | 12.41% | |
| Conservative Allocation Composite Index4 | 13.83% | 4.99% | 6.33% | |
| Morningstar Global Moderately Conservative Allocation Category Average5 | 15.55% | 4.32% | 6.40% |
| 1. |
The Fund has selected the Bloomberg U.S. Aggregate Bond Index to represent a broad measure of market performance, and is generally representative of the market sectors or types of investments in which the Fund invests. The Bloomberg U.S. Aggregate Bond Index is a broad-based benchmark that measures the investment grade, U.S. dollar-denominated, fixed-rate taxable bond market, including Treasuries, government-related and corporate securities, mortgage-backed securities (agency fixed-rate and hybrid adjustable rate mortgage pass-throughs), asset-backed securities and commercial mortgage-backed securities. |
| 2. |
The S&P 500® Index, which represents a broad measure of market performance, is generally representative of the market sectors or types of investments in which the Fund invests. S&P® and S&P 500® are registered trademarks of Standard & Poor’s Financial Services LLC. The S&P 500® Index is widely regarded as the standard index for measuring large-cap U.S. stock market performance. |
| 3. |
The MSCI EAFE® Index (Net), which is generally representative of the market sectors or types of investments in which the Fund invests, consists of international stocks representing the developed world outside of North America. |
| 4. |
The Conservative Allocation Composite Index, which is generally representative of the market sectors or types of investments in which the Fund invests, consists of the Bloomberg U.S. Aggregate Bond Index, the S&P 500® Index and the MSCI EAFE® Index (Net) weighted 60%, 30% and 10%, respectively. |
| 5. |
The Morningstar Global Moderately Conservative Allocation Category Average is representative of funds in allocation categories that seek to provide both income and capital appreciation by primarily investing in multiple asset classes, including stocks, bonds, and cash. These moderately conservative strategies prioritize the preservation of capital over appreciation. They typically expect volatility similar to a strategic equity exposure between 30% and 50%. Results are based on average total returns of similar funds with all dividends and capital gain distributions reinvested. |
Key Fund Statistics
| Fund's net assets | $61,635,173 |
| Total number of portfolio holdings | 16 |
| Total advisory fees paid | $96,173 |
| Portfolio turnover rate | 55% |
Asset Diversification
(as a Percentage of Net Asset Value)
(as a Percentage of Net Asset Value)
| Fixed Income Funds | 54.3% |
| Equity Funds | 42.5% |
| Short-Term Investments | 5.1% |
| Other Assets, Less Liabilities | (1.9)% |
What were the Fund costs for the last year?
(Based on a hypothetical $10,000 investment)
| Share Class Name | Costs of a $10,000 investment | Costs paid as a percentage of a $10,000 investment1,2 |
| Class I | $59 | 0.55% |
| 1. | Reflects fee waivers and/or expense reimbursements, without which expenses would have been higher. |
| 2. | Excludes the fees and expenses of the acquired (underlying) funds in which the Fund invested. |
What factors influenced Fund performance during the reporting period?
During the 12-month reporting period ended April 30, 2026, the Fund’s performance relative to the internally maintained blend of indices that are taken into account when managing the Fund, as well as the Conservative Allocation Composite Index, was affected by various allocation and selection factors. Most notably, relative returns benefited from effective asset class positioning, specifically tactical exposure to convertible bonds and emerging market debt alongside an overweight in emerging market equities. An internal skew toward quality small-cap U.S. equities acted as a modest headwind.
The following table outlines the key factors (securities, sectors, industries, market events and/or other characteristics) that materially affected the Fund’s performance during the reporting period.
| Key Factor | Summary | Impact |
| Internal benchmarking | Benefited from granular management approach that included mid- and small-cap stocks, emerging-markets equities and high yield | Contributed |
| Overweight in emerging market equities | Bolstered particularly by ex-China exposure, with noteworthy gains from chip manufacturers (TSMC, Samsung, SK Hynix) | Contributed |
| Off-benchmark exposure to convertible bonds | Sensitivity to growth equities | Contributed |
| Stock/bond blend | A modest but persistent tilt favoring stocks over bonds | Contributed |
| Quality | An emphasis on quality (positive and relatively stable earnings) within small caps during a period in which unprofitable tech with high growth expectations led the market higher | Detracted |
| Developed international exposure | A brief tactical overweight in non-U.S. developed markets, across both large- and small-cap companies | Detracted |
Fund Performance
The following graph compares the initial and subsequent account values at the end of each of the most recently completed 10 fiscal years of the Fund (or for the life of the Fund, if shorter). It assumes a $10,000 initial investment at the beginning of the first fiscal year in an appropriate, broad-based securities market index and other indexes, if applicable, for the same period and reflects the deduction of all sales charges, where applicable.
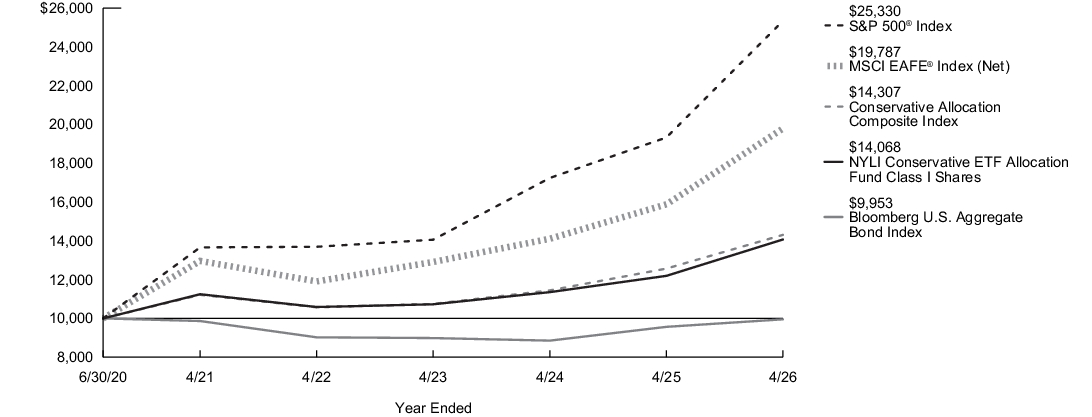
| Average Annual Total Returns for the Year Ended April 30, 2026 | Inception Date |
One Year |
Five Years |
Since Inception |
| Class I Shares | 6/30/2020 | 15.37% | 4.58% | 6.03% |
| Bloomberg U.S. Aggregate Bond Index1 | 4.06% | 0.18% | (0.08)% | |
| S&P 500®Index2 | 31.05% | 13.14% | 17.27% | |
| MSCI EAFE® Index (Net)3 | 24.60% | 8.83% | 12.41% | |
| Conservative Allocation Composite Index4 | 13.83% | 4.99% | 6.33% | |
| Morningstar Global Moderately Conservative Allocation Category Average5 | 15.55% | 4.32% | 6.40% |
| 1. |
The Fund has selected the Bloomberg U.S. Aggregate Bond Index to represent a broad measure of market performance, and is generally representative of the market sectors or types of investments in which the Fund invests. The Bloomberg U.S. Aggregate Bond Index is a broad-based benchmark that measures the investment grade, U.S. dollar-denominated, fixed-rate taxable bond market, including Treasuries, government-related and corporate securities, mortgage-backed securities (agency fixed-rate and hybrid adjustable rate mortgage pass-throughs), asset-backed securities and commercial mortgage-backed securities. |
| 2. |
The S&P 500® Index, which represents a broad measure of market performance, is generally representative of the market sectors or types of investments in which the Fund invests. S&P® and S&P 500® are registered trademarks of Standard & Poor’s Financial Services LLC. The S&P 500® Index is widely regarded as the standard index for measuring large-cap U.S. stock market performance. |
| 3. |
The MSCI EAFE® Index (Net), which is generally representative of the market sectors or types of investments in which the Fund invests, consists of international stocks representing the developed world outside of North America. |
| 4. |
The Conservative Allocation Composite Index, which is generally representative of the market sectors or types of investments in which the Fund invests, consists of the Bloomberg U.S. Aggregate Bond Index, the S&P 500® Index and the MSCI EAFE® Index (Net) weighted 60%, 30% and 10%, respectively. |
| 5. |
The Morningstar Global Moderately Conservative Allocation Category Average is representative of funds in allocation categories that seek to provide both income and capital appreciation by primarily investing in multiple asset classes, including stocks, bonds, and cash. These moderately conservative strategies prioritize the preservation of capital over appreciation. They typically expect volatility similar to a strategic equity exposure between 30% and 50%. Results are based on average total returns of similar funds with all dividends and capital gain distributions reinvested. |
Key Fund Statistics
| Fund's net assets | $61,635,173 |
| Total number of portfolio holdings | 16 |
| Total advisory fees paid | $96,173 |
| Portfolio turnover rate | 55% |
Asset Diversification
(as a Percentage of Net Asset Value)
(as a Percentage of Net Asset Value)
| Fixed Income Funds | 54.3% |
| Equity Funds | 42.5% |
| Short-Term Investments | 5.1% |
| Other Assets, Less Liabilities | (1.9)% |
What were the Fund costs for the last year?
(Based on a hypothetical $10,000 investment)
| Share Class Name | Costs of a $10,000 investment | Costs paid as a percentage of a $10,000 investment1,2 |
| Class C | $166 | 1.55% |
| 1. | Reflects fee waivers and/or expense reimbursements, without which expenses would have been higher. |
| 2. | Excludes the fees and expenses of the acquired (underlying) funds in which the Fund invested. |
What factors influenced Fund performance during the reporting period?
During the 12-month reporting period ended April 30, 2026, the Fund’s performance relative to the internally maintained blend of indices that are taken into account when managing the Fund, as well as the Conservative Allocation Composite Index, was affected by various allocation and selection factors. Most notably, relative returns benefited from effective asset class positioning, specifically tactical exposure to convertible bonds and emerging market debt alongside an overweight in emerging market equities. An internal skew toward quality small-cap U.S. equities acted as a modest headwind.
The following table outlines the key factors (securities, sectors, industries, market events and/or other characteristics) that materially affected the Fund’s performance during the reporting period.
| Key Factor | Summary | Impact |
| Internal benchmarking | Benefited from granular management approach that included mid- and small-cap stocks, emerging-markets equities and high yield | Contributed |
| Overweight in emerging market equities | Bolstered particularly by ex-China exposure, with noteworthy gains from chip manufacturers (TSMC, Samsung, SK Hynix) | Contributed |
| Off-benchmark exposure to convertible bonds | Sensitivity to growth equities | Contributed |
| Stock/bond blend | A modest but persistent tilt favoring stocks over bonds | Contributed |
| Quality | An emphasis on quality (positive and relatively stable earnings) within small caps during a period in which unprofitable tech with high growth expectations led the market higher | Detracted |
| Developed international exposure | A brief tactical overweight in non-U.S. developed markets, across both large- and small-cap companies | Detracted |
Fund Performance
The following graph compares the initial and subsequent account values at the end of each of the most recently completed 10 fiscal years of the Fund (or for the life of the Fund, if shorter). It assumes a $10,000 initial investment at the beginning of the first fiscal year in an appropriate, broad-based securities market index and other indexes, if applicable, for the same period and reflects the deduction of all sales charges, where applicable.
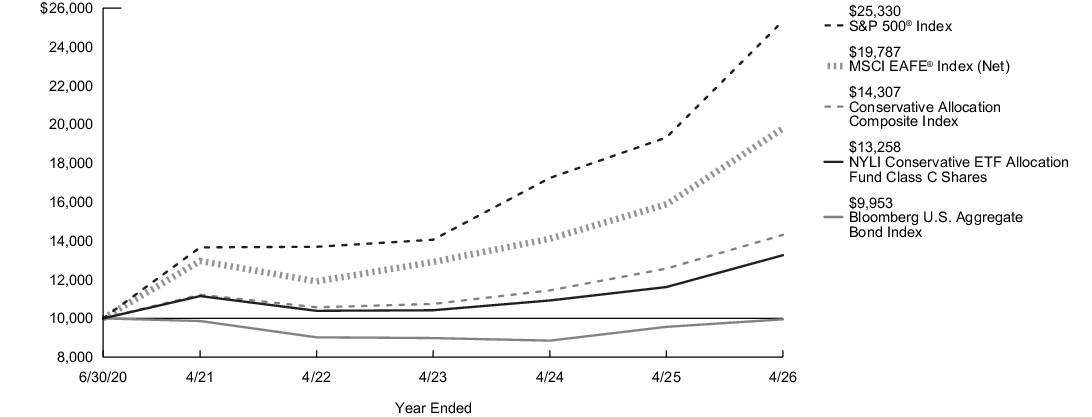
| Average Annual Total Returns for the Year Ended April 30, 2026 | Inception Date |
One Year |
Five Years |
Since Inception |
| Class C Shares - Including sales charges | 6/30/2020 | 13.13% | 3.52% | 4.95% |
| Class C Shares - Excluding sales charges | 14.13% | 3.52% | 4.95% | |
| Bloomberg U.S. Aggregate Bond Index1 | 4.06% | 0.18% | (0.08)% | |
| S&P 500®Index2 | 31.05% | 13.14% | 17.27% | |
| MSCI EAFE® Index (Net)3 | 24.60% | 8.83% | 12.41% | |
| Conservative Allocation Composite Index4 | 13.83% | 4.99% | 6.33% | |
| Morningstar Global Moderately Conservative Allocation Category Average5 | 15.55% | 4.32% | 6.40% |
| 1. |
The Fund has selected the Bloomberg U.S. Aggregate Bond Index to represent a broad measure of market performance, and is generally representative of the market sectors or types of investments in which the Fund invests. The Bloomberg U.S. Aggregate Bond Index is a broad-based benchmark that measures the investment grade, U.S. dollar-denominated, fixed-rate taxable bond market, including Treasuries, government-related and corporate securities, mortgage-backed securities (agency fixed-rate and hybrid adjustable rate mortgage pass-throughs), asset-backed securities and commercial mortgage-backed securities. |
| 2. |
The S&P 500® Index, which represents a broad measure of market performance, is generally representative of the market sectors or types of investments in which the Fund invests. S&P® and S&P 500® are registered trademarks of Standard & Poor’s Financial Services LLC. The S&P 500® Index is widely regarded as the standard index for measuring large-cap U.S. stock market performance. |
| 3. |
The MSCI EAFE® Index (Net), which is generally representative of the market sectors or types of investments in which the Fund invests, consists of international stocks representing the developed world outside of North America. |
| 4. |
The Conservative Allocation Composite Index, which is generally representative of the market sectors or types of investments in which the Fund invests, consists of the Bloomberg U.S. Aggregate Bond Index, the S&P 500® Index and the MSCI EAFE® Index (Net) weighted 60%, 30% and 10%, respectively. |
| 5. |
The Morningstar Global Moderately Conservative Allocation Category Average is representative of funds in allocation categories that seek to provide both income and capital appreciation by primarily investing in multiple asset classes, including stocks, bonds, and cash. These moderately conservative strategies prioritize the preservation of capital over appreciation. They typically expect volatility similar to a strategic equity exposure between 30% and 50%. Results are based on average total returns of similar funds with all dividends and capital gain distributions reinvested. |
Key Fund Statistics
| Fund's net assets | $61,635,173 |
| Total number of portfolio holdings | 16 |
| Total advisory fees paid | $96,173 |
| Portfolio turnover rate | 55% |
Asset Diversification
(as a Percentage of Net Asset Value)
(as a Percentage of Net Asset Value)
| Fixed Income Funds | 54.3% |
| Equity Funds | 42.5% |
| Short-Term Investments | 5.1% |
| Other Assets, Less Liabilities | (1.9)% |
What were the Fund costs for the last year?
(Based on a hypothetical $10,000 investment)
| Share Class Name | Costs of a $10,000 investment | Costs paid as a percentage of a $10,000 investment1,2 |
| Class A | $86 | 0.80% |
| 1. | Reflects fee waivers and/or expense reimbursements, without which expenses would have been higher. |
| 2. | Excludes the fees and expenses of the acquired (underlying) funds in which the Fund invested. |
What factors influenced Fund performance during the reporting period?
During the 12-month reporting period ended April 30, 2026, the Fund’s performance relative to the internally maintained blend of indices that are taken into account when managing the Fund, as well as the Conservative Allocation Composite Index, was affected by various allocation and selection factors. Most notably, relative returns benefited from effective asset class positioning, specifically tactical exposure to convertible bonds and emerging market debt alongside an overweight in emerging market equities. An internal skew toward quality small-cap U.S. equities acted as a modest headwind.
The following table outlines the key factors (securities, sectors, industries, market events and/or other characteristics) that materially affected the Fund’s performance during the reporting period.
| Key Factor | Summary | Impact |
| Internal benchmarking | Benefited from granular management approach that included mid- and small-cap stocks, emerging-markets equities and high yield | Contributed |
| Overweight in emerging market equities | Bolstered particularly by ex-China exposure, with noteworthy gains from chip manufacturers (TSMC, Samsung, SK Hynix) | Contributed |
| Off-benchmark exposure to convertible bonds | Sensitivity to growth equities | Contributed |
| Stock/bond blend | A modest but persistent tilt favoring stocks over bonds | Contributed |
| Quality | An emphasis on quality (positive and relatively stable earnings) within small caps during a period in which unprofitable tech with high growth expectations led the market higher | Detracted |
| Developed international exposure | A brief tactical overweight in non-U.S. developed markets, across both large- and small-cap companies | Detracted |
Fund Performance
The following graph compares the initial and subsequent account values at the end of each of the most recently completed 10 fiscal years of the Fund (or for the life of the Fund, if shorter). It assumes a $10,000 initial investment at the beginning of the first fiscal year in an appropriate, broad-based securities market index and other indexes, if applicable, for the same period and reflects the deduction of all sales charges, where applicable.
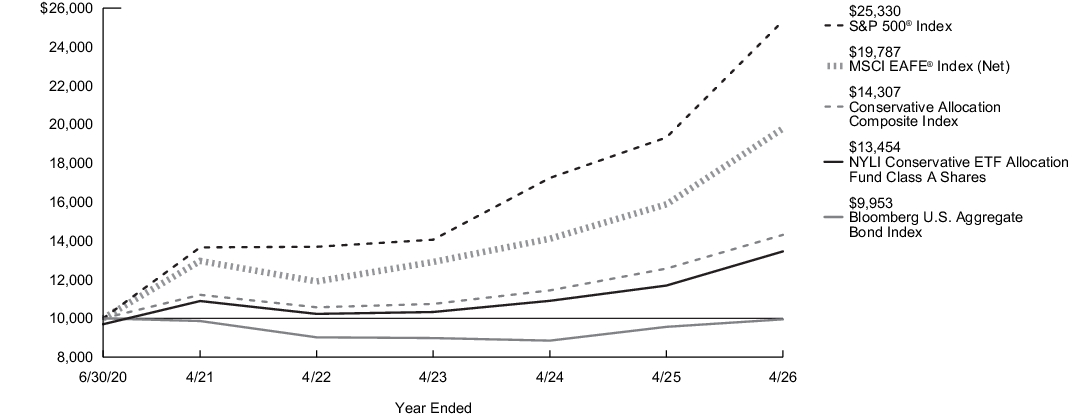
| Average Annual Total Returns for the Year Ended April 30, 2026 | Inception Date |
One Year |
Five Years |
Since Inception |
| Class A Shares - Including sales charges | 6/30/2020 | 11.61% | 3.68% | 5.22% |
| Class A Shares - Excluding sales charges | 15.06% | 4.31% | 5.77% | |
| Bloomberg U.S. Aggregate Bond Index1 | 4.06% | 0.18% | (0.08)% | |
| S&P 500®Index2 | 31.05% | 13.14% | 17.27% | |
| MSCI EAFE® Index (Net)3 | 24.60% | 8.83% | 12.41% | |
| Conservative Allocation Composite Index4 | 13.83% | 4.99% | 6.33% | |
| Morningstar Global Moderately Conservative Allocation Category Average5 | 15.55% | 4.32% | 6.40% |
| 1. |
The Fund has selected the Bloomberg U.S. Aggregate Bond Index to represent a broad measure of market performance, and is generally representative of the market sectors or types of investments in which the Fund invests. The Bloomberg U.S. Aggregate Bond Index is a broad-based benchmark that measures the investment grade, U.S. dollar-denominated, fixed-rate taxable bond market, including Treasuries, government-related and corporate securities, mortgage-backed securities (agency fixed-rate and hybrid adjustable rate mortgage pass-throughs), asset-backed securities and commercial mortgage-backed securities. |
| 2. |
The S&P 500® Index, which represents a broad measure of market performance, is generally representative of the market sectors or types of investments in which the Fund invests. S&P® and S&P 500® are registered trademarks of Standard & Poor’s Financial Services LLC. The S&P 500® Index is widely regarded as the standard index for measuring large-cap U.S. stock market performance. |
| 3. |
The MSCI EAFE® Index (Net), which is generally representative of the market sectors or types of investments in which the Fund invests, consists of international stocks representing the developed world outside of North America. |
| 4. |
The Conservative Allocation Composite Index, which is generally representative of the market sectors or types of investments in which the Fund invests, consists of the Bloomberg U.S. Aggregate Bond Index, the S&P 500® Index and the MSCI EAFE® Index (Net) weighted 60%, 30% and 10%, respectively. |
| 5. |
The Morningstar Global Moderately Conservative Allocation Category Average is representative of funds in allocation categories that seek to provide both income and capital appreciation by primarily investing in multiple asset classes, including stocks, bonds, and cash. These moderately conservative strategies prioritize the preservation of capital over appreciation. They typically expect volatility similar to a strategic equity exposure between 30% and 50%. Results are based on average total returns of similar funds with all dividends and capital gain distributions reinvested. |
Key Fund Statistics
| Fund's net assets | $61,635,173 |
| Total number of portfolio holdings | 16 |
| Total advisory fees paid | $96,173 |
| Portfolio turnover rate | 55% |
Asset Diversification
(as a Percentage of Net Asset Value)
(as a Percentage of Net Asset Value)
| Fixed Income Funds | 54.3% |
| Equity Funds | 42.5% |
| Short-Term Investments | 5.1% |
| Other Assets, Less Liabilities | (1.9)% |
What were the Fund costs for the last year?
(Based on a hypothetical $10,000 investment)
| Share Class Name | Costs of a $10,000 investment | Costs paid as a percentage of a $10,000 investment1 |
| Class A | $77 | 0.67% |
| 1. | Excludes the fees and expenses of the acquired (underlying) funds in which the Fund invested. |
What factors influenced Fund performance during the reporting period?
During the 12-month reporting period ended April 30, 2026, the Fund’s performance relative to the internally maintained blend of indices that are taken into account when managing the Fund, as well as the Equity Allocation Composite Index, was affected by various allocation and selection factors. Relative returns benefited from exposure to emerging-markets equities. A skew toward quality U.S. small-cap names and a brief tactical tilt favoring non-U.S. developed markets detracted.
The following table outlines the key factors (securities, sectors, industries, market events and/or other characteristics) that materially affected the Fund’s performance during the reporting period.
| Key Factor | Summary | Impact |
| Internal benchmarking | Benefited from granular management approach that included mid- and small-cap stocks, as well as emerging-markets equities | Contributed |
| Overweight in emerging market equities | Bolstered particularly by ex-China exposure, with noteworthy gains from chip manufacturers (TSMC, Samsung, SK Hynix) | Contributed |
| Quality | An emphasis on quality (positive and relatively stable earnings) within small caps during a period in which unprofitable tech with high growth expectations led the market higher | Detracted |
| Developed international exposure | A brief tactical overweight in non-U.S. developed markets, across both large- and small-cap companies | Detracted |
Fund Performance
The following graph compares the initial and subsequent account values at the end of each of the most recently completed 10 fiscal years of the Fund (or for the life of the Fund, if shorter). It assumes a $10,000 initial investment at the beginning of the first fiscal year in an appropriate, broad-based securities market index and other indexes, if applicable, for the same period and reflects the deduction of all sales charges, where applicable.

| Average Annual Total Returns for the Year Ended April 30, 2026 | Inception Date |
One Year |
Five Years |
Since Inception |
| Class A Shares - Including sales charges | 6/30/2020 | 27.36% | 8.04% | 12.79% |
| Class A Shares - Excluding sales charges | 31.30% | 8.70% | 13.38% | |
| Russell 3000®Index1 | 31.01% | 11.91% | 16.67% | |
| S&P 500®Index2 | 31.05% | 13.14% | 17.27% | |
| MSCI EAFE® Index (Net)3 | 24.60% | 8.83% | 12.41% | |
| Equity Allocation Composite Index4 | 29.56% | 12.15% | 16.14% | |
| Morningstar Global Aggressive Allocation Category Average5 | 27.23% | 8.12% | 12.89% |
| 1. |
The Fund has selected the Russell 3000® Index to represent a broad measure of market performance. The Russell 3000® Index measures the performance of the largest 3,000 U.S. companies representing approximately 98% of the investable U.S. equity market. |
| 2. |
The S&P 500® Index, which represents a broad measure of market performance, is generally representative of the market sectors or types of investments in which the Fund invests. S&P® and S&P 500® are registered trademarks of Standard & Poor’s Financial Services LLC. The S&P 500® Index is widely regarded as the standard index for measuring large-cap U.S. stock market performance. |
| 3. |
The MSCI EAFE® Index (Net), which is generally representative of the market sectors or types of investments in which the Fund invests, consists of international stocks representing the developed world outside of North America. |
| 4. |
The Equity Allocation Composite Index, which is generally representative of the market sectors or types of investments in which the Fund invests, consists of the S&P 500® Index and the MSCI EAFE® Index (Net) weighted 75% and 25%, respectively. |
| 5. |
The Morningstar Global Aggressive Allocation Category Average is representative of funds in allocation categories that seek to provide both income and capital appreciation by primarily investing in multiple asset classes, including stocks, bonds, and cash. These aggressive strategies typically prioritize capital appreciation over preservation. They typically expect volatility similar to a strategic equity exposure of more than 85%. Results are based on average total returns of similar funds with all dividends and capital gain distributions reinvested. |
Key Fund Statistics
| Fund's net assets | $155,098,629 |
| Total number of portfolio holdings | 11 |
| Total advisory fees paid | $260,755 |
| Portfolio turnover rate | 46% |
Asset Diversification
(as a Percentage of Net Asset Value)
(as a Percentage of Net Asset Value)
| Equity Funds | 99.6% |
| Short-Term Investments | 9.1% |
| Other Assets, Less Liabilities | (8.7)% |
What were the Fund costs for the last year?
(Based on a hypothetical $10,000 investment)
| Share Class Name | Costs of a $10,000 investment | Costs paid as a percentage of a $10,000 investment1 |
| Class C | $164 | 1.42% |
| 1. | Excludes the fees and expenses of the acquired (underlying) funds in which the Fund invested. |
What factors influenced Fund performance during the reporting period?
During the 12-month reporting period ended April 30, 2026, the Fund’s performance relative to the internally maintained blend of indices that are taken into account when managing the Fund, as well as the Equity Allocation Composite Index, was affected by various allocation and selection factors. Relative returns benefited from exposure to emerging-markets equities. A skew toward quality U.S. small-cap names and a brief tactical tilt favoring non-U.S. developed markets detracted.
The following table outlines the key factors (securities, sectors, industries, market events and/or other characteristics) that materially affected the Fund’s performance during the reporting period.
| Key Factor | Summary | Impact |
| Internal benchmarking | Benefited from granular management approach that included mid- and small-cap stocks, as well as emerging-markets equities | Contributed |
| Overweight in emerging market equities | Bolstered particularly by ex-China exposure, with noteworthy gains from chip manufacturers (TSMC, Samsung, SK Hynix) | Contributed |
| Quality | An emphasis on quality (positive and relatively stable earnings) within small caps during a period in which unprofitable tech with high growth expectations led the market higher | Detracted |
| Developed international exposure | A brief tactical overweight in non-U.S. developed markets, across both large- and small-cap companies | Detracted |
Fund Performance
The following graph compares the initial and subsequent account values at the end of each of the most recently completed 10 fiscal years of the Fund (or for the life of the Fund, if shorter). It assumes a $10,000 initial investment at the beginning of the first fiscal year in an appropriate, broad-based securities market index and other indexes, if applicable, for the same period and reflects the deduction of all sales charges, where applicable.
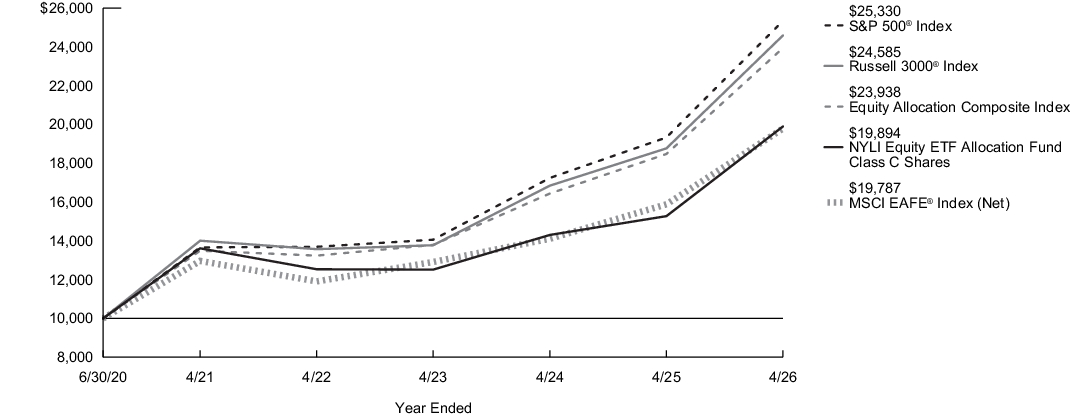
| Average Annual Total Returns for the Year Ended April 30, 2026 | Inception Date |
One Year |
Five Years |
Since Inception |
| Class C Shares - Including sales charges | 6/30/2020 | 29.26% | 7.88% | 12.52% |
| Class C Shares - Excluding sales charges | 30.26% | 7.88% | 12.52% | |
| Russell 3000®Index1 | 31.01% | 11.91% | 16.67% | |
| S&P 500®Index2 | 31.05% | 13.14% | 17.27% | |
| MSCI EAFE® Index (Net)3 | 24.60% | 8.83% | 12.41% | |
| Equity Allocation Composite Index4 | 29.56% | 12.15% | 16.14% | |
| Morningstar Global Aggressive Allocation Category Average5 | 27.23% | 8.12% | 12.89% |
| 1. |
The Fund has selected the Russell 3000® Index to represent a broad measure of market performance. The Russell 3000® Index measures the performance of the largest 3,000 U.S. companies representing approximately 98% of the investable U.S. equity market. |
| 2. |
The S&P 500® Index, which represents a broad measure of market performance, is generally representative of the market sectors or types of investments in which the Fund invests. S&P® and S&P 500® are registered trademarks of Standard & Poor’s Financial Services LLC. The S&P 500® Index is widely regarded as the standard index for measuring large-cap U.S. stock market performance. |
| 3. |
The MSCI EAFE® Index (Net), which is generally representative of the market sectors or types of investments in which the Fund invests, consists of international stocks representing the developed world outside of North America. |
| 4. |
The Equity Allocation Composite Index, which is generally representative of the market sectors or types of investments in which the Fund invests, consists of the S&P 500® Index and the MSCI EAFE® Index (Net) weighted 75% and 25%, respectively. |
| 5. |
The Morningstar Global Aggressive Allocation Category Average is representative of funds in allocation categories that seek to provide both income and capital appreciation by primarily investing in multiple asset classes, including stocks, bonds, and cash. These aggressive strategies typically prioritize capital appreciation over preservation. They typically expect volatility similar to a strategic equity exposure of more than 85%. Results are based on average total returns of similar funds with all dividends and capital gain distributions reinvested. |
Key Fund Statistics
| Fund's net assets | $155,098,629 |
| Total number of portfolio holdings | 11 |
| Total advisory fees paid | $260,755 |
| Portfolio turnover rate | 46% |
Asset Diversification
(as a Percentage of Net Asset Value)
(as a Percentage of Net Asset Value)
| Equity Funds | 99.6% |
| Short-Term Investments | 9.1% |
| Other Assets, Less Liabilities | (8.7)% |
What were the Fund costs for the last year?
(Based on a hypothetical $10,000 investment)
| Share Class Name | Costs of a $10,000 investment | Costs paid as a percentage of a $10,000 investment1 |
| Class I | $48 | 0.42% |
| 1. | Excludes the fees and expenses of the acquired (underlying) funds in which the Fund invested. |
What factors influenced Fund performance during the reporting period?
During the 12-month reporting period ended April 30, 2026, the Fund’s performance relative to the internally maintained blend of indices that are taken into account when managing the Fund, as well as the Equity Allocation Composite Index, was affected by various allocation and selection factors. Relative returns benefited from exposure to emerging-markets equities. A skew toward quality U.S. small-cap names and a brief tactical tilt favoring non-U.S. developed markets detracted.
The following table outlines the key factors (securities, sectors, industries, market events and/or other characteristics) that materially affected the Fund’s performance during the reporting period.
| Key Factor | Summary | Impact |
| Internal benchmarking | Benefited from granular management approach that included mid- and small-cap stocks, as well as emerging-markets equities | Contributed |
| Overweight in emerging market equities | Bolstered particularly by ex-China exposure, with noteworthy gains from chip manufacturers (TSMC, Samsung, SK Hynix) | Contributed |
| Quality | An emphasis on quality (positive and relatively stable earnings) within small caps during a period in which unprofitable tech with high growth expectations led the market higher | Detracted |
| Developed international exposure | A brief tactical overweight in non-U.S. developed markets, across both large- and small-cap companies | Detracted |
Fund Performance
The following graph compares the initial and subsequent account values at the end of each of the most recently completed 10 fiscal years of the Fund (or for the life of the Fund, if shorter). It assumes a $10,000 initial investment at the beginning of the first fiscal year in an appropriate, broad-based securities market index and other indexes, if applicable, for the same period and reflects the deduction of all sales charges, where applicable.
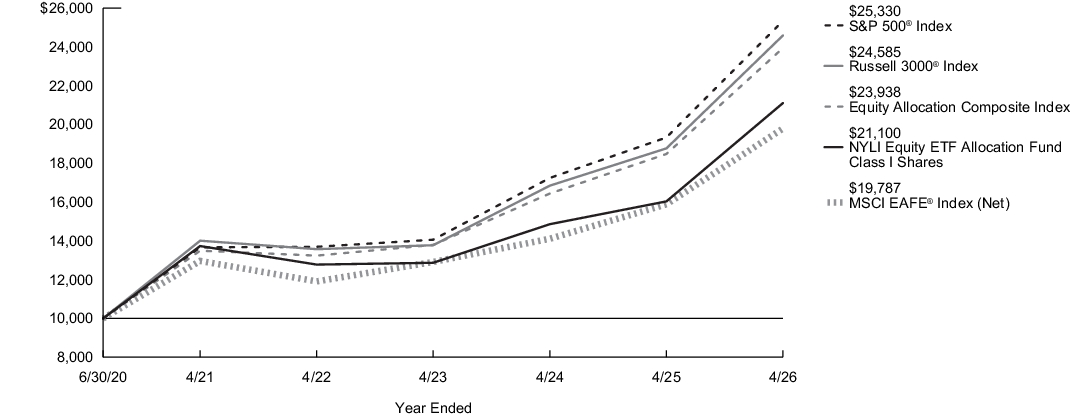
| Average Annual Total Returns for the Year Ended April 30, 2026 | Inception Date |
One Year |
Five Years |
Since Inception |
| Class I Shares | 6/30/2020 | 31.61% | 8.97% | 13.66% |
| Russell 3000®Index1 | 31.01% | 11.91% | 16.67% | |
| S&P 500®Index2 | 31.05% | 13.14% | 17.27% | |
| MSCI EAFE® Index (Net)3 | 24.60% | 8.83% | 12.41% | |
| Equity Allocation Composite Index4 | 29.56% | 12.15% | 16.14% | |
| Morningstar Global Aggressive Allocation Category Average5 | 27.23% | 8.12% | 12.89% |
| 1. |
The Fund has selected the Russell 3000® Index to represent a broad measure of market performance. The Russell 3000® Index measures the performance of the largest 3,000 U.S. companies representing approximately 98% of the investable U.S. equity market. |
| 2. |
The S&P 500® Index, which represents a broad measure of market performance, is generally representative of the market sectors or types of investments in which the Fund invests. S&P® and S&P 500® are registered trademarks of Standard & Poor’s Financial Services LLC. The S&P 500® Index is widely regarded as the standard index for measuring large-cap U.S. stock market performance. |
| 3. |
The MSCI EAFE® Index (Net), which is generally representative of the market sectors or types of investments in which the Fund invests, consists of international stocks representing the developed world outside of North America. |
| 4. |
The Equity Allocation Composite Index, which is generally representative of the market sectors or types of investments in which the Fund invests, consists of the S&P 500® Index and the MSCI EAFE® Index (Net) weighted 75% and 25%, respectively. |
| 5. |
The Morningstar Global Aggressive Allocation Category Average is representative of funds in allocation categories that seek to provide both income and capital appreciation by primarily investing in multiple asset classes, including stocks, bonds, and cash. These aggressive strategies typically prioritize capital appreciation over preservation. They typically expect volatility similar to a strategic equity exposure of more than 85%. Results are based on average total returns of similar funds with all dividends and capital gain distributions reinvested. |
Key Fund Statistics
| Fund's net assets | $155,098,629 |
| Total number of portfolio holdings | 11 |
| Total advisory fees paid | $260,755 |
| Portfolio turnover rate | 46% |
Asset Diversification
(as a Percentage of Net Asset Value)
(as a Percentage of Net Asset Value)
| Equity Funds | 99.6% |
| Short-Term Investments | 9.1% |
| Other Assets, Less Liabilities | (8.7)% |
What were the Fund costs for the last year?
(Based on a hypothetical $10,000 investment)
| Share Class Name | Costs of a $10,000 investment | Costs paid as a percentage of a $10,000 investment1 |
| Class R3 | $118 | 1.02% |
| 1. | Excludes the fees and expenses of the acquired (underlying) funds in which the Fund invested. |
What factors influenced Fund performance during the reporting period?
During the 12-month reporting period ended April 30, 2026, the Fund’s performance relative to the internally maintained blend of indices that are taken into account when managing the Fund, as well as the Equity Allocation Composite Index, was affected by various allocation and selection factors. Relative returns benefited from exposure to emerging-markets equities. A skew toward quality U.S. small-cap names and a brief tactical tilt favoring non-U.S. developed markets detracted.
The following table outlines the key factors (securities, sectors, industries, market events and/or other characteristics) that materially affected the Fund’s performance during the reporting period.
| Key Factor | Summary | Impact |
| Internal benchmarking | Benefited from granular management approach that included mid- and small-cap stocks, as well as emerging-markets equities | Contributed |
| Overweight in emerging market equities | Bolstered particularly by ex-China exposure, with noteworthy gains from chip manufacturers (TSMC, Samsung, SK Hynix) | Contributed |
| Quality | An emphasis on quality (positive and relatively stable earnings) within small caps during a period in which unprofitable tech with high growth expectations led the market higher | Detracted |
| Developed international exposure | A brief tactical overweight in non-U.S. developed markets, across both large- and small-cap companies | Detracted |
Fund Performance
The following graph compares the initial and subsequent account values at the end of each of the most recently completed 10 fiscal years of the Fund (or for the life of the Fund, if shorter). It assumes a $10,000 initial investment at the beginning of the first fiscal year in an appropriate, broad-based securities market index and other indexes, if applicable, for the same period and reflects the deduction of all sales charges, where applicable.

| Average Annual Total Returns for the Year Ended April 30, 2026 | Inception Date |
One Year |
Five Years |
Since Inception |
| Class R3 Shares | 6/30/2020 | 30.79% | 8.33% | 12.99% |
| Russell 3000®Index1 | 31.01% | 11.91% | 16.67% | |
| S&P 500®Index2 | 31.05% | 13.14% | 17.27% | |
| MSCI EAFE® Index (Net)3 | 24.60% | 8.83% | 12.41% | |
| Equity Allocation Composite Index4 | 29.56% | 12.15% | 16.14% | |
| Morningstar Global Aggressive Allocation Category Average5 | 27.23% | 8.12% | 12.89% |
| 1. |
The Fund has selected the Russell 3000® Index to represent a broad measure of market performance. The Russell 3000® Index measures the performance of the largest 3,000 U.S. companies representing approximately 98% of the investable U.S. equity market. |
| 2. |
The S&P 500® Index, which represents a broad measure of market performance, is generally representative of the market sectors or types of investments in which the Fund invests. S&P® and S&P 500® are registered trademarks of Standard & Poor’s Financial Services LLC. The S&P 500® Index is widely regarded as the standard index for measuring large-cap U.S. stock market performance. |
| 3. |
The MSCI EAFE® Index (Net), which is generally representative of the market sectors or types of investments in which the Fund invests, consists of international stocks representing the developed world outside of North America. |
| 4. |
The Equity Allocation Composite Index, which is generally representative of the market sectors or types of investments in which the Fund invests, consists of the S&P 500® Index and the MSCI EAFE® Index (Net) weighted 75% and 25%, respectively. |
| 5. |
The Morningstar Global Aggressive Allocation Category Average is representative of funds in allocation categories that seek to provide both income and capital appreciation by primarily investing in multiple asset classes, including stocks, bonds, and cash. These aggressive strategies typically prioritize capital appreciation over preservation. They typically expect volatility similar to a strategic equity exposure of more than 85%. Results are based on average total returns of similar funds with all dividends and capital gain distributions reinvested. |
Key Fund Statistics
| Fund's net assets | $155,098,629 |
| Total number of portfolio holdings | 11 |
| Total advisory fees paid | $260,755 |
| Portfolio turnover rate | 46% |
Asset Diversification
(as a Percentage of Net Asset Value)
(as a Percentage of Net Asset Value)
| Equity Funds | 99.6% |
| Short-Term Investments | 9.1% |
| Other Assets, Less Liabilities | (8.7)% |
What were the Fund costs for the last year?
(Based on a hypothetical $10,000 investment)
| Share Class Name | Costs of a $10,000 investment | Costs paid as a percentage of a $10,000 investment1 |
| SIMPLE Class | $107 | 0.92% |
| 1. | Excludes the fees and expenses of the acquired (underlying) funds in which the Fund invested. |
What factors influenced Fund performance during the reporting period?
During the 12-month reporting period ended April 30, 2026, the Fund’s performance relative to the internally maintained blend of indices that are taken into account when managing the Fund, as well as the Equity Allocation Composite Index, was affected by various allocation and selection factors. Relative returns benefited from exposure to emerging-markets equities. A skew toward quality U.S. small-cap names and a brief tactical tilt favoring non-U.S. developed markets detracted.
The following table outlines the key factors (securities, sectors, industries, market events and/or other characteristics) that materially affected the Fund’s performance during the reporting period.
| Key Factor | Summary | Impact |
| Internal benchmarking | Benefited from granular management approach that included mid- and small-cap stocks, as well as emerging-markets equities | Contributed |
| Overweight in emerging market equities | Bolstered particularly by ex-China exposure, with noteworthy gains from chip manufacturers (TSMC, Samsung, SK Hynix) | Contributed |
| Quality | An emphasis on quality (positive and relatively stable earnings) within small caps during a period in which unprofitable tech with high growth expectations led the market higher | Detracted |
| Developed international exposure | A brief tactical overweight in non-U.S. developed markets, across both large- and small-cap companies | Detracted |
Fund Performance
The following graph compares the initial and subsequent account values at the end of each of the most recently completed 10 fiscal years of the Fund (or for the life of the Fund, if shorter). It assumes a $10,000 initial investment at the beginning of the first fiscal year in an appropriate, broad-based securities market index and other indexes, if applicable, for the same period and reflects the deduction of all sales charges, where applicable.
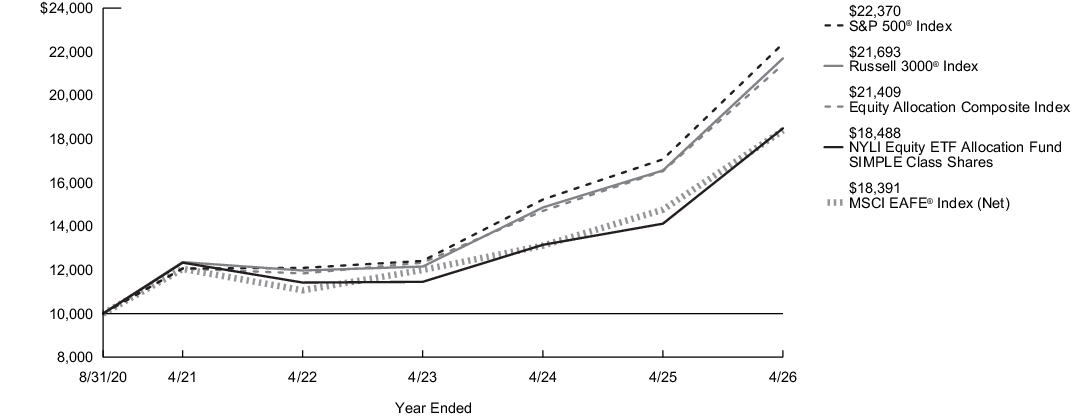
| Average Annual Total Returns for the Year Ended April 30, 2026 | Inception Date |
One Year |
Five Years |
Since Inception |
| SIMPLE Class Shares | 8/31/2020 | 30.94% | 8.44% | 11.45% |
| Russell 3000®Index1 | 31.01% | 11.91% | 14.64% | |
| S&P 500®Index2 | 31.05% | 13.14% | 15.27% | |
| MSCI EAFE® Index (Net)3 | 24.60% | 8.83% | 11.35% | |
| Equity Allocation Composite Index4 | 29.56% | 12.15% | 14.38% | |
| Morningstar Global Aggressive Allocation Category Average5 | 27.23% | 8.12% | 11.48% |
| 1. |
The Fund has selected the Russell 3000® Index to represent a broad measure of market performance. The Russell 3000® Index measures the performance of the largest 3,000 U.S. companies representing approximately 98% of the investable U.S. equity market. |
| 2. |
The S&P 500® Index, which represents a broad measure of market performance, is generally representative of the market sectors or types of investments in which the Fund invests. S&P® and S&P 500® are registered trademarks of Standard & Poor’s Financial Services LLC. The S&P 500® Index is widely regarded as the standard index for measuring large-cap U.S. stock market performance. |
| 3. |
The MSCI EAFE® Index (Net), which is generally representative of the market sectors or types of investments in which the Fund invests, consists of international stocks representing the developed world outside of North America. |
| 4. |
The Equity Allocation Composite Index, which is generally representative of the market sectors or types of investments in which the Fund invests, consists of the S&P 500® Index and the MSCI EAFE® Index (Net) weighted 75% and 25%, respectively. |
| 5. |
The Morningstar Global Aggressive Allocation Category Average is representative of funds in allocation categories that seek to provide both income and capital appreciation by primarily investing in multiple asset classes, including stocks, bonds, and cash. These aggressive strategies typically prioritize capital appreciation over preservation. They typically expect volatility similar to a strategic equity exposure of more than 85%. Results are based on average total returns of similar funds with all dividends and capital gain distributions reinvested. |
Key Fund Statistics
| Fund's net assets | $155,098,629 |
| Total number of portfolio holdings | 11 |
| Total advisory fees paid | $260,755 |
| Portfolio turnover rate | 46% |
Asset Diversification
(as a Percentage of Net Asset Value)
(as a Percentage of Net Asset Value)
| Equity Funds | 99.6% |
| Short-Term Investments | 9.1% |
| Other Assets, Less Liabilities | (8.7)% |
What were the Fund costs for the last year?
(Based on a hypothetical $10,000 investment)
| Share Class Name | Costs of a $10,000 investment | Costs paid as a percentage of a $10,000 investment1 |
| SIMPLE Class | $98 | 0.89% |
| 1. | Excludes the fees and expenses of the acquired (underlying) funds in which the Fund invested. |
What factors influenced Fund performance during the reporting period?
During the 12-month reporting period ended April 30, 2026, the Fund’s performance relative to the internally maintained blend of indices that are taken into account when managing the Fund, as well as the Moderate Allocation Composite Index, was affected by various allocation and selection factors. Most notably, relative returns benefited from effective asset class positioning, specifically tactical exposure to convertible bonds and emerging market debt alongside an overweight in emerging market equities. An internal skew toward quality small-cap U.S. equities acted as a modest headwind.
The following table outlines the key factors (securities, sectors, industries, market events and/or other characteristics) that materially affected the Fund’s performance during the reporting period.
| Key Factor | Summary | Impact |
| Internal benchmarking | Benefited from granular management approach that included mid- and small-cap stocks, emerging-markets equities and high yield | Contributed |
| Overweight in emerging market equities | Bolstered particularly by ex-China exposure, with noteworthy gains from chip manufacturers (TSMC, Samsung, SK Hynix) | Contributed |
| Off-benchmark exposure to convertible bonds | Sensitivity to growth equities | Contributed |
| Stock/bond blend | A modest but persistent tilt favoring stocks over bonds | Contributed |
| Quality | An emphasis on quality (positive and relatively stable earnings) within small caps during a period in which unprofitable tech with high growth expectations led the market higher | Detracted |
| Developed international exposure | A brief tactical overweight in non-U.S. developed markets, across both large- and small-cap companies | Detracted |
Fund Performance
The following graph compares the initial and subsequent account values at the end of each of the most recently completed 10 fiscal years of the Fund (or for the life of the Fund, if shorter). It assumes a $10,000 initial investment at the beginning of the first fiscal year in an appropriate, broad-based securities market index and other indexes, if applicable, for the same period and reflects the deduction of all sales charges, where applicable.
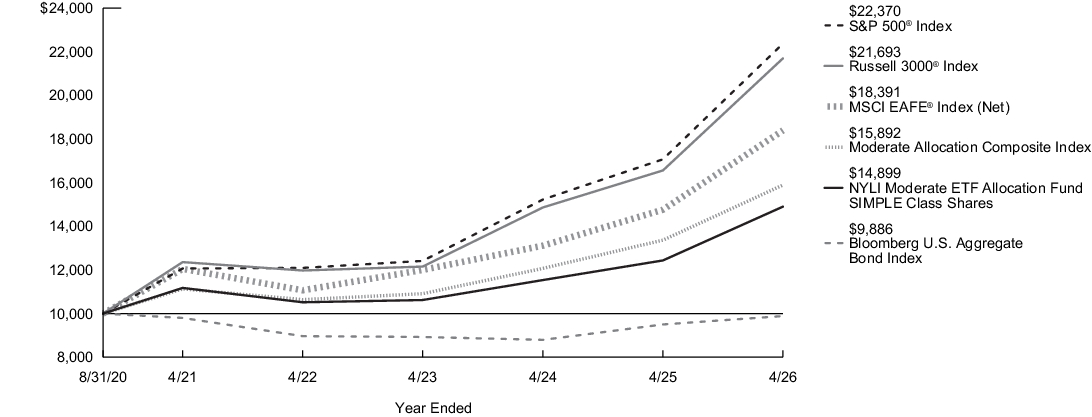
| Average Annual Total Returns for the Year Ended April 30, 2026 | Inception Date |
One Year |
Five Years |
Since Inception |
| SIMPLE Class Shares | 8/31/2020 | 19.83% | 5.92% | 7.29% |
| Russell 3000®Index1 | 31.01% | 11.91% | 14.64% | |
| S&P 500®Index2 | 31.05% | 13.14% | 15.27% | |
| MSCI EAFE® Index (Net)3 | 24.60% | 8.83% | 11.35% | |
| Bloomberg U.S. Aggregate Bond Index4 | 4.06% | 0.18% | (0.20)% | |
| Moderate Allocation Composite Index5 | 18.93% | 7.39% | 8.52% | |
| Morningstar Global Moderate Allocation Category Average6 | 21.73% | 6.49% | 8.44% |
| 1. |
The Fund has selected the Russell 3000® Index to represent a broad measure of market performance. The Russell 3000® Index measures the performance of the largest 3000 U.S. companies representing approximately 98% of the investable U.S. equity market. |
| 2. |
The S&P 500® Index, which represents a broad measure of market performance, is generally representative of the market sectors or types of investments in which the Fund invests. S&P® and S&P 500® are registered trademarks of Standard & Poor’s Financial Services LLC. The S&P 500® Index is widely regarded as the standard index for measuring large-cap U.S. stock market performance. |
| 3. |
The MSCI EAFE® Index (Net), which is generally representative of the market sectors or types of investments in which the Fund invests, consists of international stocks representing the developed world outside of North America. |
| 4. |
The Bloomberg U.S. Aggregate Bond Index, which is generally representative of the market sectors or types of investments in which the Fund invests, is a broad-based benchmark that measures the performance of the investment grade, U.S. dollar-denominated, fixed-rate taxable bond market, including Treasuries, government-related and corporate securities, mortgage-backed securities (agency fixed-rate and hybrid adjustable rate mortgage pass-throughs), asset-backed securities, and commercial mortgage-backed securities. |
| 5. |
The Moderate Allocation Composite Index, which is generally representative of the market sectors or types of investments in which the Fund invests, consists of the S&P 500® Index, the MSCI EAFE® Index (Net) and the Bloomberg U.S. Aggregate Bond Index weighted 45%, 15% and 40%, respectively. |
| 6. |
The Morningstar Global Moderate Allocation Category Average is representative of funds in allocation categories that seek to provide both income and capital appreciation by primarily investing in multiple asset classes, including stocks, bonds, and cash. These moderate strategies seek to balance preservation of capital with appreciation. They typically expect volatility similar to a strategic equity exposure between 50% and 70%. Results are based on average total returns of similar funds with all dividends and capital gain distributions reinvested. |
Key Fund Statistics
| Fund's net assets | $207,107,383 |
| Total number of portfolio holdings | 16 |
| Total advisory fees paid | $366,960 |
| Portfolio turnover rate | 51% |
Asset Diversification
(as a Percentage of Net Asset Value)
(as a Percentage of Net Asset Value)
| Equity Funds | 62.6% |
| Fixed Income Funds | 34.6% |
| Short-Term Investments | 3.8% |
| Other Assets, Less Liabilities | (1.0)% |
What were the Fund costs for the last year?
(Based on a hypothetical $10,000 investment)
| Share Class Name | Costs of a $10,000 investment | Costs paid as a percentage of a $10,000 investment1 |
| Class R3 | $107 | 0.97% |
| 1. | Excludes the fees and expenses of the acquired (underlying) funds in which the Fund invested. |
What factors influenced Fund performance during the reporting period?
During the 12-month reporting period ended April 30, 2026, the Fund’s performance relative to the internally maintained blend of indices that are taken into account when managing the Fund, as well as the Moderate Allocation Composite Index, was affected by various allocation and selection factors. Most notably, relative returns benefited from effective asset class positioning, specifically tactical exposure to convertible bonds and emerging market debt alongside an overweight in emerging market equities. An internal skew toward quality small-cap U.S. equities acted as a modest headwind.
The following table outlines the key factors (securities, sectors, industries, market events and/or other characteristics) that materially affected the Fund’s performance during the reporting period.
| Key Factor | Summary | Impact |
| Internal benchmarking | Benefited from granular management approach that included mid- and small-cap stocks, emerging-markets equities and high yield | Contributed |
| Overweight in emerging market equities | Bolstered particularly by ex-China exposure, with noteworthy gains from chip manufacturers (TSMC, Samsung, SK Hynix) | Contributed |
| Off-benchmark exposure to convertible bonds | Sensitivity to growth equities | Contributed |
| Stock/bond blend | A modest but persistent tilt favoring stocks over bonds | Contributed |
| Quality | An emphasis on quality (positive and relatively stable earnings) within small caps during a period in which unprofitable tech with high growth expectations led the market higher | Detracted |
| Developed international exposure | A brief tactical overweight in non-U.S. developed markets, across both large- and small-cap companies | Detracted |
Fund Performance
The following graph compares the initial and subsequent account values at the end of each of the most recently completed 10 fiscal years of the Fund (or for the life of the Fund, if shorter). It assumes a $10,000 initial investment at the beginning of the first fiscal year in an appropriate, broad-based securities market index and other indexes, if applicable, for the same period and reflects the deduction of all sales charges, where applicable.
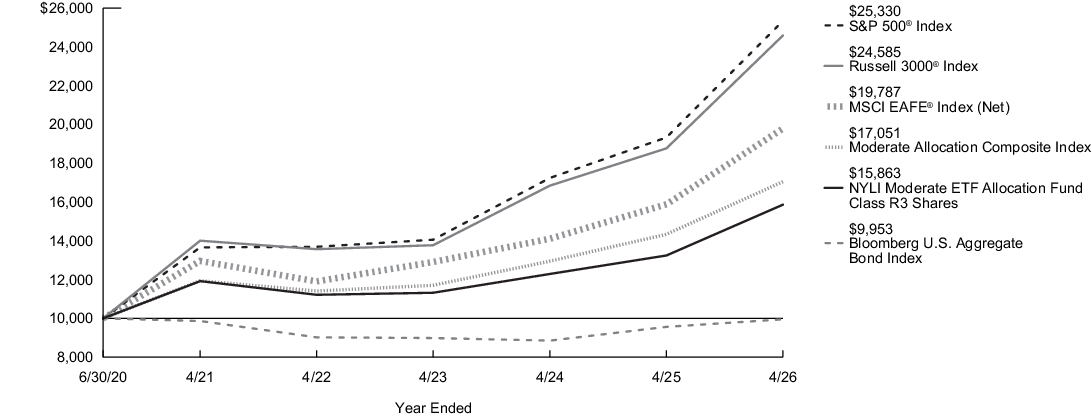
| Average Annual Total Returns for the Year Ended April 30, 2026 | Inception Date |
One Year |
Five Years |
Since Inception |
| Class R3 Shares | 6/30/2020 | 19.77% | 5.88% | 8.23% |
| Russell 3000®Index1 | 31.01% | 11.91% | 16.67% | |
| S&P 500®Index2 | 31.05% | 13.14% | 17.27% | |
| MSCI EAFE® Index (Net)3 | 24.60% | 8.83% | 12.41% | |
| Bloomberg U.S. Aggregate Bond Index4 | 4.06% | 0.18% | (0.08)% | |
| Moderate Allocation Composite Index5 | 18.93% | 7.39% | 9.58% | |
| Morningstar Global Moderate Allocation Category Average6 | 21.73% | 6.49% | 9.41% |
| 1. |
The Fund has selected the Russell 3000® Index to represent a broad measure of market performance. The Russell 3000® Index measures the performance of the largest 3000 U.S. companies representing approximately 98% of the investable U.S. equity market. |
| 2. |
The S&P 500® Index, which represents a broad measure of market performance, is generally representative of the market sectors or types of investments in which the Fund invests. S&P® and S&P 500® are registered trademarks of Standard & Poor’s Financial Services LLC. The S&P 500® Index is widely regarded as the standard index for measuring large-cap U.S. stock market performance. |
| 3. |
The MSCI EAFE® Index (Net), which is generally representative of the market sectors or types of investments in which the Fund invests, consists of international stocks representing the developed world outside of North America. |
| 4. |
The Bloomberg U.S. Aggregate Bond Index, which is generally representative of the market sectors or types of investments in which the Fund invests, is a broad-based benchmark that measures the performance of the investment grade, U.S. dollar-denominated, fixed-rate taxable bond market, including Treasuries, government-related and corporate securities, mortgage-backed securities (agency fixed-rate and hybrid adjustable rate mortgage pass-throughs), asset-backed securities, and commercial mortgage-backed securities. |
| 5. |
The Moderate Allocation Composite Index, which is generally representative of the market sectors or types of investments in which the Fund invests, consists of the S&P 500® Index, the MSCI EAFE® Index (Net) and the Bloomberg U.S. Aggregate Bond Index weighted 45%, 15% and 40%, respectively. |
| 6. |
The Morningstar Global Moderate Allocation Category Average is representative of funds in allocation categories that seek to provide both income and capital appreciation by primarily investing in multiple asset classes, including stocks, bonds, and cash. These moderate strategies seek to balance preservation of capital with appreciation. They typically expect volatility similar to a strategic equity exposure between 50% and 70%. Results are based on average total returns of similar funds with all dividends and capital gain distributions reinvested. |
Key Fund Statistics
| Fund's net assets | $207,107,383 |
| Total number of portfolio holdings | 16 |
| Total advisory fees paid | $366,960 |
| Portfolio turnover rate | 51% |
Asset Diversification
(as a Percentage of Net Asset Value)
(as a Percentage of Net Asset Value)
| Equity Funds | 62.6% |
| Fixed Income Funds | 34.6% |
| Short-Term Investments | 3.8% |
| Other Assets, Less Liabilities | (1.0)% |
What were the Fund costs for the last year?
(Based on a hypothetical $10,000 investment)
| Share Class Name | Costs of a $10,000 investment | Costs paid as a percentage of a $10,000 investment1 |
| Class I | $41 | 0.37% |
| 1. | Excludes the fees and expenses of the acquired (underlying) funds in which the Fund invested. |
What factors influenced Fund performance during the reporting period?
During the 12-month reporting period ended April 30, 2026, the Fund’s performance relative to the internally maintained blend of indices that are taken into account when managing the Fund, as well as the Moderate Allocation Composite Index, was affected by various allocation and selection factors. Most notably, relative returns benefited from effective asset class positioning, specifically tactical exposure to convertible bonds and emerging market debt alongside an overweight in emerging market equities. An internal skew toward quality small-cap U.S. equities acted as a modest headwind.
The following table outlines the key factors (securities, sectors, industries, market events and/or other characteristics) that materially affected the Fund’s performance during the reporting period.
| Key Factor | Summary | Impact |
| Internal benchmarking | Benefited from granular management approach that included mid- and small-cap stocks, emerging-markets equities and high yield | Contributed |
| Overweight in emerging market equities | Bolstered particularly by ex-China exposure, with noteworthy gains from chip manufacturers (TSMC, Samsung, SK Hynix) | Contributed |
| Off-benchmark exposure to convertible bonds | Sensitivity to growth equities | Contributed |
| Stock/bond blend | A modest but persistent tilt favoring stocks over bonds | Contributed |
| Quality | An emphasis on quality (positive and relatively stable earnings) within small caps during a period in which unprofitable tech with high growth expectations led the market higher | Detracted |
| Developed international exposure | A brief tactical overweight in non-U.S. developed markets, across both large- and small-cap companies | Detracted |
Fund Performance
The following graph compares the initial and subsequent account values at the end of each of the most recently completed 10 fiscal years of the Fund (or for the life of the Fund, if shorter). It assumes a $10,000 initial investment at the beginning of the first fiscal year in an appropriate, broad-based securities market index and other indexes, if applicable, for the same period and reflects the deduction of all sales charges, where applicable.
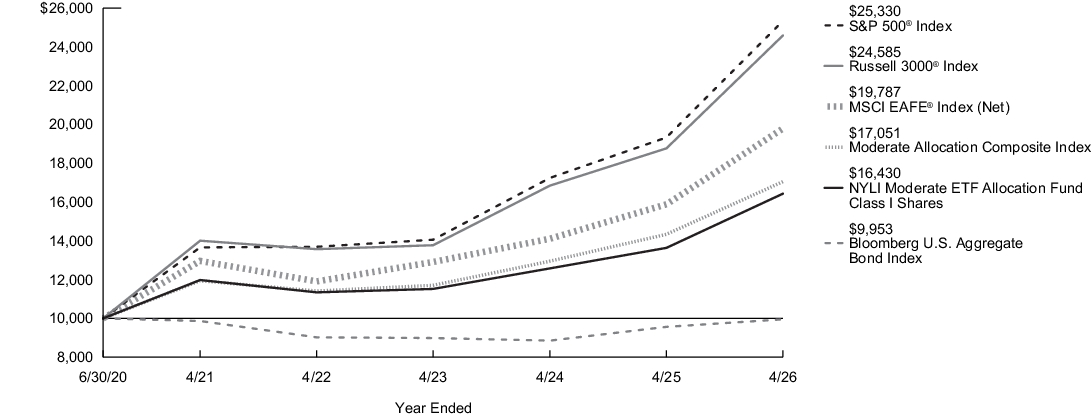
| Average Annual Total Returns for the Year Ended April 30, 2026 | Inception Date |
One Year |
Five Years |
Since Inception |
| Class I Shares | 6/30/2020 | 20.49% | 6.52% | 8.88% |
| Russell 3000®Index1 | 31.01% | 11.91% | 16.67% | |
| S&P 500®Index2 | 31.05% | 13.14% | 17.27% | |
| MSCI EAFE® Index (Net)3 | 24.60% | 8.83% | 12.41% | |
| Bloomberg U.S. Aggregate Bond Index4 | 4.06% | 0.18% | (0.08)% | |
| Moderate Allocation Composite Index5 | 18.93% | 7.39% | 9.58% | |
| Morningstar Global Moderate Allocation Category Average6 | 21.73% | 6.49% | 9.41% |
| 1. |
The Fund has selected the Russell 3000® Index to represent a broad measure of market performance. The Russell 3000® Index measures the performance of the largest 3000 U.S. companies representing approximately 98% of the investable U.S. equity market. |
| 2. |
The S&P 500® Index, which represents a broad measure of market performance, is generally representative of the market sectors or types of investments in which the Fund invests. S&P® and S&P 500® are registered trademarks of Standard & Poor’s Financial Services LLC. The S&P 500® Index is widely regarded as the standard index for measuring large-cap U.S. stock market performance. |
| 3. |
The MSCI EAFE® Index (Net), which is generally representative of the market sectors or types of investments in which the Fund invests, consists of international stocks representing the developed world outside of North America. |
| 4. |
The Bloomberg U.S. Aggregate Bond Index, which is generally representative of the market sectors or types of investments in which the Fund invests, is a broad-based benchmark that measures the performance of the investment grade, U.S. dollar-denominated, fixed-rate taxable bond market, including Treasuries, government-related and corporate securities, mortgage-backed securities (agency fixed-rate and hybrid adjustable rate mortgage pass-throughs), asset-backed securities, and commercial mortgage-backed securities. |
| 5. |
The Moderate Allocation Composite Index, which is generally representative of the market sectors or types of investments in which the Fund invests, consists of the S&P 500® Index, the MSCI EAFE® Index (Net) and the Bloomberg U.S. Aggregate Bond Index weighted 45%, 15% and 40%, respectively. |
| 6. |
The Morningstar Global Moderate Allocation Category Average is representative of funds in allocation categories that seek to provide both income and capital appreciation by primarily investing in multiple asset classes, including stocks, bonds, and cash. These moderate strategies seek to balance preservation of capital with appreciation. They typically expect volatility similar to a strategic equity exposure between 50% and 70%. Results are based on average total returns of similar funds with all dividends and capital gain distributions reinvested. |
Key Fund Statistics
| Fund's net assets | $207,107,383 |
| Total number of portfolio holdings | 16 |
| Total advisory fees paid | $366,960 |
| Portfolio turnover rate | 51% |
Asset Diversification
(as a Percentage of Net Asset Value)
(as a Percentage of Net Asset Value)
| Equity Funds | 62.6% |
| Fixed Income Funds | 34.6% |
| Short-Term Investments | 3.8% |
| Other Assets, Less Liabilities | (1.0)% |
What were the Fund costs for the last year?
(Based on a hypothetical $10,000 investment)
| Share Class Name | Costs of a $10,000 investment | Costs paid as a percentage of a $10,000 investment1 |
| Class C | $153 | 1.39% |
| 1. | Excludes the fees and expenses of the acquired (underlying) funds in which the Fund invested. |
What factors influenced Fund performance during the reporting period?
During the 12-month reporting period ended April 30, 2026, the Fund’s performance relative to the internally maintained blend of indices that are taken into account when managing the Fund, as well as the Moderate Allocation Composite Index, was affected by various allocation and selection factors. Most notably, relative returns benefited from effective asset class positioning, specifically tactical exposure to convertible bonds and emerging market debt alongside an overweight in emerging market equities. An internal skew toward quality small-cap U.S. equities acted as a modest headwind.
The following table outlines the key factors (securities, sectors, industries, market events and/or other characteristics) that materially affected the Fund’s performance during the reporting period.
| Key Factor | Summary | Impact |
| Internal benchmarking | Benefited from granular management approach that included mid- and small-cap stocks, emerging-markets equities and high yield | Contributed |
| Overweight in emerging market equities | Bolstered particularly by ex-China exposure, with noteworthy gains from chip manufacturers (TSMC, Samsung, SK Hynix) | Contributed |
| Off-benchmark exposure to convertible bonds | Sensitivity to growth equities | Contributed |
| Stock/bond blend | A modest but persistent tilt favoring stocks over bonds | Contributed |
| Quality | An emphasis on quality (positive and relatively stable earnings) within small caps during a period in which unprofitable tech with high growth expectations led the market higher | Detracted |
| Developed international exposure | A brief tactical overweight in non-U.S. developed markets, across both large- and small-cap companies | Detracted |
Fund Performance
The following graph compares the initial and subsequent account values at the end of each of the most recently completed 10 fiscal years of the Fund (or for the life of the Fund, if shorter). It assumes a $10,000 initial investment at the beginning of the first fiscal year in an appropriate, broad-based securities market index and other indexes, if applicable, for the same period and reflects the deduction of all sales charges, where applicable.
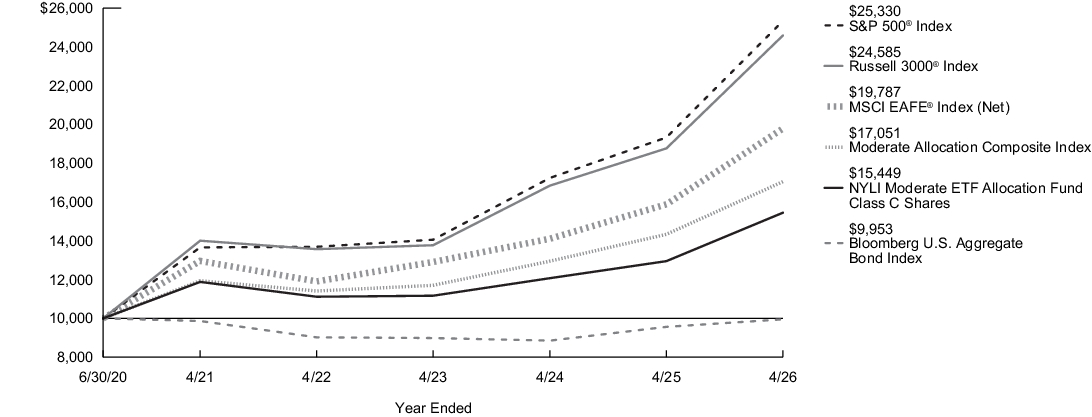
| Average Annual Total Returns for the Year Ended April 30, 2026 | Inception Date |
One Year |
Five Years |
Since Inception |
| Class C Shares - Including sales charges | 6/30/2020 | 18.27% | 5.39% | 7.74% |
| Class C Shares - Excluding sales charges | 19.27% | 5.39% | 7.74% | |
| Russell 3000®Index1 | 31.01% | 11.91% | 16.67% | |
| S&P 500®Index2 | 31.05% | 13.14% | 17.27% | |
| MSCI EAFE® Index (Net)3 | 24.60% | 8.83% | 12.41% | |
| Bloomberg U.S. Aggregate Bond Index4 | 4.06% | 0.18% | (0.08)% | |
| Moderate Allocation Composite Index5 | 18.93% | 7.39% | 9.58% | |
| Morningstar Global Moderate Allocation Category Average6 | 21.73% | 6.49% | 9.41% |
| 1. |
The Fund has selected the Russell 3000® Index to represent a broad measure of market performance. The Russell 3000® Index measures the performance of the largest 3000 U.S. companies representing approximately 98% of the investable U.S. equity market. |
| 2. |
The S&P 500® Index, which represents a broad measure of market performance, is generally representative of the market sectors or types of investments in which the Fund invests. S&P® and S&P 500® are registered trademarks of Standard & Poor’s Financial Services LLC. The S&P 500® Index is widely regarded as the standard index for measuring large-cap U.S. stock market performance. |
| 3. |
The MSCI EAFE® Index (Net), which is generally representative of the market sectors or types of investments in which the Fund invests, consists of international stocks representing the developed world outside of North America. |
| 4. |
The Bloomberg U.S. Aggregate Bond Index, which is generally representative of the market sectors or types of investments in which the Fund invests, is a broad-based benchmark that measures the performance of the investment grade, U.S. dollar-denominated, fixed-rate taxable bond market, including Treasuries, government-related and corporate securities, mortgage-backed securities (agency fixed-rate and hybrid adjustable rate mortgage pass-throughs), asset-backed securities, and commercial mortgage-backed securities. |
| 5. |
The Moderate Allocation Composite Index, which is generally representative of the market sectors or types of investments in which the Fund invests, consists of the S&P 500® Index, the MSCI EAFE® Index (Net) and the Bloomberg U.S. Aggregate Bond Index weighted 45%, 15% and 40%, respectively. |
| 6. |
The Morningstar Global Moderate Allocation Category Average is representative of funds in allocation categories that seek to provide both income and capital appreciation by primarily investing in multiple asset classes, including stocks, bonds, and cash. These moderate strategies seek to balance preservation of capital with appreciation. They typically expect volatility similar to a strategic equity exposure between 50% and 70%. Results are based on average total returns of similar funds with all dividends and capital gain distributions reinvested. |
Key Fund Statistics
| Fund's net assets | $207,107,383 |
| Total number of portfolio holdings | 16 |
| Total advisory fees paid | $366,960 |
| Portfolio turnover rate | 51% |
Asset Diversification
(as a Percentage of Net Asset Value)
(as a Percentage of Net Asset Value)
| Equity Funds | 62.6% |
| Fixed Income Funds | 34.6% |
| Short-Term Investments | 3.8% |
| Other Assets, Less Liabilities | (1.0)% |
What were the Fund costs for the last year?
(Based on a hypothetical $10,000 investment)
| Share Class Name | Costs of a $10,000 investment | Costs paid as a percentage of a $10,000 investment1 |
| Class A | $68 | 0.62% |
| 1. | Excludes the fees and expenses of the acquired (underlying) funds in which the Fund invested. |
What factors influenced Fund performance during the reporting period?
During the 12-month reporting period ended April 30, 2026, the Fund’s performance relative to the internally maintained blend of indices that are taken into account when managing the Fund, as well as the Moderate Allocation Composite Index, was affected by various allocation and selection factors. Most notably, relative returns benefited from effective asset class positioning, specifically tactical exposure to convertible bonds and emerging market debt alongside an overweight in emerging market equities. An internal skew toward quality small-cap U.S. equities acted as a modest headwind.
The following table outlines the key factors (securities, sectors, industries, market events and/or other characteristics) that materially affected the Fund’s performance during the reporting period.
| Key Factor | Summary | Impact |
| Internal benchmarking | Benefited from granular management approach that included mid- and small-cap stocks, emerging-markets equities and high yield | Contributed |
| Overweight in emerging market equities | Bolstered particularly by ex-China exposure, with noteworthy gains from chip manufacturers (TSMC, Samsung, SK Hynix) | Contributed |
| Off-benchmark exposure to convertible bonds | Sensitivity to growth equities | Contributed |
| Stock/bond blend | A modest but persistent tilt favoring stocks over bonds | Contributed |
| Quality | An emphasis on quality (positive and relatively stable earnings) within small caps during a period in which unprofitable tech with high growth expectations led the market higher | Detracted |
| Developed international exposure | A brief tactical overweight in non-U.S. developed markets, across both large- and small-cap companies | Detracted |
Fund Performance
The following graph compares the initial and subsequent account values at the end of each of the most recently completed 10 fiscal years of the Fund (or for the life of the Fund, if shorter). It assumes a $10,000 initial investment at the beginning of the first fiscal year in an appropriate, broad-based securities market index and other indexes, if applicable, for the same period and reflects the deduction of all sales charges, where applicable.

| Average Annual Total Returns for the Year Ended April 30, 2026 | Inception Date |
One Year |
Five Years |
Since Inception |
| Class A Shares - Including sales charges | 6/30/2020 | 16.65% | 5.60% | 8.03% |
| Class A Shares - Excluding sales charges | 20.25% | 6.25% | 8.60% | |
| Russell 3000®Index1 | 31.01% | 11.91% | 16.67% | |
| S&P 500®Index2 | 31.05% | 13.14% | 17.27% | |
| MSCI EAFE® Index (Net)3 | 24.60% | 8.83% | 12.41% | |
| Bloomberg U.S. Aggregate Bond Index4 | 4.06% | 0.18% | (0.08)% | |
| Moderate Allocation Composite Index5 | 18.93% | 7.39% | 9.58% | |
| Morningstar Global Moderate Allocation Category Average6 | 21.73% | 6.49% | 9.41% |
| 1. |
The Fund has selected the Russell 3000® Index to represent a broad measure of market performance. The Russell 3000® Index measures the performance of the largest 3000 U.S. companies representing approximately 98% of the investable U.S. equity market. |
| 2. |
The S&P 500® Index, which represents a broad measure of market performance, is generally representative of the market sectors or types of investments in which the Fund invests. S&P® and S&P 500® are registered trademarks of Standard & Poor’s Financial Services LLC. The S&P 500® Index is widely regarded as the standard index for measuring large-cap U.S. stock market performance. |
| 3. |
The MSCI EAFE® Index (Net), which is generally representative of the market sectors or types of investments in which the Fund invests, consists of international stocks representing the developed world outside of North America. |
| 4. |
The Bloomberg U.S. Aggregate Bond Index, which is generally representative of the market sectors or types of investments in which the Fund invests, is a broad-based benchmark that measures the performance of the investment grade, U.S. dollar-denominated, fixed-rate taxable bond market, including Treasuries, government-related and corporate securities, mortgage-backed securities (agency fixed-rate and hybrid adjustable rate mortgage pass-throughs), asset-backed securities, and commercial mortgage-backed securities. |
| 5. |
The Moderate Allocation Composite Index, which is generally representative of the market sectors or types of investments in which the Fund invests, consists of the S&P 500® Index, the MSCI EAFE® Index (Net) and the Bloomberg U.S. Aggregate Bond Index weighted 45%, 15% and 40%, respectively. |
| 6. |
The Morningstar Global Moderate Allocation Category Average is representative of funds in allocation categories that seek to provide both income and capital appreciation by primarily investing in multiple asset classes, including stocks, bonds, and cash. These moderate strategies seek to balance preservation of capital with appreciation. They typically expect volatility similar to a strategic equity exposure between 50% and 70%. Results are based on average total returns of similar funds with all dividends and capital gain distributions reinvested. |
Key Fund Statistics
| Fund's net assets | $207,107,383 |
| Total number of portfolio holdings | 16 |
| Total advisory fees paid | $366,960 |
| Portfolio turnover rate | 51% |
Asset Diversification
(as a Percentage of Net Asset Value)
(as a Percentage of Net Asset Value)
| Equity Funds | 62.6% |
| Fixed Income Funds | 34.6% |
| Short-Term Investments | 3.8% |
| Other Assets, Less Liabilities | (1.0)% |
What were the Fund costs for the last year?
(Based on a hypothetical $10,000 investment)
| Share Class Name | Costs of a $10,000 investment | Costs paid as a percentage of a $10,000 investment1 |
| Class A | $72 | 0.64% |
| 1. | Excludes the fees and expenses of the acquired (underlying) funds in which the Fund invested. |
What factors influenced Fund performance during the reporting period?
During the 12-month reporting period ended April 30, 2026, the Fund’s performance relative to the internally maintained blend of indices that are taken into account when managing the Fund, as well as the Growth Allocation Composite Index, was affected by various allocation and selection factors. Most notably, relative returns benefited from effective asset class positioning, specifically tactical exposure to convertible bonds and emerging market debt alongside an overweight in emerging market equities. An internal skew toward quality small-cap U.S. equities acted as a modest headwind.
The following table outlines the key factors (securities, sectors, industries, market events and/or other characteristics) that materially affected the Fund’s performance during the reporting period.
| Key Factor | Summary | Impact |
| Internal benchmarking | Benefited from granular management approach that included mid- and small-cap stocks, emerging-markets equities and high yield | Contributed |
| Overweight in emerging market equities | Bolstered particularly by ex-China exposure, with noteworthy gains from chip manufacturers (TSMC, Samsung, SK Hynix) | Contributed |
| Off-benchmark exposure to convertible bonds | Sensitivity to growth equities | Contributed |
| Stock/bond blend | A modest but persistent tilt favoring stocks over bonds | Contributed |
| Quality | An emphasis on quality (positive and relatively stable earnings) within small caps during a period in which unprofitable tech with high growth expectations led the market higher | Detracted |
| Developed international exposure | A brief tactical overweight in non-U.S. developed markets, across both large- and small-cap companies | Detracted |
Fund Performance
The following graph compares the initial and subsequent account values at the end of each of the most recently completed 10 fiscal years of the Fund (or for the life of the Fund, if shorter). It assumes a $10,000 initial investment at the beginning of the first fiscal year in an appropriate, broad-based securities market index and other indexes, if applicable, for the same period and reflects the deduction of all sales charges, where applicable.
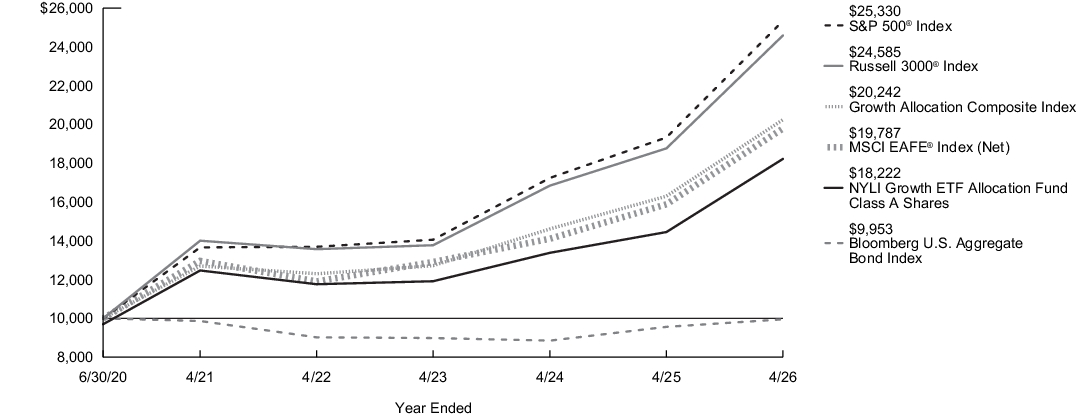
| Average Annual Total Returns for the Year Ended April 30, 2026 | Inception Date |
One Year |
Five Years |
Since Inception |
| Class A Shares - Including sales charges | 6/30/2020 | 22.31% | 7.23% | 10.83% |
| Class A Shares - Excluding sales charges | 26.09% | 7.88% | 11.41% | |
| Russell 3000®Index1 | 31.01% | 11.91% | 16.67% | |
| S&P 500®Index2 | 31.05% | 13.14% | 17.27% | |
| MSCI EAFE® Index (Net)3 | 24.60% | 8.83% | 12.41% | |
| Bloomberg U.S. Aggregate Bond Index4 | 4.06% | 0.18% | (0.08)% | |
| Growth Allocation Composite Index5 | 24.17% | 9.78% | 12.85% | |
| Morningstar Global Moderately Aggressive Allocation Category Average6 | 26.19% | 7.89% | 11.82% |
| 1. |
The Fund has selected the Russell 3000® Index to represent a broad measure of market performance. The Russell 3000® Index measures the performance of the largest 3,000 U.S. companies representing approximately 98% of the investable U.S. equity market. |
| 2. |
The S&P 500® Index, which represents a broad measure of market performance, is generally representative of the market sectors or types of investments in which the Fund invests. S&P® and S&P 500® are registered trademarks of Standard & Poor’s Financial Services LLC. The S&P 500® Index is widely regarded as the standard index for measuring large-cap U.S. stock market performance. |
| 3. |
The MSCI EAFE® Index (Net), which is generally representative of the market sectors or types of investments in which the Fund invests, consists of international stocks representing the developed world outside of North America. |
| 4. |
The Bloomberg U.S. Aggregate Bond Index, which is generally representative of the market sectors or types of investments in which the Fund invests, is a broad-based benchmark that measures the performance of the investment grade, U.S. dollar-denominated, fixed-rate taxable bond market, including Treasuries, government-related and corporate securities, mortgage-backed securities (agency fixed-rate and hybrid adjustable rate mortgage pass-throughs), asset-backed securities, and commercial mortgage-backed securities. |
| 5. |
The Growth Allocation Composite Index, which is generally representative of the market sectors or types of investments in which the Fund invests, consists of the S&P 500® Index, the MSCI EAFE® Index (Net) and the Bloomberg U.S. Aggregate Bond Index weighted 60%, 20% and 20%, respectively. |
| 6. |
The Morningstar Global Moderately Aggressive Allocation Category Average is representative of funds in allocation categories that seek to provide both income and capital appreciation by primarily investing in multiple asset classes, including stocks, bonds, and cash. These moderately aggressive strategies prioritize capital appreciation over preservation. They typically expect volatility similar to a strategic equity exposure between 70% and 85%. Results are based on average total returns of similar funds with all dividends and capital gain distributions reinvested. |
Key Fund Statistics
| Fund's net assets | $188,523,079 |
| Total number of portfolio holdings | 16 |
| Total advisory fees paid | $327,265 |
| Portfolio turnover rate | 53% |
Asset Diversification
(as a Percentage of Net Asset Value)
(as a Percentage of Net Asset Value)
| Equity Funds | 82.4% |
| Fixed Income Funds | 14.8% |
| Short-Term Investments | 4.5% |
| Other Assets, Less Liabilities | (1.7)% |
What were the Fund costs for the last year?
(Based on a hypothetical $10,000 investment)
| Share Class Name | Costs of a $10,000 investment | Costs paid as a percentage of a $10,000 investment1 |
| Class C | $157 | 1.39% |
| 1. | Excludes the fees and expenses of the acquired (underlying) funds in which the Fund invested. |
What factors influenced Fund performance during the reporting period?
During the 12-month reporting period ended April 30, 2026, the Fund’s performance relative to the internally maintained blend of indices that are taken into account when managing the Fund, as well as the Growth Allocation Composite Index, was affected by various allocation and selection factors. Most notably, relative returns benefited from effective asset class positioning, specifically tactical exposure to convertible bonds and emerging market debt alongside an overweight in emerging market equities. An internal skew toward quality small-cap U.S. equities acted as a modest headwind.
The following table outlines the key factors (securities, sectors, industries, market events and/or other characteristics) that materially affected the Fund’s performance during the reporting period.
| Key Factor | Summary | Impact |
| Internal benchmarking | Benefited from granular management approach that included mid- and small-cap stocks, emerging-markets equities and high yield | Contributed |
| Overweight in emerging market equities | Bolstered particularly by ex-China exposure, with noteworthy gains from chip manufacturers (TSMC, Samsung, SK Hynix) | Contributed |
| Off-benchmark exposure to convertible bonds | Sensitivity to growth equities | Contributed |
| Stock/bond blend | A modest but persistent tilt favoring stocks over bonds | Contributed |
| Quality | An emphasis on quality (positive and relatively stable earnings) within small caps during a period in which unprofitable tech with high growth expectations led the market higher | Detracted |
| Developed international exposure | A brief tactical overweight in non-U.S. developed markets, across both large- and small-cap companies | Detracted |
Fund Performance
The following graph compares the initial and subsequent account values at the end of each of the most recently completed 10 fiscal years of the Fund (or for the life of the Fund, if shorter). It assumes a $10,000 initial investment at the beginning of the first fiscal year in an appropriate, broad-based securities market index and other indexes, if applicable, for the same period and reflects the deduction of all sales charges, where applicable.
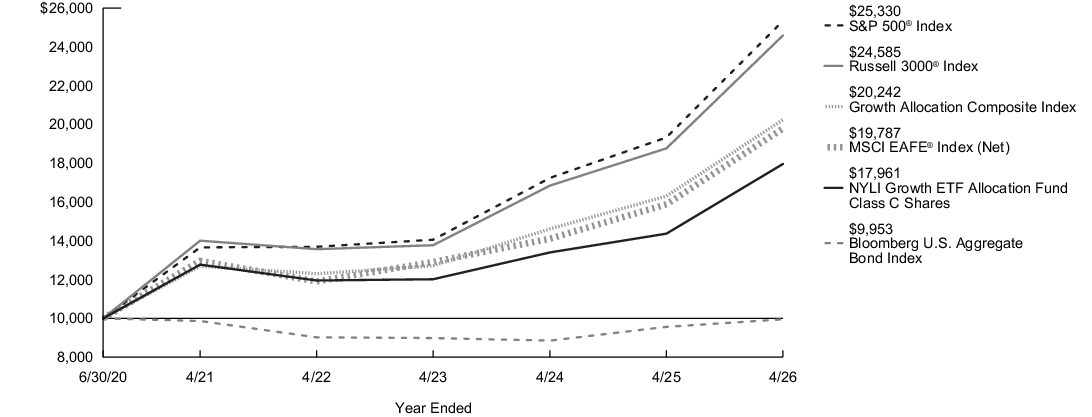
| Average Annual Total Returns for the Year Ended April 30, 2026 | Inception Date |
One Year |
Five Years |
Since Inception |
| Class C Shares - Including sales charges | 6/30/2020 | 24.00% | 7.06% | 10.56% |
| Class C Shares - Excluding sales charges | 25.00% | 7.06% | 10.56% | |
| Russell 3000®Index1 | 31.01% | 11.91% | 16.67% | |
| S&P 500®Index2 | 31.05% | 13.14% | 17.27% | |
| MSCI EAFE® Index (Net)3 | 24.60% | 8.83% | 12.41% | |
| Bloomberg U.S. Aggregate Bond Index4 | 4.06% | 0.18% | (0.08)% | |
| Growth Allocation Composite Index5 | 24.17% | 9.78% | 12.85% | |
| Morningstar Global Moderately Aggressive Allocation Category Average6 | 26.19% | 7.89% | 11.82% |
| 1. |
The Fund has selected the Russell 3000® Index to represent a broad measure of market performance. The Russell 3000® Index measures the performance of the largest 3,000 U.S. companies representing approximately 98% of the investable U.S. equity market. |
| 2. |
The S&P 500® Index, which represents a broad measure of market performance, is generally representative of the market sectors or types of investments in which the Fund invests. S&P® and S&P 500® are registered trademarks of Standard & Poor’s Financial Services LLC. The S&P 500® Index is widely regarded as the standard index for measuring large-cap U.S. stock market performance. |
| 3. |
The MSCI EAFE® Index (Net), which is generally representative of the market sectors or types of investments in which the Fund invests, consists of international stocks representing the developed world outside of North America. |
| 4. |
The Bloomberg U.S. Aggregate Bond Index, which is generally representative of the market sectors or types of investments in which the Fund invests, is a broad-based benchmark that measures the performance of the investment grade, U.S. dollar-denominated, fixed-rate taxable bond market, including Treasuries, government-related and corporate securities, mortgage-backed securities (agency fixed-rate and hybrid adjustable rate mortgage pass-throughs), asset-backed securities, and commercial mortgage-backed securities. |
| 5. |
The Growth Allocation Composite Index, which is generally representative of the market sectors or types of investments in which the Fund invests, consists of the S&P 500® Index, the MSCI EAFE® Index (Net) and the Bloomberg U.S. Aggregate Bond Index weighted 60%, 20% and 20%, respectively. |
| 6. |
The Morningstar Global Moderately Aggressive Allocation Category Average is representative of funds in allocation categories that seek to provide both income and capital appreciation by primarily investing in multiple asset classes, including stocks, bonds, and cash. These moderately aggressive strategies prioritize capital appreciation over preservation. They typically expect volatility similar to a strategic equity exposure between 70% and 85%. Results are based on average total returns of similar funds with all dividends and capital gain distributions reinvested. |
Key Fund Statistics
| Fund's net assets | $188,523,079 |
| Total number of portfolio holdings | 16 |
| Total advisory fees paid | $327,265 |
| Portfolio turnover rate | 53% |
Asset Diversification
(as a Percentage of Net Asset Value)
(as a Percentage of Net Asset Value)
| Equity Funds | 82.4% |
| Fixed Income Funds | 14.8% |
| Short-Term Investments | 4.5% |
| Other Assets, Less Liabilities | (1.7)% |
What were the Fund costs for the last year?
(Based on a hypothetical $10,000 investment)
| Share Class Name | Costs of a $10,000 investment | Costs paid as a percentage of a $10,000 investment1 |
| Class I | $44 | 0.39% |
| 1. | Excludes the fees and expenses of the acquired (underlying) funds in which the Fund invested. |
What factors influenced Fund performance during the reporting period?
During the 12-month reporting period ended April 30, 2026, the Fund’s performance relative to the internally maintained blend of indices that are taken into account when managing the Fund, as well as the Growth Allocation Composite Index, was affected by various allocation and selection factors. Most notably, relative returns benefited from effective asset class positioning, specifically tactical exposure to convertible bonds and emerging market debt alongside an overweight in emerging market equities. An internal skew toward quality small-cap U.S. equities acted as a modest headwind.
The following table outlines the key factors (securities, sectors, industries, market events and/or other characteristics) that materially affected the Fund’s performance during the reporting period.
| Key Factor | Summary | Impact |
| Internal benchmarking | Benefited from granular management approach that included mid- and small-cap stocks, emerging-markets equities and high yield | Contributed |
| Overweight in emerging market equities | Bolstered particularly by ex-China exposure, with noteworthy gains from chip manufacturers (TSMC, Samsung, SK Hynix) | Contributed |
| Off-benchmark exposure to convertible bonds | Sensitivity to growth equities | Contributed |
| Stock/bond blend | A modest but persistent tilt favoring stocks over bonds | Contributed |
| Quality | An emphasis on quality (positive and relatively stable earnings) within small caps during a period in which unprofitable tech with high growth expectations led the market higher | Detracted |
| Developed international exposure | A brief tactical overweight in non-U.S. developed markets, across both large- and small-cap companies | Detracted |
Fund Performance
The following graph compares the initial and subsequent account values at the end of each of the most recently completed 10 fiscal years of the Fund (or for the life of the Fund, if shorter). It assumes a $10,000 initial investment at the beginning of the first fiscal year in an appropriate, broad-based securities market index and other indexes, if applicable, for the same period and reflects the deduction of all sales charges, where applicable.
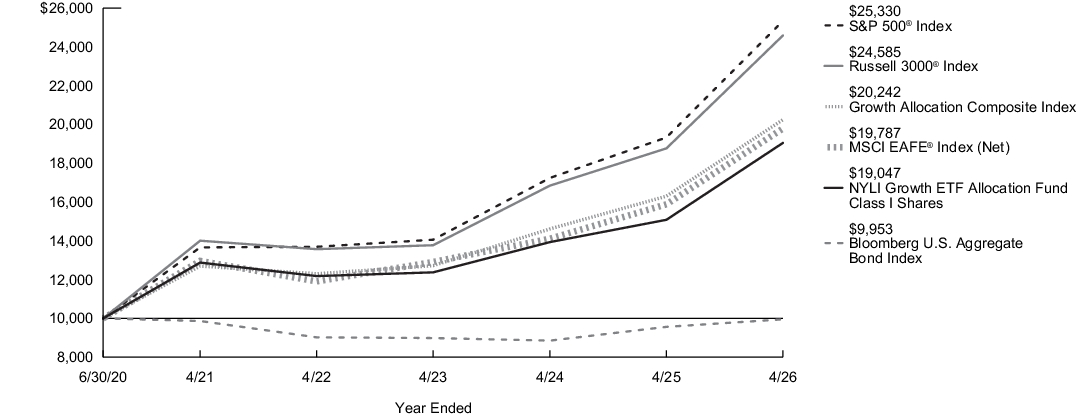
| Average Annual Total Returns for the Year Ended April 30, 2026 | Inception Date |
One Year |
Five Years |
Since Inception |
| Class I Shares | 6/30/2020 | 26.28% | 8.14% | 11.68% |
| Russell 3000®Index1 | 31.01% | 11.91% | 16.67% | |
| S&P 500®Index2 | 31.05% | 13.14% | 17.27% | |
| MSCI EAFE® Index (Net)3 | 24.60% | 8.83% | 12.41% | |
| Bloomberg U.S. Aggregate Bond Index4 | 4.06% | 0.18% | (0.08)% | |
| Growth Allocation Composite Index5 | 24.17% | 9.78% | 12.85% | |
| Morningstar Global Moderately Aggressive Allocation Category Average6 | 26.19% | 7.89% | 11.82% |
| 1. |
The Fund has selected the Russell 3000® Index to represent a broad measure of market performance. The Russell 3000® Index measures the performance of the largest 3,000 U.S. companies representing approximately 98% of the investable U.S. equity market. |
| 2. |
The S&P 500® Index, which represents a broad measure of market performance, is generally representative of the market sectors or types of investments in which the Fund invests. S&P® and S&P 500® are registered trademarks of Standard & Poor’s Financial Services LLC. The S&P 500® Index is widely regarded as the standard index for measuring large-cap U.S. stock market performance. |
| 3. |
The MSCI EAFE® Index (Net), which is generally representative of the market sectors or types of investments in which the Fund invests, consists of international stocks representing the developed world outside of North America. |
| 4. |
The Bloomberg U.S. Aggregate Bond Index, which is generally representative of the market sectors or types of investments in which the Fund invests, is a broad-based benchmark that measures the performance of the investment grade, U.S. dollar-denominated, fixed-rate taxable bond market, including Treasuries, government-related and corporate securities, mortgage-backed securities (agency fixed-rate and hybrid adjustable rate mortgage pass-throughs), asset-backed securities, and commercial mortgage-backed securities. |
| 5. |
The Growth Allocation Composite Index, which is generally representative of the market sectors or types of investments in which the Fund invests, consists of the S&P 500® Index, the MSCI EAFE® Index (Net) and the Bloomberg U.S. Aggregate Bond Index weighted 60%, 20% and 20%, respectively. |
| 6. |
The Morningstar Global Moderately Aggressive Allocation Category Average is representative of funds in allocation categories that seek to provide both income and capital appreciation by primarily investing in multiple asset classes, including stocks, bonds, and cash. These moderately aggressive strategies prioritize capital appreciation over preservation. They typically expect volatility similar to a strategic equity exposure between 70% and 85%. Results are based on average total returns of similar funds with all dividends and capital gain distributions reinvested. |
Key Fund Statistics
| Fund's net assets | $188,523,079 |
| Total number of portfolio holdings | 16 |
| Total advisory fees paid | $327,265 |
| Portfolio turnover rate | 53% |
Asset Diversification
(as a Percentage of Net Asset Value)
(as a Percentage of Net Asset Value)
| Equity Funds | 82.4% |
| Fixed Income Funds | 14.8% |
| Short-Term Investments | 4.5% |
| Other Assets, Less Liabilities | (1.7)% |
What were the Fund costs for the last year?
(Based on a hypothetical $10,000 investment)
| Share Class Name | Costs of a $10,000 investment | Costs paid as a percentage of a $10,000 investment1 |
| Class R3 | $112 | 0.99% |
| 1. | Excludes the fees and expenses of the acquired (underlying) funds in which the Fund invested. |
What factors influenced Fund performance during the reporting period?
During the 12-month reporting period ended April 30, 2026, the Fund’s performance relative to the internally maintained blend of indices that are taken into account when managing the Fund, as well as the Growth Allocation Composite Index, was affected by various allocation and selection factors. Most notably, relative returns benefited from effective asset class positioning, specifically tactical exposure to convertible bonds and emerging market debt alongside an overweight in emerging market equities. An internal skew toward quality small-cap U.S. equities acted as a modest headwind.
The following table outlines the key factors (securities, sectors, industries, market events and/or other characteristics) that materially affected the Fund’s performance during the reporting period.
| Key Factor | Summary | Impact |
| Internal benchmarking | Benefited from granular management approach that included mid- and small-cap stocks, emerging-markets equities and high yield | Contributed |
| Overweight in emerging market equities | Bolstered particularly by ex-China exposure, with noteworthy gains from chip manufacturers (TSMC, Samsung, SK Hynix) | Contributed |
| Off-benchmark exposure to convertible bonds | Sensitivity to growth equities | Contributed |
| Stock/bond blend | A modest but persistent tilt favoring stocks over bonds | Contributed |
| Quality | An emphasis on quality (positive and relatively stable earnings) within small caps during a period in which unprofitable tech with high growth expectations led the market higher | Detracted |
| Developed international exposure | A brief tactical overweight in non-U.S. developed markets, across both large- and small-cap companies | Detracted |
Fund Performance
The following graph compares the initial and subsequent account values at the end of each of the most recently completed 10 fiscal years of the Fund (or for the life of the Fund, if shorter). It assumes a $10,000 initial investment at the beginning of the first fiscal year in an appropriate, broad-based securities market index and other indexes, if applicable, for the same period and reflects the deduction of all sales charges, where applicable.

| Average Annual Total Returns for the Year Ended April 30, 2026 | Inception Date |
One Year |
Five Years |
Since Inception |
| Class R3 Shares | 6/30/2020 | 25.58% | 7.50% | 11.02% |
| Russell 3000®Index1 | 31.01% | 11.91% | 16.67% | |
| S&P 500®Index2 | 31.05% | 13.14% | 17.27% | |
| MSCI EAFE® Index (Net)3 | 24.60% | 8.83% | 12.41% | |
| Bloomberg U.S. Aggregate Bond Index4 | 4.06% | 0.18% | (0.08)% | |
| Growth Allocation Composite Index5 | 24.17% | 9.78% | 12.85% | |
| Morningstar Global Moderately Aggressive Allocation Category Average6 | 26.19% | 7.89% | 11.82% |
| 1. |
The Fund has selected the Russell 3000® Index to represent a broad measure of market performance. The Russell 3000® Index measures the performance of the largest 3,000 U.S. companies representing approximately 98% of the investable U.S. equity market. |
| 2. |
The S&P 500® Index, which represents a broad measure of market performance, is generally representative of the market sectors or types of investments in which the Fund invests. S&P® and S&P 500® are registered trademarks of Standard & Poor’s Financial Services LLC. The S&P 500® Index is widely regarded as the standard index for measuring large-cap U.S. stock market performance. |
| 3. |
The MSCI EAFE® Index (Net), which is generally representative of the market sectors or types of investments in which the Fund invests, consists of international stocks representing the developed world outside of North America. |
| 4. |
The Bloomberg U.S. Aggregate Bond Index, which is generally representative of the market sectors or types of investments in which the Fund invests, is a broad-based benchmark that measures the performance of the investment grade, U.S. dollar-denominated, fixed-rate taxable bond market, including Treasuries, government-related and corporate securities, mortgage-backed securities (agency fixed-rate and hybrid adjustable rate mortgage pass-throughs), asset-backed securities, and commercial mortgage-backed securities. |
| 5. |
The Growth Allocation Composite Index, which is generally representative of the market sectors or types of investments in which the Fund invests, consists of the S&P 500® Index, the MSCI EAFE® Index (Net) and the Bloomberg U.S. Aggregate Bond Index weighted 60%, 20% and 20%, respectively. |
| 6. |
The Morningstar Global Moderately Aggressive Allocation Category Average is representative of funds in allocation categories that seek to provide both income and capital appreciation by primarily investing in multiple asset classes, including stocks, bonds, and cash. These moderately aggressive strategies prioritize capital appreciation over preservation. They typically expect volatility similar to a strategic equity exposure between 70% and 85%. Results are based on average total returns of similar funds with all dividends and capital gain distributions reinvested. |
Key Fund Statistics
| Fund's net assets | $188,523,079 |
| Total number of portfolio holdings | 16 |
| Total advisory fees paid | $327,265 |
| Portfolio turnover rate | 53% |
Asset Diversification
(as a Percentage of Net Asset Value)
(as a Percentage of Net Asset Value)
| Equity Funds | 82.4% |
| Fixed Income Funds | 14.8% |
| Short-Term Investments | 4.5% |
| Other Assets, Less Liabilities | (1.7)% |
What were the Fund costs for the last year?
(Based on a hypothetical $10,000 investment)
| Share Class Name | Costs of a $10,000 investment | Costs paid as a percentage of a $10,000 investment1 |
| SIMPLE Class | $101 | 0.89% |
| 1. | Excludes the fees and expenses of the acquired (underlying) funds in which the Fund invested. |
What factors influenced Fund performance during the reporting period?
During the 12-month reporting period ended April 30, 2026, the Fund’s performance relative to the internally maintained blend of indices that are taken into account when managing the Fund, as well as the Growth Allocation Composite Index, was affected by various allocation and selection factors. Most notably, relative returns benefited from effective asset class positioning, specifically tactical exposure to convertible bonds and emerging market debt alongside an overweight in emerging market equities. An internal skew toward quality small-cap U.S. equities acted as a modest headwind.
The following table outlines the key factors (securities, sectors, industries, market events and/or other characteristics) that materially affected the Fund’s performance during the reporting period.
| Key Factor | Summary | Impact |
| Internal benchmarking | Benefited from granular management approach that included mid- and small-cap stocks, emerging-markets equities and high yield | Contributed |
| Overweight in emerging market equities | Bolstered particularly by ex-China exposure, with noteworthy gains from chip manufacturers (TSMC, Samsung, SK Hynix) | Contributed |
| Off-benchmark exposure to convertible bonds | Sensitivity to growth equities | Contributed |
| Stock/bond blend | A modest but persistent tilt favoring stocks over bonds | Contributed |
| Quality | An emphasis on quality (positive and relatively stable earnings) within small caps during a period in which unprofitable tech with high growth expectations led the market higher | Detracted |
| Developed international exposure | A brief tactical overweight in non-U.S. developed markets, across both large- and small-cap companies | Detracted |
Fund Performance
The following graph compares the initial and subsequent account values at the end of each of the most recently completed 10 fiscal years of the Fund (or for the life of the Fund, if shorter). It assumes a $10,000 initial investment at the beginning of the first fiscal year in an appropriate, broad-based securities market index and other indexes, if applicable, for the same period and reflects the deduction of all sales charges, where applicable.
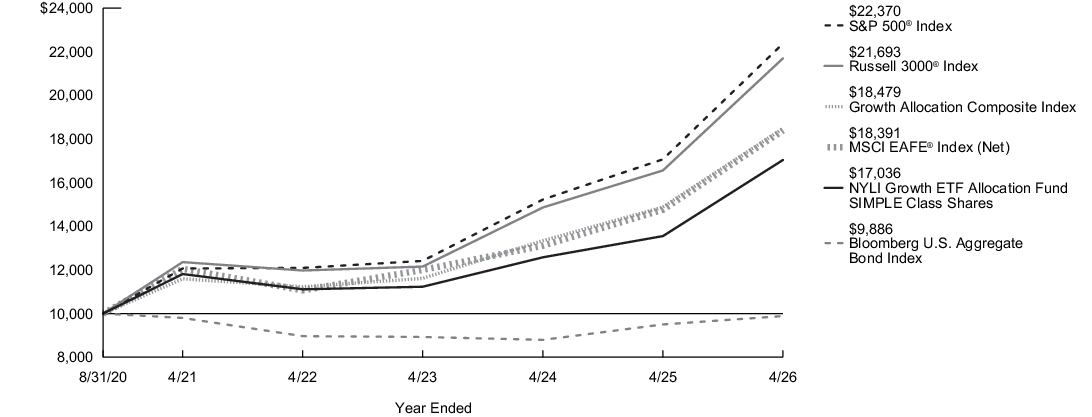
| Average Annual Total Returns for the Year Ended April 30, 2026 | Inception Date |
One Year |
Five Years |
Since Inception |
| SIMPLE Class Shares | 8/31/2020 | 25.73% | 7.60% | 9.86% |
| Russell 3000®Index1 | 31.01% | 11.91% | 14.64% | |
| S&P 500®Index2 | 31.05% | 13.14% | 15.27% | |
| MSCI EAFE® Index (Net)3 | 24.60% | 8.83% | 11.35% | |
| Bloomberg U.S. Aggregate Bond Index4 | 4.06% | 0.18% | (0.20)% | |
| Growth Allocation Composite Index5 | 24.17% | 9.78% | 11.44% | |
| Morningstar Global Moderately Aggressive Allocation Category Average6 | 26.19% | 7.89% | 10.71% |
| 1. |
The Fund has selected the Russell 3000® Index to represent a broad measure of market performance. The Russell 3000® Index measures the performance of the largest 3,000 U.S. companies representing approximately 98% of the investable U.S. equity market. |
| 2. |
The S&P 500® Index, which represents a broad measure of market performance, is generally representative of the market sectors or types of investments in which the Fund invests. S&P® and S&P 500® are registered trademarks of Standard & Poor’s Financial Services LLC. The S&P 500® Index is widely regarded as the standard index for measuring large-cap U.S. stock market performance. |
| 3. |
The MSCI EAFE® Index (Net), which is generally representative of the market sectors or types of investments in which the Fund invests, consists of international stocks representing the developed world outside of North America. |
| 4. |
The Bloomberg U.S. Aggregate Bond Index, which is generally representative of the market sectors or types of investments in which the Fund invests, is a broad-based benchmark that measures the performance of the investment grade, U.S. dollar-denominated, fixed-rate taxable bond market, including Treasuries, government-related and corporate securities, mortgage-backed securities (agency fixed-rate and hybrid adjustable rate mortgage pass-throughs), asset-backed securities, and commercial mortgage-backed securities. |
| 5. |
The Growth Allocation Composite Index, which is generally representative of the market sectors or types of investments in which the Fund invests, consists of the S&P 500® Index, the MSCI EAFE® Index (Net) and the Bloomberg U.S. Aggregate Bond Index weighted 60%, 20% and 20%, respectively. |
| 6. |
The Morningstar Global Moderately Aggressive Allocation Category Average is representative of funds in allocation categories that seek to provide both income and capital appreciation by primarily investing in multiple asset classes, including stocks, bonds, and cash. These moderately aggressive strategies prioritize capital appreciation over preservation. They typically expect volatility similar to a strategic equity exposure between 70% and 85%. Results are based on average total returns of similar funds with all dividends and capital gain distributions reinvested. |
Key Fund Statistics
| Fund's net assets | $188,523,079 |
| Total number of portfolio holdings | 16 |
| Total advisory fees paid | $327,265 |
| Portfolio turnover rate | 53% |
Asset Diversification
(as a Percentage of Net Asset Value)
(as a Percentage of Net Asset Value)
| Equity Funds | 82.4% |
| Fixed Income Funds | 14.8% |
| Short-Term Investments | 4.5% |
| Other Assets, Less Liabilities | (1.7)% |
| [1] | Reflects fee waivers and/or expense reimbursements, without which expenses would have been higher. |
| [2] | Reflects fee waivers and/or expense reimbursements, without which expenses would have been higher. |
| [3] | Reflects fee waivers and/or expense reimbursements, without which expenses would have been higher. |
| [4] | Reflects fee waivers and/or expense reimbursements, without which expenses would have been higher. |
| [5] | Reflects fee waivers and/or expense reimbursements, without which expenses would have been higher. |
| [6] | Reflects fee waivers and/or expense reimbursements, without which expenses would have been higher. |
| [7] | Excludes the fees and expenses of the acquired (underlying) funds in which the Fund invested. |
| [8] | Reflects fee waivers and/or expense reimbursements, without which expenses would have been higher. |
| [9] | Excludes the fees and expenses of the acquired (underlying) funds in which the Fund invested. |
| [10] | Reflects fee waivers and/or expense reimbursements, without which expenses would have been higher. |
| [11] | Excludes the fees and expenses of the acquired (underlying) funds in which the Fund invested. |
| [12] | Reflects fee waivers and/or expense reimbursements, without which expenses would have been higher. |
| [13] | Excludes the fees and expenses of the acquired (underlying) funds in which the Fund invested. |
| [14] | Reflects fee waivers and/or expense reimbursements, without which expenses would have been higher. |
| [15] | Excludes the fees and expenses of the acquired (underlying) funds in which the Fund invested. |
| [16] | Reflects fee waivers and/or expense reimbursements, without which expenses would have been higher. |
| [17] | Excludes the fees and expenses of the acquired (underlying) funds in which the Fund invested. |
| [18] | Excludes the fees and expenses of the acquired (underlying) funds in which the Fund invested. |
| [19] | Excludes the fees and expenses of the acquired (underlying) funds in which the Fund invested. |
| [20] | Excludes the fees and expenses of the acquired (underlying) funds in which the Fund invested. |
| [21] | Excludes the fees and expenses of the acquired (underlying) funds in which the Fund invested. |
| [22] | Excludes the fees and expenses of the acquired (underlying) funds in which the Fund invested. |
| [23] | Excludes the fees and expenses of the acquired (underlying) funds in which the Fund invested. |
| [24] | Excludes the fees and expenses of the acquired (underlying) funds in which the Fund invested. |
| [25] | Excludes the fees and expenses of the acquired (underlying) funds in which the Fund invested. |
| [26] | Excludes the fees and expenses of the acquired (underlying) funds in which the Fund invested. |
| [27] | Excludes the fees and expenses of the acquired (underlying) funds in which the Fund invested. |
| [28] | Excludes the fees and expenses of the acquired (underlying) funds in which the Fund invested. |
| [29] | Excludes the fees and expenses of the acquired (underlying) funds in which the Fund invested. |
| [30] | Excludes the fees and expenses of the acquired (underlying) funds in which the Fund invested. |
| [31] | Excludes the fees and expenses of the acquired (underlying) funds in which the Fund invested. |