| Costs of a $10,000 investment | Costs paid as a percentage of a $10,000 investment (annualized) | |
|---|---|---|
| Fund | $0† | 0.00%‡ |
| † | Amount is less than $1.00. |
| ‡ | Amount is less than 0.005%. |
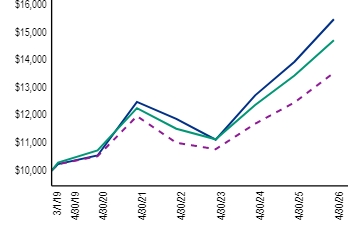
The Fund had a 2.51% total return in the six months ended April 30, 2026, compared with the Blended Benchmark,1 which returned 1.95%, and the ICE BofA U.S. All Capital Securities Index, which returned 1.39%.
Security selection and an overweight allocation to the banking sector contributed to relative performance during the period versus the Blended Benchmark.1 This was driven by a preference for higher-coupon securities with wider credit spreads and good call protection, which generally outperformed tighter credit spread and longer-duration preferreds amid rising interest rates.
An underweight allocation in the insurance sector also contributed to relative performance. The sector includes a number of high-quality, lower-yielding Japanese life insurance issues that generated only modest total returns in the period.
Security selection in the pipeline sector further aided relative performance, led by an out-of-benchmark position in an issue from Venture Global. The security rose materially due to the liquefied natural gas exporter's exposure to spot LNG prices, which increased meaningfully amid the U.S.–Iran conflict.
Security selection in the telecommunications sector modestly detracted from relative performance, as an issue from Japan-based Softbank Group was pressured along with AI- and software-related investments.
Top contributors |
Top detractors |
|---|---|
Banking/Brokerage |
Telecommunications |
Insurance |
|
Pipeline |
(as of April 30, 2026)
| 1 Year | 5 Years | Since inception (3/1/19) | |
|---|---|---|---|
| Fund2 | 11.07% | 4.41% | 6.31% |
| ICE BofA U.S. All Capital Securities Index | |||
| Blended Benchmark1 |
| Net assets | $422,791,355 |
|---|---|
| Number of portfolio holdings (excluding derivatives) | |
| Portfolio turnover rate3 | 26% |
| Top ten holdings4,5 | (%) |
|---|---|
| Citigroup, Inc., 6.875%, Series GG | |
| Bank of America Corp., 6.625%, Series OO | |
| Citigroup, Inc., 6.625%, Series HH | |
| Citigroup, Inc., 6.95%, Series FF | |
| ING Groep NV, 7.00% (Netherlands) | |
| Algonquin Power & Utilities Corp., 4.75%, due 1/18/82 (Canada) | |
| Enbridge, Inc., 8.50%, due 1/15/84 (Canada) | |
| Barclays PLC, 8.875% (United Kingdom) | |
| Goldman Sachs Group, Inc., 7.50%, Series X | |
| South Bow Canadian Infrastructure Holdings Ltd., 7.625%, due 3/1/55 (Canada) |
| Sector diversification4,6 | (%) |
|---|---|
| Banking | |
| Utilities | |
| Insurance | |
| Pipelines | |
| Telecommunications | |
| Financial Services | |
| Energy | |
| Consumer Discretionary Products | |
| Health Care | |
| Other (includes short-term investments) |
| Country diversification4,6 | (%) |
|---|---|
| United States | |
| Canada | |
| United Kingdom | |
| France | |
| Switzerland | |
| Netherlands | |
| Japan | |
| Spain | |
| Germany | |
| Other (includes short-term investments) |
| Top ten holdings4,5 | (%) |
|---|---|
| Citigroup, Inc., 6.875%, Series GG | |
| Bank of America Corp., 6.625%, Series OO | |
| Citigroup, Inc., 6.625%, Series HH | |
| Citigroup, Inc., 6.95%, Series FF | |
| ING Groep NV, 7.00% (Netherlands) | |
| Algonquin Power & Utilities Corp., 4.75%, due 1/18/82 (Canada) | |
| Enbridge, Inc., 8.50%, due 1/15/84 (Canada) | |
| Barclays PLC, 8.875% (United Kingdom) | |
| Goldman Sachs Group, Inc., 7.50%, Series X | |
| South Bow Canadian Infrastructure Holdings Ltd., 7.625%, due 3/1/55 (Canada) |