Shareholder Report
|
12 Months Ended |
|
Apr. 30, 2026
USD ($)
Holding
|
|---|
| Shareholder Report [Line Items] |
|
| Document Type |
N-CSR
|
| Amendment Flag |
false
|
| Registrant Name |
New York Life Investments Active ETF Trust
|
| Entity Central Index Key |
0001426439
|
| Entity Investment Company Type |
N-1A
|
| Document Period End Date |
Apr. 30, 2026
|
| Shareholder Report Annual or Semi-Annual |
annual shareholder report
|
| C000241259 |
|
| Shareholder Report [Line Items] |
|
| Fund Name |
NYLI CBRE Real Assets ETF
|
| Trading Symbol |
IQRA
|
| Security Exchange Name |
NYSEArca
|
| Annual or Semi-Annual Statement [Text Block] |
This annual shareholder report contains important information about NYLI CBRE Real Assets ETF (the "Fund") for the period of May 1, 2025 to April 30, 2026.
|
| Additional Information [Text Block] |
You can find additional information about the Fund at dfinview.com/NYLIM. You can also request this information by contacting us at 888-474-7725.
|
| Additional Information Phone Number |
888-474-7725
|
| Additional Information Website |
dfinview.com/NYLIM
|
| Expenses [Text Block] |
What were the Fund costs for the last year? (based on a hypothetical $10,000 investment) Table SummaryFund | Costs of a $10,000 investment | Costs paid as a percentage of a $10,000 investmentFootnote Reference1 |
|---|
NYLI CBRE Real Assets ETF | $71 | 0.65% |
|---|
| Footnote | Description | Footnote1 | Reflects fee waivers and/or expense reimbursements, without which expenses would have been higher. |
|
| Expenses Paid, Amount |
$ 71
|
| Expense Ratio, Percent |
0.65%
|
| Factors Affecting Performance [Text Block] |
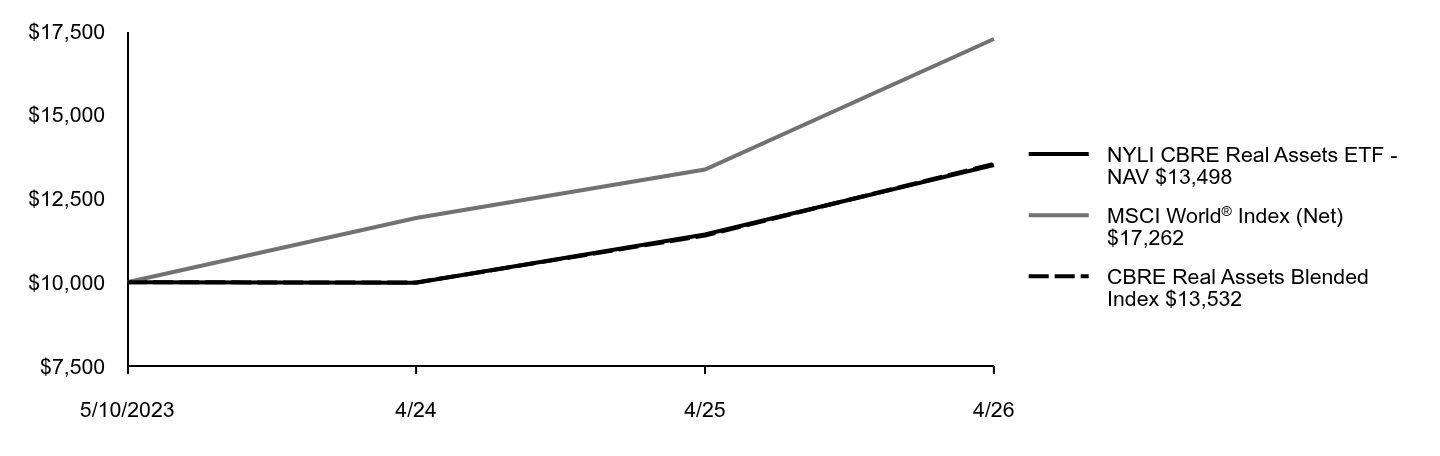
What factors influenced Fund performance during the reporting period?During the 12-month reporting period ended April 30, 2026, the Fund’s performance relative to the CBRE Real Assets Blended Index was affected by subsector positioning and security selection. Market conditions during the period reflected continued investor interest in real assets amid economic uncertainty, supported by attractive valuations and resilient underlying fundamentals. Growing power demand associated with expanding AI investment also strengthened the outlook for real assets, while improving sentiment toward earnings resilience contributed to a rebound in several previously underperforming sectors. The following table outlines the key factors (securities, sectors, industries, market events and/or other characteristics) that materially affected the Fund’s performance during the reporting period. |
| Performance Past Does Not Indicate Future [Text] |
Keep in mind that the Fund’s past performance is not a good predictor of how the Fund will perform in the future.
|
| Line Graph [Table Text Block] |
Table Summary | NYLI CBRE Real Assets ETF - NAV 13,498 | MSCI World® Index (Net)17,262 | CBRE Real Assets Blended Index13,532 |
|---|
5/10/2023 | 10,000 | 10,000 | 10,000 |
|---|
4/24 | 9,984 | 11,917 | 9,991 |
|---|
4/25 | 11,424 | 13,366 | 11,396 |
|---|
4/26 | 13,498 | 17,262 | 13,532 |
|---|
|
| Average Annual Return [Table Text Block] |
Table SummaryAverage Annual Total Returns for the Period Ended April 30, 2026 | Inception Date | One Year | Since Inception |
|---|
NYLI CBRE Real Assets ETF - NAV | 5/10/2023 | 18.16% | 10.61% |
|---|
MSCI World® Index (Net)Footnote Reference1 | | 29.16% | 20.14% |
|---|
CBRE Real Assets Blended IndexFootnote Reference2 | | 18.74% | 10.70% |
|---|
|
| Performance Inception Date |
May 10, 2023
|
| No Deduction of Taxes [Text Block] |
The graph and table do not reflect the deduction of taxes that a shareholder would pay on Fund distributions or redemption of Fund shares.
|
| AssetsNet |
$ 6,910,640
|
| Holdings Count | Holding |
102
|
| Advisory Fees Paid, Amount |
$ 0
|
| InvestmentCompanyPortfolioTurnover |
108.00%
|
| Additional Fund Statistics [Text Block] |
Table SummaryFund's net assets | $6,910,640 |
|---|
Total number of portfolio holdings | 102 |
|---|
Total advisory fees paid | $0 |
|---|
Portfolio turnover rate | 108% |
|---|
|
| Holdings [Text Block] |
Top Ten Holdings and/or Issuers*Table SummaryWelltower, Inc. | 6.5% |
|---|
Equinix, Inc. | 4.2% |
|---|
Simon Property Group, Inc. | 3.1% |
|---|
Xcel Energy, Inc. | 3.0% |
|---|
WEC Energy Group, Inc. | 2.6% |
|---|
Williams Cos., Inc. (The) | 2.0% |
|---|
Atmos Energy Corp. | 1.9% |
|---|
SSE PLC | 1.8% |
|---|
National Grid PLC | 1.7% |
|---|
First Industrial Realty Trust, Inc. | 1.7% |
|---|
* Excluding short-term investments Table SummaryUtilities | 28.3% |
|---|
Transportation | 11.9% |
|---|
Healthcare Facilities | 10.1% |
|---|
Diversified Property Holdings | 9.0% |
|---|
Retail: Enclosed Malls | 6.9% |
|---|
Industrial Properties | 6.7% |
|---|
Datacenters | 6.6% |
|---|
Midstream/Pipelines | 6.4% |
|---|
Residential | 2.9% |
|---|
Short-Term Investments | 2.2% |
|---|
Other | 9.0% |
|---|
|
| Material Fund Change [Text Block] |
|
| C000225893 |
|
| Shareholder Report [Line Items] |
|
| Fund Name |
NYLI MacKay Core Plus Bond ETF
|
| Trading Symbol |
CPLB
|
| Security Exchange Name |
NYSEArca
|
| Annual or Semi-Annual Statement [Text Block] |
This annual shareholder report contains important information about NYLI MacKay Core Plus Bond ETF (the "Fund") for the period of May 1, 2025 to April 30, 2026.
|
| Additional Information [Text Block] |
You can find additional information about the Fund at dfinview.com/NYLIM. You can also request this information by contacting us at 888-474-7725.
|
| Material Fund Change Notice [Text Block] |
This report describes changes to the Fund that occurred during the reporting period.
|
| Additional Information Phone Number |
888-474-7725
|
| Additional Information Website |
dfinview.com/NYLIM
|
| Expenses [Text Block] |
What were the Fund costs for the last year? (based on a hypothetical $10,000 investment) Table SummaryFund | Costs of a $10,000 investment | Costs paid as a percentage of a $10,000 investmentFootnote Reference1 |
|---|
NYLI MacKay Core Plus Bond ETF | $33 | 0.32% |
|---|
| Footnote | Description | Footnote1 | Reflects fee waivers and/or expense reimbursements, without which expenses would have been higher. |
|
| Expenses Paid, Amount |
$ 33
|
| Expense Ratio, Percent |
0.32%
|
| Factors Affecting Performance [Text Block] |
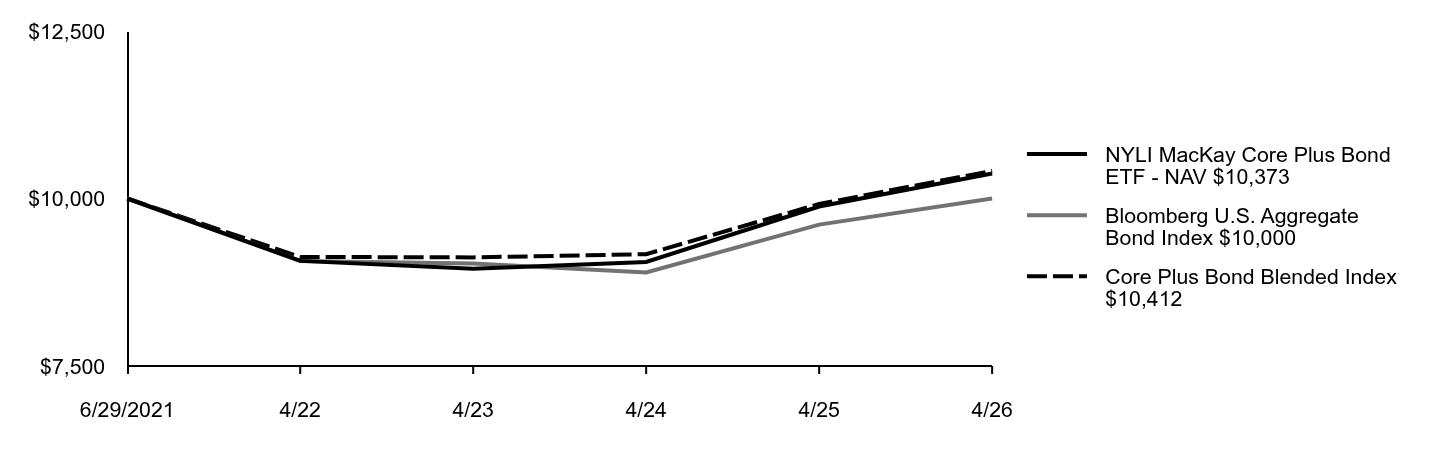
What factors influenced Fund performance during the reporting period?During the 12-month reporting period ended April 30, 2026, the Fund’s performance relative to the Bloomberg U.S. Aggregate Bond Index was affected by various allocation and selection factors. Market conditions during the period reflected moderating inflation, a gradual shift from restrictive monetary policy toward cautious central bank rate cuts and continued resilience in economic growth, which supported tight credit spreads and strong investor demand for yield-oriented assets. The Fund’s relative performance benefited from carry and spread tightening across credit-sensitive sectors, more than offsetting underweight exposure to rate-sensitive sectors. The following table outlines the key factors (securities, sectors, industries, market events and/or other characteristics) that materially affected the Fund’s performance during the reporting period. |
| Performance Past Does Not Indicate Future [Text] |
Keep in mind that the Fund’s past performance is not a good predictor of how the Fund will perform in the future.
|
| Line Graph [Table Text Block] |
Table Summary | NYLI MacKay Core Plus Bond ETF - NAV 10,373 | Bloomberg U.S. Aggregate Bond Index10,000 | Core Plus Bond Blended Index10,412 |
|---|
6/29/2021 | 10,000 | 10,000 | 10,000 |
|---|
4/22 | 9,069 | 9,068 | 9,128 |
|---|
4/23 | 8,950 | 9,029 | 9,121 |
|---|
4/24 | 9,052 | 8,897 | 9,169 |
|---|
4/25 | 9,881 | 9,610 | 9,918 |
|---|
4/26 | 10,373 | 10,000 | 10,412 |
|---|
|
| Average Annual Return [Table Text Block] |
Table SummaryAverage Annual Total Returns for the Period Ended April 30, 2026 | Inception Date | One Year | Since Inception |
|---|
NYLI MacKay Core Plus Bond ETF - NAV | 6/29/2021 | 4.98% | 0.76% |
|---|
Bloomberg U.S. Aggregate Bond IndexFootnote Reference1 | | 4.06% | 0.00% |
|---|
Core Plus Bond Blended IndexFootnote Reference2 | | 4.98% | 0.84% |
|---|
|
| Performance Inception Date |
Jun. 29, 2021
|
| No Deduction of Taxes [Text Block] |
The graph and table do not reflect the deduction of taxes that a shareholder would pay on Fund distributions or redemption of Fund shares.
|
| Material Change Date |
May 01, 2025
|
| AssetsNet |
$ 307,528,708
|
| Holdings Count | Holding |
872
|
| Advisory Fees Paid, Amount |
$ 671,076
|
| InvestmentCompanyPortfolioTurnover |
106.00%
|
| Additional Fund Statistics [Text Block] |
Table SummaryFund's net assets | $307,528,708 |
|---|
Total number of portfolio holdings | 872 |
|---|
Total advisory fees paid | $671,076 |
|---|
Portfolio turnover rate | 106% |
|---|
|
| Holdings [Text Block] |
Top Ten Holdings and/or Issuers*Table SummaryU.S. Treasury Bonds, 4.63%-4.75%, due 2/15/46 - 2/15/56 | 6.1% |
|---|
U.S. Treasury Notes, 3.88%-4.13%, due 4/15/29 - 2/15/36 | 5.1% |
|---|
Government National Mortgage Association, 0.00%-7.88%, due 7/20/44 - 3/16/66 | 3.9% |
|---|
Fannie Mae Pool, 2.00%-6.00%, due 10/1/50 - 6/1/54 | 3.4% |
|---|
Connecticut Avenue Securities Trust, 5.60%-13.01%, (1 Month SOFR + 2.00%), due 11/25/39 - 7/25/44 | 2.2% |
|---|
Freddie Mac Pool, 2.00%-6.00%, due 3/1/52 - 8/1/55 | 2.2% |
|---|
Freddie Mac REMICS, 0.00%-4.00%, due 6/25/50 - 6/25/55 | 1.3% |
|---|
RCKT Mortgage Trust, Series 2021-5 A1, 2.50%, due 11/25/51 | 1.1% |
|---|
Fannie Mae REMICS, 0.00%-5.00%, due 11/25/42 - 6/25/55 | 1.0% |
|---|
Freddie Mac STACR REMIC Trust, 5.00%-8.86%, (1 Month SOFR + 1.65%), due 4/25/42 - 1/25/50 | 1.0% |
|---|
* Excluding short-term investments Table SummaryMortgage Securities | 30.1% |
|---|
Asset-Backed Securities | 7.5% |
|---|
Banks | 6.1% |
|---|
U.S. Treasury Bond | 6.1% |
|---|
Electric | 5.2% |
|---|
U.S. Treasury Note | 5.1% |
|---|
Diversified Financial Services | 2.9% |
|---|
Pipelines | 2.7% |
|---|
Short-Term Investments | 2.3% |
|---|
Media | 1.8% |
|---|
Other | 30.2% |
|---|
|
| Material Fund Change [Text Block] |
The following is a summary of certain changes and planned changes to the Fund since May 1, 2025: Effective October 1, 2025, the Fund added an additional expense limitation arrangement to lower the Fund’s expense cap to 0.30% through August 28, 2026. For more complete information, you may review or order printed copies of the Fund’s next prospectus, which we expect to be available by August 28, 2026 at dfinview.com/NYLIM. You may also call 888-474-7725 to obtain a copy of the Fund’s current prospectus. |
| Material Fund Change Expenses [Text Block] |
Effective October 1, 2025, the Fund added an additional expense limitation arrangement to lower the Fund’s expense cap to 0.30% through August 28, 2026.
|
| Summary of Change Legend [Text Block] |
The following is a summary of certain changes and planned changes to the Fund since May 1, 2025:
|
| C000238088 |
|
| Shareholder Report [Line Items] |
|
| Fund Name |
NYLI MacKay High Income ETF
|
| Trading Symbol |
IQHI
|
| Security Exchange Name |
NYSEArca
|
| Annual or Semi-Annual Statement [Text Block] |
This annual shareholder report contains important information about NYLI MacKay High Income ETF (the "Fund") for the period of May 1, 2025 to April 30, 2026.
|
| Additional Information [Text Block] |
You can find additional information about the Fund at dfinview.com/NYLIM. You can also request this information by contacting us at 888-474-7725.
|
| Additional Information Phone Number |
888-474-7725
|
| Additional Information Website |
dfinview.com/NYLIM
|
| Expenses [Text Block] |
What were the Fund costs for the last year? (based on a hypothetical $10,000 investment) Table SummaryFund | Costs of a $10,000 investment | Costs paid as a percentage of a $10,000 investmentFootnote Reference1 |
|---|
NYLI MacKay High Income ETF | $42 | 0.40% |
|---|
| Footnote | Description | Footnote1 | Reflects fee waivers and/or expense reimbursements, without which expenses would have been higher. |
|
| Expenses Paid, Amount |
$ 42
|
| Expense Ratio, Percent |
0.40%
|
| Factors Affecting Performance [Text Block] |
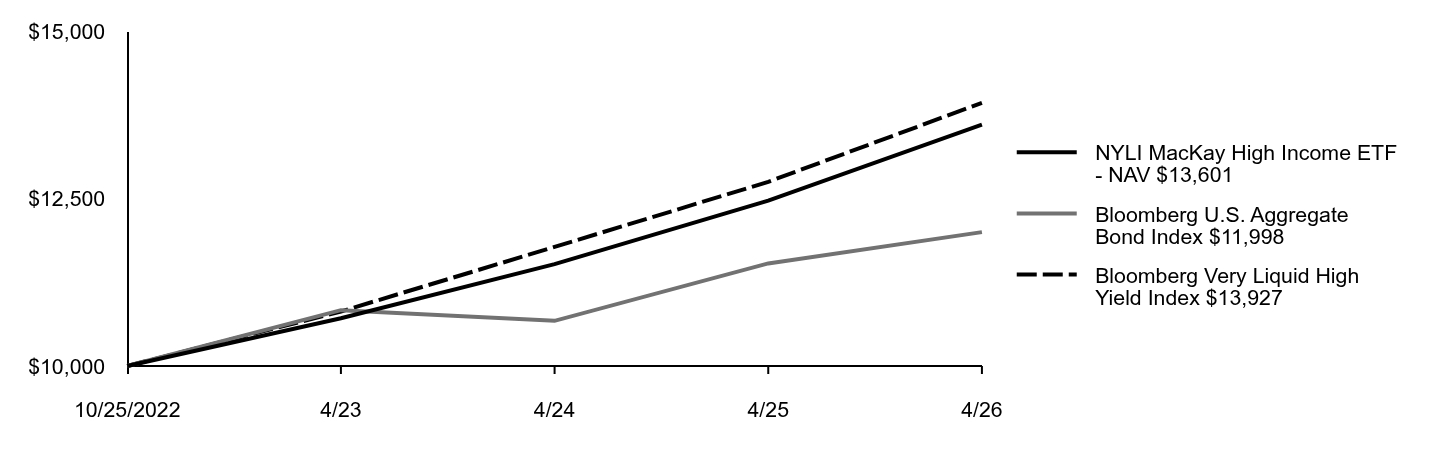
What factors influenced Fund performance during the reporting period?During the 12-month reporting period ended April 30, 2026, the Fund’s performance relative to the Bloomberg Very Liquid High Yield Index was affected by various allocation and selection factors. Market conditions during the period reflected moderating inflation, a gradual shift from restrictive monetary policy toward cautious central bank rate cuts and continued resilience in economic growth, which supported tight credit spreads and strong investor demand for yield-oriented assets. The Fund’s relative performance benefited from carry and spread tightening across credit-sensitive sectors, while selection and allocation effects in telecommunications, media and technology & electronics detracted. The following table outlines the key factors (securities, sectors, industries, market events and/or other characteristics) that materially affected the Fund’s performance during the reporting period. |
| Performance Past Does Not Indicate Future [Text] |
Keep in mind that the Fund’s past performance is not a good predictor of how the Fund will perform in the future.
|
| Line Graph [Table Text Block] |
Table Summary | NYLI MacKay High Income ETF - NAV 13,601 | Bloomberg U.S. Aggregate Bond Index11,998 | Bloomberg Very Liquid High Yield Index13,927 |
|---|
10/25/2022 | 10,000 | 10,000 | 10,000 |
|---|
4/23 | 10,712 | 10,833 | 10,814 |
|---|
4/24 | 11,521 | 10,674 | 11,777 |
|---|
4/25 | 12,468 | 11,531 | 12,749 |
|---|
4/26 | 13,601 | 11,998 | 13,927 |
|---|
|
| Average Annual Return [Table Text Block] |
Table SummaryAverage Annual Total Returns for the Period Ended April 30, 2026 | Inception Date | One Year | Since Inception |
|---|
NYLI MacKay High Income ETF - NAV | 10/25/2022 | 9.09% | 9.13% |
|---|
Bloomberg U.S. Aggregate Bond IndexFootnote Reference1 | | 4.06% | 5.31% |
|---|
Bloomberg Very Liquid High Yield IndexFootnote Reference2 | | 9.24% | 9.87% |
|---|
|
| Performance Inception Date |
Oct. 25, 2022
|
| No Deduction of Taxes [Text Block] |
The graph and table do not reflect the deduction of taxes that a shareholder would pay on Fund distributions or redemption of Fund shares.
|
| AssetsNet |
$ 112,783,030
|
| Holdings Count | Holding |
361
|
| Advisory Fees Paid, Amount |
$ 189,478
|
| InvestmentCompanyPortfolioTurnover |
55.00%
|
| Additional Fund Statistics [Text Block] |
Table SummaryFund's net assets | $112,783,030 |
|---|
Total number of portfolio holdings | 361 |
|---|
Total advisory fees paid | $189,478 |
|---|
Portfolio turnover rate | 55% |
|---|
|
| Holdings [Text Block] |
Top Ten Holdings and/or Issuers*Table SummaryCCO Holdings LLC / CCO Holdings Capital Corp., 4.25%-4.75%, due 3/1/30 - 1/15/34 | 2.3% |
|---|
Cloud Software Group, Inc., 6.50%-9.00%, due 3/31/29 - 6/30/32 | 1.3% |
|---|
XPLR Infrastructure Operating Partners LP, 7.25%-7.75%, due 1/15/29 - 4/15/34 | 1.2% |
|---|
Mineral Resources Ltd., 6.25%-9.25%, due 10/1/28 - 5/1/34 | 1.1% |
|---|
OneMain Finance Corp., 6.63%-7.50%, due 1/15/28 - 3/15/32 | 1.0% |
|---|
AmeriGas Partners LP / AmeriGas Finance Corp., 9.38%-9.50%, due 6/1/28 - 6/1/30 | 1.0% |
|---|
Newell Brands, Inc., 6.38%-8.50%, due 9/15/27 - 5/15/30 | 1.0% |
|---|
Hilcorp Energy I LP / Hilcorp Finance Co., 6.88%-7.25%, due 5/15/34 - 2/15/35 | 1.0% |
|---|
Post Holdings, Inc., 4.50%-6.50%, due 9/15/31 - 3/15/36 | 1.0% |
|---|
SM Energy Co., 6.63%-7.00%, due 8/1/32 - 4/15/34 | 0.9% |
|---|
* Excluding short-term investments Table SummaryMedia | 9.5% |
|---|
Oil & Gas | 8.2% |
|---|
Commercial Services | 7.3% |
|---|
Retail | 6.4% |
|---|
Electric | 5.7% |
|---|
Diversified Financial Services | 4.7% |
|---|
Telecommunications | 4.7% |
|---|
Short-Term Investments | 4.5% |
|---|
Chemicals | 3.7% |
|---|
Healthcare-Services | 3.5% |
|---|
Other | 41.8% |
|---|
|
| Material Fund Change [Text Block] |
|
| C000248469 |
|
| Shareholder Report [Line Items] |
|
| Fund Name |
NYLI MacKay Securitized Income ETF
|
| Trading Symbol |
SECR
|
| Security Exchange Name |
NYSEArca
|
| Annual or Semi-Annual Statement [Text Block] |
This annual shareholder report contains important information about NYLI MacKay Securitized Income ETF (the "Fund") for the period of May 1, 2025 to April 30, 2026.
|
| Additional Information [Text Block] |
You can find additional information about the Fund at dfinview.com/NYLIM. You can also request this information by contacting us at 888-474-7725.
|
| Material Fund Change Notice [Text Block] |
This report describes changes to the Fund that occurred during the reporting period.
|
| Additional Information Phone Number |
888-474-7725
|
| Additional Information Website |
dfinview.com/NYLIM
|
| Expenses [Text Block] |
What were the Fund costs for the period since inception? (based on a hypothetical $10,000 investment) Table SummaryFund | Costs of a $10,000 investment | Costs paid as a percentage of a $10,000 investmentFootnote Reference1 |
|---|
NYLI MacKay Securitized Income ETF | $34 | 0.33% |
|---|
| Footnote | Description | Footnote1 | Reflects fee waivers and/or expense reimbursements, without which expenses would have been higher. |
|
| Expenses Paid, Amount |
$ 34
|
| Expense Ratio, Percent |
0.33%
|
| Factors Affecting Performance [Text Block] |
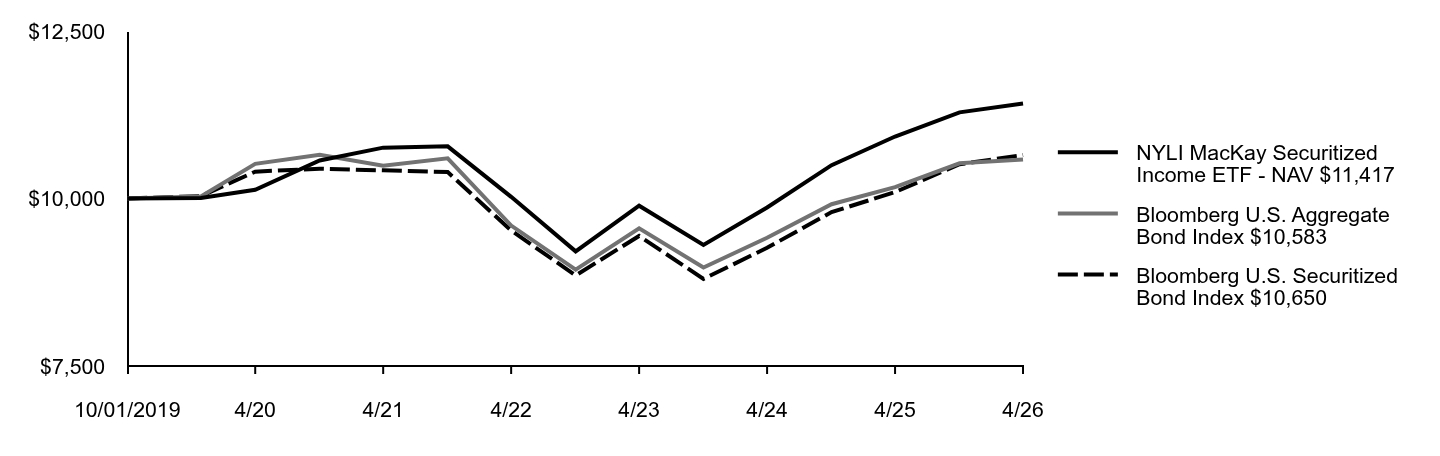
What factors influenced Fund performance during the reporting period?During the 12-month reporting period ended April 30, 2026, the Fund’s performance relative to the Bloomberg U.S. Securitized Bond Index was affected primarily by allocation and selection factors. Market conditions reflected moderating inflation, a gradual shift from restrictive monetary policy toward cautious central bank rate cuts and resilient economic growth, which supported tight credit spreads and returns driven largely by carry and spread tightening. Positioning in non-agency commercial mortgage-backed securities (“CMBS”), credit risk transfer bonds and non-agency residential mortgage-backed securities (“RMBS”) supported the Fund’s relative performance, while agency passthroughs and agency CMBS detracted. The following table outlines the key factors (securities, sectors, industries, market events and/or other characteristics) that materially affected the Fund’s performance during the reporting period. |
| Performance Past Does Not Indicate Future [Text] |
Keep in mind that the Fund’s past performance is not a good predictor of how the Fund will perform in the future.
|
| Line Graph [Table Text Block] |
Table Summary | NYLI MacKay Securitized Income ETF - NAV 11,417 | Bloomberg U.S. Aggregate Bond Index 10,583 | Bloomberg U.S. Securitized Bond Index 10,650 |
|---|
10/01/2019 | 10,000 | 10,000 | 10,000 |
|---|
1/31/2020 | 10,007 | 10,030 | 10,035 |
|---|
4/30/2020 | 10,131 | 10,517 | 10,401 |
|---|
10/31/2020 | 10,567 | 10,651 | 10,445 |
|---|
4/30/2021 | 10,759 | 10,489 | 10,420 |
|---|
10/31/2021 | 10,778 | 10,600 | 10,395 |
|---|
4/30/2022 | 10,025 | 9,596 | 9,522 |
|---|
10/31/2022 | 9,211 | 8,938 | 8,852 |
|---|
4/30/2023 | 9,892 | 9,555 | 9,441 |
|---|
10/31/2023 | 9,307 | 8,969 | 8,800 |
|---|
4/30/2024 | 9,865 | 9,415 | 9,264 |
|---|
10/31/2024 | 10,497 | 9,915 | 9,797 |
|---|
4/30/2025 | 10,925 | 10,170 | 10,096 |
|---|
10/31/2025 | 11,286 | 10,526 | 10,511 |
|---|
4/30/2026 | 11,417 | 10,583 | 10,650 |
|---|
|
| Average Annual Return [Table Text Block] |
Table SummaryAverage Annual Total Returns for the Period Ended April 30, 2026 | Inception Date | One Year | Five Years | Since Inception |
|---|
NYLI MacKay Securitized Income ETF - NAV* | 10/1/2019 | 4.51% | 1.20% | 2.03% |
|---|
Bloomberg U.S. Aggregate Bond IndexFootnote Reference1 | | 4.06% | 0.18% | 0.86% |
|---|
Bloomberg U.S. Securitized Bond IndexFootnote Reference2 | | 5.49% | 0.44% | 0.96% |
|---|
|
| Performance Inception Date |
Oct. 01, 2019
|
| No Deduction of Taxes [Text Block] |
The graph and table do not reflect the deduction of taxes that a shareholder would pay on Fund distributions or redemption of Fund shares.
|
| Material Change Date |
May 01, 2025
|
| AssetsNet |
$ 160,378,084
|
| Holdings Count | Holding |
462
|
| Advisory Fees Paid, Amount |
$ 379,255
|
| InvestmentCompanyPortfolioTurnover |
70.00%
|
| Additional Fund Statistics [Text Block] |
Table SummaryFund's net assets | $160,378,084 |
|---|
Total number of portfolio holdings | 462 |
|---|
Total advisory fees paid | $379,255 |
|---|
Portfolio turnover rate | 70% |
|---|
|
| Holdings [Text Block] |
Top Ten Holdings and/or Issuers*Table SummaryFannie Mae Pool, 2.00%-6.00%, due 5/1/43 - 2/1/55 | 18.6% |
|---|
Freddie Mac Pool, 2.00%-6.00%, due 1/1/46 - 12/1/55 | 14.2% |
|---|
Government National Mortgage Association, 0.00%-7.09%, due 7/20/44 - 3/16/66 | 3.1% |
|---|
J.P. Morgan Mortgage Trust, 0.22%-6.00%, due 3/25/50 - 4/25/55 | 2.7% |
|---|
RCKT Mortgage Trust, 2.50%, due 11/25/51 - 2/25/52 | 2.4% |
|---|
Connecticut Avenue Securities Trust, 5.60%-13.15%, (1 Month SOFR + 6.86%), due 11/25/39 - 7/25/44 | 2.1% |
|---|
Flagship Credit Auto Trust, 1.27%-5.80%, due 3/15/27 - 2/15/30 | 1.5% |
|---|
Fannie Mae REMICS, 1.25%-5.50%, due 10/25/35 - 6/25/55 | 1.4% |
|---|
Freddie Mac STACR REMIC Trust, 6.30%-14.65%, (1 Month SOFR + 6.25%), due 1/25/34 - 1/25/51 | 1.3% |
|---|
Zayo Issuer LLC, 5.57%-8.44%, due 3/20/55 - 10/20/55 | 1.2% |
|---|
* Excluding short-term investments Table SummaryMortgage Securities | 80.5% |
|---|
Asset-Backed Securities | 15.8% |
|---|
Collateralized Loan Obligations | 1.7% |
|---|
Short-Term Investments | 1.6% |
|---|
U.S. Treasury Note | 1.0% |
|---|
Other Asset and Liabilities | (0.6)% |
|---|
|
| Material Fund Change [Text Block] |
The following is a summary of certain changes and planned changes to the Fund since May 1, 2025: Effective October 1, 2025, the Fund added an additional expense limitation arrangement to lower the Fund’s expense cap to 0.28% through August 28, 2026. For more complete information, you may review or order printed copies of the Fund’s next prospectus, which we expect to be available by August 28, 2026 at dfinview.com/NYLIM. You may also call 888-474-7725 to obtain a copy of the Fund’s current prospectus. |
| Material Fund Change Expenses [Text Block] |
Effective October 1, 2025, the Fund added an additional expense limitation arrangement to lower the Fund’s expense cap to 0.28% through August 28, 2026.
|
| Summary of Change Legend [Text Block] |
The following is a summary of certain changes and planned changes to the Fund since May 1, 2025:
|
| C000267030 |
|
| Shareholder Report [Line Items] |
|
| Fund Name |
NYLI MacKay Muni Allocation ETF
|
| Trading Symbol |
MMMA
|
| Security Exchange Name |
NYSEArca
|
| Annual or Semi-Annual Statement [Text Block] |
This annual shareholder report contains important information about NYLI MacKay Muni Allocation ETF (the "Fund") for the period of December 16, 2025 to April 30, 2026.
|
| Additional Information [Text Block] |
You can find additional information about the Fund at dfinview.com/NYLIM. You can also request this information by contacting us at 888-474-7725.
|
| Additional Information Phone Number |
888-474-7725
|
| Additional Information Website |
dfinview.com/NYLIM
|
| Expenses [Text Block] |
What were the Fund costs for the last year? (based on a hypothetical $10,000 investment) Table SummaryFund | Costs of a $10,000 investmentFootnote Reference1 | Costs paid as a percentage of a $10,000 investmentFootnote Reference2,Footnote Reference3 |
|---|
NYLI MacKay Muni Allocation ETF | $13 | 0.35% |
|---|
| Footnote | Description | Footnote1 | The Fund commenced operations on December 16, 2025. Expenses for a full reporting period would be higher than the amount shown. | Footnote2 | Reflects fee waivers and/or expense reimbursements, without which expenses would have been higher. | Footnote3 | Annualized. |
|
| Expenses Paid, Amount |
$ 13
|
| Expense Ratio, Percent |
0.35%
|
| Factors Affecting Performance [Text Block] |
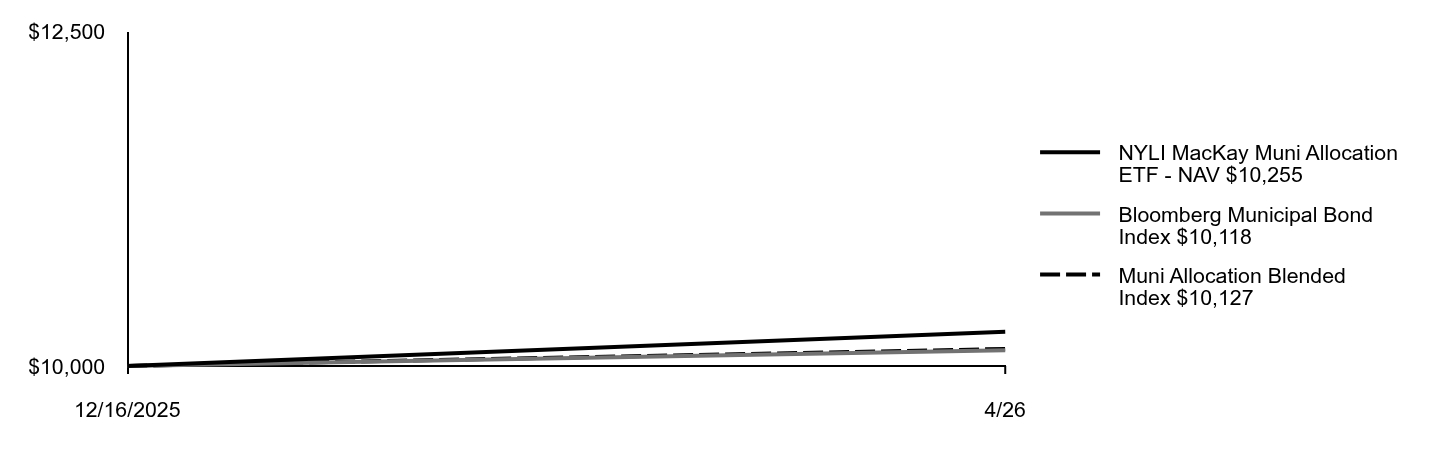
What factors influenced Fund performance during the reporting period?Since its inception on December 16, 2025, through April 30, 2026, the Fund’s performance relative to the Bloomberg Municipal Bond Index was primarily affected by strong security selection. Curve positioning was also beneficial as longer maturity bonds outperformed and overweight exposure to this segment, along with strong security selection, bolstered returns. Duration posture hindered performance in relative terms. The following table outlines the key factors (securities, sectors, industries, market events and/or other characteristics) that materially affected the Fund’s performance during the reporting period. |
| Performance Past Does Not Indicate Future [Text] |
Keep in mind that the Fund’s past performance is not a good predictor of how the Fund will perform in the future.
|
| Line Graph [Table Text Block] |
Table Summary | NYLI MacKay Muni Allocation ETF - NAV 10,255 | Bloomberg Municipal Bond Index10,118 | Muni Allocation Blended Index10,127 |
|---|
12/16/2025 | 10,000 | 10,000 | 10,000 |
|---|
4/26 | 10,255 | 10,118 | 10,127 |
|---|
|
| Average Annual Return [Table Text Block] |
Table SummaryAverage Annual Total Returns for the Period Ended April 30, 2026 | Inception Date | Since InceptionFootnote Reference1 |
|---|
NYLI MacKay Muni Allocation ETF - NAV | 12/16/2025 | 2.55% |
|---|
Bloomberg Municipal Bond IndexFootnote Reference2 | | 1.18% |
|---|
Muni Allocation Blended IndexFootnote Reference3 | | 1.27% |
|---|
|
| Performance Inception Date |
Dec. 16, 2025
|
| No Deduction of Taxes [Text Block] |
The graph and table do not reflect the deduction of taxes that a shareholder would pay on Fund distributions or redemption of Fund shares.
|
| AssetsNet |
$ 27,759,297
|
| Holdings Count | Holding |
47
|
| Advisory Fees Paid, Amount |
$ 0
|
| InvestmentCompanyPortfolioTurnover |
40.00%
|
| Additional Fund Statistics [Text Block] |
Table SummaryFund's net assets | $27,759,297 |
|---|
Total number of portfolio holdings | 47 |
|---|
Total advisory fees paid | $0 |
|---|
Portfolio turnover rate | 40% |
|---|
|
| Holdings [Text Block] |
Top Ten Holdings and/or Issuers*Table SummaryNatomas Unified School District, 0.05%, due 8/1/28 | 4.5% |
|---|
South Carolina Public Service Authority, Series B, 5.00%, due 12/1/46 | 4.1% |
|---|
Pennsylvania Economic Development Financing Authority, Series B, 5.00%, due 6/15/31 | 3.9% |
|---|
Black Belt Energy Gas District, Series B, 5.00%, due 12/1/34 | 3.9% |
|---|
Los Angeles Department of Water & Power Water System Revenue, Series C, 5.00%, due 7/1/44 | 3.9% |
|---|
Chicago O'Hare International Airport, Series E, 5.50%, due 1/1/48 | 3.8% |
|---|
Northern California Energy Authority, 5.00%, due 12/1/54 | 3.8% |
|---|
Main Street Energy, Inc., Series D, 5.00%, due 12/1/33 | 3.8% |
|---|
Illinois State Toll Highway Authority, Series B, 5.00%, due 1/1/37 | 3.8% |
|---|
Denver City & County Housing Authority, Series A, 5.00%, due 12/1/45 | 3.7% |
|---|
* Excluding short-term investments Table SummaryIllinois | 15.3% |
|---|
California | 12.8% |
|---|
Colorado | 8.6% |
|---|
Texas | 7.7% |
|---|
Puerto Rico | 6.7% |
|---|
South Carolina | 4.1% |
|---|
Alabama | 4.0% |
|---|
Pennsylvania | 3.9% |
|---|
Georgia | 3.8% |
|---|
Arizona | 3.7% |
|---|
Other | 29.4% |
|---|
|
| Material Fund Change [Text Block] |
|
| C000184310 |
|
| Shareholder Report [Line Items] |
|
| Fund Name |
NYLI MacKay Muni Insured ETF
|
| Trading Symbol |
MMIN
|
| Security Exchange Name |
NYSEArca
|
| Annual or Semi-Annual Statement [Text Block] |
This annual shareholder report contains important information about NYLI MacKay Muni Insured ETF (the "Fund") for the period of May 1, 2025 to April 30, 2026.
|
| Additional Information [Text Block] |
You can find additional information about the Fund at dfinview.com/NYLIM. You can also request this information by contacting us at 888-474-7725.
|
| Additional Information Phone Number |
888-474-7725
|
| Additional Information Website |
dfinview.com/NYLIM
|
| Expenses [Text Block] |
What were the Fund costs for the last year? (based on a hypothetical $10,000 investment) Table SummaryFund | Costs of a $10,000 investment | Costs paid as a percentage of a $10,000 investmentFootnote Reference1 |
|---|
NYLI MacKay Muni Insured ETF | $31 | 0.30% |
|---|
| Footnote | Description | Footnote1 | Reflects fee waivers and/or expense reimbursements, without which expenses would have been higher. |
|
| Expenses Paid, Amount |
$ 31
|
| Expense Ratio, Percent |
0.30%
|
| Factors Affecting Performance [Text Block] |
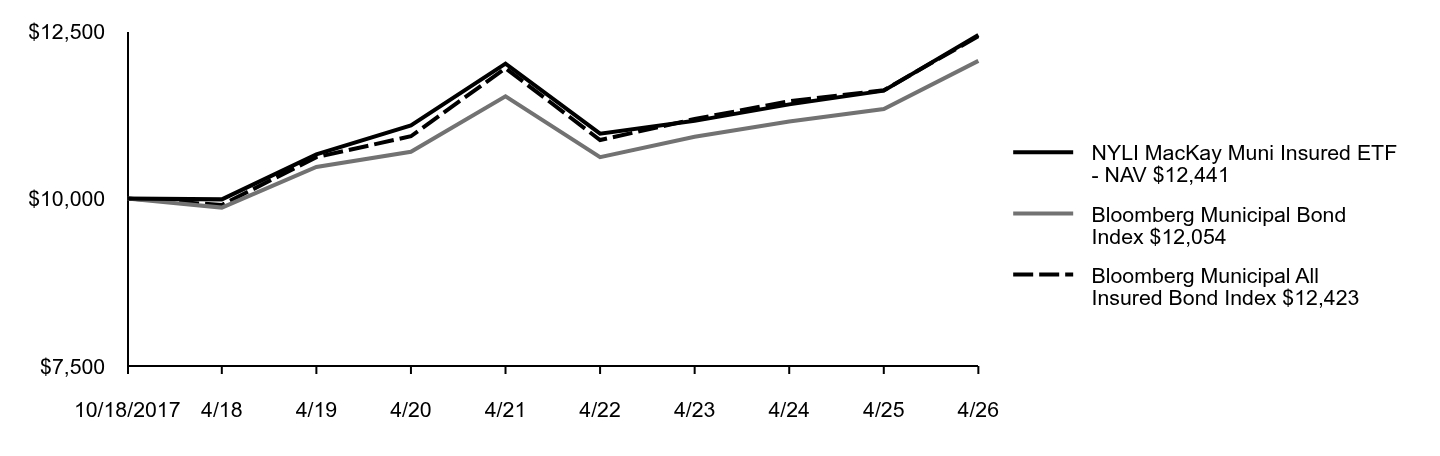
What factors influenced Fund performance during the reporting period?During the 12-month reporting period ended April 30, 2026, the Fund’s performance relative to the Bloomberg Municipal All Insured Bond Index was primarily impacted by various factors. The Fund employed an overweight to longer maturity positions based on relative value considerations. Longer-maturity bonds outperformed over the period and the Fund benefited from its positioning. Strong selection in the local general obligation sector also drove relative results. The following table outlines the key factors (securities, sectors, industries, market events and/or other characteristics) that materially affected the Fund’s performance during the reporting period. |
| Performance Past Does Not Indicate Future [Text] |
Keep in mind that the Fund’s past performance is not a good predictor of how the Fund will perform in the future.
|
| Line Graph [Table Text Block] |
Table Summary | NYLI MacKay Muni Insured ETF - NAV 12,441 | Bloomberg Municipal Bond Index12,054 | Bloomberg Municipal All Insured Bond Index12,423 |
|---|
10/18/2017 | 10,000 | 10,000 | 10,000 |
|---|
4/18 | 9,987 | 9,864 | 9,903 |
|---|
4/19 | 10,658 | 10,471 | 10,617 |
|---|
4/20 | 11,090 | 10,697 | 10,929 |
|---|
4/21 | 12,012 | 11,526 | 11,945 |
|---|
4/22 | 10,968 | 10,617 | 10,872 |
|---|
4/23 | 11,159 | 10,922 | 11,186 |
|---|
4/24 | 11,405 | 11,150 | 11,452 |
|---|
4/25 | 11,610 | 11,335 | 11,615 |
|---|
4/26 | 12,441 | 12,054 | 12,423 |
|---|
|
| Average Annual Return [Table Text Block] |
Table SummaryAverage Annual Total Returns for the Period Ended April 30, 2026 | Inception Date | One Year | Five Years | Since Inception |
|---|
NYLI MacKay Muni Insured ETF - NAV | 10/18/2017 | 7.16% | 0.70% | 2.59% |
|---|
Bloomberg Municipal Bond IndexFootnote Reference1 | | 6.34% | 0.90% | 2.21% |
|---|
Bloomberg Municipal All Insured Bond IndexFootnote Reference2 | | 6.96% | 0.79% | 2.57% |
|---|
|
| Performance Inception Date |
Oct. 18, 2017
|
| No Deduction of Taxes [Text Block] |
The graph and table do not reflect the deduction of taxes that a shareholder would pay on Fund distributions or redemption of Fund shares.
|
| AssetsNet |
$ 425,197,787
|
| Holdings Count | Holding |
211
|
| Advisory Fees Paid, Amount |
$ 905,375
|
| InvestmentCompanyPortfolioTurnover |
59.00%
|
| Additional Fund Statistics [Text Block] |
Table SummaryFund's net assets | $425,197,787 |
|---|
Total number of portfolio holdings | 211 |
|---|
Total advisory fees paid | $905,375 |
|---|
Portfolio turnover rate | 59% |
|---|
|
| Holdings [Text Block] |
Top Ten Holdings and/or Issuers*Table SummaryNew York Transportation Development Corp., 5.00%-6.00%, due 6/30/44 - 6/30/55 | 3.3% |
|---|
Pennsylvania Economic Development Financing Authority, 5.50%-5.75%, due 6/30/42 - 12/31/62 | 2.0% |
|---|
Grand River Hospital District, 6.00%, due 12/1/38 - 12/1/45 | 2.0% |
|---|
Allegheny County Airport Authority, 5.25%-5.50%, due 1/1/39 - 1/1/50 | 1.8% |
|---|
Wayne County Airport Authority, Series B, 5.50%, due 12/1/48 | 1.7% |
|---|
Southwestern Illinois Development Authority, 5.50%, due 12/1/40 - 4/1/50 | 1.7% |
|---|
Los Angeles Department of Water & Power, 5.00%, due 7/1/48 - 7/1/55 | 1.6% |
|---|
Greater Asheville Regional Airport Authority, 5.25%, due 7/1/41 - 7/1/53 | 1.6% |
|---|
City of Houston TX Hotel Occupancy Tax & Special Revenue, 5.25%-5.50%, due 9/1/51 - 9/1/58 | 1.6% |
|---|
County of Pasco FL Solid Waste Disposal & Resource Recovery System Revenue, 5.50%, due 10/1/51 - 10/1/56 | 1.5% |
|---|
* Excluding short-term investments Table SummaryIllinois | 15.2% |
|---|
Texas | 14.7% |
|---|
California | 9.8% |
|---|
Pennsylvania | 6.5% |
|---|
Florida | 6.3% |
|---|
New York | 5.4% |
|---|
Colorado | 3.9% |
|---|
Michigan | 3.4% |
|---|
Washington | 2.7% |
|---|
Short-Term Investments | 2.6% |
|---|
Other | 29.5% |
|---|
|
| Material Fund Change [Text Block] |
|
| C000257922 |
|
| Shareholder Report [Line Items] |
|
| Fund Name |
NYLI MacKay Muni Short Duration ETF
|
| Trading Symbol |
MMSD
|
| Security Exchange Name |
NYSEArca
|
| Annual or Semi-Annual Statement [Text Block] |
This annual shareholder report contains important information about NYLI MacKay Muni Short Duration ETF (the "Fund") for the period of May 6, 2025 to April 30, 2026.
|
| Additional Information [Text Block] |
You can find additional information about the Fund at dfinview.com/NYLIM. You can also request this information by contacting us at 888-474-7725.
|
| Additional Information Phone Number |
888-474-7725
|
| Additional Information Website |
dfinview.com/NYLIM
|
| Expenses [Text Block] |
What were the Fund costs for the last year? (based on a hypothetical $10,000 investment) Table SummaryFund | Costs of a $10,000 investmentFootnote Reference1 | Costs paid as a percentage of a $10,000 investmentFootnote Reference2,Footnote Reference3 |
|---|
NYLI MacKay Muni Short Duration ETF | $25 | 0.25% |
|---|
| Footnote | Description | Footnote1 | The Fund commenced operations on May 6, 2025. Expenses for a full reporting period would be higher than the amount shown. | Footnote2 | Reflects fee waivers and/or expense reimbursements, without which expenses would have been higher. | Footnote3 | Annualized. |
|
| Expenses Paid, Amount |
$ 25
|
| Expense Ratio, Percent |
0.25%
|
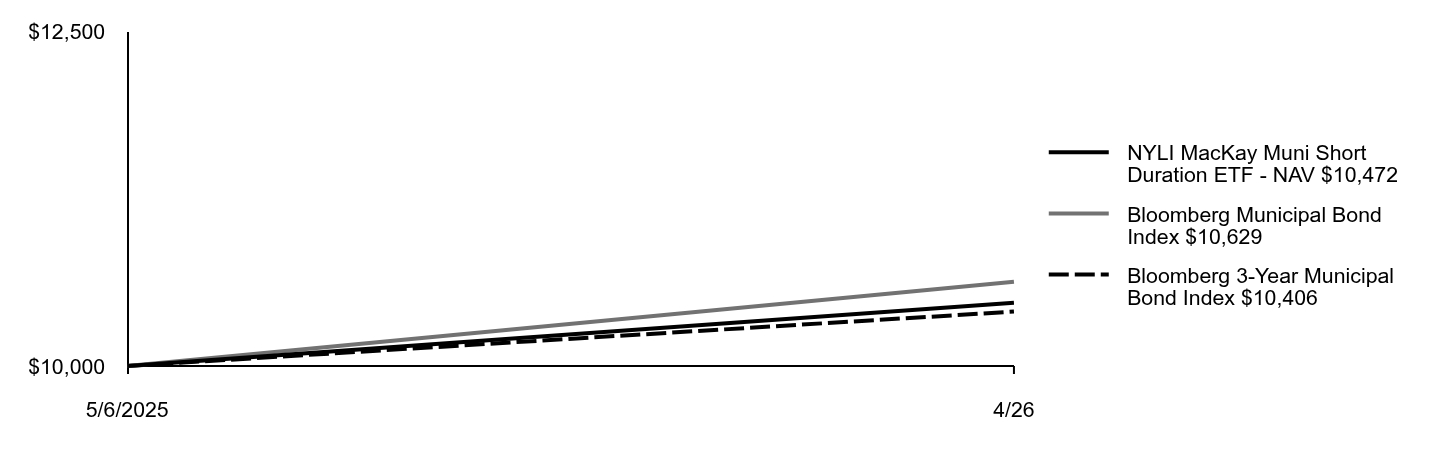
| Factors Affecting Performance [Text Block] |
What factors influenced Fund performance during the reporting period?During the 12-month reporting period ended April 30, 2026, the Fund’s performance relative to the Bloomberg 3-Year Municipal Bond Index was affected primarily by security selection. In addition, out-of-Index exposure to longer-dated bonds bolstered relative returns. Overweight allocation to the strong-performing housing sector further supported relative performance. The following table outlines the key factors (securities, sectors, industries, market events and/or other characteristics) that materially affected the Fund’s performance during the reporting period. |
| Performance Past Does Not Indicate Future [Text] |
Keep in mind that the Fund’s past performance is not a good predictor of how the Fund will perform in the future.
|
| Line Graph [Table Text Block] |
Table Summary | NYLI MacKay Muni Short Duration ETF - NAV 10,472 | Bloomberg Municipal Bond Index10,629 | Bloomberg 3-Year Municipal Bond Index10,406 |
|---|
5/6/2025 | 10,000 | 10,000 | 10,000 |
|---|
4/26 | 10,472 | 10,629 | 10,406 |
|---|
|
| Average Annual Return [Table Text Block] |
Table SummaryAverage Annual Total Returns for the Period Ended April 30, 2026 | Inception Date | Since InceptionFootnote Reference1 |
|---|
NYLI MacKay Muni Short Duration ETF - NAV | 5/6/2025 | 4.72% |
|---|
Bloomberg Municipal Bond IndexFootnote Reference2 | | 6.29% |
|---|
Bloomberg 3-Year Municipal Bond IndexFootnote Reference3 | | 4.06% |
|---|
|
| Performance Inception Date |
May 06, 2025
|
| No Deduction of Taxes [Text Block] |
The graph and table do not reflect the deduction of taxes that a shareholder would pay on Fund distributions or redemption of Fund shares.
|
| AssetsNet |
$ 61,953,333
|
| Holdings Count | Holding |
130
|
| Advisory Fees Paid, Amount |
$ 36,148
|
| InvestmentCompanyPortfolioTurnover |
158.00%
|
| Additional Fund Statistics [Text Block] |
Table SummaryFund's net assets | $61,953,333 |
|---|
Total number of portfolio holdings | 130 |
|---|
Total advisory fees paid | $36,148 |
|---|
Portfolio turnover rate | 158% |
|---|
|
| Holdings [Text Block] |
Top Ten Holdings and/or Issuers*Table SummaryCalifornia Community Choice Financing Authority, 5.00%-5.25%, due 11/1/33 - 1/1/54 | 3.0% |
|---|
New Hampshire Business Finance Authority, 4.00%-5.88%, due 12/1/28 - 12/15/33 | 2.5% |
|---|
Southeast Energy Authority A Cooperative District, 4.00%-5.00%, due 10/1/30 - 5/1/55 | 2.2% |
|---|
Village of Pingree Grove IL, 3.50%, due 3/1/31 | 2.0% |
|---|
California Health Facilities Financing Authority, Series B, 3.00%, due 2/1/45 | 1.9% |
|---|
Industrial Development Authority of the City of Phoenix Arizona (The), Series A, 3.30%, due 11/15/52 | 1.9% |
|---|
North Carolina Medical Care Commission, 3.35%-3.75%, due 10/1/30 - 1/1/31 | 1.9% |
|---|
Michigan Finance Authority, 3.27%-3.94%, (Municipal Swap Index + 0.85%), due 6/1/39 - 12/1/39 | 1.9% |
|---|
Buckeye Tobacco Settlement Financing Authority, Series 2, 5.00%, due 6/1/32 | 1.7% |
|---|
New York City Housing Development Corp., Series 2024-8SPR A, 5.46%, due 12/15/31 | 1.6% |
|---|
* Excluding short-term investments Table SummaryTexas | 12.3% |
|---|
California | 8.7% |
|---|
Georgia | 6.6% |
|---|
New York | 6.2% |
|---|
Alabama | 4.6% |
|---|
North Carolina | 4.4% |
|---|
Arizona | 4.3% |
|---|
Illinois | 4.3% |
|---|
Indiana | 4.3% |
|---|
New Jersey | 3.6% |
|---|
Other | 40.7% |
|---|
|
| Material Fund Change [Text Block] |
|
| C000184311 |
|
| Shareholder Report [Line Items] |
|
| Fund Name |
NYLI MacKay Muni Intermediate ETF
|
| Trading Symbol |
MMIT
|
| Security Exchange Name |
NYSEArca
|
| Annual or Semi-Annual Statement [Text Block] |
This annual shareholder report contains important information about NYLI MacKay Muni Intermediate ETF (the "Fund") for the period of May 1, 2025 to April 30, 2026.
|
| Additional Information [Text Block] |
You can find additional information about the Fund at dfinview.com/NYLIM. You can also request this information by contacting us at 888-474-7725.
|
| Additional Information Phone Number |
888-474-7725
|
| Additional Information Website |
dfinview.com/NYLIM
|
| Expenses [Text Block] |
What were the Fund costs for the last year? (based on a hypothetical $10,000 investment) Table SummaryFund | Costs of a $10,000 investment | Costs paid as a percentage of a $10,000 investmentFootnote Reference1 |
|---|
NYLI MacKay Muni Intermediate ETF | $31 | 0.30% |
|---|
| Footnote | Description | Footnote1 | Reflects fee waivers and/or expense reimbursements, without which expenses would have been higher. |
|
| Expenses Paid, Amount |
$ 31
|
| Expense Ratio, Percent |
0.30%
|
| Factors Affecting Performance [Text Block] |
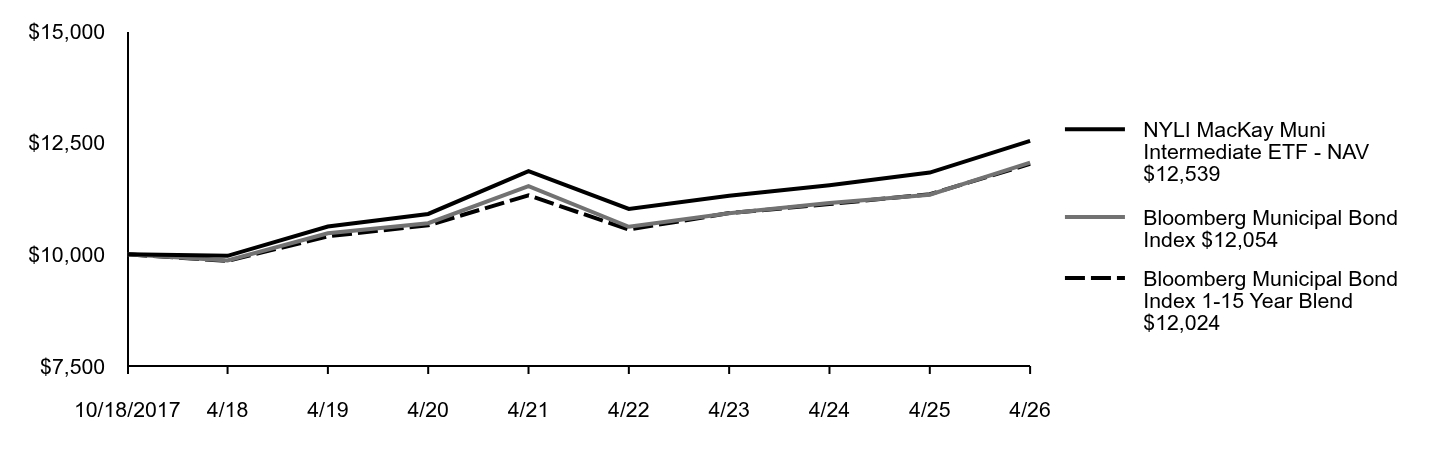
What factors influenced Fund performance during the reporting period?During the 12-month reporting period ended April 30, 2026, the Fund’s performance relative to the Bloomberg Municipal Bond Index 1-15 Year Blend was primarily affected by strong curve positioning. Sector selection was also beneficial, aided by the outperformance of the overweighted housing sector and positive coupon selection. In terms of sector allocation, underweight positions in transportation and state general obligations detracted. The following table outlines the key factors (securities, sectors, industries, market events and/or other characteristics) that materially affected the Fund’s performance during the reporting period. |
| Performance Past Does Not Indicate Future [Text] |
Keep in mind that the Fund’s past performance is not a good predictor of how the Fund will perform in the future.
|
| Line Graph [Table Text Block] |
Table Summary | NYLI MacKay Muni Intermediate ETF - NAV 12,539 | Bloomberg Municipal Bond Index12,054 | Bloomberg Municipal Bond Index 1-15 Year Blend12,024 |
|---|
10/18/2017 | 10,000 | 10,000 | 10,000 |
|---|
4/18 | 9,966 | 9,864 | 9,853 |
|---|
4/19 | 10,623 | 10,471 | 10,403 |
|---|
4/20 | 10,904 | 10,697 | 10,649 |
|---|
4/21 | 11,864 | 11,526 | 11,323 |
|---|
4/22 | 11,018 | 10,617 | 10,554 |
|---|
4/23 | 11,311 | 10,922 | 10,923 |
|---|
4/24 | 11,548 | 11,150 | 11,124 |
|---|
4/25 | 11,830 | 11,335 | 11,346 |
|---|
4/26 | 12,539 | 12,054 | 12,024 |
|---|
|
| Average Annual Return [Table Text Block] |
Table SummaryAverage Annual Total Returns for the Period Ended April 30, 2026 | Inception Date | One Year | Five Years | Since Inception |
|---|
NYLI MacKay Muni Intermediate ETF - NAV | 10/18/2017 | 5.99% | 1.11% | 2.69% |
|---|
Bloomberg Municipal Bond IndexFootnote Reference1 | | 6.34% | 0.90% | 2.21% |
|---|
Bloomberg Municipal Bond Index 1-15 Year BlendFootnote Reference2 | | 5.98% | 1.21% | 2.18% |
|---|
|
| Performance Inception Date |
Oct. 18, 2017
|
| No Deduction of Taxes [Text Block] |
The graph and table do not reflect the deduction of taxes that a shareholder would pay on Fund distributions or redemption of Fund shares.
|
| AssetsNet |
$ 1,569,867,830
|
| Holdings Count | Holding |
862
|
| Advisory Fees Paid, Amount |
$ 2,826,664
|
| InvestmentCompanyPortfolioTurnover |
32.00%
|
| Additional Fund Statistics [Text Block] |
Table SummaryFund's net assets | $1,569,867,830 |
|---|
Total number of portfolio holdings | 862 |
|---|
Total advisory fees paid | $2,826,664 |
|---|
Portfolio turnover rate | 32% |
|---|
|
| Holdings [Text Block] |
Top Ten Holdings and/or Issuers*Table SummaryBlack Belt Energy Gas District, 3.44%-5.50%, due 6/1/26 - 12/1/55 | 3.1% |
|---|
Los Angeles Department of Water & Power, 5.00%-5.25%, due 7/1/29 - 7/1/45 | 2.4% |
|---|
Main Street Natural Gas, Inc., 4.00%-5.00%, due 12/1/31 - 5/1/55 | 1.8% |
|---|
Southeast Energy Authority A Cooperative District, 5.00%-5.50%, due 10/1/30 - 10/1/55 | 1.8% |
|---|
New Hampshire Business Finance Authority, 3.63%-5.25%, due 8/20/39 - 10/1/51 | 1.7% |
|---|
Kentucky Public Energy Authority, 4.00%-5.25%, due 12/1/33 - 6/1/55 | 1.6% |
|---|
City of New York NY, 3.45%-5.00%, due 6/1/44 - 2/1/55 | 1.6% |
|---|
University of California, 3.00%, due 5/15/48 | 1.4% |
|---|
California Community Choice Financing Authority, 3.90%-5.25%, due 2/1/31 - 4/1/56 | 1.4% |
|---|
Kerrville Public Utility Board Public Facility Corp., 5.00%-5.25%, due 4/15/32 - 4/15/45 | 1.3% |
|---|
* Excluding short-term investments Table SummaryTexas | 10.6% |
|---|
California | 9.0% |
|---|
Illinois | 7.2% |
|---|
New York | 7.1% |
|---|
Alabama | 6.4% |
|---|
Georgia | 4.2% |
|---|
Pennsylvania | 2.7% |
|---|
Indiana | 2.7% |
|---|
Kentucky | 2.5% |
|---|
North Carolina | 2.4% |
|---|
Other | 45.2% |
|---|
|
| Material Fund Change [Text Block] |
|
| C000222073 |
|
| Shareholder Report [Line Items] |
|
| Fund Name |
NYLI MacKay California Muni Intermediate ETF
|
| Trading Symbol |
MMCA
|
| Security Exchange Name |
NYSEArca
|
| Annual or Semi-Annual Statement [Text Block] |
This annual shareholder report contains important information about NYLI MacKay California Muni Intermediate ETF (the "Fund") for the period of May 1, 2025 to April 30, 2026.
|
| Additional Information [Text Block] |
You can find additional information about the Fund at dfinview.com/NYLIM. You can also request this information by contacting us at 888-474-7725.
|
| Additional Information Phone Number |
888-474-7725
|
| Additional Information Website |
dfinview.com/NYLIM
|
| Expenses [Text Block] |
What were the Fund costs for the last year? (based on a hypothetical $10,000 investment) Table SummaryFund | Costs of a $10,000 investment | Costs paid as a percentage of a $10,000 investmentFootnote Reference1 |
|---|
NYLI MacKay California Muni Intermediate ETF | $36 | 0.35% |
|---|
| Footnote | Description | Footnote1 | Reflects fee waivers and/or expense reimbursements, without which expenses would have been higher. |
|
| Expenses Paid, Amount |
$ 36
|
| Expense Ratio, Percent |
0.35%
|
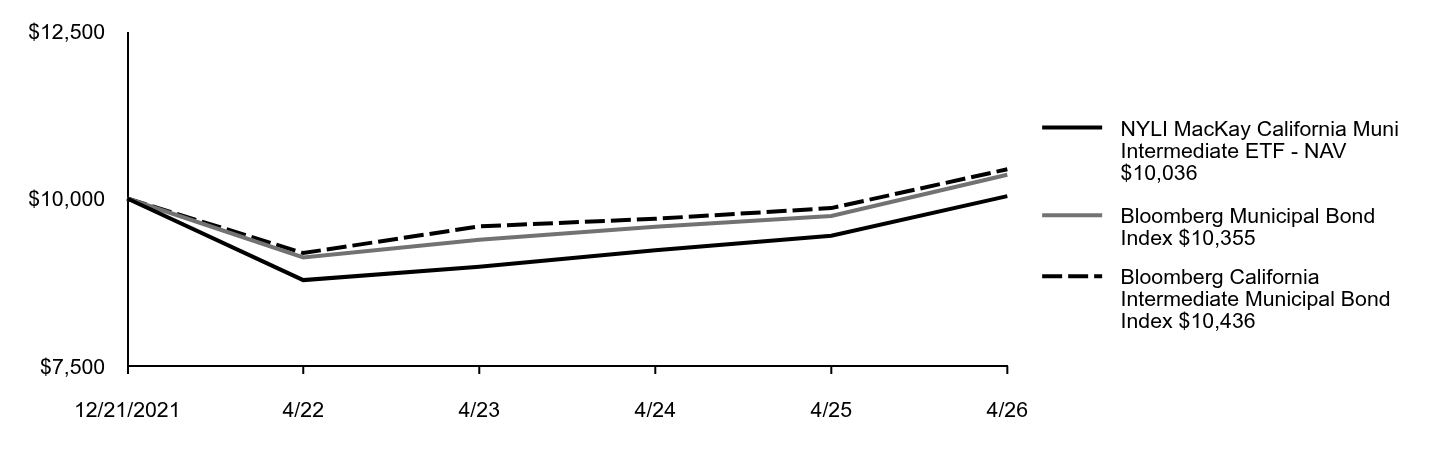
| Factors Affecting Performance [Text Block] |
What factors influenced Fund performance during the reporting period?During the 12-month reporting period ended April 30, 2026, the Fund’s performance relative to the Bloomberg California Intermediate Municipal Bond Index was primarily affected by security selection. Out-of-Index exposure to non-rated bonds, as well as U.S. territories—particularly Puerto Rico—affected relative returns, as did overweight exposure to bonds maturing over 10 years. The Fund maintained an overweight allocation to longer-maturity positions based on relative valuations. The following table outlines the key factors (securities, sectors, industries, market events and/or other characteristics) that materially affected the Fund’s performance during the reporting period. |
| Performance Past Does Not Indicate Future [Text] |
Keep in mind that the Fund’s past performance is not a good predictor of how the Fund will perform in the future.
|
| Line Graph [Table Text Block] |
Table Summary | NYLI MacKay California Muni Intermediate ETF - NAV 10,036 | Bloomberg Municipal Bond Index10,355 | Bloomberg California Intermediate Municipal Bond Index10,436 |
|---|
12/21/2021 | 10,000 | 10,000 | 10,000 |
|---|
4/22 | 8,782 | 9,121 | 9,186 |
|---|
4/23 | 8,983 | 9,383 | 9,583 |
|---|
4/24 | 9,228 | 9,578 | 9,697 |
|---|
4/25 | 9,445 | 9,738 | 9,857 |
|---|
4/26 | 10,036 | 10,355 | 10,436 |
|---|
|
| Average Annual Return [Table Text Block] |
Table SummaryAverage Annual Total Returns for the Period Ended April 30, 2026 | Inception Date | One Year | Since Inception |
|---|
NYLI MacKay California Muni Intermediate ETF - NAV | 12/21/2021 | 6.26% | 0.08% |
|---|
Bloomberg Municipal Bond IndexFootnote Reference1 | | 6.34% | 0.80% |
|---|
Bloomberg California Intermediate Municipal Bond IndexFootnote Reference2 | | 5.87% | 0.98% |
|---|
|
| Performance Inception Date |
Dec. 21, 2021
|
| No Deduction of Taxes [Text Block] |
The graph and table do not reflect the deduction of taxes that a shareholder would pay on Fund distributions or redemption of Fund shares.
|
| AssetsNet |
$ 84,529,051
|
| Holdings Count | Holding |
120
|
| Advisory Fees Paid, Amount |
$ 88,722
|
| InvestmentCompanyPortfolioTurnover |
81.00%
|
| Additional Fund Statistics [Text Block] |
Table SummaryFund's net assets | $84,529,051 |
|---|
Total number of portfolio holdings | 120 |
|---|
Total advisory fees paid | $88,722 |
|---|
Portfolio turnover rate | 81% |
|---|
|
| Holdings [Text Block] |
Top Ten Holdings and/or Issuers*Table SummaryCalifornia Community Choice Financing Authority, 3.90%-5.50%, due 2/1/36 - 10/1/56 | 13.6% |
|---|
California Municipal Finance Authority, 2.50%-5.25%, due 7/1/28 - 1/1/56 | 8.8% |
|---|
California Health Facilities Financing Authority, 3.00%-5.00%, due 4/1/32 - 2/1/45 | 6.5% |
|---|
California Statewide Communities Development Authority, 4.00%-5.00%, due 3/1/28 - 9/2/37 | 6.1% |
|---|
State of California, 5.00%-5.25%, due 8/1/32 - 8/1/37 | 3.3% |
|---|
Southern California Public Power Authority, 5.00%, due 7/1/34 - 7/1/53 | 2.5% |
|---|
California State Public Works Board, Series A, 5.00%, due 9/1/35 | 2.4% |
|---|
University of California, 5.00%, due 5/15/32 - 5/15/38 | 2.4% |
|---|
San Francisco City & County Airport Comm-San Francisco International Airport, 5.00%, due 5/1/31 - 5/1/36 | 2.3% |
|---|
Perris Union High School District Financing Authority, 5.00%, due 9/1/32 - 9/1/34 | 2.0% |
|---|
* Excluding short-term investments Table SummaryGeneral | 29.4% |
|---|
Medical | 12.4% |
|---|
School District | 10.8% |
|---|
General Obligation | 8.2% |
|---|
Airport | 7.5% |
|---|
Mello-Roos | 5.8% |
|---|
Higher Education | 4.9% |
|---|
Power | 4.7% |
|---|
Water | 4.1% |
|---|
Transportation | 3.4% |
|---|
Other | 8.8% |
|---|
|
| Material Fund Change [Text Block] |
|
| C000234758 |
|
| Shareholder Report [Line Items] |
|
| Fund Name |
NYLI Winslow Large Cap Growth ETF
|
| Trading Symbol |
IWLG
|
| Security Exchange Name |
NYSEArca
|
| Annual or Semi-Annual Statement [Text Block] |
This annual shareholder report contains important information about NYLI Winslow Large Cap Growth ETF (the "Fund") for the period of May 1, 2025 to April 30, 2026.
|
| Additional Information [Text Block] |
You can find additional information about the Fund at dfinview.com/NYLIM. You can also request this information by contacting us at 888-474-7725.
|
| Material Fund Change Notice [Text Block] |
This report describes changes to the Fund that occurred during the reporting period.
|
| Additional Information Phone Number |
888-474-7725
|
| Additional Information Website |
dfinview.com/NYLIM
|
| Expenses [Text Block] |
What were the Fund costs for the last year? (based on a hypothetical $10,000 investment) Table SummaryFund | Costs of a $10,000 investment | Costs paid as a percentage of a $10,000 investmentFootnote Reference1 |
|---|
NYLI Winslow Large Cap Growth ETF | $57 | 0.51% |
|---|
| Footnote | Description | Footnote1 | Reflects fee waivers and/or expense reimbursements, without which expenses would have been higher. |
|
| Expenses Paid, Amount |
$ 57
|
| Expense Ratio, Percent |
0.51%
|
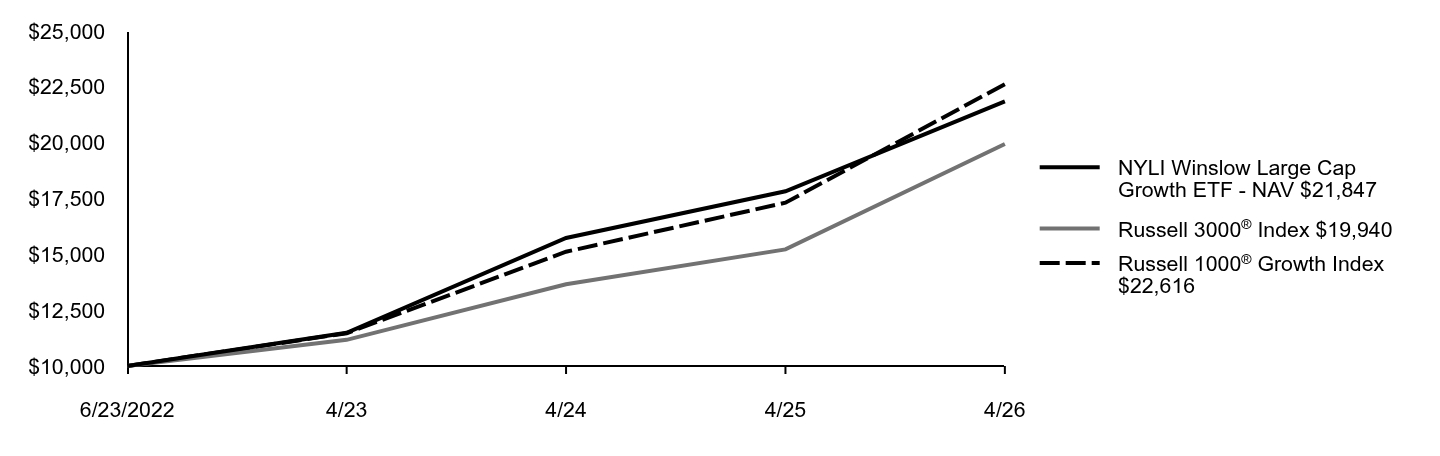
| Factors Affecting Performance [Text Block] |
What factors influenced Fund performance during the reporting period?During the 12-month reporting period ended April 30, 2026, the Fund’s relative performance versus the Russell 1000® Growth Index was driven primarily by security selection and, to a lesser extent, sector allocation. The strongest contributors were industrials, consumer staples and real estate. The most significant detractors were information technology, communication services and financials. The table below summarizes the key factors that materially affected Fund performance during the reporting period. |
| Performance Past Does Not Indicate Future [Text] |
Keep in mind that the Fund’s past performance is not a good predictor of how the Fund will perform in the future.
|
| Line Graph [Table Text Block] |
Table Summary | NYLI Winslow Large Cap Growth ETF - NAV 21,847 | Russell 3000® Index19,940 | Russell 1000® Growth Index22,616 |
|---|
6/23/2022 | 10,000 | 10,000 | 10,000 |
|---|
4/23 | 11,489 | 11,171 | 11,469 |
|---|
4/24 | 15,732 | 13,662 | 15,117 |
|---|
4/25 | 17,823 | 15,220 | 17,313 |
|---|
4/26 | 21,847 | 19,940 | 22,616 |
|---|
|
| Average Annual Return [Table Text Block] |
Table SummaryAverage Annual Total Returns for the Period Ended April 30, 2026 | Inception Date | One Year | Since Inception |
|---|
NYLI Winslow Large Cap Growth ETF - NAV | 6/23/2022 | 22.58% | 22.47% |
|---|
Russell 3000® IndexFootnote Reference1 | | 31.01% | 19.60% |
|---|
Russell 1000® Growth IndexFootnote Reference2 | | 30.63% | 23.57% |
|---|
|
| Performance Inception Date |
Jun. 23, 2022
|
| No Deduction of Taxes [Text Block] |
The graph and table do not reflect the deduction of taxes that a shareholder would pay on Fund distributions or redemption of Fund shares.
|
| Material Change Date |
May 01, 2025
|
| AssetsNet |
$ 316,188,765
|
| Holdings Count | Holding |
41
|
| Advisory Fees Paid, Amount |
$ 1,841,773
|
| InvestmentCompanyPortfolioTurnover |
139.00%
|
| Additional Fund Statistics [Text Block] |
Table SummaryFund's net assets | $316,188,765 |
|---|
Total number of portfolio holdings | 41 |
|---|
Total advisory fees paid | $1,841,773 |
|---|
Portfolio turnover rate | 139% |
|---|
|
| Holdings [Text Block] |
Top Ten Holdings and/or Issuers*Table SummaryNVIDIA Corp. | 12.0% |
|---|
Alphabet, Inc., Class C | 10.1% |
|---|
Apple, Inc. | 8.7% |
|---|
Broadcom, Inc. | 7.4% |
|---|
Microsoft Corp. | 5.9% |
|---|
Amazon.com, Inc. | 4.7% |
|---|
Meta Platforms, Inc., Class A | 4.2% |
|---|
Netflix, Inc. | 2.6% |
|---|
Mastercard, Inc., Class A | 2.3% |
|---|
Eli Lilly & Co. | 2.0% |
|---|
* Excluding short-term investments Table SummaryInformation Technology | 47.2% |
|---|
Communication Services | 18.2% |
|---|
Industrials | 12.1% |
|---|
Consumer Discretionary | 9.5% |
|---|
Health Care | 6.2% |
|---|
Financials | 5.3% |
|---|
Materials | 0.9% |
|---|
Short-Term Investments | 0.6% |
|---|
|
| Material Fund Change [Text Block] |
The following is a summary of certain changes and planned changes to the Fund since May 1, 2025: Effective October 1, 2025, the Fund added an additional expense limitation arrangement to lower the Fund’s expense cap to 0.50% through August 28, 2026. For more complete information, you may review or order printed copies of the Fund’s next prospectus, which we expect to be available
by August 28, 2026 at dfinview.com/NYLIM. You may also call 888-474-7725 to obtain a copy of the Fund’s current prospectus. |
| Material Fund Change Expenses [Text Block] |
Effective October 1, 2025, the Fund added an additional expense limitation arrangement to lower the Fund’s expense cap to 0.50% through August 28, 2026.
|
| Summary of Change Legend [Text Block] |
The following is a summary of certain changes and planned changes to the Fund since May 1, 2025:
|
| C000234759 |
|
| Shareholder Report [Line Items] |
|
| Fund Name |
NYLI Winslow Focused Large Cap Growth ETF
|
| Trading Symbol |
IWFG
|
| Security Exchange Name |
NYSEArca
|
| Annual or Semi-Annual Statement [Text Block] |
This annual shareholder report contains important information about NYLI Winslow Focused Large Cap Growth ETF (the "Fund") for the period of May 1, 2025 to April 30, 2026.
|
| Additional Information [Text Block] |
You can find additional information about the Fund at dfinview.com/NYLIM. You can also request this information by contacting us at 888-474-7725.
|
| Material Fund Change Notice [Text Block] |
This report describes changes to the Fund that occurred during the reporting period.
|
| Additional Information Phone Number |
888-474-7725
|
| Additional Information Website |
dfinview.com/NYLIM
|
| Expenses [Text Block] |
What were the Fund costs for the last year? (based on a hypothetical $10,000 investment) Table SummaryFund | Costs of a $10,000 investment | Costs paid as a percentage of a $10,000 investmentFootnote Reference1 |
|---|
NYLI Winslow Focused Large Cap Growth ETF | $54 | 0.49% |
|---|
| Footnote | Description | Footnote1 | Reflects fee waivers and/or expense reimbursements, without which expenses would have been higher. |
|
| Expenses Paid, Amount |
$ 54
|
| Expense Ratio, Percent |
0.49%
|
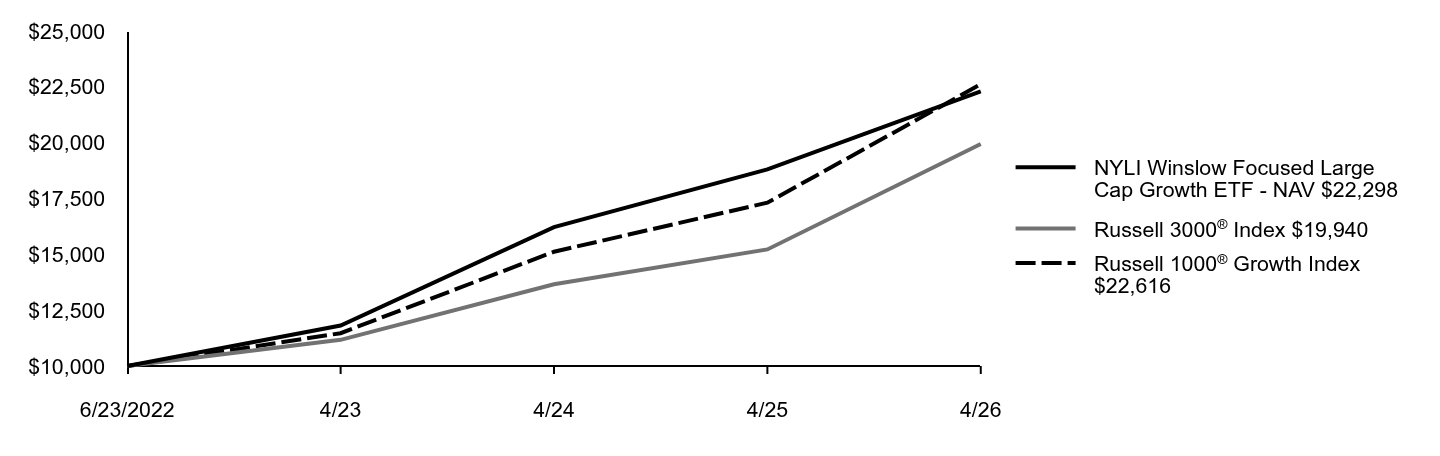
| Factors Affecting Performance [Text Block] |
What factors influenced Fund performance during the reporting period?During the 12-month reporting period ended April 30, 2026, the Fund’s performance relative to the Russell 1000® Growth Index was driven primarily by security selection and to a lesser degree by sector allocation, as detailed in the table below. The strongest contributors to relative performance included positioning in the industrials. The most significant detractors included positioning in information technology, communication services and financials. The following table outlines the key factors (securities, sectors, industries, market events and/or other characteristics) that materially affected the Fund’s performance during the reporting period. |
| Performance Past Does Not Indicate Future [Text] |
Keep in mind that the Fund’s past performance is not a good predictor of how the Fund will perform in the future.
|
| Line Graph [Table Text Block] |
Table Summary | NYLI Winslow Focused Large Cap Growth ETF - NAV 22,298 | Russell 3000® Index19,940 | Russell 1000® Growth Index22,616 |
|---|
6/23/2022 | 10,000 | 10,000 | 10,000 |
|---|
4/23 | 11,812 | 11,171 | 11,469 |
|---|
4/24 | 16,219 | 13,662 | 15,117 |
|---|
4/25 | 18,801 | 15,220 | 17,313 |
|---|
4/26 | 22,298 | 19,940 | 22,616 |
|---|
|
| Average Annual Return [Table Text Block] |
Table SummaryAverage Annual Total Returns for the Period Ended April 30, 2026 | Inception Date | One Year | Since Inception |
|---|
NYLI Winslow Focused Large Cap Growth ETF - NAV | 6/23/2022 | 18.60% | 23.12% |
|---|
Russell 3000® IndexFootnote Reference1 | | 31.01% | 19.60% |
|---|
Russell 1000® Growth IndexFootnote Reference2 | | 30.63% | 23.57% |
|---|
|
| Performance Inception Date |
Jun. 23, 2022
|
| No Deduction of Taxes [Text Block] |
The graph and table do not reflect the deduction of taxes that a shareholder would pay on Fund distributions or redemption of Fund shares.
|
| Material Change Date |
May 01, 2025
|
| AssetsNet |
$ 57,427,468
|
| Holdings Count | Holding |
30
|
| Advisory Fees Paid, Amount |
$ 116,501
|
| InvestmentCompanyPortfolioTurnover |
54.00%
|
| Additional Fund Statistics [Text Block] |
Table SummaryFund's net assets | $57,427,468 |
|---|
Total number of portfolio holdings | 30 |
|---|
Total advisory fees paid | $116,501 |
|---|
Portfolio turnover rate | 54% |
|---|
|
| Holdings [Text Block] |
Top Ten Holdings and/or Issuers*Table SummaryNVIDIA Corp. | 14.3% |
|---|
Microsoft Corp. | 9.1% |
|---|
Apple, Inc. | 8.6% |
|---|
Alphabet, Inc., Class C | 8.3% |
|---|
Amazon.com, Inc. | 6.9% |
|---|
Broadcom, Inc. | 4.7% |
|---|
GE Vernova, Inc. | 4.4% |
|---|
Meta Platforms, Inc., Class A | 4.1% |
|---|
Trane Technologies PLC | 3.7% |
|---|
Analog Devices, Inc. | 3.4% |
|---|
* Excluding short-term investments Table SummaryInformation Technology | 51.5% |
|---|
Communication Services | 13.6% |
|---|
Industrials | 12.5% |
|---|
Consumer Discretionary | 11.6% |
|---|
Health Care | 5.5% |
|---|
Financials | 4.9% |
|---|
Short-Term Investments | 0.5% |
|---|
Other | (0.1)% |
|---|
|
| Material Fund Change [Text Block] |
The following is a summary of certain changes and planned changes to the Fund since May 1, 2025: Effective October 1, 2025, the Fund added an additional expense limitation arrangement to lower the Fund’s expense cap to 0.46% through August 28, 2026. For more complete information, you may review or order printed copies of the Fund’s next prospectus, which we expect to be available by August 28, 2026 at dfinview.com/NYLIM. You may also call 888-474-7725 to obtain a copy of the Fund’s current prospectus. |
| Material Fund Change Expenses [Text Block] |
Effective October 1, 2025, the Fund added an additional expense limitation arrangement to lower the Fund’s expense cap to 0.46% through August 28, 2026.
|
| Summary of Change Legend [Text Block] |
The following is a summary of certain changes and planned changes to the Fund since May 1, 2025:
|