Shareholder Report
|
|
12 Months Ended |
May 01, 2025 |
Apr. 30, 2026
USD ($)
Holding
|
| Shareholder Report [Line Items] |
|
|
| Document Type |
|
N-CSR
|
| Amendment Flag |
|
false
|
| Registrant Name |
|
ALLSPRING MASTER TRUST
|
| Entity Central Index Key |
|
0001087961
|
| Entity Investment Company Type |
|
N-1A
|
| Document Period End Date |
|
Apr. 30, 2026
|
| Shareholder Report Annual or Semi-Annual |
|
Annual Shareholder Report
|
| C000200587 |
|
|
| Shareholder Report [Line Items] |
|
|
| Fund Name |
|
Disciplined Large Cap Portfolio
|
| No Trading Symbol [Flag] |
|
true
|
| Annual or Semi-Annual Statement [Text Block] |
|
This annual shareholder report contains important information about Disciplined Large Cap Portfolio for the period from May 1, 2025 to April 30, 2026.
|
| Additional Information [Text Block] |
|
You can find additional information about the Funds that invest in this Portfolio at allspringglobal.com.
|
| Additional Information Website |
|
<span style="box-sizing: border-box; color: rgb(0, 0, 0); display: inline; flex-wrap: nowrap; font-size: 12px; font-weight: 400; grid-area: auto; line-height: 18px; margin: 0px; overflow: visible; text-align: left; text-align-last: auto; white-space-collapse: preserve-breaks;">allspringglobal.com</span>
|
| Expenses [Text Block] |
|
What were the Portfolio costs for the past year?The table explains the costs you would have paid within the reporting period based on a hypothetical $10,000 investment.
Table Summary
CLASS NAME |
COSTS OF A $10,000 INVESTMENT |
COSTS PAID AS A % OF A $10,000 INVESTMENT |
Disciplined Large Cap Portfolio |
$32 |
0.28% | |
| Expenses Paid, Amount |
|
$ 32
|
| Expense Ratio, Percent |
|
0.28%
|
| Factors Affecting Performance [Text Block] |
|
How did the Portfolio perform last year and what affected its performance?The Portfolio underperformed its benchmark for the period. The U.S. equity market had strong returns during the period. Changes to the Portfolio's portfolio were minimal. The Portfolio typically favors these characteristics: attractive valuation, earnings consistency, profitability, and improving market sentiment. Negative stock selection within information technology, health care, and communication services detracted from relative performance. The three largest individual detractors from relative performance over the 12-month period were Science Applications International Corp. and underweights to Intel Corp. and Sandisk Corp. Relative performance was supported by positive stock selection within the financials, materials, and industrials sectors. The largest individual contributors to relative performance were KLA Corp., EMCOR Group, Inc., and Vertiv Holdings Co. A modest underweight to consumer discretionary contributed to performance. However, variations in sector weights versus the index were relatively small, which is typical for the strategy. |
| Performance Past Does Not Indicate Future [Text] |
|
Figures quoted represent past performance, which is no guarantee of future results,
|
| Line Graph [Table Text Block] |
|
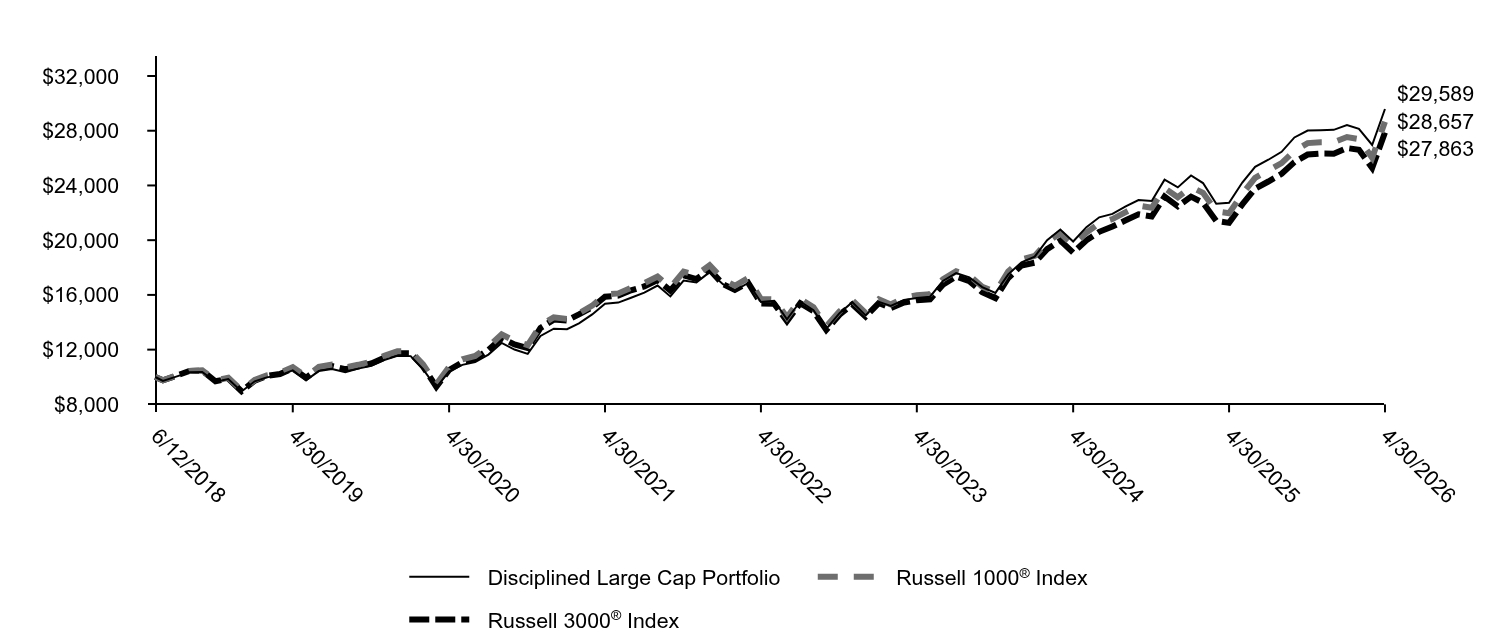
Table Summary
|
Disciplined Large Cap Portfolio |
Russell 1000® Index |
Russell 3000® Index |
6/12/2018 |
$10,000 |
$10,000 |
$10,000 |
6/30/2018 |
$9,716 |
$9,760 |
$9,762 |
7/31/2018 |
$10,029 |
$10,097 |
$10,086 |
8/31/2018 |
$10,342 |
$10,445 |
$10,440 |
9/30/2018 |
$10,368 |
$10,485 |
$10,457 |
10/31/2018 |
$9,647 |
$9,743 |
$9,687 |
11/30/2018 |
$9,855 |
$9,941 |
$9,881 |
12/31/2018 |
$8,943 |
$9,036 |
$8,962 |
1/31/2019 |
$9,685 |
$9,793 |
$9,731 |
2/28/2019 |
$9,972 |
$10,124 |
$10,073 |
3/31/2019 |
$10,123 |
$10,301 |
$10,220 |
4/30/2019 |
$10,482 |
$10,717 |
$10,628 |
5/31/2019 |
$9,760 |
$10,034 |
$9,940 |
6/30/2019 |
$10,433 |
$10,738 |
$10,639 |
7/31/2019 |
$10,587 |
$10,905 |
$10,797 |
8/31/2019 |
$10,343 |
$10,705 |
$10,577 |
9/30/2019 |
$10,611 |
$10,891 |
$10,762 |
10/31/2019 |
$10,825 |
$11,121 |
$10,994 |
11/30/2019 |
$11,238 |
$11,542 |
$11,412 |
12/31/2019 |
$11,548 |
$11,875 |
$11,741 |
1/31/2020 |
$11,526 |
$11,888 |
$11,729 |
2/29/2020 |
$10,577 |
$10,916 |
$10,768 |
3/31/2020 |
$9,223 |
$9,474 |
$9,287 |
4/30/2020 |
$10,408 |
$10,726 |
$10,517 |
5/31/2020 |
$10,888 |
$11,292 |
$11,080 |
6/30/2020 |
$11,091 |
$11,541 |
$11,333 |
7/31/2020 |
$11,638 |
$12,217 |
$11,977 |
8/31/2020 |
$12,488 |
$13,114 |
$12,844 |
9/30/2020 |
$12,007 |
$12,635 |
$12,377 |
10/31/2020 |
$11,688 |
$12,330 |
$12,110 |
11/30/2020 |
$13,001 |
$13,782 |
$13,583 |
12/31/2020 |
$13,534 |
$14,364 |
$14,194 |
1/31/2021 |
$13,493 |
$14,246 |
$14,131 |
2/28/2021 |
$13,923 |
$14,659 |
$14,572 |
3/31/2021 |
$14,573 |
$15,214 |
$15,095 |
4/30/2021 |
$15,359 |
$16,033 |
$15,873 |
5/31/2021 |
$15,438 |
$16,109 |
$15,945 |
6/30/2021 |
$15,796 |
$16,513 |
$16,338 |
7/31/2021 |
$16,169 |
$16,856 |
$16,615 |
8/31/2021 |
$16,685 |
$17,343 |
$17,089 |
9/30/2021 |
$15,889 |
$16,547 |
$16,322 |
10/31/2021 |
$17,050 |
$17,695 |
$17,426 |
11/30/2021 |
$16,916 |
$17,457 |
$17,160 |
12/31/2021 |
$17,665 |
$18,165 |
$17,836 |
1/31/2022 |
$16,784 |
$17,140 |
$16,787 |
2/28/2022 |
$16,321 |
$16,670 |
$16,364 |
3/31/2022 |
$16,871 |
$17,233 |
$16,895 |
4/30/2022 |
$15,484 |
$15,697 |
$15,378 |
5/31/2022 |
$15,572 |
$15,673 |
$15,358 |
6/30/2022 |
$14,215 |
$14,360 |
$14,073 |
7/31/2022 |
$15,517 |
$15,698 |
$15,393 |
8/31/2022 |
$14,882 |
$15,095 |
$14,819 |
9/30/2022 |
$13,511 |
$13,698 |
$13,445 |
10/31/2022 |
$14,663 |
$14,797 |
$14,547 |
11/30/2022 |
$15,465 |
$15,597 |
$15,307 |
12/31/2022 |
$14,506 |
$14,690 |
$14,410 |
1/31/2023 |
$15,496 |
$15,675 |
$15,403 |
2/28/2023 |
$15,199 |
$15,302 |
$15,043 |
3/31/2023 |
$15,638 |
$15,786 |
$15,445 |
4/30/2023 |
$15,774 |
$15,982 |
$15,610 |
5/31/2023 |
$15,868 |
$16,056 |
$15,670 |
6/30/2023 |
$17,023 |
$17,141 |
$16,740 |
7/31/2023 |
$17,594 |
$17,730 |
$17,340 |
8/31/2023 |
$17,278 |
$17,420 |
$17,006 |
9/30/2023 |
$16,568 |
$16,601 |
$16,196 |
10/31/2023 |
$16,146 |
$16,200 |
$15,766 |
11/30/2023 |
$17,500 |
$17,713 |
$17,237 |
12/31/2023 |
$18,387 |
$18,588 |
$18,151 |
1/31/2024 |
$18,798 |
$18,847 |
$18,352 |
2/29/2024 |
$20,003 |
$19,864 |
$19,345 |
3/31/2024 |
$20,782 |
$20,501 |
$19,969 |
4/30/2024 |
$19,906 |
$19,629 |
$19,091 |
5/31/2024 |
$20,954 |
$20,553 |
$19,993 |
6/30/2024 |
$21,671 |
$21,233 |
$20,612 |
7/31/2024 |
$21,920 |
$21,542 |
$20,995 |
8/31/2024 |
$22,466 |
$22,053 |
$21,452 |
9/30/2024 |
$22,929 |
$22,525 |
$21,896 |
10/31/2024 |
$22,861 |
$22,367 |
$21,735 |
11/30/2024 |
$24,423 |
$23,807 |
$23,181 |
12/31/2024 |
$23,859 |
$23,143 |
$22,472 |
1/31/2025 |
$24,732 |
$23,880 |
$23,182 |
2/28/2025 |
$24,177 |
$23,463 |
$22,737 |
3/31/2025 |
$22,660 |
$22,105 |
$21,411 |
4/30/2025 |
$22,739 |
$21,973 |
$21,267 |
5/31/2025 |
$24,216 |
$23,376 |
$22,615 |
6/30/2025 |
$25,365 |
$24,560 |
$23,764 |
7/31/2025 |
$25,879 |
$25,105 |
$24,288 |
8/31/2025 |
$26,457 |
$25,634 |
$24,850 |
9/30/2025 |
$27,510 |
$26,522 |
$25,707 |
10/31/2025 |
$28,013 |
$27,095 |
$26,258 |
11/30/2025 |
$28,042 |
$27,161 |
$26,330 |
12/31/2025 |
$28,065 |
$27,163 |
$26,325 |
1/31/2026 |
$28,413 |
$27,537 |
$26,733 |
2/28/2026 |
$28,136 |
$27,389 |
$26,606 |
3/31/2026 |
$26,959 |
$26,027 |
$25,283 |
4/30/2026 |
$29,589 |
$28,657 |
$27,863 |
|
| Average Annual Return [Table Text Block] |
|
Table Summary
AATR |
1 Year |
5 Years |
Since Inception (6/12/18) |
Disciplined Large Cap Portfolio |
30.12 |
14.01 |
14.75 |
Russell 1000® Index |
30.42 |
12.32 |
14.29 |
Russell 3000® Index |
31.01 |
11.91 |
13.88 | |
| No Deduction of Taxes [Text Block] |
|
do not reflect taxes that a shareholder may pay on an investment in a fund.
|
| AssetsNet |
|
$ 349,699,159
|
| Holdings Count | Holding |
|
222
|
| Advisory Fees Paid, Amount |
|
$ 815,790
|
| InvestmentCompanyPortfolioTurnover |
|
30.00%
|
| Additional Fund Statistics [Text Block] |
|
Table Summary
Total net assets |
$349,699,159 |
# of portfolio holdings |
222 |
Portfolio turnover rate |
30% |
Total advisory fees paid |
$815,790 | |
| Holdings [Text Block] |
|
SECTOR ALLOCATION (% OF LONG-TERM INVESTMENTS)
Table Summary
Information technology |
33.0 |
Financials |
12.4 |
Communication services |
10.7 |
Industrials |
9.4 |
Consumer discretionary |
9.4 |
Health care |
9.0 |
Consumer staples |
5.2 |
Energy |
3.5 |
Materials |
2.9 |
Utilities |
2.4 |
Real estate |
2.1 | |
| Largest Holdings [Text Block] |
|
TOP TEN HOLDINGS (% OF NET ASSETS)
Table Summary
NVIDIA Corp. |
7.0 |
Apple, Inc. |
5.8 |
Microsoft Corp. |
4.5 |
Amazon.com, Inc. |
3.8 |
Broadcom, Inc. |
3.3 |
Alphabet, Inc. Class C |
3.3 |
Alphabet, Inc. Class A |
3.1 |
Meta Platforms, Inc. Class A |
2.2 |
Tesla, Inc. |
1.6 |
Berkshire Hathaway, Inc. Class B |
1.3 | |
| Material Fund Change [Text Block] |
|
|
| C000248008 |
|
|
| Shareholder Report [Line Items] |
|
|
| Fund Name |
|
Macro Strategies Portfolio
|
| No Trading Symbol [Flag] |
|
true
|
| Annual or Semi-Annual Statement [Text Block] |
|
This annual shareholder report contains important information about Macro Strategies Portfolio for the period from May 1, 2025 to April 30, 2026.
|
| Additional Information [Text Block] |
|
You can find additional information about the Funds that invest in this Portfolio at allspringglobal.com.
|
| Additional Information Website |
|
<span style="box-sizing: border-box; color: rgb(0, 0, 0); display: inline; flex-wrap: nowrap; font-size: 12px; font-weight: 400; grid-area: auto; line-height: 18px; margin: 0px; overflow: visible; text-align: left; text-align-last: auto; white-space-collapse: preserve-breaks;">allspringglobal.com</span>
|
| Expenses [Text Block] |
|
What were the Portfolio consolidated costs for the past year?The table explains the costs you would have paid within the reporting period based on a hypothetical $10,000 investment.
Table Summary
CLASS NAME |
CONSOLIDATED COSTS OF A $10,000 INVESTMENT |
COSTS PAID AS A % OF A $10,000 INVESTMENT |
Macro Strategies Portfolio |
$46 |
0.40% | |
| Expenses Paid, Amount |
|
$ 46
|
| Expense Ratio, Percent |
|
0.40%
|
| Factors Affecting Performance [Text Block] |
|
How did the Portfolio perform last year and what affected its performance?The Fund outperformed its benchmark for the period. The past year saw a wide set of narratives drive the economy and financial markets. From an initial focus on tariffs, markets swiftly moved onto opportunities within artificial intelligence (AI). Geopolitical risk remained elevated. U.S. economic growth was above trend, supported by AI-driven capital expenditures and resilient consumer spending. Inflation remained above target. Outside the U.S., investment opportunities were divergent. Globally, expectations for earnings growth remain concentrated in a single theme: AI. Portfolio positioning remained dynamic. One key decision was increasing exposure to commodities, where we started the period with no allocation. Equity exposure moderated higher for the first 10 months of the period, followed by a reduction closer to neutral while positioning rates remained underweight. Exposure to tactical asset allocation and commodities drove performance. No major portfolio components detracted significantly from the benchmark. |
| Performance Past Does Not Indicate Future [Text] |
|
Figures quoted represent past performance, which is no guarantee of future results,
|
| Line Graph [Table Text Block] |
|
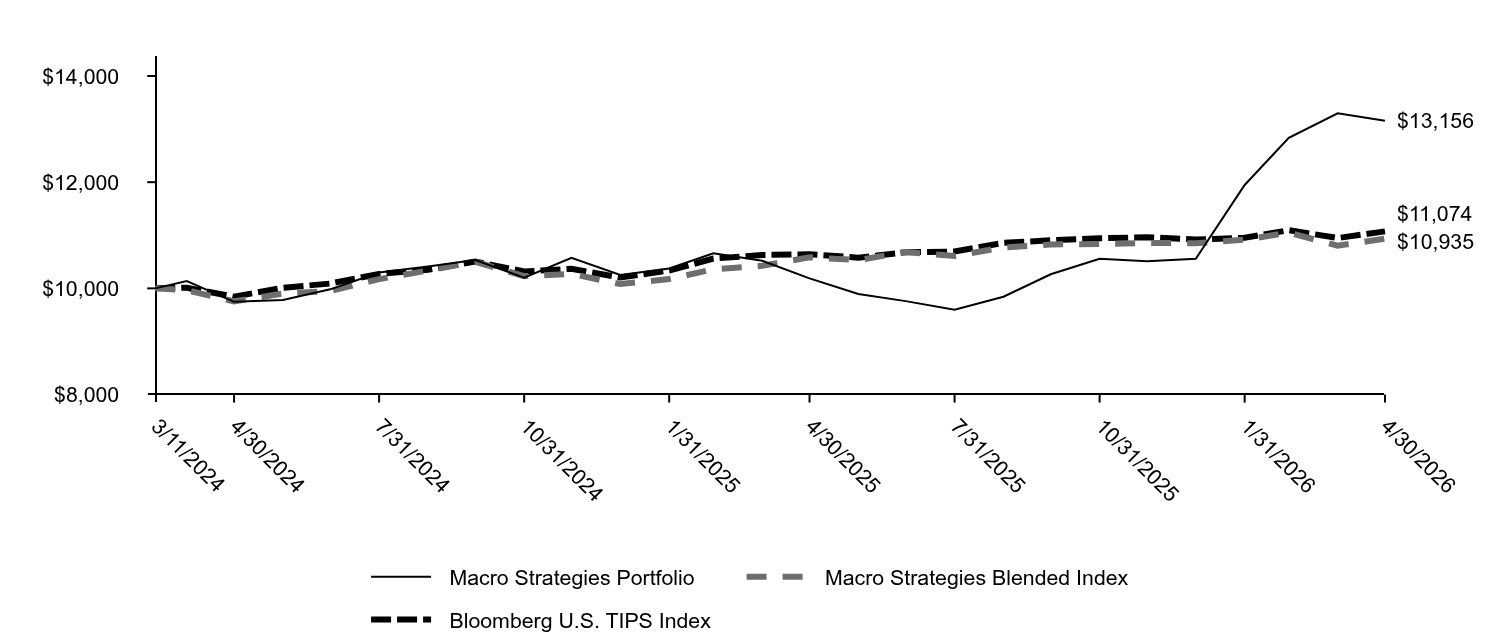
Table Summary
|
Macro Strategies Portfolio |
Macro Strategies Blended Index |
Bloomberg U.S. TIPS Index |
3/11/2024 |
$10,000 |
$10,000 |
$10,000 |
3/31/2024 |
$10,138 |
$9,965 |
$10,012 |
4/30/2024 |
$9,747 |
$9,756 |
$9,843 |
5/31/2024 |
$9,781 |
$9,903 |
$10,012 |
6/30/2024 |
$9,982 |
$9,949 |
$10,091 |
7/31/2024 |
$10,299 |
$10,175 |
$10,271 |
8/31/2024 |
$10,411 |
$10,336 |
$10,351 |
9/30/2024 |
$10,532 |
$10,501 |
$10,507 |
10/31/2024 |
$10,202 |
$10,231 |
$10,318 |
11/30/2024 |
$10,575 |
$10,273 |
$10,368 |
12/31/2024 |
$10,254 |
$10,082 |
$10,204 |
1/31/2025 |
$10,373 |
$10,176 |
$10,336 |
2/28/2025 |
$10,662 |
$10,359 |
$10,561 |
3/31/2025 |
$10,521 |
$10,425 |
$10,629 |
4/30/2025 |
$10,188 |
$10,584 |
$10,642 |
5/31/2025 |
$9,894 |
$10,534 |
$10,579 |
6/30/2025 |
$9,760 |
$10,684 |
$10,680 |
7/31/2025 |
$9,596 |
$10,611 |
$10,693 |
8/31/2025 |
$9,842 |
$10,770 |
$10,858 |
9/30/2025 |
$10,266 |
$10,828 |
$10,905 |
10/31/2025 |
$10,556 |
$10,834 |
$10,943 |
11/30/2025 |
$10,512 |
$10,856 |
$10,964 |
12/31/2025 |
$10,557 |
$10,849 |
$10,919 |
1/31/2026 |
$11,948 |
$10,916 |
$10,953 |
2/28/2026 |
$12,834 |
$11,049 |
$11,096 |
3/31/2026 |
$13,298 |
$10,805 |
$10,948 |
4/30/2026 |
$13,156 |
$10,935 |
$11,074 |
|
| Average Annual Return [Table Text Block] |
|
Table Summary
AATR |
1 Year |
Since Inception (3/11/24) |
Macro Strategies Portfolio |
29.13 |
13.69 |
Macro Strategies Blended IndexFootnote Reference* |
3.31 |
4.27 |
Bloomberg U.S. TIPS Index |
4.07 |
4.89 | |
| No Deduction of Taxes [Text Block] |
|
do not reflect taxes that a shareholder may pay on an investment in a fund.
|
| AssetsNet |
|
$ 220,421,724
|
| Holdings Count | Holding |
|
179
|
| Advisory Fees Paid, Amount |
|
$ 720,242
|
| InvestmentCompanyPortfolioTurnover |
|
32.00%
|
| Additional Fund Statistics [Text Block] |
|
Table Summary
Consolidated Total net assets |
$220,421,724 |
Consolidated # of portfolio holdings |
179 |
Consolidated Portfolio turnover rate |
32% |
Consolidated Total advisory fees paid |
$720,242 | |
| Holdings [Text Block] |
|
CONSOLIDATED PORTFOLIO ALLOCATION (% OF LONG-TERM INVESTMENT)
Table Summary
U.S. Treasury securities |
78.2 |
Common stocks |
21.8 | |
| Largest Holdings [Text Block] |
|
CONSOLIDATED TOP TEN HOLDINGS (% OF NET ASSETS)
Table Summary
U.S. Treasury Inflation-Indexed Notes, 1.88%, 7‑15‑2035 |
3.7 |
TIPS, 2.13%, 1‑15‑2035 |
3.7 |
TIPS, 3.63%, 4‑15‑2028 |
3.4 |
TIPS, 0.13%, 1‑15‑2032 |
3.2 |
TIPS, 0.50%, 1‑15‑2028 |
3.2 |
TIPS, 2.38%, 10‑15‑2028 |
3.1 |
TIPS, 1.38%, 2‑15‑2044 |
2.2 |
TIPS, 0.13%, 1‑15‑2031 |
2.0 |
U.S. Treasury Inflation-Indexed Notes, 2.13%, 4‑15‑2029 |
2.0 |
TIPS, 0.13%, 7‑15‑2031 |
1.9 | |
| Material Fund Change [Text Block] |
|
|
| C000020611 |
|
|
| Shareholder Report [Line Items] |
|
|
| Fund Name |
|
Small Company Value Portfolio
|
| No Trading Symbol [Flag] |
|
true
|
| Annual or Semi-Annual Statement [Text Block] |
|
This annual shareholder report contains important information about Small Company Value Portfolio for the period from May 1, 2025 to April 30, 2026.
|
| Additional Information [Text Block] |
|
You can find additional information about the Funds that invest in this Portfolio at allspringglobal.com.
|
| Material Fund Change Notice [Text Block] |
|
This report describes changes to the Portfolio that occurred either during or after the reporting period.
|
| Additional Information Website |
|
<span style="box-sizing: border-box; color: rgb(0, 0, 0); display: inline; flex-wrap: nowrap; font-size: 12px; font-weight: 400; grid-area: auto; line-height: 18px; margin: 0px; overflow: visible; text-align: left; text-align-last: auto; white-space-collapse: preserve-breaks;">allspringglobal.com</span>
|
| Expenses [Text Block] |
|
What were the Portfolio costs for the past year?The table explains the costs you would have paid within the reporting period based on a hypothetical $10,000 investment.
Table Summary
CLASS NAME |
COSTS OF A $10,000 INVESTMENT |
COSTS PAID AS A % OF A $10,000 INVESTMENT |
Small Company Value Portfolio |
$86 |
0.74% | |
| Expenses Paid, Amount |
|
$ 86
|
| Expense Ratio, Percent |
|
0.74%
|
| Factors Affecting Performance [Text Block] |
|
How did the Portfolio perform last year and what affected its performance?The Portfolio underperformed its benchmark for the period. Over the past 12 months, U.S. equity leadership broadened beyond large-cap growth as improving expectations for monetary easing and domestic growth renewed interest in small-cap equities following early 2025 volatility and tariff uncertainty. Within small caps, performance was led by lower-quality companies as risk appetite rebounded, creating a headwind for quality oriented managers. As 2025 progressed, leadership broadened and fundamentals became more influential. Small-cap value benefited from attractive valuations, improving earnings trends, and domestic sensitivity. Consistent with its philosophy, the Portfolio remained focused on higher-quality businesses, which lagged through much of the period but became better aligned as investors refocused on quality factors. Our underweight positions in the lagging real estate and utilities sectors contributed to relative performance while the information technology and health care sectors were the largest detractors. |
| Performance Past Does Not Indicate Future [Text] |
|
Figures quoted represent past performance, which is no guarantee of future results,
|
| Line Graph [Table Text Block] |
|
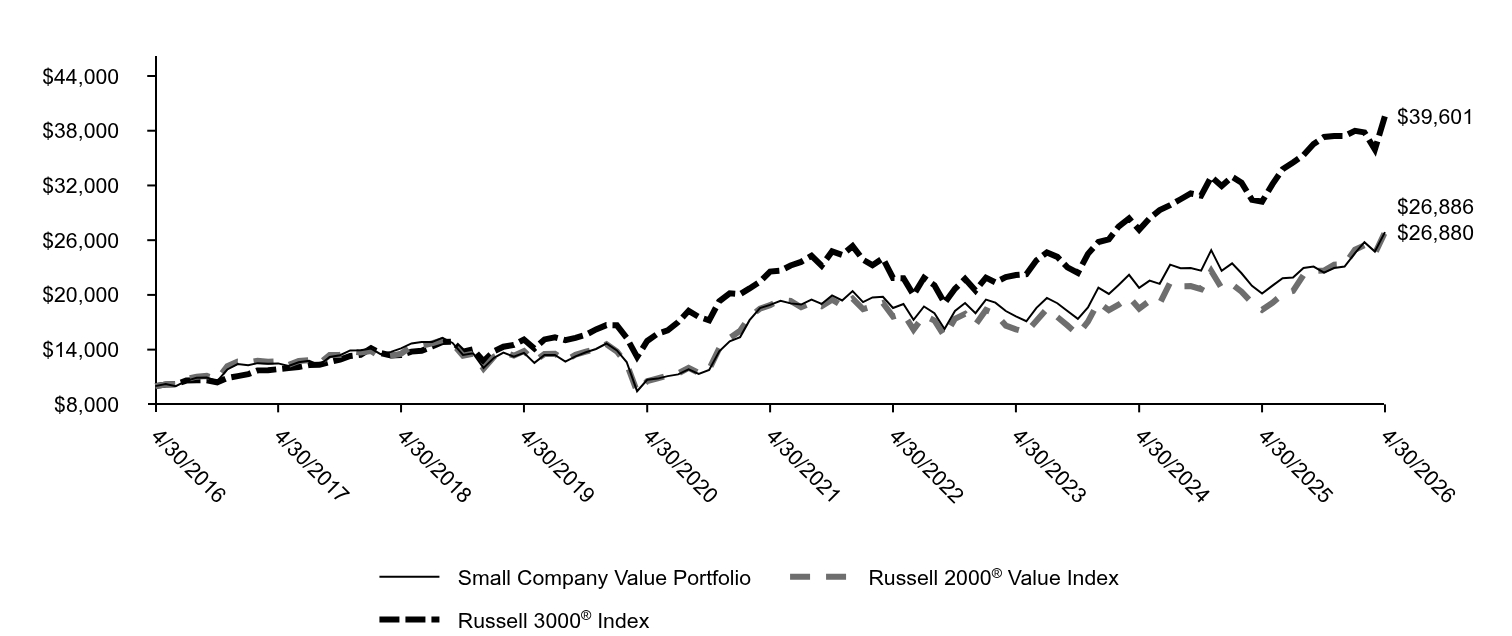
Table Summary
|
Small Company Value Portfolio |
Russell 2000® Value Index |
Russell 3000® Index |
4/30/2016 |
$10,000 |
$10,000 |
$10,000 |
5/31/2016 |
$10,232 |
$10,183 |
$10,179 |
6/30/2016 |
$9,990 |
$10,214 |
$10,200 |
7/31/2016 |
$10,572 |
$10,765 |
$10,605 |
8/31/2016 |
$10,915 |
$11,033 |
$10,632 |
9/30/2016 |
$10,938 |
$11,120 |
$10,648 |
10/31/2016 |
$10,536 |
$10,754 |
$10,418 |
11/30/2016 |
$11,830 |
$12,182 |
$10,884 |
12/31/2016 |
$12,424 |
$12,685 |
$11,097 |
1/31/2017 |
$12,299 |
$12,594 |
$11,305 |
2/28/2017 |
$12,520 |
$12,777 |
$11,726 |
3/31/2017 |
$12,462 |
$12,668 |
$11,734 |
4/30/2017 |
$12,491 |
$12,718 |
$11,858 |
5/31/2017 |
$12,221 |
$12,322 |
$11,980 |
6/30/2017 |
$12,606 |
$12,753 |
$12,088 |
7/31/2017 |
$12,773 |
$12,834 |
$12,316 |
8/31/2017 |
$12,302 |
$12,518 |
$12,339 |
9/30/2017 |
$13,196 |
$13,405 |
$12,640 |
10/31/2017 |
$13,385 |
$13,422 |
$12,916 |
11/30/2017 |
$13,910 |
$13,811 |
$13,308 |
12/31/2017 |
$13,936 |
$13,679 |
$13,441 |
1/31/2018 |
$14,118 |
$13,848 |
$14,150 |
2/28/2018 |
$13,503 |
$13,155 |
$13,628 |
3/31/2018 |
$13,751 |
$13,318 |
$13,355 |
4/30/2018 |
$14,144 |
$13,549 |
$13,406 |
5/31/2018 |
$14,677 |
$14,337 |
$13,784 |
6/30/2018 |
$14,843 |
$14,424 |
$13,874 |
7/31/2018 |
$14,829 |
$14,678 |
$14,335 |
8/31/2018 |
$15,303 |
$15,028 |
$14,838 |
9/30/2018 |
$14,734 |
$14,655 |
$14,863 |
10/31/2018 |
$13,412 |
$13,343 |
$13,768 |
11/30/2018 |
$13,589 |
$13,558 |
$14,044 |
12/31/2018 |
$11,994 |
$11,919 |
$12,737 |
1/31/2019 |
$13,108 |
$13,223 |
$13,830 |
2/28/2019 |
$13,682 |
$13,737 |
$14,316 |
3/31/2019 |
$13,227 |
$13,341 |
$14,526 |
4/30/2019 |
$13,648 |
$13,846 |
$15,106 |
5/31/2019 |
$12,548 |
$12,715 |
$14,128 |
6/30/2019 |
$13,411 |
$13,524 |
$15,120 |
7/31/2019 |
$13,413 |
$13,546 |
$15,345 |
8/31/2019 |
$12,697 |
$12,790 |
$15,032 |
9/30/2019 |
$13,264 |
$13,447 |
$15,296 |
10/31/2019 |
$13,714 |
$13,773 |
$15,625 |
11/30/2019 |
$14,069 |
$14,095 |
$16,219 |
12/31/2019 |
$14,670 |
$14,589 |
$16,688 |
1/31/2020 |
$13,916 |
$13,802 |
$16,669 |
2/29/2020 |
$12,644 |
$12,461 |
$15,305 |
3/31/2020 |
$9,442 |
$9,386 |
$13,200 |
4/30/2020 |
$10,694 |
$10,544 |
$14,948 |
5/31/2020 |
$10,824 |
$10,847 |
$15,748 |
6/30/2020 |
$11,094 |
$11,161 |
$16,108 |
7/31/2020 |
$11,288 |
$11,391 |
$17,022 |
8/31/2020 |
$11,846 |
$12,005 |
$18,255 |
9/30/2020 |
$11,345 |
$11,446 |
$17,591 |
10/31/2020 |
$11,779 |
$11,855 |
$17,211 |
11/30/2020 |
$13,811 |
$14,144 |
$19,305 |
12/31/2020 |
$14,921 |
$15,265 |
$20,173 |
1/31/2021 |
$15,373 |
$16,068 |
$20,084 |
2/28/2021 |
$17,228 |
$17,577 |
$20,711 |
3/31/2021 |
$18,547 |
$18,496 |
$21,454 |
4/30/2021 |
$18,904 |
$18,870 |
$22,560 |
5/31/2021 |
$19,349 |
$19,457 |
$22,663 |
6/30/2021 |
$19,072 |
$19,339 |
$23,222 |
7/31/2021 |
$18,943 |
$18,647 |
$23,614 |
8/31/2021 |
$19,490 |
$19,146 |
$24,288 |
9/30/2021 |
$19,013 |
$18,763 |
$23,198 |
10/31/2021 |
$19,948 |
$19,478 |
$24,767 |
11/30/2021 |
$19,394 |
$18,813 |
$24,390 |
12/31/2021 |
$20,416 |
$19,580 |
$25,350 |
1/31/2022 |
$19,208 |
$18,438 |
$23,859 |
2/28/2022 |
$19,727 |
$18,744 |
$23,258 |
3/31/2022 |
$19,801 |
$19,110 |
$24,012 |
4/30/2022 |
$18,560 |
$17,627 |
$21,857 |
5/31/2022 |
$19,004 |
$17,966 |
$21,828 |
6/30/2022 |
$17,268 |
$16,191 |
$20,002 |
7/31/2022 |
$18,729 |
$17,758 |
$21,878 |
8/31/2022 |
$17,989 |
$17,197 |
$21,062 |
9/30/2022 |
$16,262 |
$15,444 |
$19,109 |
10/31/2022 |
$18,234 |
$17,389 |
$20,676 |
11/30/2022 |
$19,106 |
$17,920 |
$21,755 |
12/31/2022 |
$17,998 |
$16,744 |
$20,481 |
1/31/2023 |
$19,482 |
$18,342 |
$21,892 |
2/28/2023 |
$19,151 |
$17,919 |
$21,380 |
3/31/2023 |
$18,232 |
$16,634 |
$21,952 |
4/30/2023 |
$17,647 |
$16,219 |
$22,186 |
5/31/2023 |
$17,113 |
$15,900 |
$22,272 |
6/30/2023 |
$18,583 |
$17,163 |
$23,793 |
7/31/2023 |
$19,671 |
$18,459 |
$24,646 |
8/31/2023 |
$19,087 |
$17,571 |
$24,170 |
9/30/2023 |
$18,234 |
$16,656 |
$23,019 |
10/31/2023 |
$17,367 |
$15,662 |
$22,408 |
11/30/2023 |
$18,616 |
$17,072 |
$24,498 |
12/31/2023 |
$20,798 |
$19,197 |
$25,797 |
1/31/2024 |
$20,103 |
$18,325 |
$26,083 |
2/29/2024 |
$21,094 |
$18,924 |
$27,495 |
3/31/2024 |
$22,197 |
$19,754 |
$28,382 |
4/30/2024 |
$20,764 |
$18,495 |
$27,133 |
5/31/2024 |
$21,572 |
$19,360 |
$28,415 |
6/30/2024 |
$21,213 |
$19,034 |
$29,295 |
7/31/2024 |
$23,315 |
$21,353 |
$29,839 |
8/31/2024 |
$22,931 |
$20,952 |
$30,489 |
9/30/2024 |
$22,943 |
$20,966 |
$31,120 |
10/31/2024 |
$22,659 |
$20,638 |
$30,891 |
11/30/2024 |
$24,906 |
$22,628 |
$32,946 |
12/31/2024 |
$22,636 |
$20,743 |
$31,939 |
1/31/2025 |
$23,458 |
$21,169 |
$32,947 |
2/28/2025 |
$22,373 |
$20,359 |
$32,316 |
3/31/2025 |
$20,997 |
$19,137 |
$30,431 |
4/30/2025 |
$20,150 |
$18,368 |
$30,227 |
5/31/2025 |
$21,021 |
$19,140 |
$32,143 |
6/30/2025 |
$21,839 |
$20,087 |
$33,776 |
7/31/2025 |
$21,899 |
$20,442 |
$34,520 |
8/31/2025 |
$22,943 |
$22,173 |
$35,318 |
9/30/2025 |
$23,111 |
$22,619 |
$36,537 |
10/31/2025 |
$22,450 |
$22,676 |
$37,320 |
11/30/2025 |
$22,951 |
$23,313 |
$37,423 |
12/31/2025 |
$23,112 |
$23,355 |
$37,415 |
1/31/2026 |
$24,584 |
$24,957 |
$37,996 |
2/28/2026 |
$25,783 |
$25,438 |
$37,815 |
3/31/2026 |
$24,750 |
$24,513 |
$35,935 |
4/30/2026 |
$26,886 |
$26,880 |
$39,601 |
|
| Average Annual Return [Table Text Block] |
|
Table Summary
AATR |
1 Year |
5 Years |
10 Years |
Small Company Value Portfolio |
33.43 |
7.30 |
10.40 |
Russell 2000® Value Index |
46.34 |
7.33 |
10.39 |
Russell 3000® Index |
31.01 |
11.91 |
14.75 | |
| No Deduction of Taxes [Text Block] |
|
do not reflect taxes that a shareholder may pay on an investment in a fund.
|
| Material Change Date |
May 01, 2025
|
|
| AssetsNet |
|
$ 650,937,195
|
| Holdings Count | Holding |
|
156
|
| Advisory Fees Paid, Amount |
|
$ 4,558,135
|
| InvestmentCompanyPortfolioTurnover |
|
209.00%
|
| Additional Fund Statistics [Text Block] |
|
Table Summary
Total net assets |
$650,937,195 |
# of portfolio holdings |
156 |
Portfolio turnover rate |
209% |
Total advisory fees paid |
$4,558,135 | |
| Holdings [Text Block] |
|
SECTOR ALLOCATION (% OF LONG-TERM INVESTMENTS)
Table Summary
Industrials |
22.6 |
Financials |
20.7 |
Information technology |
12.6 |
Consumer discretionary |
10.6 |
Materials |
8.4 |
Energy |
7.0 |
Consumer staples |
4.3 |
Real estate |
3.9 |
Health care |
3.8 |
Utilities |
2.8 |
Investment companies |
1.8 |
Communication services |
1.5 | |
| Largest Holdings [Text Block] |
|
TOP TEN HOLDINGS (% OF NET ASSETS)
Table Summary
Patterson-UTI Energy, Inc. |
1.3 |
Kaiser Aluminum Corp. |
1.3 |
NWPX Infrastructure, Inc. |
1.2 |
IDACORP, Inc. |
1.2 |
Permian Resources Corp. Class A |
1.2 |
Pinnacle West Capital Corp. |
1.2 |
Adeia, Inc. |
1.2 |
Sanmina Corp. |
1.2 |
Matador Resources Co. |
1.2 |
Atkore, Inc. |
1.1 | |
| Material Fund Change [Text Block] |
|
Significant portfolio changesThis is a summary of certain changes and planned changes to the portfolio since May 1, 2025. Effective June 30, 2026, Jeff Goverman will no longer serve as a portfolio manager of the Portfolio. |
| Summary of Change Legend [Text Block] |
|
This is a summary of certain changes and planned changes to the portfolio since May 1, 2025.
|
| C000020629 |
|
|
| Shareholder Report [Line Items] |
|
|
| Fund Name |
|
Core Bond Portfolio
|
| No Trading Symbol [Flag] |
|
true
|
| Annual or Semi-Annual Statement [Text Block] |
|
This annual shareholder report contains important information about Core Bond Portfolio for the period from May 1, 2025 to April 30, 2026.
|
| Additional Information [Text Block] |
|
You can find additional information about the Funds that invest in this Portfolio at allspringglobal.com.
|
| Additional Information Website |
|
<span style="box-sizing: border-box; color: rgb(0, 0, 0); display: inline; flex-wrap: nowrap; font-size: 12px; font-weight: 400; grid-area: auto; line-height: 18px; margin: 0px; overflow: visible; text-align: left; text-align-last: auto; white-space-collapse: preserve-breaks;">allspringglobal.com</span>
|
| Expenses [Text Block] |
|
What were the Portfolio costs for the past year?The table explains the costs you would have paid within the reporting period based on a hypothetical $10,000 investment.
Table Summary
CLASS NAME |
COSTS OF A $10,000 INVESTMENT |
COSTS PAID AS A % OF A $10,000 INVESTMENT |
Core Bond Portfolio |
$34 |
0.33% | |
| Expenses Paid, Amount |
|
$ 34
|
| Expense Ratio, Percent |
|
0.33%
|
| Factors Affecting Performance [Text Block] |
|
How did the Portfolio perform last year and what affected its performance?The Portfolio outperformed its benchmark for the period. The market was shaped by frequent repricing of Federal Reserve expectations and bouts of rate volatility driven by trade headlines, increasing investment in artificial intelligence, and geopolitical conflict. Despite this volatility, interest rates generally remained within a range while demand for credit was resilient and most risk assets performed well. Our positioning was nimble, as we adjusted credit exposure during tariff- and geopolitically driven volatility. We maintained an overweight to mortgage-backed securities (MBS). Sector positioning was the largest contributor to performance. Security selection within MBS also contributed as elevated interest rate volatility and price dislocations provided opportunities to extract relative value. Our tactical positioning in the credit sector contributed, as did a sector overweight and security selection within asset-backed securities. Security selection within credit was a small detractor, driven primarily by technology holdings. Our underweight to commercial mortgage-backed securities also modestly detracted as the sector performed well. |
| Performance Past Does Not Indicate Future [Text] |
|
Figures quoted represent past performance, which is no guarantee of future results,
|
| Line Graph [Table Text Block] |
|
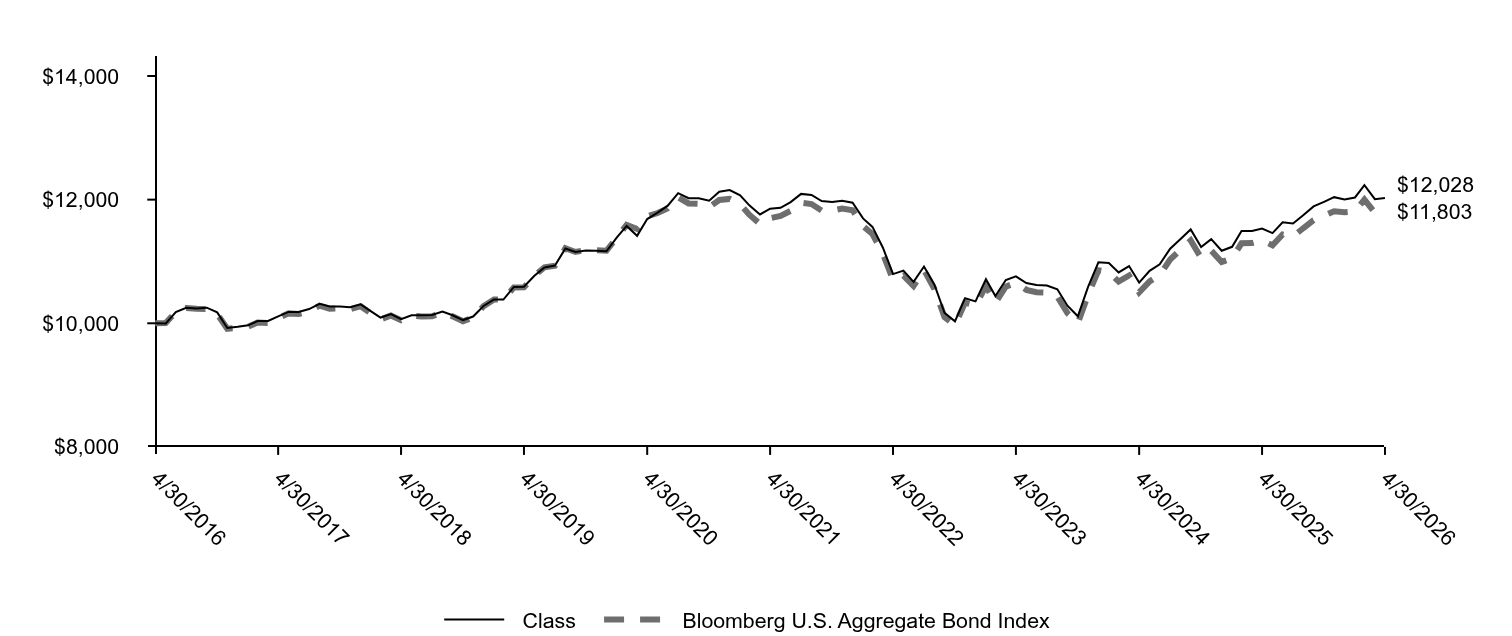
Table Summary
|
Class |
Bloomberg U.S. Aggregate Bond Index |
4/30/2016 |
$10,000 |
$10,000 |
5/31/2016 |
$9,995 |
$10,003 |
6/30/2016 |
$10,182 |
$10,182 |
7/31/2016 |
$10,252 |
$10,247 |
8/31/2016 |
$10,238 |
$10,235 |
9/30/2016 |
$10,252 |
$10,229 |
10/31/2016 |
$10,177 |
$10,151 |
11/30/2016 |
$9,925 |
$9,911 |
12/31/2016 |
$9,944 |
$9,925 |
1/31/2017 |
$9,967 |
$9,944 |
2/28/2017 |
$10,037 |
$10,011 |
3/31/2017 |
$10,037 |
$10,006 |
4/30/2017 |
$10,112 |
$10,083 |
5/31/2017 |
$10,184 |
$10,160 |
6/30/2017 |
$10,184 |
$10,150 |
7/31/2017 |
$10,230 |
$10,194 |
8/31/2017 |
$10,315 |
$10,285 |
9/30/2017 |
$10,271 |
$10,236 |
10/31/2017 |
$10,273 |
$10,242 |
11/30/2017 |
$10,261 |
$10,229 |
12/31/2017 |
$10,306 |
$10,276 |
1/31/2018 |
$10,192 |
$10,158 |
2/28/2018 |
$10,093 |
$10,061 |
3/31/2018 |
$10,148 |
$10,126 |
4/30/2018 |
$10,068 |
$10,051 |
5/31/2018 |
$10,130 |
$10,122 |
6/30/2018 |
$10,130 |
$10,110 |
7/31/2018 |
$10,134 |
$10,112 |
8/31/2018 |
$10,191 |
$10,177 |
9/30/2018 |
$10,130 |
$10,112 |
10/31/2018 |
$10,052 |
$10,032 |
11/30/2018 |
$10,109 |
$10,092 |
12/31/2018 |
$10,280 |
$10,277 |
1/31/2019 |
$10,386 |
$10,386 |
2/28/2019 |
$10,384 |
$10,380 |
3/31/2019 |
$10,588 |
$10,580 |
4/30/2019 |
$10,590 |
$10,582 |
5/31/2019 |
$10,769 |
$10,770 |
6/30/2019 |
$10,902 |
$10,906 |
7/31/2019 |
$10,934 |
$10,930 |
8/31/2019 |
$11,209 |
$11,213 |
9/30/2019 |
$11,153 |
$11,153 |
10/31/2019 |
$11,178 |
$11,187 |
11/30/2019 |
$11,174 |
$11,181 |
12/31/2019 |
$11,164 |
$11,173 |
1/31/2020 |
$11,390 |
$11,388 |
2/29/2020 |
$11,575 |
$11,593 |
3/31/2020 |
$11,415 |
$11,525 |
4/30/2020 |
$11,686 |
$11,730 |
5/31/2020 |
$11,791 |
$11,784 |
6/30/2020 |
$11,902 |
$11,859 |
7/31/2020 |
$12,104 |
$12,036 |
8/31/2020 |
$12,023 |
$11,939 |
9/30/2020 |
$12,024 |
$11,932 |
10/31/2020 |
$11,982 |
$11,879 |
11/30/2020 |
$12,127 |
$11,995 |
12/31/2020 |
$12,154 |
$12,012 |
1/31/2021 |
$12,070 |
$11,926 |
2/28/2021 |
$11,904 |
$11,753 |
3/31/2021 |
$11,760 |
$11,607 |
4/30/2021 |
$11,853 |
$11,698 |
5/31/2021 |
$11,868 |
$11,737 |
6/30/2021 |
$11,960 |
$11,819 |
7/31/2021 |
$12,093 |
$11,951 |
8/31/2021 |
$12,076 |
$11,929 |
9/30/2021 |
$11,977 |
$11,825 |
10/31/2021 |
$11,962 |
$11,822 |
11/30/2021 |
$11,981 |
$11,857 |
12/31/2021 |
$11,950 |
$11,827 |
1/31/2022 |
$11,697 |
$11,572 |
2/28/2022 |
$11,559 |
$11,443 |
3/31/2022 |
$11,223 |
$11,125 |
4/30/2022 |
$10,796 |
$10,703 |
5/31/2022 |
$10,853 |
$10,772 |
6/30/2022 |
$10,669 |
$10,603 |
7/31/2022 |
$10,918 |
$10,862 |
8/31/2022 |
$10,623 |
$10,555 |
9/30/2022 |
$10,168 |
$10,099 |
10/31/2022 |
$10,032 |
$9,968 |
11/30/2022 |
$10,406 |
$10,335 |
12/31/2022 |
$10,354 |
$10,288 |
1/31/2023 |
$10,712 |
$10,604 |
2/28/2023 |
$10,442 |
$10,330 |
3/31/2023 |
$10,700 |
$10,593 |
4/30/2023 |
$10,759 |
$10,657 |
5/31/2023 |
$10,650 |
$10,541 |
6/30/2023 |
$10,621 |
$10,503 |
7/31/2023 |
$10,611 |
$10,496 |
8/31/2023 |
$10,551 |
$10,429 |
9/30/2023 |
$10,285 |
$10,164 |
10/31/2023 |
$10,113 |
$10,003 |
11/30/2023 |
$10,585 |
$10,456 |
12/31/2023 |
$10,987 |
$10,857 |
1/31/2024 |
$10,975 |
$10,827 |
2/29/2024 |
$10,823 |
$10,674 |
3/31/2024 |
$10,925 |
$10,773 |
4/30/2024 |
$10,659 |
$10,500 |
5/31/2024 |
$10,849 |
$10,678 |
6/30/2024 |
$10,954 |
$10,780 |
7/31/2024 |
$11,207 |
$11,031 |
8/31/2024 |
$11,362 |
$11,190 |
9/30/2024 |
$11,518 |
$11,340 |
10/31/2024 |
$11,233 |
$11,058 |
11/30/2024 |
$11,361 |
$11,175 |
12/31/2024 |
$11,174 |
$10,992 |
1/31/2025 |
$11,237 |
$11,051 |
2/28/2025 |
$11,491 |
$11,294 |
3/31/2025 |
$11,492 |
$11,298 |
4/30/2025 |
$11,533 |
$11,343 |
5/31/2025 |
$11,458 |
$11,261 |
6/30/2025 |
$11,635 |
$11,435 |
7/31/2025 |
$11,613 |
$11,404 |
8/31/2025 |
$11,753 |
$11,541 |
9/30/2025 |
$11,890 |
$11,667 |
10/31/2025 |
$11,965 |
$11,740 |
11/30/2025 |
$12,040 |
$11,813 |
12/31/2025 |
$12,002 |
$11,795 |
1/31/2026 |
$12,035 |
$11,808 |
2/28/2026 |
$12,235 |
$12,001 |
3/31/2026 |
$12,008 |
$11,789 |
4/30/2026 |
$12,028 |
$11,803 |
|
| Average Annual Return [Table Text Block] |
|
Table Summary
AATR |
1 Year |
5 Years |
10 Years |
Core Bond Portfolio |
4.30 |
0.29 |
1.86 |
Bloomberg U.S. Aggregate Bond Index |
4.06 |
0.18 |
1.67 | |
| No Deduction of Taxes [Text Block] |
|
do not reflect taxes that a shareholder may pay on an investment in a fund.
|
| AssetsNet |
|
$ 4,599,650,139
|
| Holdings Count | Holding |
|
993
|
| Advisory Fees Paid, Amount |
|
$ 15,976,696
|
| InvestmentCompanyPortfolioTurnover |
|
362.00%
|
| Additional Fund Statistics [Text Block] |
|
Table Summary
Total net assets |
$4,599,650,139 |
# of portfolio holdings |
993 |
Portfolio turnover rate |
362% |
Total advisory fees paid |
$15,976,696 | |
| Holdings [Text Block] |
|
PORTFOLIO ALLOCATION (% OF TOTAL INVESTMENT)
Table Summary
Agency securities |
37.9 |
U.S. Treasury securities |
25.8 |
Corporate bonds and notes |
23.3 |
Asset-backed securities |
5.8 |
Yankee corporate bonds and notes |
4.7 |
Non-agency mortgage-backed securities |
1.5 |
Yankee government bonds |
0.9 |
Municipal obligations |
0.1 | |
| Largest Holdings [Text Block] |
|
TOP TEN HOLDINGS (% OF NET ASSETS)
Table Summary
U.S. Treasury Notes, 3.88%, 4‑30‑2031 |
2.5 |
U.S. Treasury Notes, 3.63%, 8‑31‑2030 |
2.4 |
U.S. Treasury Bonds, 4.63%, 2‑15‑2046 |
2.3 |
FNMA, 5.50%, 6‑1‑2056 |
2.0 |
U.S. Treasury Bonds, 4.63%, 11‑15‑2055 |
1.8 |
U.S. Treasury Notes, 3.75%, 4‑30‑2028 |
1.7 |
U.S. Treasury Notes, 3.88%, 4‑30‑2030 |
1.7 |
FNMA, 5.00%, 5‑1‑2056 |
1.4 |
U.S. Treasury Bonds, 3.00%, 2‑15‑2049 |
1.1 |
U.S. Treasury Notes, 4.13%, 10‑31‑2027 |
1.1 | |
| Material Fund Change [Text Block] |
|
|
| C000020605 |
|
|
| Shareholder Report [Line Items] |
|
|
| Fund Name |
|
Disciplined International Developed Markets Portfolio
|
| No Trading Symbol [Flag] |
|
true
|
| Annual or Semi-Annual Statement [Text Block] |
|
This annual shareholder report contains important information about Disciplined International Developed Markets Portfolio for the period from May 1, 2025 to April 30, 2026.
|
| Additional Information [Text Block] |
|
You can find additional information about the Funds that invest in this Portfolio at allspringglobal.com.
|
| Additional Information Website |
|
<span style="box-sizing: border-box; color: rgb(0, 0, 0); display: inline; flex-wrap: nowrap; font-size: 12px; font-weight: 400; grid-area: auto; line-height: 18px; margin: 0px; overflow: visible; text-align: left; text-align-last: auto; white-space-collapse: preserve-breaks;">allspringglobal.com</span>
|
| Expenses [Text Block] |
|
What were the Portfolio costs for the past year?The table explains the costs you would have paid within the reporting period based on a hypothetical $10,000 investment.
Table Summary
CLASS NAME |
COSTS OF A $10,000 INVESTMENT |
COSTS PAID AS A % OF A $10,000 INVESTMENT |
Disciplined International Developed Markets Portfolio |
$43 |
0.38% | |
| Expenses Paid, Amount |
|
$ 43
|
| Expense Ratio, Percent |
|
0.38%
|
| Factors Affecting Performance [Text Block] |
|
How did the Portfolio perform last year and what affected its performance?The Portfolio outperformed its benchmark for the period. International equity markets had strong returns during the period. Changes to the Portfolio's portfolio were minimal. Characteristics typically favored in the portfolio include attractive valuation, earnings consistency, profitability, and improving market sentiment. Stock selection was the main driver of outperformance, adding value in 8 of 11 sectors. This was primarily due to strong stock selection within the industrials, health care, and consumer staples sectors. The largest individual contributors to relative performance were Siemens Energy AG, Inpex Corp., and Sumitomo Electric Industries. A modest underweight to communication services also contributed. However, variations in sector weights versus the index were relatively small, which is typical for the strategy. Negative stock selection within information technology, real estate, and consumer discretionary detracted from relative performance. The top three individual detractors from relative performance were Oracle Corp. Japan, Pandora AS, and Renault SA (This security was no longer held at the end of the reporting period.). |
| Performance Past Does Not Indicate Future [Text] |
|
Figures quoted represent past performance, which is no guarantee of future results,
|
| Line Graph [Table Text Block] |
|
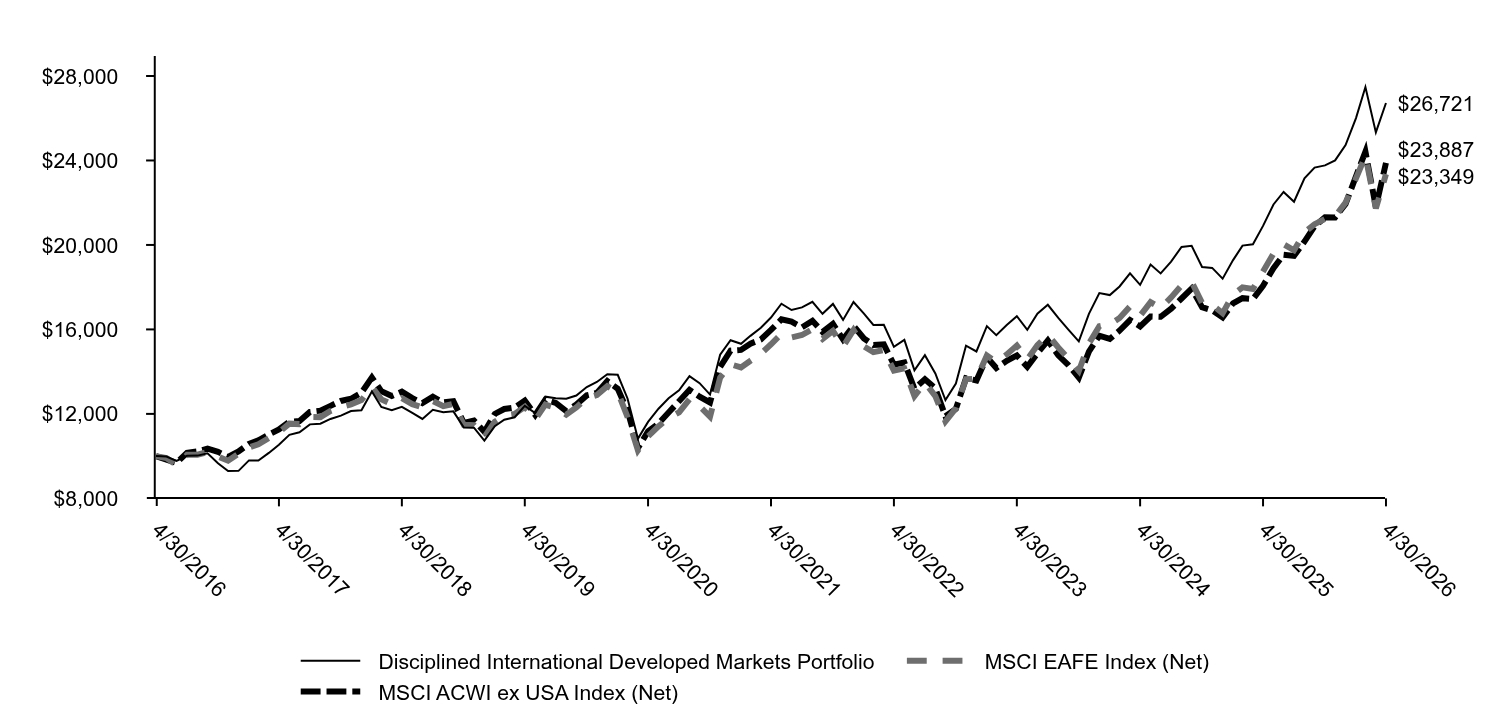
Table Summary
|
Disciplined International Developed Markets Portfolio |
MSCI EAFE Index (Net) |
MSCI ACWI ex USA Index (Net) |
4/30/2016 |
$10,000 |
$10,000 |
$10,000 |
5/31/2016 |
$9,981 |
$9,909 |
$9,831 |
6/30/2016 |
$9,769 |
$9,577 |
$9,681 |
7/31/2016 |
$10,014 |
$10,062 |
$10,160 |
8/31/2016 |
$10,024 |
$10,069 |
$10,224 |
9/30/2016 |
$10,137 |
$10,193 |
$10,350 |
10/31/2016 |
$9,661 |
$9,984 |
$10,201 |
11/30/2016 |
$9,298 |
$9,785 |
$9,965 |
12/31/2016 |
$9,303 |
$10,120 |
$10,220 |
1/31/2017 |
$9,797 |
$10,414 |
$10,582 |
2/28/2017 |
$9,793 |
$10,562 |
$10,751 |
3/31/2017 |
$10,151 |
$10,853 |
$11,023 |
4/30/2017 |
$10,537 |
$11,129 |
$11,259 |
5/31/2017 |
$11,010 |
$11,538 |
$11,625 |
6/30/2017 |
$11,130 |
$11,517 |
$11,661 |
7/31/2017 |
$11,504 |
$11,850 |
$12,091 |
8/31/2017 |
$11,532 |
$11,845 |
$12,154 |
9/30/2017 |
$11,761 |
$12,140 |
$12,379 |
10/31/2017 |
$11,919 |
$12,324 |
$12,612 |
11/30/2017 |
$12,132 |
$12,454 |
$12,715 |
12/31/2017 |
$12,169 |
$12,653 |
$12,999 |
1/31/2018 |
$13,059 |
$13,288 |
$13,723 |
2/28/2018 |
$12,329 |
$12,688 |
$13,076 |
3/31/2018 |
$12,179 |
$12,460 |
$12,845 |
4/30/2018 |
$12,336 |
$12,744 |
$13,050 |
5/31/2018 |
$12,051 |
$12,458 |
$12,749 |
6/30/2018 |
$11,761 |
$12,306 |
$12,509 |
7/31/2018 |
$12,196 |
$12,608 |
$12,809 |
8/31/2018 |
$12,079 |
$12,365 |
$12,541 |
9/30/2018 |
$12,120 |
$12,472 |
$12,598 |
10/31/2018 |
$11,357 |
$11,480 |
$11,573 |
11/30/2018 |
$11,349 |
$11,465 |
$11,683 |
12/31/2018 |
$10,734 |
$10,909 |
$11,154 |
1/31/2019 |
$11,415 |
$11,625 |
$11,997 |
2/28/2019 |
$11,727 |
$11,922 |
$12,231 |
3/31/2019 |
$11,839 |
$11,997 |
$12,304 |
4/30/2019 |
$12,382 |
$12,334 |
$12,629 |
5/31/2019 |
$12,034 |
$11,742 |
$11,951 |
6/30/2019 |
$12,816 |
$12,438 |
$12,671 |
7/31/2019 |
$12,738 |
$12,281 |
$12,517 |
8/31/2019 |
$12,720 |
$11,962 |
$12,131 |
9/30/2019 |
$12,869 |
$12,305 |
$12,443 |
10/31/2019 |
$13,270 |
$12,747 |
$12,877 |
11/30/2019 |
$13,513 |
$12,891 |
$12,991 |
12/31/2019 |
$13,880 |
$13,310 |
$13,553 |
1/31/2020 |
$13,850 |
$13,032 |
$13,189 |
2/29/2020 |
$12,730 |
$11,854 |
$12,146 |
3/31/2020 |
$10,828 |
$10,272 |
$10,388 |
4/30/2020 |
$11,620 |
$10,935 |
$11,175 |
5/31/2020 |
$12,246 |
$11,412 |
$11,541 |
6/30/2020 |
$12,741 |
$11,800 |
$12,062 |
7/31/2020 |
$13,115 |
$12,075 |
$12,600 |
8/31/2020 |
$13,786 |
$12,696 |
$13,139 |
9/30/2020 |
$13,454 |
$12,366 |
$12,816 |
10/31/2020 |
$12,915 |
$11,872 |
$12,541 |
11/30/2020 |
$14,799 |
$13,713 |
$14,228 |
12/31/2020 |
$15,488 |
$14,350 |
$14,997 |
1/31/2021 |
$15,319 |
$14,197 |
$15,029 |
2/28/2021 |
$15,695 |
$14,516 |
$15,327 |
3/31/2021 |
$16,078 |
$14,850 |
$15,521 |
4/30/2021 |
$16,565 |
$15,296 |
$15,978 |
5/31/2021 |
$17,215 |
$15,795 |
$16,477 |
6/30/2021 |
$16,917 |
$15,617 |
$16,371 |
7/31/2021 |
$17,044 |
$15,735 |
$16,101 |
8/31/2021 |
$17,308 |
$16,013 |
$16,407 |
9/30/2021 |
$16,739 |
$15,548 |
$15,881 |
10/31/2021 |
$17,208 |
$15,930 |
$16,261 |
11/30/2021 |
$16,451 |
$15,189 |
$15,528 |
12/31/2021 |
$17,296 |
$15,967 |
$16,170 |
1/31/2022 |
$16,747 |
$15,195 |
$15,574 |
2/28/2022 |
$16,212 |
$14,926 |
$15,266 |
3/31/2022 |
$16,220 |
$15,022 |
$15,290 |
4/30/2022 |
$15,176 |
$14,050 |
$14,330 |
5/31/2022 |
$15,503 |
$14,156 |
$14,433 |
6/30/2022 |
$14,067 |
$12,842 |
$13,191 |
7/31/2022 |
$14,780 |
$13,482 |
$13,643 |
8/31/2022 |
$13,914 |
$12,842 |
$13,204 |
9/30/2022 |
$12,651 |
$11,641 |
$11,885 |
10/31/2022 |
$13,434 |
$12,267 |
$12,240 |
11/30/2022 |
$15,230 |
$13,648 |
$13,685 |
12/31/2022 |
$14,955 |
$13,659 |
$13,582 |
1/31/2023 |
$16,156 |
$14,765 |
$14,684 |
2/28/2023 |
$15,730 |
$14,457 |
$14,169 |
3/31/2023 |
$16,212 |
$14,815 |
$14,515 |
4/30/2023 |
$16,625 |
$15,234 |
$14,767 |
5/31/2023 |
$15,979 |
$14,589 |
$14,230 |
6/30/2023 |
$16,744 |
$15,253 |
$14,869 |
7/31/2023 |
$17,166 |
$15,746 |
$15,473 |
8/31/2023 |
$16,543 |
$15,143 |
$14,774 |
9/30/2023 |
$15,989 |
$14,626 |
$14,308 |
10/31/2023 |
$15,432 |
$14,033 |
$13,717 |
11/30/2023 |
$16,738 |
$15,335 |
$14,952 |
12/31/2023 |
$17,722 |
$16,150 |
$15,703 |
1/31/2024 |
$17,626 |
$16,243 |
$15,547 |
2/29/2024 |
$18,035 |
$16,541 |
$15,941 |
3/31/2024 |
$18,657 |
$17,085 |
$16,439 |
4/30/2024 |
$18,110 |
$16,647 |
$16,144 |
5/31/2024 |
$19,072 |
$17,292 |
$16,613 |
6/30/2024 |
$18,652 |
$17,013 |
$16,597 |
7/31/2024 |
$19,208 |
$17,512 |
$16,981 |
8/31/2024 |
$19,904 |
$18,081 |
$17,465 |
9/30/2024 |
$19,961 |
$18,248 |
$17,935 |
10/31/2024 |
$18,955 |
$17,256 |
$17,055 |
11/30/2024 |
$18,912 |
$17,158 |
$16,901 |
12/31/2024 |
$18,404 |
$16,768 |
$16,572 |
1/31/2025 |
$19,283 |
$17,649 |
$17,240 |
2/28/2025 |
$19,968 |
$17,991 |
$17,479 |
3/31/2025 |
$20,028 |
$17,919 |
$17,440 |
4/30/2025 |
$20,902 |
$18,739 |
$18,069 |
5/31/2025 |
$21,916 |
$19,597 |
$18,897 |
6/30/2025 |
$22,509 |
$20,029 |
$19,538 |
7/31/2025 |
$22,047 |
$19,747 |
$19,482 |
8/31/2025 |
$23,157 |
$20,589 |
$20,158 |
9/30/2025 |
$23,664 |
$20,983 |
$20,885 |
10/31/2025 |
$23,766 |
$21,230 |
$21,307 |
11/30/2025 |
$24,005 |
$21,362 |
$21,301 |
12/31/2025 |
$24,727 |
$22,003 |
$21,940 |
1/31/2026 |
$26,008 |
$23,151 |
$23,252 |
2/28/2026 |
$27,478 |
$24,222 |
$24,420 |
3/31/2026 |
$25,329 |
$21,730 |
$21,785 |
4/30/2026 |
$26,721 |
$23,349 |
$23,887 |
|
| Average Annual Return [Table Text Block] |
|
Table Summary
AATR |
1 Year |
5 Years |
10 Years |
Disciplined International Developed Markets Portfolio |
27.84 |
10.04 |
10.33 |
MSCI EAFE Index (Net) |
24.60 |
8.83 |
8.85 |
MSCI ACWI ex USA Index (Net) |
32.20 |
8.38 |
9.10 | |
| No Deduction of Taxes [Text Block] |
|
do not reflect taxes that a shareholder may pay on an investment in a fund.
|
| AssetsNet |
|
$ 290,468,796
|
| Holdings Count | Holding |
|
263
|
| Advisory Fees Paid, Amount |
|
$ 683,070
|
| InvestmentCompanyPortfolioTurnover |
|
29.00%
|
| Additional Fund Statistics [Text Block] |
|
Table Summary
Total net assets |
$290,468,796 |
# of portfolio holdings |
263 |
Portfolio turnover rate |
29% |
Total advisory fees paid |
$683,070 | |
| Holdings [Text Block] |
|
COUNTRY ALLOCATION (% OF LONG-TERM INVESTMENTS)
Table Summary
Japan |
24.0 |
United Kingdom |
16.5 |
France |
12.1 |
Switzerland |
7.7 |
Netherlands |
6.9 |
Germany |
6.6 |
Australia |
5.5 |
Spain |
3.4 |
Italy |
3.4 |
Denmark |
3.1 |
Other |
10.8 | SECTOR ALLOCATION (% OF LONG-TERM INVESTMENTS)
Table Summary
Financials |
25.0 |
Industrials |
20.5 |
Health care |
11.3 |
Information technology |
10.4 |
Consumer discretionary |
7.3 |
Consumer staples |
6.4 |
Materials |
5.6 |
Utilities |
4.8 |
Energy |
4.2 |
Communication services |
3.0 |
Real estate |
1.5 | |
| Largest Holdings [Text Block] |
|
TOP TEN HOLDINGS (% OF NET ASSETS)
Table Summary
ASML Holding NV |
2.5 |
Siemens Energy AG |
1.8 |
Novartis AG |
1.7 |
HSBC Holdings PLC |
1.3 |
AstraZeneca PLC |
1.2 |
Rolls-Royce Holdings PLC |
1.2 |
Prosus NV |
1.2 |
Roche Holding AG |
1.1 |
Engie SA |
1.1 |
BNP Paribas SA |
1.1 | |
| Material Fund Change [Text Block] |
|
|
| C000020607 |
|
|
| Shareholder Report [Line Items] |
|
|
| Fund Name |
|
Real Return Portfolio
|
| No Trading Symbol [Flag] |
|
true
|
| Annual or Semi-Annual Statement [Text Block] |
|
This annual shareholder report contains important information about Real Return Portfolio for the period from May 1, 2025 to April 30, 2026.
|
| Additional Information [Text Block] |
|
You can find additional information about the Funds that invest in this Portfolio at allspringglobal.com.
|
| Additional Information Website |
|
<span style="box-sizing: border-box; color: rgb(0, 0, 0); display: inline; flex-wrap: nowrap; font-size: 12px; font-weight: 400; grid-area: auto; line-height: 18px; margin: 0px; overflow: visible; text-align: left; text-align-last: auto; white-space-collapse: preserve-breaks;">allspringglobal.com</span>
|
| Expenses [Text Block] |
|
What were the Portfolio consolidated costs for the past year?The table explains the consolidated costs you would have paid within the reporting period based on a hypothetical $10,000 investment.
Table Summary
CLASS NAME |
CONSOLIDATED COSTS OF A $10,000 INVESTMENT |
COSTS PAID AS A % OF A $10,000 INVESTMENT |
Real Return Portfolio |
$45 |
0.40% | |
| Expenses Paid, Amount |
|
$ 45
|
| Expense Ratio, Percent |
|
0.40%
|
| Factors Affecting Performance [Text Block] |
|
How did the Portfolio perform last year and what affected its performance?The Portfolio outperformed its benchmark for the period. The past year saw a wide set of narratives drive the economy and financial markets. From an initial focus on tariffs, markets swiftly moved onto opportunities within artificial intelligence (AI) followed by a U.S. government shutdown that lead to a dearth of data. Geopolitical risk remained. U.S. economic growth remained above trend, supported initially by AI-driven capital expenditures and resilient consumer spending. Inflation remained above target. Outside the U.S., investment opportunities were divergent. Globally, expectations for earnings growth remain concentrated in one theme: AI. We spent the bulk of the period with lower-than-benchmark exposure to U.S. assets, preferring emerging markets and developed ex U.S. equities. Early in 2026, we moderated this positioning slightly. We also increased exposure to commodities during the period. Exposure to precious metals equities and commodities and tactical asset allocation were the primary drivers of outperformance. No major portfolio components detracted significantly from the benchmark. |
| Performance Past Does Not Indicate Future [Text] |
|
Figures quoted represent past performance, which is no guarantee of future results,
|
| Line Graph [Table Text Block] |
|
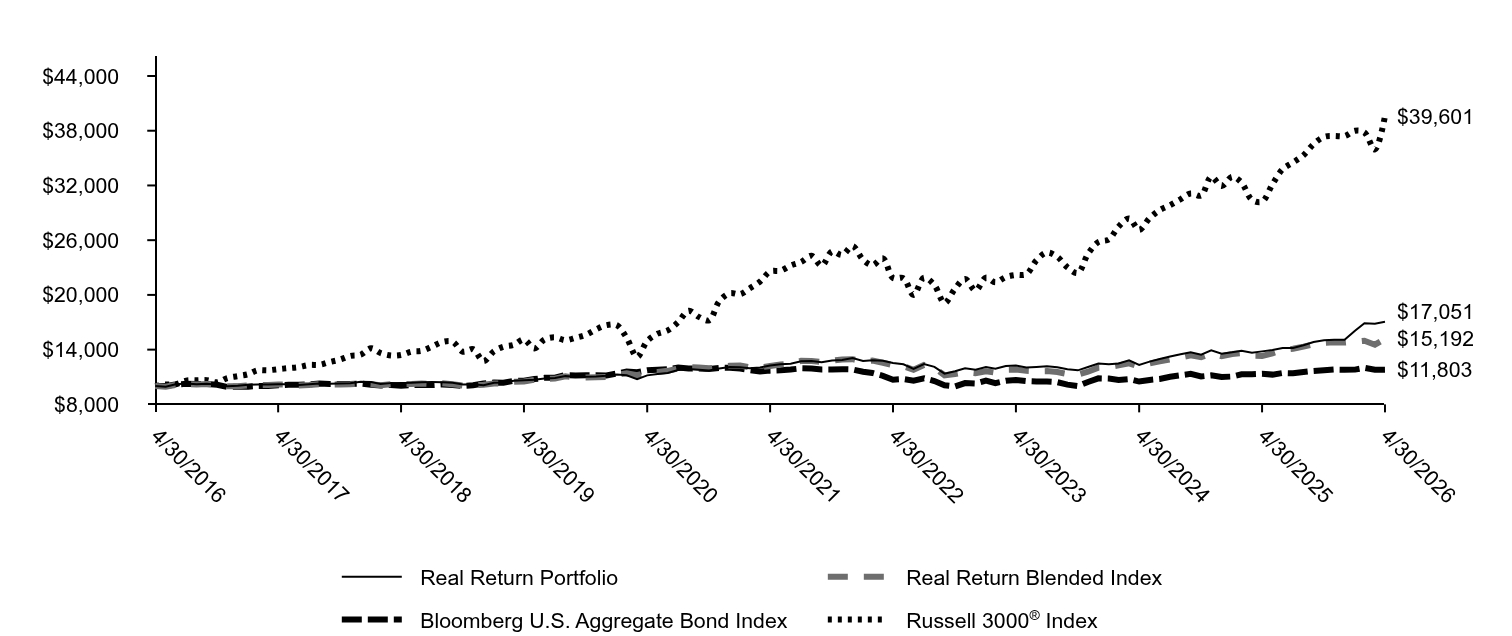
Table Summary
|
Real Return Portfolio |
Real Return Blended Index |
Bloomberg U.S. Aggregate Bond Index |
Russell 3000® Index |
4/30/2016 |
$10,000 |
$10,000 |
$10,000 |
$10,000 |
5/31/2016 |
$9,943 |
$9,929 |
$10,003 |
$10,179 |
6/30/2016 |
$10,202 |
$10,136 |
$10,182 |
$10,200 |
7/31/2016 |
$10,291 |
$10,224 |
$10,247 |
$10,605 |
8/31/2016 |
$10,196 |
$10,178 |
$10,235 |
$10,632 |
9/30/2016 |
$10,272 |
$10,233 |
$10,229 |
$10,648 |
10/31/2016 |
$10,164 |
$10,192 |
$10,151 |
$10,418 |
11/30/2016 |
$9,981 |
$9,997 |
$9,911 |
$10,884 |
12/31/2016 |
$10,032 |
$9,987 |
$9,925 |
$11,097 |
1/31/2017 |
$10,139 |
$10,071 |
$9,944 |
$11,305 |
2/28/2017 |
$10,183 |
$10,118 |
$10,011 |
$11,726 |
3/31/2017 |
$10,177 |
$10,113 |
$10,006 |
$11,734 |
4/30/2017 |
$10,196 |
$10,173 |
$10,083 |
$11,858 |
5/31/2017 |
$10,206 |
$10,168 |
$10,160 |
$11,980 |
6/30/2017 |
$10,116 |
$10,072 |
$10,150 |
$12,088 |
7/31/2017 |
$10,197 |
$10,117 |
$10,194 |
$12,316 |
8/31/2017 |
$10,275 |
$10,225 |
$10,285 |
$12,339 |
9/30/2017 |
$10,250 |
$10,159 |
$10,236 |
$12,640 |
10/31/2017 |
$10,296 |
$10,181 |
$10,242 |
$12,916 |
11/30/2017 |
$10,324 |
$10,194 |
$10,229 |
$13,308 |
12/31/2017 |
$10,479 |
$10,287 |
$10,276 |
$13,441 |
1/31/2018 |
$10,461 |
$10,199 |
$10,158 |
$14,150 |
2/28/2018 |
$10,240 |
$10,100 |
$10,061 |
$13,628 |
3/31/2018 |
$10,328 |
$10,206 |
$10,126 |
$13,355 |
4/30/2018 |
$10,352 |
$10,200 |
$10,051 |
$13,406 |
5/31/2018 |
$10,376 |
$10,244 |
$10,122 |
$13,784 |
6/30/2018 |
$10,433 |
$10,285 |
$10,110 |
$13,874 |
7/31/2018 |
$10,438 |
$10,235 |
$10,112 |
$14,335 |
8/31/2018 |
$10,430 |
$10,309 |
$10,177 |
$14,838 |
9/30/2018 |
$10,379 |
$10,201 |
$10,112 |
$14,863 |
10/31/2018 |
$10,174 |
$10,054 |
$10,032 |
$13,768 |
11/30/2018 |
$10,212 |
$10,102 |
$10,092 |
$14,044 |
12/31/2018 |
$10,094 |
$10,158 |
$10,277 |
$12,737 |
1/31/2019 |
$10,374 |
$10,294 |
$10,386 |
$13,830 |
2/28/2019 |
$10,397 |
$10,293 |
$10,380 |
$14,316 |
3/31/2019 |
$10,589 |
$10,482 |
$10,580 |
$14,526 |
4/30/2019 |
$10,651 |
$10,517 |
$10,582 |
$15,106 |
5/31/2019 |
$10,687 |
$10,691 |
$10,770 |
$14,128 |
6/30/2019 |
$10,844 |
$10,782 |
$10,906 |
$15,120 |
7/31/2019 |
$10,895 |
$10,821 |
$10,930 |
$15,345 |
8/31/2019 |
$11,095 |
$11,078 |
$11,213 |
$15,032 |
9/30/2019 |
$11,018 |
$10,927 |
$11,153 |
$15,296 |
10/31/2019 |
$11,024 |
$10,955 |
$11,187 |
$15,625 |
11/30/2019 |
$11,054 |
$10,972 |
$11,181 |
$16,219 |
12/31/2019 |
$11,140 |
$11,014 |
$11,173 |
$16,688 |
1/31/2020 |
$11,272 |
$11,245 |
$11,388 |
$16,669 |
2/29/2020 |
$11,185 |
$11,400 |
$11,593 |
$15,305 |
3/31/2020 |
$10,765 |
$11,200 |
$11,525 |
$13,200 |
4/30/2020 |
$11,179 |
$11,512 |
$11,730 |
$14,948 |
5/31/2020 |
$11,320 |
$11,546 |
$11,784 |
$15,748 |
6/30/2020 |
$11,430 |
$11,675 |
$11,859 |
$16,108 |
7/31/2020 |
$11,769 |
$11,943 |
$12,036 |
$17,022 |
8/31/2020 |
$11,877 |
$12,074 |
$11,939 |
$18,255 |
9/30/2020 |
$11,805 |
$12,029 |
$11,932 |
$17,591 |
10/31/2020 |
$11,712 |
$11,952 |
$11,879 |
$17,211 |
11/30/2020 |
$11,942 |
$12,086 |
$11,995 |
$19,305 |
12/31/2020 |
$12,095 |
$12,224 |
$12,012 |
$20,173 |
1/31/2021 |
$12,080 |
$12,265 |
$11,926 |
$20,084 |
2/28/2021 |
$11,953 |
$12,067 |
$11,753 |
$20,711 |
3/31/2021 |
$12,048 |
$12,044 |
$11,607 |
$21,454 |
4/30/2021 |
$12,262 |
$12,213 |
$11,698 |
$22,560 |
5/31/2021 |
$12,405 |
$12,361 |
$11,737 |
$22,663 |
6/30/2021 |
$12,459 |
$12,436 |
$11,819 |
$23,222 |
7/31/2021 |
$12,730 |
$12,767 |
$11,951 |
$23,614 |
8/31/2021 |
$12,748 |
$12,745 |
$11,929 |
$24,288 |
9/30/2021 |
$12,606 |
$12,653 |
$11,825 |
$23,198 |
10/31/2021 |
$12,817 |
$12,797 |
$11,822 |
$24,767 |
11/30/2021 |
$12,876 |
$12,911 |
$11,857 |
$24,390 |
12/31/2021 |
$13,083 |
$12,952 |
$11,827 |
$25,350 |
1/31/2022 |
$12,767 |
$12,690 |
$11,572 |
$23,859 |
2/28/2022 |
$12,833 |
$12,799 |
$11,443 |
$23,258 |
3/31/2022 |
$12,790 |
$12,561 |
$11,125 |
$24,012 |
4/30/2022 |
$12,529 |
$12,304 |
$10,703 |
$21,857 |
5/31/2022 |
$12,387 |
$12,182 |
$10,772 |
$21,828 |
6/30/2022 |
$11,894 |
$11,797 |
$10,603 |
$20,002 |
7/31/2022 |
$12,427 |
$12,310 |
$10,862 |
$21,878 |
8/31/2022 |
$12,111 |
$11,983 |
$10,555 |
$21,062 |
9/30/2022 |
$11,365 |
$11,190 |
$10,099 |
$19,109 |
10/31/2022 |
$11,635 |
$11,329 |
$9,968 |
$20,676 |
11/30/2022 |
$11,957 |
$11,536 |
$10,335 |
$21,755 |
12/31/2022 |
$11,798 |
$11,418 |
$10,288 |
$20,481 |
1/31/2023 |
$12,094 |
$11,627 |
$10,604 |
$21,892 |
2/28/2023 |
$11,898 |
$11,468 |
$10,330 |
$21,380 |
3/31/2023 |
$12,198 |
$11,799 |
$10,593 |
$21,952 |
4/30/2023 |
$12,255 |
$11,812 |
$10,657 |
$22,186 |
5/31/2023 |
$12,049 |
$11,671 |
$10,541 |
$22,272 |
6/30/2023 |
$12,108 |
$11,632 |
$10,503 |
$23,793 |
7/31/2023 |
$12,184 |
$11,646 |
$10,496 |
$24,646 |
8/31/2023 |
$12,072 |
$11,542 |
$10,429 |
$24,170 |
9/30/2023 |
$11,839 |
$11,329 |
$10,164 |
$23,019 |
10/31/2023 |
$11,730 |
$11,247 |
$10,003 |
$22,408 |
11/30/2023 |
$12,091 |
$11,583 |
$10,456 |
$24,498 |
12/31/2023 |
$12,473 |
$12,032 |
$10,857 |
$25,797 |
1/31/2024 |
$12,393 |
$12,098 |
$10,827 |
$26,083 |
2/29/2024 |
$12,483 |
$12,271 |
$10,674 |
$27,495 |
3/31/2024 |
$12,825 |
$12,492 |
$10,773 |
$28,382 |
4/30/2024 |
$12,327 |
$12,127 |
$10,500 |
$27,133 |
5/31/2024 |
$12,682 |
$12,480 |
$10,678 |
$28,415 |
6/30/2024 |
$12,970 |
$12,709 |
$10,780 |
$29,295 |
7/31/2024 |
$13,237 |
$12,936 |
$11,031 |
$29,839 |
8/31/2024 |
$13,504 |
$13,141 |
$11,190 |
$30,489 |
9/30/2024 |
$13,711 |
$13,366 |
$11,340 |
$31,120 |
10/31/2024 |
$13,450 |
$13,162 |
$11,058 |
$30,891 |
11/30/2024 |
$13,921 |
$13,558 |
$11,175 |
$32,946 |
12/31/2024 |
$13,548 |
$13,276 |
$10,992 |
$31,939 |
1/31/2025 |
$13,707 |
$13,523 |
$11,051 |
$32,947 |
2/28/2025 |
$13,888 |
$13,606 |
$11,294 |
$32,316 |
3/31/2025 |
$13,658 |
$13,323 |
$11,298 |
$30,431 |
4/30/2025 |
$13,808 |
$13,310 |
$11,343 |
$30,227 |
5/31/2025 |
$13,966 |
$13,599 |
$11,261 |
$32,143 |
6/30/2025 |
$14,182 |
$13,972 |
$11,435 |
$33,776 |
7/31/2025 |
$14,182 |
$14,093 |
$11,404 |
$34,520 |
8/31/2025 |
$14,476 |
$14,329 |
$11,541 |
$35,318 |
9/30/2025 |
$14,838 |
$14,589 |
$11,667 |
$36,537 |
10/31/2025 |
$15,040 |
$14,756 |
$11,740 |
$37,320 |
11/30/2025 |
$15,080 |
$14,802 |
$11,813 |
$37,423 |
12/31/2025 |
$15,081 |
$14,776 |
$11,795 |
$37,415 |
1/31/2026 |
$16,069 |
$14,878 |
$11,808 |
$37,996 |
2/28/2026 |
$16,885 |
$14,975 |
$12,001 |
$37,815 |
3/31/2026 |
$16,846 |
$14,541 |
$11,789 |
$35,935 |
4/30/2026 |
$17,051 |
$15,192 |
$11,803 |
$39,601 |
|
| Average Annual Return [Table Text Block] |
|
Table Summary
AATR |
1 Year |
5 Years |
10 Years |
Real Return Portfolio |
23.49 |
6.82 |
5.48 |
Real Return Blended IndexFootnote Reference* |
14.14 |
4.46 |
4.27 |
Bloomberg U.S. Aggregate Bond Index |
4.06 |
0.18 |
1.67 |
Russell 3000® Index |
31.01 |
11.91 |
14.75 | |
| No Deduction of Taxes [Text Block] |
|
do not reflect taxes that a shareholder may pay on an investment in a fund.
|
| AssetsNet |
|
$ 441,450,293
|
| Holdings Count | Holding |
|
433
|
| Advisory Fees Paid, Amount |
|
$ 1,197,805
|
| InvestmentCompanyPortfolioTurnover |
|
57.00%
|
| Additional Fund Statistics [Text Block] |
|
Table Summary
Consolidated Total net assets |
$441,450,293 |
Consolidated # of portfolio holdings |
433 |
Consolidated Portfolio turnover rate |
57% |
Consolidated Total advisory fees paid |
$1,197,805 | |
| Holdings [Text Block] |
|
PORTFOLIO ALLOCATION (% OF TOTAL INVESTMENT)
Table Summary
Common stocks |
48.3 |
U.S. Treasury securities |
28.7 |
Investment companies |
11.6 |
Corporate bonds and notes |
9.8 |
Yankee corporate bonds and notes |
1.5 |
Loans |
0.1 | |
| Largest Holdings [Text Block] |
|
TOP TEN HOLDINGS (% OF NET ASSETS)
Table Summary
iShares MSCI Brazil ETF |
3.5 |
iShares MSCI South Korea ETF |
3.3 |
TIPS, 2.13%, 1‑15‑2035 |
1.4 |
TIPS, 0.13%, 4‑15‑2027 |
1.2 |
TIPS, 0.13%, 1‑15‑2030 |
1.2 |
TIPS, 1.38%, 7‑15‑2033 |
1.1 |
TIPS, 0.50%, 1‑15‑2028 |
1.1 |
TIPS, 0.13%, 7‑15‑2030 |
1.0 |
TIPS, 1.63%, 10‑15‑2027 |
1.0 |
Alphabet, Inc. Class A |
1.0 | |
| Material Fund Change [Text Block] |
|
|