Shareholder Report
Apr. 30, 2026
USD ($)
Holding
HOLDING
FUND COSTS FOR THE LAST six months ENDED April 30, 2026
(BASED ON A HYPOTHETICAL $10,000 INVESTMENT)
COSTS OF A $10,000 INVESTMENT |
COSTS PAID AS A PERCENTAGE OF A $10,000 INVESTMENT | |
Schwab International Opportunities Fund |
$44 |
0.84% * |
*
Annualized.
Average Annual Total Returns
Fund and Inception Date |
6 Mon th s |
1 Year |
5 Years |
10 Years |
Fund: Schwab International Opportunities Fund 1,2,3 |
9.89% |
28.40% |
3.51% |
7.95% |
MSCI EAFE ® Index (Net) 4 |
9.98% |
24.60% |
8.83% |
8.85% |
All total returns on this page assume dividends and distributions were reinvested. Index figures do not include trading and management costs, which would lower
performance. Indices are unmanaged and cannot be invested in directly. Performance results less than one year are not annualized.
For index definitions, please see www.schwabassetmanagement.com/glossary.
1
Fund expenses may have been partially absorbed by the investment adviser and its affiliates. Without these reductions, the fund’s returns would have been lower.
These
returns do not reflect the deduction of taxes that a shareholder would pay on fund distributions or the redemption of fund shares.
2
The fund commenced operations on October 16, 1996 which became the Schwab International Opportunities Fund Investor Shares. The Investor Shares were consolidated
into Select Shares on February 26, 2019. The performance presented is that of the former Select Shares which commenced operations on April 2, 2004.
3
The fund’s performance relative to the index may be affected by fair-value pricing and timing differences in foreign exchange calculations.
4
The net version of the index reflects reinvested dividends net of withholding taxes but reflects no deductions for expenses or other taxes.
These
returns do not reflect the deduction of taxes that a shareholder would pay on fund distributions or the redemption of fund shares.
To obtain performance information current to the most
recent month end, please visit
www.schwabassetmanagement.com/prospectus
.
Statistics
Net Assets (millions) |
$1,024 |
Number of Holdings (excludes derivatives) |
1,016 |
Portfolio Turnover Rate (not annualized; excludes in-kind transactions) |
35% |
Weighted Average Market Cap (millions) |
$1 7 1,631 |
Price/Earnings Ratio (P/E) |
18.6 |
Price/Book Ratio (P/B) |
2.6 |
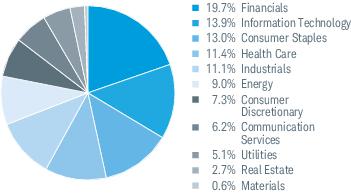
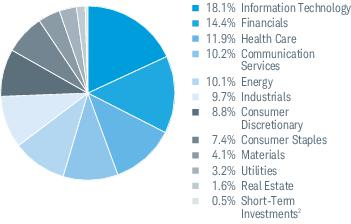
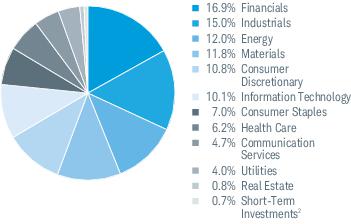
Sector Weightings % of Investments
1
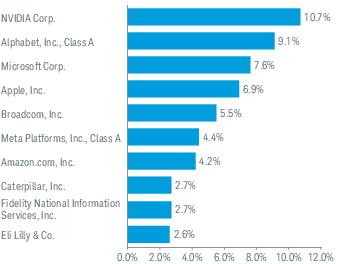
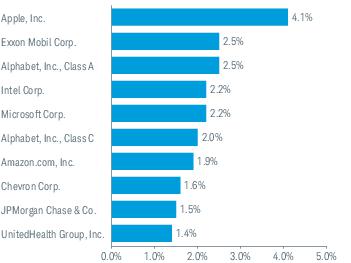
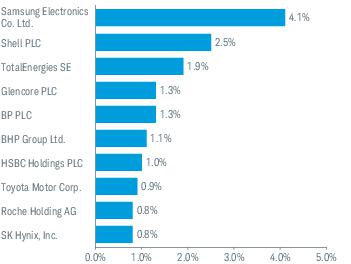
Top Equity Holdings % of Net Assets
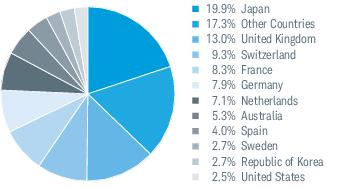
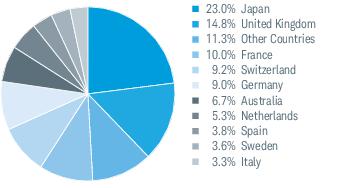
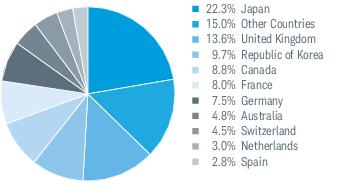
Top Country Weight
ings
% of Investments1
Portfolio holdings may have changed since the report date.
The Sector/Industry classifications in this report use the Global Industry Classification Standard (GICS) which was developed by and is the exclusive property of MSCI Inc.
(MSCI) and Standard & Poor’s (S&P). GICS is a service mark of MSCI and S&P and has been licensed for use by Charles Schwab & Co., Inc.
1
Excludes derivatives.
2
Includes the fund’s position(s) in money market mutual funds registered under the Investment Company Act of 1940, as amended.
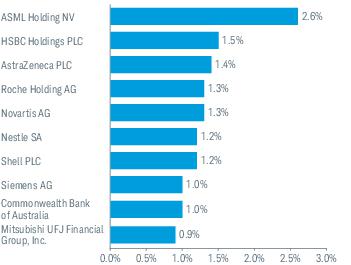
Top Equity Holdings % of Net Assets
Portfolio holdings may have changed since the report date.
FUND COSTS FOR THE LAST six months ENDED April 30, 2026
(BASED ON A HYPOTHETICAL $10,000 INVESTMENT)
COSTS OF A $10,000 INVESTMENT |
COSTS PAID AS A PERCENTAGE OF A $10,000 INVESTMENT | |
Schwab Core Equity Fund |
$36 |
0.72% * |
*
Annualized.
Average Annual Total
Re
turnsFund and Inception Date |
6 Months |
1 Year |
5 Years |
10 Years |
Fund: Schwab Core Equity Fund (07/01/1996) 1 |
3.06% |
23.79% |
11.05% |
12.93% |
S&P 500 ® Index |
6.03% |
31.05% |
13.14% |
15.26% |
All total returns on this page assume dividends and distributions were reinvested. Index figures do not include trading and management costs, which would lower
performance. Indices are unmanaged and cannot be invested in directly. Performance results less than one year are not annualized.
For index definitions, please see www.schwabassetmanagement.com/glossary.
1
Fund expenses may have been partially absorbed by the investment adviser and its affiliates. Without these reductions, the fund’s returns would have been lower.
These
returns do not reflect the deduction of taxes that a shareholder would pay on fund distributions or the redemption of fund shares.
These
returns do not reflect the deduction of taxes that a shareholder would pay on fund distributions or the redemption of fund shares.
To obtain performance information current to the most
recent month end, please visit
www.schwabassetmanagement.com/prospectus
.
Statistics
Net Assets (millions) |
$1,519 |
Number of Holdings |
56 |
Portfolio Turnover Rate (not annualized) |
17% |
Weighted Average Market Cap (millions) |
$1,896,379 |
Price/Earnings Ratio (P/E) |
30.8 |
Price/Book Ratio (P/B) |
7.1 |
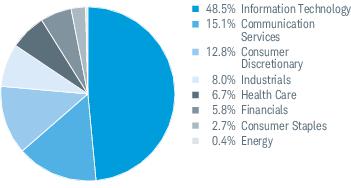
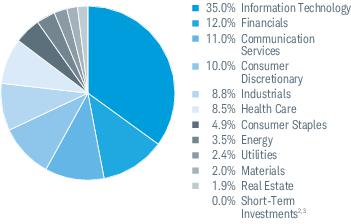
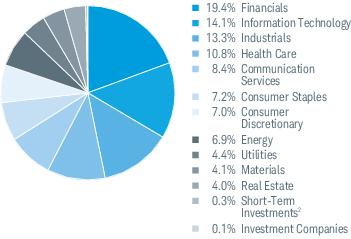
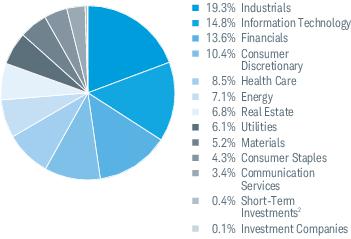
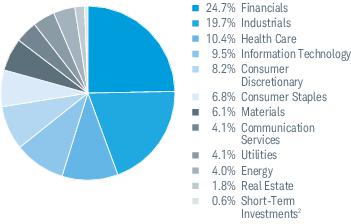
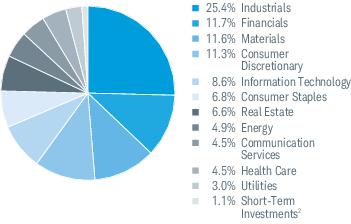
Sector Weightings % of Investments
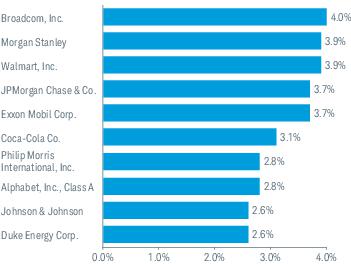
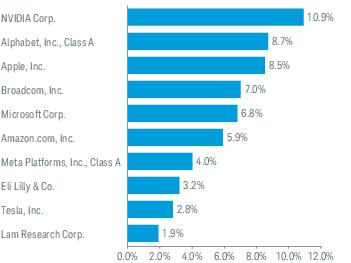
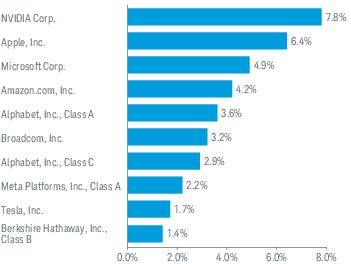
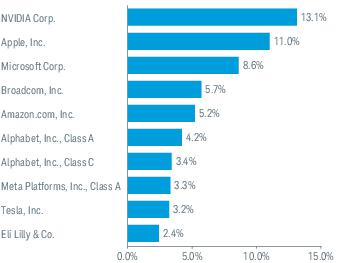
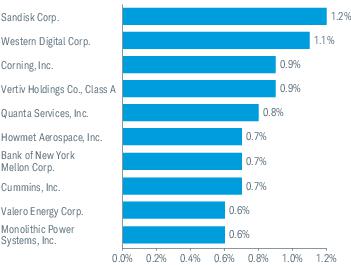
Top Equity Holdings % of Net Assets
Portfolio holdings may have changed since the report date.
The Sector/Industry classifications in this report use the Global Industry Classification Standard (GICS) which was developed by and is the exclusive property of MSCI Inc.
(MSCI) and Standard & Poor’s (S&P). GICS is a service mark of MSCI and S&P and has been licensed for use by Charles Schwab & Co., Inc.
1
Includes the fund’s position(s) in money market mutual funds registered under the Investment Company Act of 1940, as amended.
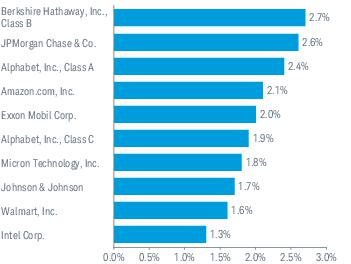
Top Equity Holdings % of Net Assets
Portfolio holdings may have changed since the report date.
FUND COSTS FOR THE LAST six months ENDED April 30,
2026
(BASED ON A HYPOTHETICAL $10,000 INVESTMENT)
COSTS OF A $10,000 INVESTMENT |
COSTS PAID AS A PERCENTAGE OF A $10,000 INVESTMENT | |
Schwab Dividend Equity Fund |
$46 |
0.88% * |
*
Annualized.
Average Annual Total Returns
Fund and Inception Date |
6 Months |
1 Year |
5 Years |
10 Years |
Fund: Schwab Dividend Equity Fund (09/02/2003) 1,2 |
9.44% |
20.43% |
9.68% |
9.47% |
S&P 500 ® Index 3 |
6.03% |
31.05% |
13.14% |
15.26% |
Russell 1000 ® Value Index |
14.13% |
29.25% |
10.29% |
11.22% |
All total returns on this page assume dividends and distributions were reinvested. Index figures do not include trading and management costs, which would lower
performance. Indices are unmanaged and cannot be invested in directly. Performance results less than one year are not annualized.
For index definitions, please see www.schwabassetmanagement.com/glossary.
1
Fund expenses may have been partially absorbed by the investment adviser and its affiliates. Without these reductions, the fund’s returns would have been lower.
These
returns do not reflect the deduction of taxes that a shareholder would pay on fund distributions or the redemption of fund shares.
2
The fund’s performance relative to the index may be affected by fair-value pricing and timing differences in foreign exchange calculations.
3
The S&P 500
®
Index serves as the fund’s regulatory index and provides a broad measure of market performance. The Russell 1000
®
Value Index is the fund’s additional
index and is more representative of the fund’s investment universe than the
regulatory
index
.These
returns do not reflect the deduction of taxes that a shareholder would pay on fund distributions or the redemption of fund shares.
To obtain performance information current to the most
recent month end, please visit
www.schwabassetmanagement.com/prospectus
.
Statistics
Net Assets (millions) |
$630 |
Number of Holdings |
64 |
Portfolio Turnover Rate (not annualized) |
4% |
Weighted Average Market Cap (millions) |
$585,333 |
Price/Earnings Ratio (P/E) |
21.7 |
Price/Book Ratio (P/B) |
3.9 |
30-Day SEC Yield |
1.51% |
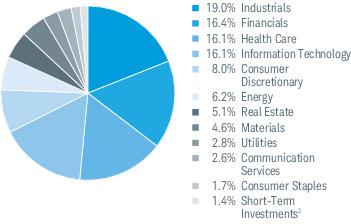
Sector Weightings % of Investments
Top Equity Holdings % of Net Assets
Portfolio holdings may have changed since the report date.
The Sector/Industry classifications in this report use the Global Industry Classification Standard (GICS) which was developed by and is the exclusive property of MSCI Inc.
(MSCI) and Standard & Poor’s (S&P). GICS is a service mark of MSCI and S&P and has been licensed for use by Charles
Sch
wab & Co., Inc.Top Equity Holdings % of Net Assets
Portfolio holdings may have changed since the report date.
FUND COSTS FOR THE LAST six months ENDED April 30, 2026
(
BASED
ON A HYPOTHETICAL $10,000 INVESTMENT)COSTS OF A$10,000 INVESTMENT |
COSTS PAID AS APERCENTAGE OF A $10,000 INVESTMENT | |
Schwab Large-Cap Growth Fund |
$49 |
0.98% * |
*
Annualized.
Average Annual Total Returns
Fund and Inception Date |
6 Months |
1 Year |
5 Years |
10 Years |
Fund: Schwab Large-Cap Growth Fund (10/03/2005) 1 |
0.72% |
33.26% |
14.07% |
16.28% |
S&P 500 ® Index 2 |
6.03% |
31.05% |
13.14% |
15.26% |
Russell 1000 ® Growth Index |
-1.49% |
30.63% |
13.82% |
18.26% |
All total returns on this page assume dividends and distributions were reinvested. Index figures do not include trading and management costs, which would lower
performance. Indices are unmanaged and cannot be invested in directly. Performance results less than one year are not annualized.
For index definitions, please see www.schwabassetmanagement.com/glossary.
1
Fund expenses may have been partially absorbed by the investment adviser and its affiliates. Without these reductions, the fund’s returns would have been lower.
These
returns do not reflect the deduction of taxes that a shareholder would pay on fund distributions or the redemption of fund shares.
2
The S&P 500
®
Index serves as the fund’s regulatory index and provides a broad measure of market performance. The Russell 1000
®
Growth Index is the fund’s additional
index and is more representative of the fund’s investment universe than the regulatory index.
These
returns do not reflect the deduction of taxes that a shareholder would pay on fund distributions or the redemption of fund shares.
To obtain performance information current to the most
recent month end, please visit
www.schwabassetmanagement.com/prospectus
.
Statistics
Net Assets (millions) |
$592 |
Number of Holdings |
55 |
Portfolio Turnover Rate (not annualized) |
7% |
Weighted Average Market Cap (millions) |
$2,038,118 |
Price/Earnings Ratio (P/E) |
36.3 |
Price/Book Ratio (P/B) |
12.4 |
Sector Weightings % of Investments
Top Equity Holdings % of Net Assets
Portfolio holdings may have changed since the report date.
The Sector/Industry classifications in this report use the Global Industry Classification Standard (GICS) which was developed by and is the exclusive property of MSCI Inc.
(MSCI) and Standard & Poor’s (S&P). GICS is a service mark of MSCI and S&P and has been licensed for use by Charles Schwab & Co., Inc.
Top Equity Holdings % of Net Assets
Portfolio holdings may have changed since the report date.
FUND COSTS FOR THE LAST six months ENDED
April
30, 2026 (
BASED
ON
A HYPOTHETICAL $10,000 INVESTMENT)COSTS OF A $10,000 INVESTMENT |
COSTS PAID AS A PERCENTAGE OF A $10,000 INVESTMENT | |
Schwab Small-Cap Equity Fund |
$58 |
1.08% * |
*
Annualized.
Average Annual Total Returns
Fund and Inception Date |
6 Months |
1 Year |
5 Years |
10 Years |
Fund: Schwab Small-Cap Equity Fund (07/01/2003) 1 |
16.80% |
46.81% |
9.69% |
11.14% |
S&P 500 ® Index 2 |
6.03% |
31.05% |
13.14% |
15.26% |
Russell 2000 ® Index |
13.63% |
44.41% |
5.75% |
10.98% |
All total returns on this page assume dividends and distributions were reinvested. Index figures do not include trading and management costs, which would lower
performance. Indices are unmanaged and cannot be invested in directly. Performance results less than one year are not annualized.
For index definitions, please see www.schwabassetmanagement.com/glossary.
1
Fund expenses may have been partially absorbed by the investment adviser and its affiliates. Without these reductions, the fund’s returns would have been lower.
These
returns do not reflect the deduction of taxes that a shareholder would pay on fund distributions or the redemption of fund shares.
2
The S&P 500
®
Index serves as the fund’s regulatory index and provides a broad measure of market performance. The Russell 2000
®
Index is the fund’s additional index and
is more representative of the fund’s investment universe than the regulatory index.
These
returns do not reflect the deduction of taxes that a shareholder would pay on fund distributions or the redemption of fund shares.
To obtain performance information current to the most
recent month end, please visit
www.schwabassetmanagement.com/prospectus
.
Statistics
Net Assets (millions) |
$703 |
Number of Holdings (excludes derivatives) |
347 |
Portfolio Turnover Rate (not annualized) |
46% |
Weighted Average Market Cap (millions) |
$7,506 |
Price/Earnings Ratio (P/E) |
17.8 |
Price/Book Ratio (P/B) |
2.7 |
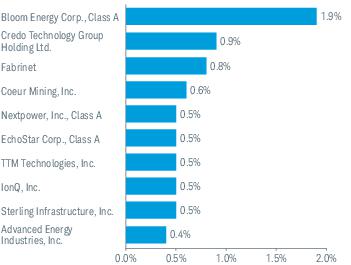
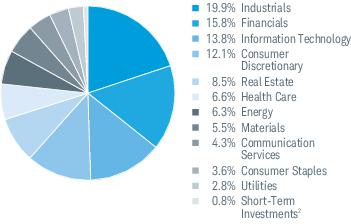
Sector Weightings % of Investments
1
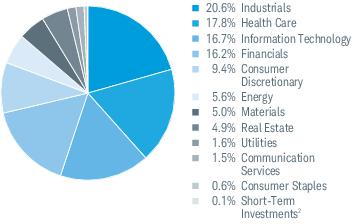
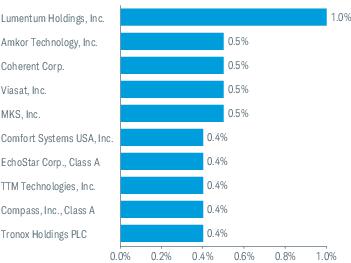
Top Equity Holdings % of Net Assets
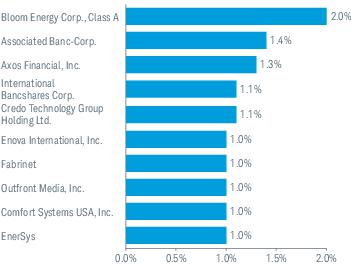
Portfolio holdings may have changed since the report date.
The Sector/Industry classifications in this report use the Global Industry Classification Standard (GICS) which was developed by and is the exclusive property of MSCI Inc.
(MSCI) and Standard & Poor’s (S&P). GICS is a service mark of MSCI and S&P and has been licensed for use by Charles Schwab & Co., Inc.
1
Excludes derivatives.
2
Includes the fund’s position(s) in money market mutual funds registered under the Investment Company Act of 1940, as amended.
Top Equity Holdings % of Net Assets
Portfolio holdings may have changed since the report date.
FUND COSTS FOR THE LAST six months ENDED
April
30, 2026
(
BASED
ON
A HYPOTHETICAL $10,000 INVESTMENT)COSTS OF A $10,000 INVESTMENT |
COSTS PAID AS A PERCENTAGE OF A $10,000 INVESTMENT | |
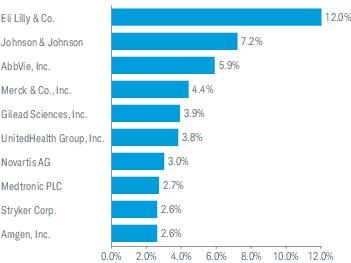
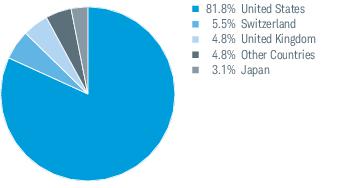
Schwab Health Care Fund |
$40 |
0.80% * |
*
Annualized.
Average Annual Total Returns
Fund and Inception Date |
6 Months |
1 Year |
5 Years |
10 Years |
Fund: Schwab Health Care Fund (07/03/2000 )1,2 |
2.35% |
5.86% |
4.26% |
7.99% |
S&P 500 ® Index 3 |
6.03% |
31.05% |
13.14% |
15.26% |
| Dow Jones Global Health Care Index |
1.95% |
7.24% |
3.30% |
7.91% |
All total returns on this page assume dividends and distributions were reinvested. Index figures do not include trading and management costs, which would lower
performance. Indices are unmanaged and cannot be invested in directly. Performance results less than one year are not annualized.
For index definitions, please see www.schwabassetmanagement.com/glossary.
1
Fund expenses may have been partially absorbed by the investment adviser and its affiliates. Without these reductions, the fund’s returns would have been lower.
These
returns do not reflect the deduction of taxes that a shareholder would pay on fund distributions or the redemption of fund shares.
2
The fund’s performance relative to the index may be affected by fair-value pricing and timing differences in foreign exchange calculations.
3
The S&P 500
®
Index serves as the fund’s regulatory index and provides a broad measure of market performance. The Dow Jones Global Health Care Index is the
fund’s
additional index and is more representative of the fund’s investment universe than the regulatory index.
These
returns do not reflect the deduction of taxes that a shareholder would pay on fund distributions or the redemption of fund shares.
To obtain performance information current to the most
recent month end, please visit
www.schwabassetmanagement.com/prospectus
.
Statistics
Net Assets (millions) |
$614 |
Number of Holdings |
86 |
Portfolio Turnover Rate (not annualized) |
25% |
Weighted Average Market Cap (millions) |
$260,162 |
Price/Earnings Ratio (P/E) |
23.6 |
Price/Book Ratio (P/B) |
4.9 |
Industry Weightings % of Investments
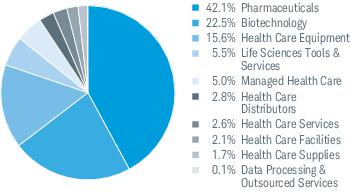
Top Equity Holdings % of Net Assets
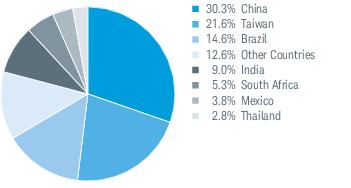
Top Country Weightings % of Investments
Portfolio
holdings may have changed since the report date.The Sector/Industry classifications in this report use the Global Industry Classification Standard (GICS) which was developed by and is the exclusive property of MSCI Inc.
(MSCI) and Standard & Poor’s (S&P). GICS is a service mark of
MSCI
and S&P and has been licensed for use by Charles Schwab & Co., Inc.Top Equity Holdings % of Net Assets
Portfolio
holdings may have changed since the report date.FUND COSTS FOR THE LAST six months ENDED
April
30, 2026 (
BASED
ON
A HYPOTHETICAL
$10,000 INVESTMENT
)COSTS OF A $10,000 INVESTMENT |
COSTS PAID AS A PERCENTAGE OF A $10,000 INVESTMENT | |
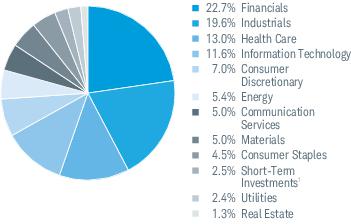
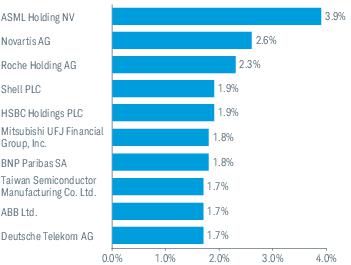
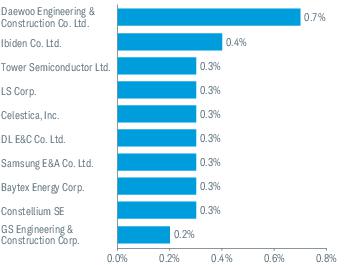
Schwab International Core Equity Fund* |
$45 |
0.86% ** |
*
Expenses were reduced by a contractual fee waiver in effect for so long as the investment adviser serves as adviser to the fund.
**
Annualized.
Average Annual Total Returns
Fund and Inception Date |
6 Months |
1 Year |
5 Years |
10 Years |
Fund: Schwab International Core Equity Fund (05/30/2008) 1,2 |
12.92% |
31.07% |
11.63% |
9.18% |
MSCI EAFE ® Index (Net) 3 |
9.98% |
24.60% |
8.83% |
8.85% |
All total returns on this page assume dividends and distributions were reinvested. Index figures do not include trading and management costs, which would lower
performance. Indices are unmanaged and cannot be invested in directly. Performance results less than one year are not annualized.
For index definitions, please see www.schwabassetmanagement.com/glossary.
1
Fund expenses may have been partially absorbed by the investment adviser and its affiliates. Without these reductions, the fund’s returns would have been lower.
These
returns do not reflect the deduction of taxes that a shareholder would pay on fund distributions or the redemption of fund shares.
2
The fund’s performance relative to the index may be affected by fair-value pricing and timing differences in foreign exchange calculations.
3
The net version of the index reflects reinvested dividends net of withholding taxes but reflects no deductions for expenses or other taxes.
These
returns do not reflect the deduction of taxes that a shareholder would pay on fund distributions or the redemption of fund shares.
To obtain performance information current to the most
recent month end, please visit
www.schwabassetmanagement.com/prospectus
.
Statistics
Net Assets (millions) |
$979 |
Number of Holdings |
143 |
Portfolio Turnover Rate (not annualized) |
39% |
Weighted Average Market Cap (millions) |
$165,831 |
Price/Earnings Ratio (P/E) |
14.8 |
Price/Book Ratio (P/B) |
2.2 |
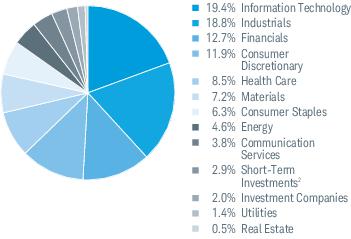
Sector Weightings % of Investments
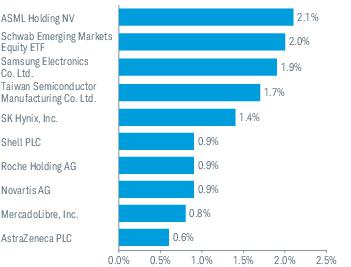
Top Equity Holdings % of Net Assets
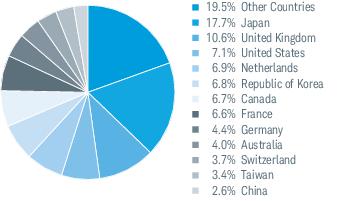
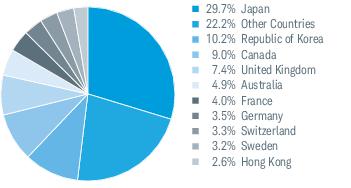
Top Country Weightings % of Investments
Portfolio holdings may have changed since the report date.
The Sector/Industry classifications in this report use the Global Industry Classification Standard (GICS) which was developed by and is the exclusive property of MSCI Inc.
(MSCI) and Standard & Poor’s (S&P). GICS is a service mark of MSCI and S&P and has been licensed for use by Charles Schwab & Co., Inc.
1
Includes the fund’s position(s) in money market mutual funds registered under the Investment Company Act of 1940, as amended.
Top Equity Holdings % of Net Assets
Portfolio holdings may have changed since the report date.
FUND COSTS FOR THE LAST six months ENDED
April
30, 2026 (
BASED
ON A HYPOTHETICAL $10,000 INVESTMENT)COSTS OF A $10,000 INVESTMENT |
COSTS PAID AS A PERCENTAGE OF A $10,000 INVESTMENT | |
Schwab S&P 500 Index Fund |
$1 |
0.02% * |
*
Annualized.
Average Annual Total Returns
Fund and Inception Date |
6 Months |
1 Year |
5 Years |
10 Years |
Fund: Schwab S&P 500 Index Fund (05/19/1997) 1 |
5.97% |
30.99% |
13.10% |
15.22% |
S&P 500 ® Index |
6.03% |
31.05% |
13.14% |
15.26% |
All total returns on this page assume dividends and distributions were reinvested. Index figures do not include trading and management costs, which would lower
performance. Indices are unmanaged and cannot be invested in directly. Performance results less than one year are not annualized.
For index definitions, please see www.schwabassetmanagement.com/glossary.
Index ownership – “Standard & Poor’s
®
,” “S&P
®
,” and “S&P 500
®
” are registered trademarks of Standard & Poor’s Financial Services LLC (S&P), and “Dow Jones
®
” is a
registered trademark of Dow Jones Trademark Holdings LLC (Dow Jones) and have been licensed for use by S&P Dow Jones Indices LLC and its affiliates and sublicensed for
certain purposes by Charles Schwab Investment Management, Inc. The “S&P 500
®
Index” is a product of S&P Dow Jones Indices LLC or its affiliates, and has been licensed for
use by Charles Schwab Investment Management, Inc. The Schwab S&P 500 Index Fund is not sponsored, endorsed, sold or promoted by S&P Dow Jones Indices LLC, Dow
Jones, S&P, or their respective affiliates, and neither S&P Dow Jones Indices LLC, Dow Jones, S&P, nor their respective affiliates make any representation regarding the
advisability of investing in the fund.
1
Performance does not reflect the deduction of taxes that a shareholder would pay on fund distributions or the redemption of fund shares.
To obtain performance information current to the most
recent month end, please visit
www.schwabassetmanagement.com/prospectus
.
Statistics
Net Assets (millions) |
$137,526 |
Number of Holdings (excludes derivatives) |
502 |
Portfolio Turnover Rate (not annualized; excludes in-kind transactions) |
1% |
Weighted Average Market Cap (millions) |
$1,492,656 |
Price/Earnings Ratio (P/E) |
27.3 |
Price/Book Ratio (P/B) |
5.5 |
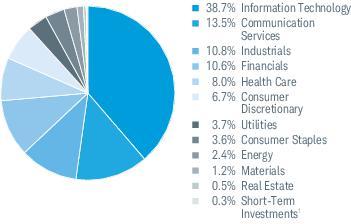
Sector Weightings % of Investments
1
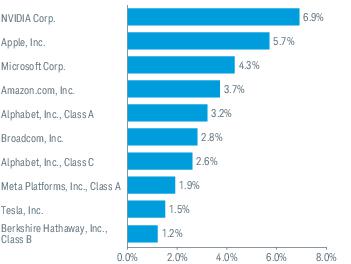
Top Equity Holdings % of Net Assets
Portfolio holdings may have changed since the report date.
The Sector/Industry classifications in this report use the Global Industry Classification Standard (GICS) which was developed by and is the exclusive property of MSCI Inc.
(MSCI) and Standard & Poor’s (S&P). GICS is a service mark of MSCI and S&P and has been licensed for use by Charles Schwab & Co., Inc.
1
Excludes derivatives.
2
Less than 0.05%.
3
Includes the fund’s position(s) in money market mutual funds registered under the Investment Company Act of 1940, as amended.
Top Equity Holdings % of Net Assets
Portfolio holdings may have changed since the report date.
FUND COSTS FOR THE LAST six
months
ENDED April
30, 2026 (
BASED
ON
A HYPOTHETICAL $10,000 INVESTMENT)COSTS OF A $10,000 INVESTMENT |
COSTS PAID AS A PERCENTAGE OF A $10,000 INVESTMENT | |
Schwab Small-Cap Index Fund |
$2 |
0.04% * |
*
Annualized.
Average Annual Total Returns
Fund and Inception Date |
6 Months |
1 Year |
5 Years |
10 Years |
Fund: Schwab Small-Cap Index Fund (05/19/1997) 1 |
13.66% |
44.49% |
5.80% |
11.04% |
S&P 500 ® Index 2 |
6.03% |
31.05% |
13.14% |
15.26% |
Russell 2000 ® Index |
13.63% |
44.41% |
5.75% |
10.98% |
All total returns on this page assume dividends and distributions were reinvested. Index figures do not include trading and management costs, which would lower
performance. Indices are unmanaged and cannot be invested in directly. Performance results less than one year are not annualized.
For index definitions, please see www.schwabassetmanagement.com/glossary.
Index ownership – “Russell 2000
®
” is a registered mark of the Frank Russell Company (Russell) and has been licensed for use by the Schwab Small-Cap Index Fund. The
Schwab Small-Cap Index Fund is not sponsored, endorsed, sold or promoted by Russell and Russell makes no representation regarding the advisability of investing in the
fund.
1
Performance does not reflect the deduction of taxes that a shareholder would pay on fund distributions or the redemption of fund shares.
2
The S&P 500
®
Index serves as the fund’s regulatory index and provides a broad measure of market performance. The fund generally invests in securities that are included in
the Russell 2000
®
Index. The fund does not seek to track the regulatory index.
To obtain performance information current to the most
recent month end, please visit
www.schwabassetmanagement.com/prospectus
.
Statistics
Net Assets (millions) |
$7,221 |
Number of Holdings (excludes derivatives) |
1,924 |
Portfolio Turnover Rate (not annualized; excludes in-kind transactions) |
5% |
Weighted Average Market Cap (millions) |
$6,863 |
Price/Earnings Ratio (P/E) |
19.6 |
Price/Book Ratio (P/B) |
2.3 |
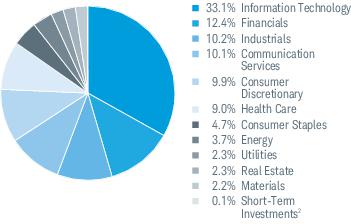
Sector Weightings % of Investments
1
Top Equity Holdings % of Net Assets
Portfolio holdings may have changed since the report date.
The Sector/Industry classifications in this report use the Global Industry Classification Standard (GICS) which was developed by and is the exclusive property of MSCI Inc.
(MSCI) and Standard & Poor’s (S&P). GICS is a service mark of MSCI and S&P and has been licensed for use by Charles Schwab & Co., Inc.
1
Excludes derivatives.
2
Includes the fund’s position(s) in money market mutual funds registered under the Investment Company Act of 1940, as amended.
Top Equity Holdings % of Net Assets
Portfolio holdings may have changed since the report date.
FUND COSTS FOR THE LAST six months ENDED
April
30, 2026 (
BASED
ON
A HYPOTHETICAL
$10,000 INVESTMENT)COSTS OF A $10,000 INVESTMENT |
COSTS PAID AS A PERCENTAGE OF A $10,000 INVESTMENT | |
Schwab Total Stock Market Index Fund |
$2 |
0.03% * |
*
Annualized.
Average Annual Total Returns
Fund and Inception Date |
6 Months |
1 Year |
5 Years |
10 Years |
Fund: Schwab Total Stock Market Index Fund (06/01/1999) 1 |
6.18% |
31.32% |
11.84% |
14.67% |
Dow Jones U.S. Total Stock Market Index SM |
6.19% |
31.37% |
11.86% |
14.71% |
All total returns on this page assume dividends and distributions were reinvested. Index figures do not include trading and management costs, which would lower
performance. Indices are unmanaged and cannot be invested in directly. Performance results less than one year are not annualized.
For index definitions, please see www.schwabassetmanagement.com/glossary.
Index ownership – “Standard & Poor’s
®
” and “S&P
®
” are registered trademarks of Standard & Poor’s Financial Services LLC (S&P), and “Dow Jones
®
” is a registered trademark
of Dow Jones Trademark Holdings LLC (Dow Jones) and have been licensed for use by S&P Dow Jones Indices LLC and its affiliates and sublicensed for certain purposes by
Charles Schwab Investment Management, Inc. The “Dow Jones U.S. Total Stock Market Index
SM
” is a product of S&P Dow Jones Indices LLC or its affiliates, and has been
licensed for use by Charles Schwab Investment Management, Inc. The Schwab Total Stock Market Index Fund is not sponsored, endorsed, sold or promoted by S&P Dow
Jones Indices LLC, Dow Jones, S&P, or their respective affiliates, and neither S&P Dow Jones Indices LLC, Dow Jones, S&P, nor their respective affiliates make any
representation regarding the advisability of investing in the fund.
1
Performance does not reflect the deduction of taxes that a shareholder would pay on fund distributions or the redemption of fund shares.
To obtain performance information current to the most
recent month end, please visit
www.schwabassetmanagement.com/prospectus
.
Statistics
Net Assets (millions) |
$41,279 |
Number of Holdings (excludes derivatives) |
2,958 |
Portfolio Turnover Rate (not annualized; excludes in-kind transactions) |
2% |
Weighted Average Market Cap (millions) |
$1,324,347 |
Price/Earnings Ratio (P/E) |
26.6 |
Price/Book Ratio (P/B) |
5.0 |
Sector Weightings % of Investments
1
Top Equity Holdings % of Net Assets
Portfolio holdings may have changed since the report date.
The Sector/Industry classifications in this report use the Global Industry Classification Standard (GICS) which was developed by and is the exclusive property of MSCI Inc.
(MSCI) and Standard & Poor’s (S&P). GICS is a service mark of MSCI and S&P and has been licensed for use by Charles Schwab & Co., Inc.
1
Excludes derivatives.
2
Includes the fund’s position(s) in money market mutual funds registered under the Investment Company Act of 1940, as amended.
Top Equity Holdings % of Net Assets
Portfolio holdings may have changed since the report date.
FUND COSTS
FOR
THE LAST
six
months ENDED April
30, 2026 (
BASED
ON
A
HYPOTHETICAL
$10,000 INVESTMENT)COSTS OF A $10,000 INVESTMENT |
COSTS PAID AS A PERCENTAGE OF A $10,000 INVESTMENT | |
Schwab U.S. Large-Cap Growth Index Fund |
$2 |
0.035% * |
*
Annualized.
Average Annual Returns
Fund and Inception Date |
6 Months |
1 Year |
5 Years |
Since Inception |
Fund: Schwab U.S. Large-Cap Growth Index Fund (12/20/2017) 1 |
-1.49% |
30.55% |
13.78% |
17.29% |
S&P 500 ® Index 2 |
6.03% |
31.05% |
13.14% |
14.40% |
Russell 1000 ® Growth Index |
-1.49% |
30.63% |
13.82% |
17.34% |
All total returns on this page assume dividends and distributions were reinvested. Index figures do not include trading and management costs, which would lower
performance. Indices are unmanaged and cannot be invested in directly. Performance results less than one year are not annualized.
For index definitions, please see www.schwabassetmanagement.com/glossary.
Index ownership – The Russell 1000
®
Growth Index is a registered mark of the Frank Russell Company (Russell) and has been licensed for use by the Schwab U.S. Large-Cap
Growth Index Fund. The Schwab U.S. Large-Cap Growth Index Fund is not sponsored, endorsed, sold or promoted by Russell and Russell makes no representation regarding
the advisability of investing in the fund.
1
Performance does not reflect the deduction of taxes that a shareholder would pay on fund distributions or the redemption of fund shares.
2
The S&P 500
®
Index serves as the fund’s regulatory index and provides a broad measure of market performance. The fund generally invests in securities that are included in
the Russell 1000
®
Growth Index. The fund does not seek to track the regulatory index.
To obtain performance information current to the most
recent month end, please visit
www.schwabassetmanagement.com/prospectus
.
Statistics
Net Assets (millions) |
$4,738 |
Number of Holdings (excludes derivatives) |
386 |
Portfolio Turnover Rate (not annualized; excludes in-kind transactions) |
3% |
Weighted Average Market Cap (millions) |
$2,168,564 |
Price/Earnings Ratio (P/E) |
34.2 |
Price/Book Ratio (P/B) |
13.1 |
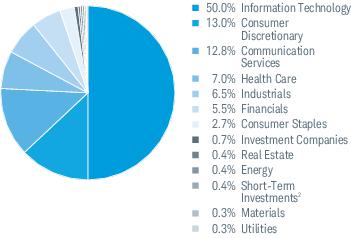
Sector Weightings % of Investments
1
Top Equity Holdings % of Net Assets
Portfolio holdings may have changed since the report date.
The Sector/Industry classifications in this report use the Global Industry Classification Standard (GICS) which was developed by and is the exclusive property of MSCI Inc.
(MSCI) and Standard & Poor’s (S&P). GICS is a service mark of MSCI and S&P and has been licensed for use by Charles Schwab & Co., Inc.
1
Excludes derivatives.
2
Includes the fund’s position(s) in money market mutual funds registered under the Investment Company Act of 1940, as amended.
Top Equity Holdings % of Net Assets
Portfolio holdings may have changed since the report date.
FUND COSTS FOR THE LAST six months ENDED
April
30, 2026
(BASED ON A HYPOTHETICAL $10,000 INVESTMENT)
COSTS OF A $10,000 INVESTMENT |
COSTS PAID AS A PERCENTAGE OF A $10,000 INVESTMENT | |
Schwab U.S. Large-Cap Value Index Fund |
$2 |
0.035% * |
*
Annualized.
Average Annual Returns
Fund and Inception Date |
6 Months |
1 Year |
5 Years |
Since Inception |
Fund: Schwab U.S. Large-Cap Value Index Fund (12/20/2017) 1 |
14.10% |
29.23% |
10.26% |
10.18% |
S&P 500 ® Index 2 |
6.03% |
31.05% |
13.14% |
14.40% |
Russell 1000 ® Value Index |
14.13% |
29.25% |
10.29% |
10.24% |
All total returns on this page assume dividends and distributions were reinvested. Index figures do not include trading and management costs, which would lower
performance. Indices are unmanaged and cannot be invested in directly. Performance results less than one year are not annualized.
For index definitions, please see www.schwabassetmanagement.com/glossary.
Index ownership – The Russell 1000
®
Value Index is a registered mark of the Frank Russell Company (Russell) and has been licensed for use by the Schwab U.S. Large-Cap
Value Index Fund. The Schwab U.S. Large-Cap Value Index Fund is not sponsored, endorsed, sold or promoted by Russell and Russell makes no representation regarding the
advisability of investing in the fund.
1
Performance does not reflect the deduction of taxes that a shareholder would pay on fund distributions or the redemption of fund shares.
2
The S&P 500
®
Index serves as the fund’s regulatory index and provides a broad measure of market performance. The fund generally invests in securities that are included in
the Russell 1000
®
Value Index. The fund does not seek to track the regulatory index.
To obtain performance information current to the most
recent month end, please visit
www.schwabassetmanagement.com/prospectus
.
Statistics
Net Assets (millions) |
$1,072 |
Number of Holdings (excludes derivatives) |
854 |
Portfolio Turnover Rate (not annualized) |
3% |
Weighted Average Market Cap (millions) |
$481,293 |
Price/Earnings Ratio (P/E) |
21.9 |
Price/Book Ratio (P/B) |
3.2 |
Sector Weightings % of Investments
1
Top Equity Holdings % of Net Assets
Portfolio holdings may have changed since the report date.
The Sector/Industry classifications in this report use the Global Industry Classification Standard (GICS) which was developed by and is the exclusive property of MSCI Inc.
(MSCI) and Standard & Poor’s (S&P). GICS is a service mark of MSCI and S&P and has been licensed for use by Charles Schwab & Co., Inc.
1
Excludes derivatives.
2
Includes the fund’s position(s) in money market mutual funds registered under the Investment Company Act of 1940, as amended.
Top Equity Holdings % of Net Assets
Portfolio holdings may have changed since the report date.
FUND COSTS FOR THE LAST six months ENDED April 30, 2026
(
BASED
ON A HYPOTHETICAL $10,000 INVESTMENT)COSTS OF A $10,000 INVESTMENT |
COSTS PAID AS A PERCENTAGE OF A $10,000 INVESTMENT | |
Schwab U.S. Mid-Cap Index Fund |
$2 |
0.04% * |
*
Annualized.
Average Annual Returns
Fund and Inception Date |
6 Months |
1 Year |
5 Years |
Since Inception |
Fund: Schwab U.S. Mid-Cap Index Fund (12/20/2017) 1 |
9.83% |
25.76% |
7.68% |
10.43% |
S&P 500 ® Index 2 |
6.03% |
31.05% |
13.14% |
14.40% |
| Russell Midcap ® Index |
9.80% |
25.78% |
7.72% |
10.47% |
All total returns on this page assume dividends and distributions were reinvested. Index figures do not include trading and management costs, which would lower
performance. Indices are unmanaged and cannot be invested in directly. Performance results less than one year are not annualized.
For index definitions, please see www.schwabassetmanagement.com/glossary.
Index ownership – The Russell Midcap
®
Index is a registered mark of the Frank Russell Company (Russell) and has been licensed for use by the Schwab U.S. Mid-Cap Index
Fund. The Schwab U.S. Mid-Cap Index Fund is not sponsored, endorsed, sold or promoted by Russell and Russell makes no representation regarding the advisability of
investing in the fund.
1
Performance does not reflect the deduction of taxes that a shareholder would pay on fund distributions or the redemption of fund shares.
2
The S&P 500
®
Index serves as the fund’s regulatory index and provides a broad measure of market performance. The fund generally invests in securities that are included in
the Russell Midcap
®
Index. The fund does not seek to track the regulatory index.
To obtain performance information current to the most
recent month end, please visit
www.schwabassetmanagement.com/prospectus
.
Statistics
Net Assets (millions) |
$2,592 |
Number of Holdings (excludes derivatives) |
792 |
Portfolio Turnover Rate (not annualized) |
1% |
Weighted Average Market Cap (millions) |
$37,682 |
Price/Earnings Ratio (P/E) |
22.5 |
Price/Book Ratio (P/B) |
3.3 |
Sector Weightings % of Investments
1
Top Equity Holdings % of Net Assets
Portfolio holdings may have changed since the report date.
The Sector/Industry classifications in this report use the Global Industry Classification Standard (GICS) which was developed by and is the exclusive property of MSCI Inc.
(MSCI) and Standard & Poor’s (S&P). GICS is a service mark of MSCI and S&P and has been licensed for use by Charles Schwab & Co., Inc.
1
Excludes derivatives.
2
Includes the fund’s position(s) in money market mutual funds registered under the Investment Company Act of 1940, as amended.
Top Equity Holdings % of Net Assets
Portfolio holdings may have changed since the report date.
FUND COSTS FOR THE LAST six months ENDED April 30, 2026
(
BASED
ON A HYPOTHETICAL $10,000 INVESTMENT)COSTS OF A $10,000 INVESTMENT |
COSTS PAID AS A PERCENTAGE OF A $10,000 INVESTMENT | |
Schwab International Index Fund |
$3 |
0.06% * |
*
Annualized.
Average Annual Total Returns
Fund and Inception Date |
6 Months |
1 Year |
5 Years |
10 Years |
Fund: Schwab International Index Fund (05/19/1997) 1,2 |
10.56% |
25.18% |
9.06% |
9.09% |
MSCI EAFE ® Index (Net) 3 |
9.98% |
24.60% |
8.83% |
8.85% |
All total returns on this page assume dividends and distributions were reinvested. Index figures do not include trading and management costs, which would lower
performance. Indices are unmanaged and cannot be invested in directly. Performance results less than one year are not annualized.
For index definitions, please see www.schwabassetmanagement.com/glossary.
Index ownership – “MSCI EAFE
®
” is a registered mark of MSCI and has been licensed for use by the Schwab International Index Fund. The Schwab International Index Fund is
not sponsored, endorsed, sold or promoted by MSCI and MSCI bears no liability with respect to the fund. The Statement of Additional Information contains a more detailed
description of the limited relationship MSCI has with the fund.
1
Performance does not reflect the deduction of taxes that a shareholder would pay on fund distributions or the redemption of fund shares.
2
The fund’s performance relative to the index may be affected by fair-value pricing and timing differences in foreign exchange calculations.
3
The net version of the index reflects reinvested dividends net of withholding taxes but reflects no deductions for expenses or other taxes.
To obtain performance information current to the most
recent month end, please visit
www.schwabassetmanagement.com/prospectus
.
Statistics
Net Assets (millions) |
$14,035 |
Number of Holdings (excludes derivatives) |
693 |
Portfolio Turnover Rate (not annualized) |
3% |
Weighted Average Market Cap (millions) |
$112,885 |
Price/Earnings Ratio (P/E) |
18.0 |
Price/Book Ratio (P/B) |
2.2 |
Sector Weightings % of Investments
1
Top Equity Holdings % of Net Assets
Top Country Weightings % of Investments
1
Portfolio holdings may have changed since the report date.
The Sector/Industry classifications in this report use the Global Industry Classification Standard (GICS) which was developed by and is the exclusive property of MSCI Inc.
(MSCI) and Standard & Poor’s (S&P). GICS is a service mark of MSCI and S&P and has been licensed for use by Charles Schwab & Co., Inc.
1
Excludes derivatives.
2
Includes the fund’s position(s) in money market mutual funds registered under the Investment Company Act of 1940, as amended.
Top Equity Holdings % of Net Assets
Portfolio holdings may have changed since the report date.
FUND COSTS FOR THE LAST six months
ENDED
April 30, 2026
(BASED ON A HYPOTHETICAL $10,000 INVESTMENT)
COSTS OF A $10,000 INVESTMENT |
COSTS PAID AS A PERCENTAGE OF A $10,000 INVESTMENT | |
Schwab Fundamental U.S. Large Company Index Fund |
$13 |
0.25% * |
*
Annualized.
Average Annual Total Returns
Fund and Inception Date |
6 Months |
1 Year |
5 Years |
10 Years |
Fund: Schwab Fundamental U.S. Large Company Index Fund (04/02/2007) 1 |
14.14% |
34.01% |
13.08% |
14.03% |
Russell 1000 ® Index 2 |
5.77% |
30.42% |
12.32% |
15.01% |
RAFI Fundamental High Liquidity US Large Index 3 |
14.33% |
34.31% |
N/A |
N/A |
Fundamental US Large Spliced Index |
14.33% |
34.31% |
13.35% |
14.30% |
All total returns on this page assume dividends and distributions were reinvested. Index figures do not include trading and management costs, which would lower
performance. Indices are unmanaged and cannot be invested in directly. Performance results less than one year are not annualized.
For index definitions, please see www.schwabassetmanagement.com/glossary.
Index ownership – The RAFI Fundamental High Liquidity US Large Index (the Index) is a service mark of RAFI Indices, LLC or its affiliates (collectively, RAFI) and has been
licensed for use by Charles Schwab Investment Management, Inc. The intellectual and other property rights to the Index are owned by or licensed to RAFI. The Schwab
Fundamental U.S. Large Company Index Fund is not sponsored, endorsed, sold or promoted by RAFI, its agents or service providers (collectively, the RAFI Parties). The RAFI
Parties: (i) make no representation or warranty as to the results to be obtained from the use of the Index or otherwise; and (ii) shall not be liable (whether in negligence or
otherwise) to any person for any error in the Index. For full disclaimer, please see the fund’s statement of additional information.
1
Performance does not reflect the deduction of taxes that a shareholder would pay on fund distributions or the redemption of fund shares.
2
The Russell 1000
®
Index serves as the fund’s regulatory index and provides a broad measure of market performance. The fund generally invests in securities that are
included in the RAFI Fundamental High Liquidity US Large Index. The fund does not seek to track the regulatory index.
3
The inception date of the RAFI Fundamental High Liquidity US Large Index is January 31, 2024. The fund began tracking the index after the close of business on June 21,
2024.
To obtain performance information current to the most
recent month end, please visit
www.schwabassetmanagement.com/prospectus
.
Statistics
Net Assets (millions) |
$12,228 |
Number of Holdings (excludes derivatives) |
738 |
Portfolio Turnover Rate (not annualized; excludes in-kind transactions) |
5% |
Weighted Average Market Cap (millions) |
$726,563 |
Price/Earnings Ratio (P/E) |
21.0 |
Price/Book Ratio (P/B) |
3.0 |
Sector Weightings % of Investments
1
Top Equity Holdings % of Net Assets
Portfolio holdings may have changed since the report date.
The Sector/Industry classifications in this report use the Global Industry Classification Standard (GICS) which was developed by and is the exclusive property of MSCI Inc.
(MSCI) and Standard & Poor’s (S&P). GICS is a service mark of MSCI and S&P and has been licensed for use by Charles Schwab & Co., Inc.
1
Excludes derivatives.
2
Includes the fund’s position(s) in money market mutual funds registered under the Investment Company Act of 1940, as amended.
Top Equity Holdings % of Net Assets
Portfolio holdings may have changed since the report date.
FUND COSTS FOR THE LAST six months ENDED
April
30, 2026 (BASED ON A HYPOTHETICAL $10,000 INVESTMENT)
COSTS OF A $10,000 INVESTMENT |
COSTS PAID AS A PERCENTAGE OF A $10,000 INVESTMENT | |
Schwab Fundamental U.S. Small Company Index Fund |
$13 |
0.25% * |
*
Annualized.
Average Annual Total Returns
Fund and Inception Date |
6 Months |
1 Year |
5 Years |
10 Years |
Fund: Schwab Fundamental U.S. Small Company Index Fund (04/02/2007) 1 |
16.89% |
37.30% |
8.01% |
10.91% |
S&P 500 ® Index 2 |
6.03% |
31.05% |
13.14% |
15.26% |
RAFI Fundamental High Liquidity US Small Index 3 |
17.05% |
37.61% |
N/A |
N/A |
| Fundamental US Small Spliced Index |
17.05% |
37.61% |
8.21% |
11.10% |
| Russell 2000 ® Index |
13.63% |
44.41% |
5.75% |
10.98% |
All total returns on this page assume dividends and distributions were reinvested. Index figures do not include trading and management costs, which would lower
performance. Indices are unmanaged and cannot be invested in directly. Performance results less than one year are not annualized.
For index definitions, please see www.schwabassetmanagement.com/glossary.
Index ownership – The RAFI Fundamental High Liquidity US Small Index (the Index) is a service mark of RAFI Indices, LLC or its affiliates (collectively, RAFI) and has been
licensed for use by Charles Schwab Investment Management, Inc. The intellectual and other property rights to the Index are owned by or licensed to RAFI. The Schwab
Fundamental U.S. Small Company Index Fund is not sponsored, endorsed, sold or promoted by RAFI, its agents or service providers (collectively, the RAFI Parties). The RAFI
Parties: (i) make no representation or warranty as to the results to be obtained from the use of the Index or otherwise; and (ii) shall not be liable (whether in negligence or
otherwise) to any person for any error in the Index. For full disclaimer, please see the fund’s statement of additional information.
1
Performance does not reflect the deduction of taxes that a shareholder would pay on fund distributions or the redemption of fund shares.
2
The S&P 500
®
Index serves as the fund’s regulatory index and provides a broad measure of market performance. The fund generally invests in securities that are included in
the RAFI Fundamental High Liquidity US Small Index. The fund does not seek to track the regulatory index.
3
The inception date of the RAFI Fundamental High Liquidity US Small Index is January 31, 2024. The fund began tracking the index after the close of business on June 21,
2024.
To obtain performance information current to the most
recent month end, please visit
www.schwabassetmanagement.com/prospectus
.
Statistics
Net Assets (millions) |
$2,353 |
Number of Holdings (excludes derivatives) |
938 |
Portfolio Turnover Rate (not annualized; excludes in-kind transactions) |
13% |
Weighted Average Market Cap (millions) |
$9,229 |
Price/Earnings Ratio (P/E) |
19.3 |
Price/Book Ratio (P/B) |
1.9 |
Sector Weightings % of Investments
1
Top Equity Holdings % of Net Assets
Portfolio holdings may have changed since the report date.
The Sector/Industry classifications in this report use the Global Industry Classification Standard (GICS) which was developed by and is the exclusive property of MSCI Inc.
(MSCI) and Standard & Poor’s (S&P). GICS is a service mark of MSCI and S&P and has been licensed for use by Charles Schwab & Co., Inc.
1
Excludes derivatives.
2
Includes the fund’s position(s) in money market mutual funds registered under the Investment Company Act of 1940, as amended.
Top Equity Holdings % of Net Assets
Portfolio holdings may have changed since the report date.
FUND COSTS FOR THE LAST six
months
ENDED April
30, 2026 (
BASED
ON A HYPOTHETICAL $10,000 INVESTMENT)COSTS OF A $10,000 INVESTMENT |
COSTS PAID AS A PERCENTAGE OF A $10,000 INVESTMENT | |
Schwab Fundamental International Equity Index Fund |
$14 |
0.25% * |
*
Annualized.
Average Annual Total Returns
Fund and Inception Date |
6 Months |
1 Year |
5 Years |
10 Years |
Fund: Schwab Fundamental International Equity Index Fund (04/02/2007) 1,2 |
21.12% |
43.72% |
13.39% |
11.10% |
MSCI EAFE ® Index (Net) 3,4 |
9.98% |
24.60% |
8.83% |
8.85% |
RAFI Fundamental High Liquidity Developed ex US Large Index (Net) 3,5 |
20.72% |
43.34% |
N/A |
N/A |
Fundamental Developed ex US Large Spliced Index |
20.72% |
43.34% |
13.44% |
11.08% |
All total returns on this page assume dividends and distributions were reinvested. Index figures do not include trading and management costs, which would lower
performance. Indices are unmanaged and cannot be invested in directly. Performance results less than one year are not annualized.
For index definitions, please see www.schwabassetmanagement.com/glossary.
Index ownership – The RAFI Fundamental High Liquidity Developed ex US Large Index (the Index) is a service mark of RAFI Indices, LLC or its affiliates (collectively, RAFI) and
has been licensed for use by Charles Schwab Investment Management, Inc. The intellectual and other property rights to the Index are owned by or licensed to RAFI. The
Schwab Fundamental International Equity Index Fund is not sponsored, endorsed, sold or promoted by RAFI, its agents or service providers (collectively, the RAFI Parties). The
RAFI Parties: (i) make no representation or warranty as to the results to be obtained from the use of the Index or otherwise; and (ii) shall not be liable (whether in negligence
or otherwise) to any person for any error in the Index. For full disclaimer, please see the fund’s statement of additional information.
1
Performance does not reflect the deduction of taxes that a shareholder would pay on fund distributions or the redemption of fund shares.
2
The fund’s performance relative to the index may be affected by fair-value pricing and timing differences in foreign exchange calculations.
3
The net version of the index reflects reinvested dividends net of withholding taxes but reflects no deductions for expenses or other taxes.
4
The MSCI EAFE
®
Index (Net) serves as the fund’s regulatory index and provides a broad measure of market performance. The fund generally invests in securities that are
included in the RAFI Fundamental High Liquidity Developed ex US Large Index (Net). The
fund
does not seek to track the regulatory index.5
The inception date of the RAFI Fundamental High Liquidity Developed ex US Large Index (
Net
) is January 31, 2024. The fund began tracking the index after the close of business on June 21, 2024.
To obtain performance information current to the most
recent month end, please visit
www.schwabassetmanagement.com/prospectus
.
Statistics
Net Assets (millions) |
$4,870 |
Number of Holdings (excludes derivatives) |
890 |
Portfolio Turnover Rate (not annualized) |
8% |
Weighted Average Market Cap (millions) |
$129,692 |
Price/Earnings Ratio (P/E) |
16.3 |
Price/Book Ratio (P/B) |
1.5 |
Sector Weightings % of Investments
1
Top Equity Holdings % of Net Assets
Top Country Weightings % of Investments
1
Portfolio holdings may have changed since the report date.
The Sector/Industry classifications in this report use the Global Industry Classification Standard (GICS) which was developed by and is the exclusive property of MSCI Inc.
(MSCI) and Standard & Poor’s (S&P). GICS is a service mark of MSCI and S&P and has been
licensed
for use by Charles Schwab & Co., Inc.1
Excludes derivatives.
2
Includes the fund’s position(s) in money market mutual funds registered under the Investment Company Act of 1940, as amended.
Top Equity Holdings % of Net Assets
Portfolio holdings may have changed since the report date.
FUND COSTS FOR THE LAST six months ENDED
April
30, 2026 (
BASED
ON A HYPOTHETICAL $10,000 INVESTMENT)COSTS OF A $10,000 INVESTMENT |
COSTS PAID AS A PERCENTAGE OF A $10,000 INVESTMENT | |
Schwab Fundamental International Small Equity Index Fund |
$21 |
0.39% * |
*
Annualized.
Average Annual Total Returns
Fund and Inception Date |
6 Months |
1 Year |
5 Years |
10 Years |
Fund: Schwab Fundamental International Small Equity Index Fund (01/31/2008) 1,2 |
15.42% |
35.20% |
8.20% |
8.84% |
MSCI EAFE ® Index (Net) 3,4 |
9.98% |
24.60% |
8.83% |
8.85% |
RAFI Fundamental High Liquidity Developed ex US Small Index (Net) 3,5 |
14.99% |
35.07% |
N/A |
N/A |
| Fundamental Developed ex US Small Spliced Index |
14.99% |
35.07% |
8.43% |
8.97% |
S&P Developed ex-U.S. Small Cap Index (Net) 3 |
12.05% |
32.20% |
5.16% |
7.76% |
All total returns on this page assume dividends and distributions were reinvested. Index figures do not include trading and management costs, which would lower
performance. Indices are unmanaged and cannot be invested in directly. Performance results less than one year are not annualized.
For index definitions, please see www.schwabassetmanagement.com/glossary.
Index ownership – The RAFI Fundamental High Liquidity Developed ex US Small Index (the Index) is a service mark of RAFI Indices, LLC or its affiliates (collectively, RAFI) and
has been licensed for use by Charles Schwab Investment Management, Inc. The intellectual and other property rights to the Index are owned by or licensed to RAFI. The
Schwab Fundamental International Small Equity Index Fund is not sponsored, endorsed, sold or promoted by RAFI, its agents or service providers (collectively, the RAFI
Parties). The RAFI Parties: (i) make no representation or warranty as to the results to be obtained from the use of the Index or otherwise; and (ii) shall not be liable (whether in
negligence or otherwise) to any person for any error in the Index. For full disclaimer, please see the fund’s statement of additional information.
1
Performance does not reflect the deduction of taxes that a shareholder would pay on fund distributions or the redemption of fund shares.
2
The fund’s performance relative to the index may be affected by fair-value pricing and timing differences in foreign exchange calculations.
3
The net version of the index reflects reinvested dividends net of withholding taxes but reflects no deductions for expenses or other taxes.
4
The MSCI EAFE
®
Index (Net) serves as the fund’s regulatory index and provides a broad measure of market performance. The fund generally invests in securities that are
included in the RAFI Fundamental High Liquidity Developed ex US Small Index (Net). The fund does not seek to track the regulatory index.
5
The inception date of the RAFI Fundamental High Liquidity Developed ex US Small Index (Net) is January 31, 2024. The fund began tracking the index after the close of
business on June 21, 2024.
To obtain performance information current to the most
recent month end, please visit
www.schwabassetmanagement.com/prospectus
.
Statistics
Net Assets (millions) |
$727 |
Number of Holdings (excludes derivatives) |
1,572 |
Portfolio Turnover Rate (not annualized) |
11% |
Weighted Average Market Cap (millions) |
$6,268 |
Price/Earnings Ratio (P/E) |
15.3 |
Price/Book Ratio (P/B) |
1.4 |
Sector Weightings % of Investments
1
Top Equity Holdings % of Net Assets
Top Country Weightings % of Investments
1
Portfolio holdings may have changed since the report date.
The Sector/Industry classifications in this report use the Global Industry Classification Standard (GICS) which
was
developed by and is the exclusive property of MSCI Inc. (MSCI) and Standard & Poor’s (S&P). GICS is a service mark of MSCI and S&P and has been licensed for use by Charles Schwab & Co., Inc.
1
Excludes derivatives.
2
Includes the fund’s position(s) in money market mutual funds registered under the Investment Company Act of 1940, as amended.
Top Equity Holdings % of Net Assets
Portfolio holdings may have changed since the report date.
FUND COSTS FOR THE LAST six months ENDED
April
30, 2026 (BASED ON A HYPOTHETICAL $10,000 INVESTMENT)
COSTS OF A $10,000 INVESTMENT |
COSTS PAID AS A PERCENTAGE OF A $10,000 INVESTMENT | |
Schwab Fundamental Emerging Markets Equity Index Fund |
$21 |
0.39% * |
*
Annualized.
Average Annual Total Returns
Fund and Inception Date |
6 Months |
1 Year |
5 Years |
10 Years |
Fund: Schwab Fundamental Emerging Markets Equity Index Fund (01/31/2008) 1,2 |
14.04% |
39.68% |
10.26% |
10.28% |
MSCI Emerging Markets Index (Net) 3,4 |
15.13% |
46.68% |
6.05% |
9.23% |
RAFI Fundamental High Liquidity Emerging Markets Index (Net) 3,5 |
13.11% |
38.93% |
N/A |
N/A |
| Fundamental Emerging Markets Spliced Index |
13.11% |
38.93% |
10.40% |
10.77% |
All total returns on this page assume dividends and distributions were reinvested. Index figures do not include trading and management costs, which would lower
performance. Indices are unmanaged and cannot be invested in directly. Performance results less than one year are not annualized.
For index definitions, please see www.schwabassetmanagement.com/glossary.
Index ownership – The RAFI Fundamental High Liquidity Emerging Markets Index (the Index) is a service mark of RAFI Indices, LLC or its affiliates (collectively, RAFI) and has
been licensed for use by Charles Schwab Investment Management, Inc. The intellectual and other property rights to the Index are owned by or licensed to RAFI. The Schwab
Fundamental Emerging Markets Equity Index Fund is not sponsored, endorsed, sold or promoted by RAFI, its agents or service providers (collectively, the RAFI Parties). The
RAFI Parties: (i) make no representation or warranty as to the results to be obtained from the use of the Index or otherwise; and (ii) shall not be liable (whether in negligence
or otherwise) to any person for any error in the Index. For full disclaimer, please see the fund’s statement of additional information.
1
Performance does not reflect the deduction of taxes that a shareholder would pay on fund distributions or the redemption of fund shares.
2
The fund’s performance relative to the index may be affected by fair-value pricing and timing differences in foreign exchange calculations.
3
The net version of the index reflects reinvested dividends net of withholding taxes but reflects no deductions for expenses or other taxes.
4
The MSCI Emerging Markets Index (Net) serves as the fund’s regulatory index and provides a broad measure of market performance. The fund generally invests in securities
that are included in the RAFI Fundamental High Liquidity Emerging Markets Index (Net). The fund does not seek to track the regulatory index.
5
The inception date of the RAFI Fundamental High Liquidity Emerging Markets Index (Net) is January 31, 2024. The fund began tracking the index after the close of business
on June 21, 2024.
To obtain performance information current to the most
recent month end, please visit
www.schwabassetmanagement.com/prospectus
.
Statistics
Net Assets (millions) |
$1,728 |
Number of Holdings (excludes derivatives) |
352 |
Portfolio Turnover Rate (not annualized) |
7% |
Weighted Average Market Cap (millions) |
$199,766 |
Price/Earnings Ratio (P/E) |
11.8 |
Price/Book Ratio (P/B) |
1.4 |
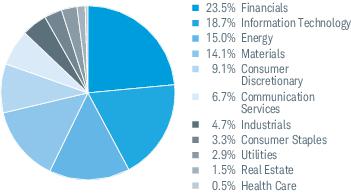
Sector Weightings % of Investments
1
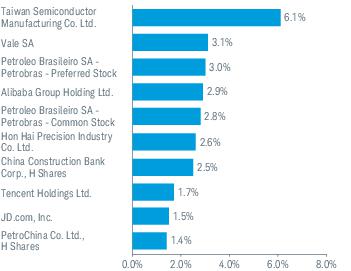
Top Equity Holdings % of Net Assets
Top Country Weightings % of Investments
1
Portfolio holdings may have changed since the report date.
The Sector/Industry classifications in this report use the Global Industry Classification Standard (GICS) which was developed by and is the exclusive property of MSCI Inc.
(MSCI) and Standard & Poor’s (S&P). GICS is a service mark of MSCI and S&P and has been licensed for use by Charles Schwab & Co., Inc.
1
Excludes derivatives.
Top Equity Holdings % of Net Assets
Portfolio holdings may have changed since the report date.
FUND COSTS FOR THE LAST six months ENDED April 30,
2026
(BASED ON A HYPOTHETICAL $10,000 INVES
TM
ENT)COSTS OF A $10,000 INVESTMENT |
COSTS PAID AS A PERCENTAGE OF A $10,000 INVESTMENT | |
Schwab Balanced Fund* |
$0 |
0.00% ** |
*
Expenses were reduced by a contractual fee waiver in effect for so long as the investment adviser serves as adviser to the fund. This agreement to limit the total annual
fund operating expenses is limited to the fund’s direct operating expenses and, therefore, does not apply to acquired fund fees and expenses (AFFE), which are indirect
expenses incurred by the fund through its investments in the underlying funds.
**
Annualized.
Average Annual Total Returns
Fund and Inceptio n Date |
6 Months |
1 Year |
5 Years |
10 Years |
Fund: Schwab Balanced Fund (11/18/1996) 1 |
3.38% |
18.55% |
6.30% |
8.80% |
S&P 500 ® Index |
6.03% |
31.05% |
13.14% |
15.26% |
Bloomberg US Aggregate Bond Index |
0.54% |
4.06% |
0.18% |
1.67% |
| Balanced Blended Index |
5.03% |
20.23% |
7.28% |
9.49% |
All total returns on this page assume dividends and distributions were reinvested. Index figures do not include trading and management costs, which would lower
performance. Indices are unmanaged and cannot be invested in directly. Performance results less than one year are not annualized.
For index definitions, please see www.schwabassetmanagement.com/glossary.
1
Fund expenses may have been partially absorbed by the investment adviser and its affiliates. Without these reductions, the fund’s returns would have been lower.
These
returns do not reflect the deduction of taxes that a shareholder would pay on fund distributions or the redemption of fund shares.
These
returns do not reflect the deduction of taxes that a shareholder would pay on fund distributions or the redemption of fund shares.
To obtain performance information current to the most
recent month end, please visit
www.schwabassetmanagement.com/prospectus
.
Statistics
Net Assets (millions) |
$758 |
Number of Holdings |
7 |
Portfolio Turnover Rate (not annualized) |
4% |
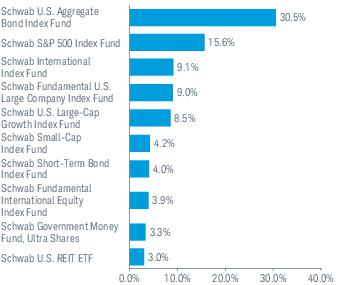
Asset Class Weightings % of Investments
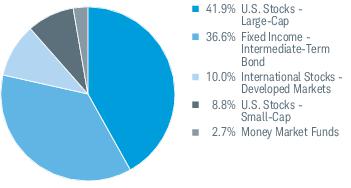
Top Holdings % of Net Assets
1
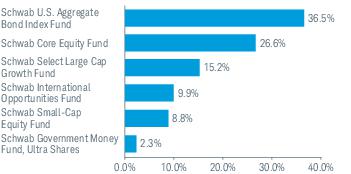
Portfolio holdings may have
changed
since the report date.1
The holdings listed exclude any temporary
liquidity
investments.Top Holdings % of Net Assets
1
Portfolio holdings may have
changed
since the report date.1
The holdings listed exclude any temporary
liquidity
investments.FUND COSTS FO
R T
HE LAST six months ENDED
April
30, 2026
(BASED ON A HYPOTHETICAL $10,000 INVESTMENT)
COSTS OF A $10,000 INVESTMENT |
COSTS PAID AS A PERCENTAGE OF A $10,000 INVESTMENT | |
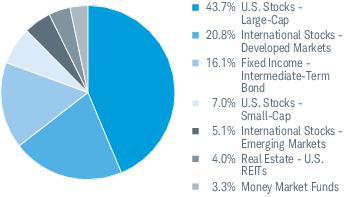
Schwab MarketTrack All Equity Porfolio |
$20 |
0.38% * |
*
Annua
liz
ed.Average Annual Total Returns
Fund and Inception Date |
6 Months |
1 Year |
5 Years |
10 Years |
Fund: Schwab MarketTrack All Equity Portfolio (05/19/1998) 1 |
9.83% |
31.51% |
10.53% |
12.00% |
S&P 500 ® Index |
6.03% |
31.05% |
13.14% |
15.26% |
All Equity Composite Index |
9.86% |
31.87% |
10.99% |
12.49% |
All total returns on this page assume dividends and distributions were reinvested. Index figures do not include trading and management costs, which would lower
performance. Indices are unmanaged and cannot be invested in directly. Performance results less than one year are not annualized.
For index definitions, please see www.schwabassetmanagement.com/glossary.
1
Fund expenses may have been partially absorbed by the investment adviser and its affiliates. Without these reductions, the fund’s returns would have been lower.
These
returns do not reflect the deduction of taxes that a shareholder would pay on fund distributions or the redemption of fund shares.
These
returns do not reflect the deduction of taxes that a shareholder would pay on fund distributions or the redemption of fund shares.
To obtain performance information current to the most
recent month end, please visit
www.schwabassetmanagement.com/prospectus
.
Statistics
Net Assets (millions) |
$1,180 |
Number of Holdings |
11 |
Portfolio Turnover Rate (not annualized) |
7% |
Asset Class Weightings % of Investments
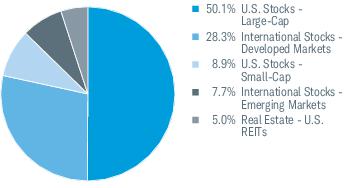
Top Holdings % of Net A
s
sets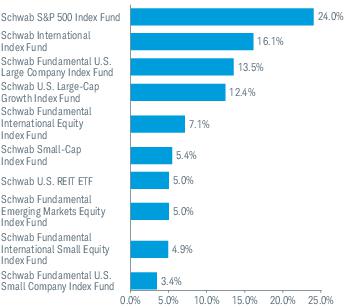
Portfolio holdings may have changed since the report date.
Top Holdings % of Net A
s
setsPortfolio holdings may have changed since the report date.
FUND COSTS FOR
THE
LAST six months ENDED
April
30, 2026 (BASED ON A HYPOTHETICAL $10,000 INVESTMENT)
COSTS OF A $10,000 INVESTMENT |
COSTS PAID AS A PERCENTAGE OF A $10,000 INVESTMENT | |
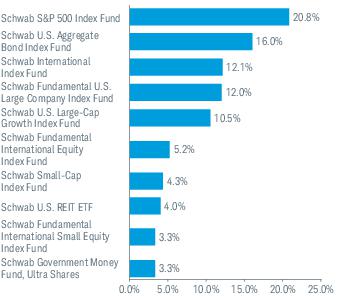
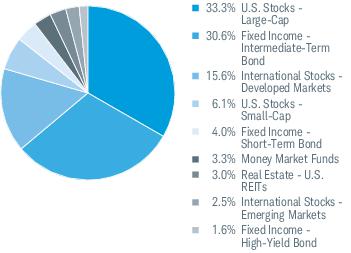
Schwab MarketTrack Growth Porfolio |
$20 |
0.38% * |
*
Annualized.
Average Annual Total Returns
Fund and Inception Date |
6 Months |
1 Year |
5 Years |
10 Years |
Fund: Schwab MarketTrack Growth Portfolio (11/20/1995) 1 |
7.80% |
25.49% |
8.62% |
10.17% |
S&P 500 ® Index |
6.03% |
31.05% |
13.14% |
15.26% |
Bloomberg US Aggregate Bond Index |
0.54% |
4.06% |
0.18% |
1.67% |
Growth Composite Index |
7.93% |
25.94% |
9.12% |
10.66% |
All total returns on this page assume dividends and distributions were reinvested. Index figures do not include trading and management costs, which would lower
performance. Indices are unmanaged and cannot be invested in directly. Performance results less than one year are not annualized.
For index definitions, please see www.schwabassetmanagement.com/glossary.
1
Fund expenses may have been partially absorbed by the investment adviser and its affiliates. Without these reductions, the fund’s returns would have been lower.
These
returns do not reflect the deduction of taxes that a shareholder would pay on fund distributions or the redemption of fund shares.
These
returns do not reflect the deduction of taxes that a shareholder would pay on fund distributions or the redemption of fund shares.
To obtain performance information current to the most
recent month end, please visit
www.schwabassetmanagement.com/prospectus
.
Statistics
Net Assets (millions) |
$1,108 |
Number of Holdings |
13 |
Portfolio Turnover Rate (not annualized) |
7% |
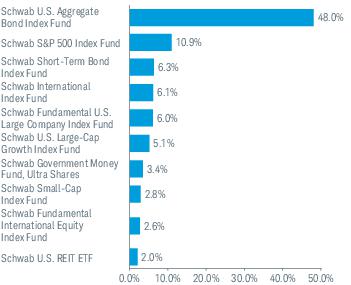
Asset Class Weightings % of Investments
Top Holdings % of Net Assets
Portfolio holdings may have changed
sinc
e the report date.Top Holdings % of Net Assets
Portfolio holdings may have changed
sinc
e the report date.FUND COSTS FOR THE LAST six months ENDED
April
30, 2026
(BASED ON A HYPOTHETICAL $10,000 INVESTMENT)
COSTS OF A $10,000 INVESTMENT |
COSTS PAID AS A PERCENTAGE OF A $10,000 INVESTMENT | |
Schwab MarketTrack Balanced Portfolio |
$20 |
0.39% * |
*
Annualized.
Average Annual Total Returns
Fund and Inception Date |
6 Months |
1 Year |
5 Years |
10 Years |
Fund: Schwab MarketTrack Balanced Portfolio (11/20/1995) 1 |
6.02% |
19.77% |
6.53% |
8.02% |
S&P 500 ® Index |
6.03% |
31.05% |
13.14% |
15.26% |
Bloomberg US Aggregate Bond Index |
0.54% |
4.06% |
0.18% |
1.67% |
Balanced Composite Index |
6.17% |
20.23% |
7.01% |
8.52% |
All total returns on this page assume dividends and distributions were reinvested. Index figures do not include trading and management costs, which would lower
performance. Indices are unmanaged and cannot be invested in directly. Performance results less than one year are not annualized.
For index definitions, please see www.schwabassetmanagement.com/glossary.
1
Fund expenses may have been partially absorbed by the investment adviser and its affiliates. Without these reductions, the fund’s returns would have been lower.
T
hese
returns do not reflect the deduction of taxes that a shareholder would pay on fund distributions or the redemption of fund shares.
T
hese
returns do not reflect the deduction of taxes that a shareholder would pay on fund distributions or the redemption of fund shares.
To obtain performance information current to the most
recent month end, please visit
www.schwabassetmanagement.com/prospectus
.
Statistics
Net Assets (millions) |
$643 |
Number of Holdings |
14 |
Portfolio Turnover Rate (not annualized) |
7% |
Asset Class Weightings % of Investments
Top Holdings % of Net
Assets
Portfolio holdings may have changed since the report date.
Top Holdings % of Net
Assets
Portfolio holdings may have changed since the report date.
FUND COSTS FOR THE LAST six months ENDED April
30
, 2026
(BASED ON A HYPOTHETICAL $10,000 INVESTMENT)
COSTS OF A $10,000 INVESTMENT |
COSTS PAID AS A PERCENTAGE OF A $10,000 INVESTMENT | |
Schwab MarketTrack Conservative Portfolio |
$21 |
0.41% * |
*
Annualized.
Average Annual Total Returns
Fund and Inception Date |
6 Months |
1 Year |
5 Years |
10 Years |
Fund: Schwab MarketTrack Conservative Portfolio (11/20/1995) 1 |
4.18% |
14.09% |
4.29% |
5.74% |
S&P 500 ® Index |
6.03% |
31.05% |
13.14% |
15.26% |
Bloomberg US Aggregate Bond Index |
0.54% |
4.06% |
0.18% |
1.67% |
Conservative Composite Index |
4.40% |
14.67% |
4.80% |
6.28% |
All total returns on this page assume dividends and distributions were reinvested. Index figures do not include trading and management costs, which would lower
performance. Indices are unmanaged and cannot be invested in directly. Performance results less than one year are not annualized.
For index definitions, please see www.schwabassetmanagement.com/glossary.
1
Fund expenses may have been partially absorbed by the investment adviser and its affiliates. Without these reductions, the fund’s returns would have been lower.
These
returns do not reflect the deduction of taxes that a shareholder would pay on fund distributions or the redemption of fund shares.
These
returns do not reflect the deduction of taxes that a shareholder would pay on fund distributions or the redemption of fund shares.
To obtain performance information current to the most
recent month end, please visit
www.schwabassetmanagement.com/prospectus
.
Statistics
Net Assets (millions) |
$208 |
Num be r of Holdings |
14 |
Portfolio Turnover Rate (not annualized) |
7% |
Asset Class
Weightings
% of Investments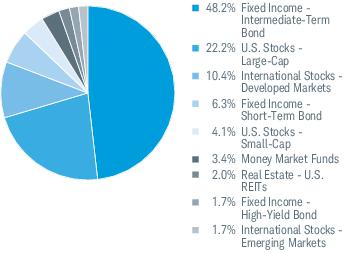
Top
Holdings
% of Net Assets
Portfolio holdings may have changed since the report date.
Top
Holdings
% of Net Assets
Portfolio holdings may have changed since the report date.
FUND COSTS FOR THE LAST six months ENDED
April
30
, 2026 (BASED ON A HYPOTHETICAL $10,000 INVESTMENT)
COSTS OF A $10,000 INVESTMENT |
COSTS PAID AS A PERCENTAGE OF A $10,000 INVESTMENT | |
Schwab Target 2010 Fund* |
$0 |
0.00% ** |
*
Expenses were reduced by a contractual fee waiver in effect for so long as the investment adviser serves as adviser to the fund. This agreement to limit the total annual
fund operating expenses is limited to the fund’s direct operating expenses and, therefore, does not apply to acquired fund fees and expenses (AFFE), which are indirect
expenses incurred by the fund through its investments in the underlying funds.
**
Annualized.
Average Annual Total Returns
Fund and Inception Date |
6 Months |
1 Year |
5 Years |
10 Years |
Fund: Schwab Target 2010 Fund (07/01/2005) 1 |
3.14% |
12.19% |
4.11% |
5.74% |
Dow Jones U.S. Total Stock Market Index SM |
6.19% |
31.37% |
11.86% |
14.71% |
Bloomberg US Aggregate Bond Index |
0.54% |
4.06% |
0.18% |
1.67% |
Target 2010 Composite Index |
3.17% |
12.20% |
4.45% |
5.85% |
All total returns on this page assume dividends and distributions were reinvested. Index figures do not include trading and management costs, which would lower
performance. Indices are unmanaged and cannot be invested in directly. Performance results less than one year are not annualized.
For index definitions, please see www.schwabassetmanagement.com/glossary.
1
Fund expenses may have been partially absorbed by the investment adviser and its affiliates. Without these reductions, the fund’s returns would have been lower.
These
returns do not reflect the deduction of taxes that a shareholder would pay on fund distributions or the redemption of fund shares.
These
returns do not reflect the deduction of taxes that a shareholder would pay on fund distributions or the redemption of fund shares.
To obtain performance information current to the most
recent month end, please visit
www.schwabassetmanagement.com/prospectus
.
Statistics
Net Assets (millions) |
$44 |
Number of Holdings |
21 |
Portfolio Turnover Rate (not annualized) |
12% |
Asset Class Weightings % of Investments

Top Holdings % of Net Assets
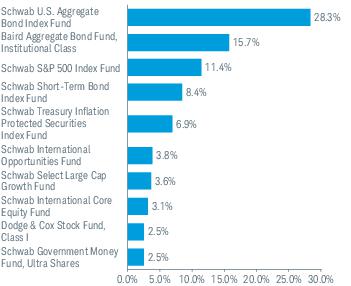
Portfolio holdings may have changed since
the
report date.Top Holdings % of Net Assets
Portfolio holdings may have changed since
the
report date.FUND COSTS FOR THE LAST six months ENDED
April
30, 2026 (BASED ON A HYPOTHETICAL $10,000 INVESTMENT)
COSTS OF A $10,000 INVESTMENT |
COSTS PAID AS A PERCENTAGE OF A $10,000 INVESTMENT | |
Schwab Target 2015 Fund* |
$0 |
0.00% ** |
*
Expenses were reduced by a contractual fee waiver in effect for so long as the investment adviser serves as adviser to the fund. This agreement to limit the total annual
fund operating expenses is limited to the fund’s direct operating expenses and, therefore, does not apply to acquired fund fees and expenses (AFFE), which are indirect
expenses incurred by the fund through its investments in the underlying funds.
**
Annualized.
Average Annual Total Returns
Fund and Inception Date |
6 Months |
1 Year |
5 Years |
10 Years |
Fund: Schwab Target 2015 Fund (03/12/2008) 1 |
3.43% |
13.26% |
4.44% |
6.04% |
Dow Jones U.S. Total Stock Market Index SM |
6.19% |
31.37% |
11.86% |
14.71% |
| Bloomberg US Aggregate Bond Index |
0.54% |
4.06% |
0.18% |
1.67% |
| Target 2015 Composite Index |
3.51% |
13.29% |
4.84% |
6.18% |
All total returns on this page assume dividends and distributions were reinvested. Index figures do not include trading and management costs, which would lower
performance. Indices are unmanaged and cannot be invested in directly. Performance results less than one year are not annualized.
For index definitions, please see www.schwabassetmanagement.com/glossary.
1
Fund expenses may have been partially absorbed by the investment adviser and its affiliates. Without these reductions, the fund’s returns would have been lower.
These
returns do not reflect the deduction of taxes that a shareholder would pay on fund distributions or the redemption of fund shares.
These
returns do not reflect the deduction of taxes that a shareholder would pay on fund distributions or the redemption of fund shares.
To obtain performance information current to the most
recent month end, please visit
www.schwabassetmanagement.com/prospectus
.
Statistics
Net Assets (millions) |
$46 |
Number of Holdings |
21 |
Portfolio Turnover Rate (not annualized) |
6% |
Asset Class Weightings % of Investments
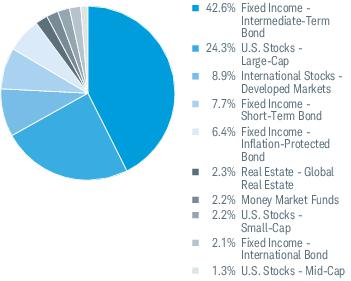
Top Holdings % of Net Assets
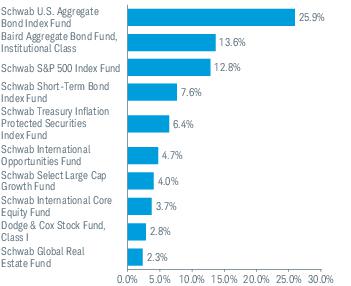
Portfolio holdings may have changed since the report date.
Top Holdings % of Net Assets
Portfolio holdings may have changed since the report date.
FUND COSTS FOR THE LAST six months ENDED
April
30, 2026 (BASED ON A HYPOTHETICAL $10,000 INVESTMENT)
COSTS OF A $10,000 INVESTMENT |
COSTS PAID AS A PERCENTAGE OF A $10,000 INVESTMENT | |
Schwab Target 2020 Fund* |
$0 |
0.00% ** |
*
Expenses were reduced by a contractual fee waiver in effect for so long as the investment adviser serves as adviser to the fund. This agreement to limit the total annual
fund operating expenses is limited to the fund’s direct operating expenses and, therefore, does not apply to acquired fund fees and expenses (AFFE), which are indirect
expenses incurred by the fund through its investments in the underlying funds.
**
Annualized.
Average Annual Total Returns
Fund and Inception Date |
6 Months |
1 Year |
5 Years |
10 Years |
Fund: Schwab Target 2020 Fund (07/01/2005) 1 |
3.70% |
14.01% |
4.69% |
6.54% |
Dow Jones U.S. Total Stock Market Index SM |
6.19% |
31.37% |
11.86% |
14.71% |
| Bloomberg US Aggregate Bond Index |
0.54% |
4.06% |
0.18% |
1.67% |
| Target 2020 Composite Index |
3.74% |
14.02% |
5.10% |
6.68% |
All total returns on this page assume dividends and distributions were reinvested. Index figures do not include trading and management costs, which would lower
performance. Indices are unmanaged and cannot be invested in directly. Performance results less than one year are not annualized.
For index definitions, please see www.schwabassetmanagement.com/glossary.
1
Fund expenses may have been partially absorbed by the investment adviser and its affiliates. Without these reductions, the fund’s returns would have been lower.
These
returns do not reflect the deduction of taxes that a shareholder would pay on fund distributions or the redemption of fund shares.
These
returns do not reflect the deduction of taxes that a shareholder would pay on fund distributions or the redemption of fund shares.
To obtain performance information current to the most
recent month end, please visit
www.schwabassetmanagement.com/prospectus
.
Statistics
Net Assets (millions) |
$288 |
Number of Holdings |
21 |
Portfolio Turnover Rate (not annualized) |
5% |
Asset Class Weightings % of Investments

Top Holdings % of Net Assets
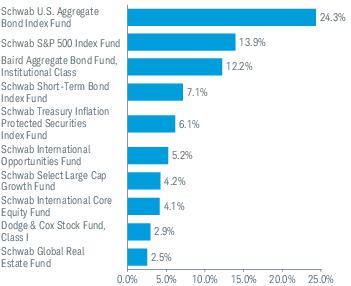
Portfolio holdings may have changed since the report date.
Top Holdings % of Net Assets
Portfolio holdings may have changed since the report date.
FUND COSTS FOR THE LAST six months ENDED
April
30, 2026 (BASED ON A HYPOTHETICAL $10,000 INVESTMENT)
COSTS OF A $10,000 INVESTMENT |
COSTS PAID AS A PERCENTAGE OF A $10,000 INVESTMENT | |
Schwab Target 2025 Fund* |
$0 |
0.00% ** |
*
Expenses were reduced by a contractual fee waiver in effect for so long as the investment adviser serves as adviser to the fund. This agreement to limit the total annual
fund operating expenses is limited to the fund’s direct operating expenses and, therefore, does not apply to acquired fund fees and expenses (AFFE), which are indirect
expenses incurred by the fund through its investments in the underlying funds.
**
Annualized.
Average Annual Total Returns
Fund and Inception Date |
6 Months |
1 Year |
5 Years |
10 Years |
Fund: Schwab Target 2025 Fund (03/12/2008) 1 |
3.84% |
14.58% |
5.04% |
7.37% |
Dow Jones U.S. Total Stock Market Index SM |
6.19% |
31.37% |
11.86% |
14.71% |
| Bloomberg US Aggregate Bond Index |
0.54% |
4.06% |
0.18% |
1.67% |
| Target 2025 Composite Index |
3.90% |
14.51% |
5.56% |
7.59% |
All total returns on this page assume dividends and distributions were reinve
sted. In
dex figures do not include trading and management costs, which would lower performance. Indices are unmanaged and cannot be invested in directly. Performance results less than one year are not annualized.
For index definitions, please see www.schwabassetmanagement.com/glossary.
1
Fund expenses may have been partially absorbed by the investment adviser and its affiliates. Without these reductions, the fund’s returns would have been lower.
These
returns do not reflect the deduction of taxes that a shareholder would pay on fund distributions or the redemption of fund shares.
These
returns do not reflect the deduction of taxes that a shareholder would pay on fund distributions or the redemption of fund shares.
To obtain performance information current to the most
recent month end, please visit
www.schwabassetmanagement.com/prospectus
.
Statistics
Net Assets (millions) |
$398 |
Number of Holdings |
21 |
Portfolio Turnover Rate (not annualized) |
5% |
Asset Class Weightings % of Investments
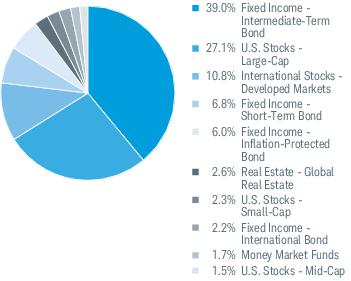
Top Holdings % of Net Assets
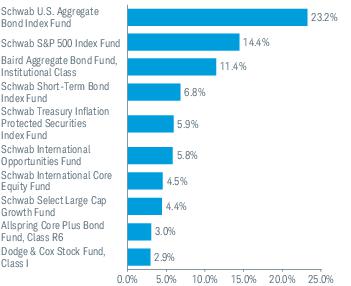
Portfolio holdings may have changed since the report date.
Top Holdings % of Net Assets
Portfolio holdings may have changed since the report date.
FUND COSTS FOR THE LAST six months ENDED
April
30, 2026 (BASED ON A HYPOTHETICAL $10,000 INVESTMENT)
COSTS OF A $10,000 INVESTMENT |
COSTS PAID AS A PERCENTAGE OF A $10,000 INVESTMENT | |
Schwab Target 2030 Fund* |
$0 |
0.00% ** |
*
Expenses were reduced by a contractual fee waiver in effect for so long as the investment adviser serves as adviser to the fund. This agreement to limit the total annual
fund operating expenses is limited to the fund’s direct operating expenses and, therefore, does not apply to acquired fund fees and expenses (AFFE), which are indirect
expenses incurred by the fund through its investments in the underlying funds.
**
Annualized.
Average Annual Total Returns
Fund and Inception Date |
6 Months |
1 Year |
5 Years |
10 Years |
Fund: Schwab Target 2030 Fund (07/01/2005) 1 |
4.90% |
18.42% |
6.19% |
8.48% |
Dow Jones U.S. Total Stock Market Index SM |
6.19% |
31.37% |
11.86% |
14.71% |
| Bloomberg US Aggregate Bond Index |
0.54% |
4.06% |
0.18% |
1.67% |
| Target 2030 Composite Index |
4.97% |
18.24% |
6.82% |
8.75% |
All total returns on this page assume dividends and distributions were reinvested. Index figures do not include tr
ading
and management costs, which would lower performance. Indices are unmanaged and cannot be invested in directly. Performance results less than one year are not annualized.
For index definitions, please see www.schwabassetmanagement.com/glossary.
1
Fund expenses may have been partially absorbed by the investment adviser and its affiliates. Without these reductions, the fund’s returns would have been lower.
These
returns do not reflect the deduction of taxes that a shareholder would pay on fund distributions or the redemption of fund shares.
These
returns do not reflect the deduction of taxes that a shareholder would pay on fund distributions or the redemption of fund shares.
To obtain performance information current to the most
recent month end, please visit
www.schwabassetmanagement.com/prospectus
.
Statistics
Net Assets (millions) |
$1,050 |
Number of Holdings |
22 |
Portfolio Turnover Rate (not annualized) |
8% |
Asset Class Weightings % of Investments
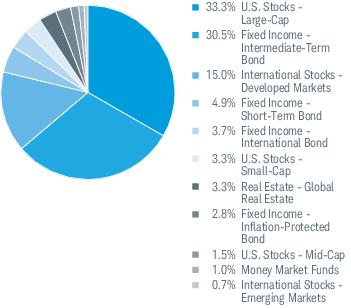
Top Holdings % of Net Assets
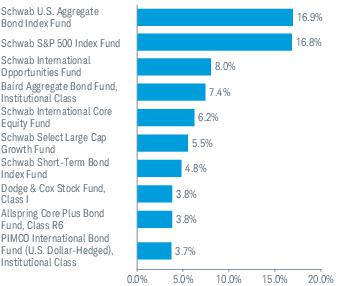
Portfolio holdings may have changed since the report date.
Top Holdings % of Net Assets
Portfolio holdings may have changed since the report date.
FUND COSTS FOR THE LAST six months
ENDED
April 30, 2026
(BASED ON A HYPOTHETICAL $10,000 INVESTMENT)
COSTS OF A $10,000 INVESTMENT |
COSTS PAID AS A PERCENTAGE OF A $10,000 INVESTMENT | |
Schwab Target 2035 Fund* |
$0 |
0.00% ** |
*
Expenses were reduced by a contractual fee waiver in effect for so long as the investment adviser serves as adviser to the fund. This agreement to limit the total annual
fund operating expenses is limited to the fund’s direct operating expenses and, therefore, does not apply to acquired fund fees and expenses (AFFE), which are indirect
expenses incurred by the fund through its investments in the underlying funds.
**
Annualized.
Average Annual Total Returns
Fund and Inception Date |
6 Months |
1 Year |
5 Years |
10 Years |
Fund: Schwab Target 2035 Fund (03/12/2008) 1 |
5.92% |
21.63% |
7.05% |
9.30% |
Dow Jones U.S. Total Stock Market Index SM |
6.19% |
31.37% |
11.86% |
14.71% |
Bloomberg US Aggregate Bond Index |
0.54% |
4.06% |
0.18% |
1.67% |
Target 2035 Composite Index |
5.89% |
21.23% |
7.74% |
9.63% |
All total returns on this page assume dividends and distributions were reinvested. Index figures do not include trading and management costs, which would lower
performance. Indices are unmanaged and cannot be invested in directly. Performance results less than one year are not annualized.
For index definitions, please see www.schwabassetmanagement.com/glossary.
1
Fund expenses may have been partially absorbed by the investment adviser and its affiliates. Without these reductions, the fund’s returns would have been lower.
These
returns do not reflect the deduction of taxes that a shareholder would pay on fund distributions or the redemption of fund shares.
These
returns do not reflect the deduction of taxes that a shareholder would pay on fund distributions or the redemption of fund shares.
To obtain performance information current to the most
recent month end, please visit
www.schwabassetmanagement.com/prospectus
.
Statistics
Net Assets (millions) |
$707 |
Number of Holdings |
22 |
Portfolio Turnover Rate (not annualized) |
5% |
Asset Class Weightings % of Investments

Top Holdings % of Net Assets
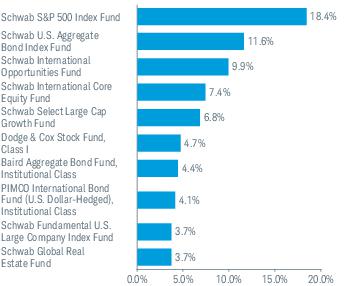
Portfolio holdings may have changed since the report date.
Top Holdings % of Net Assets
Portfolio holdings may have changed since the report date.
FUND COSTS FOR THE LAST six months ENDED
April
30, 2026 (
BASED
ON A HYPOTHETICAL $10,000 INVESTMENT)COSTS OF A $10,000 INVESTMENT |
COSTS PAID AS A PERCENTAGE OF A $10,000 INVESTMENT | |
Schwab Target 2040 Fund* |
$0 |
0.00% ** |
*
Expenses were reduced by a contractual fee waiver in effect for so long as the investment adviser serves as adviser to the fund. This agreement to limit the total annual
fund operating expenses is limited to the fund’s direct operating expenses and, therefore, does not apply to acquired fund fees and expenses (AFFE), which are indirect
expenses incurred by the fund through its investments in the underlying funds.
**
Annualized.
Average Annual Total Returns
Fund and Inception Date |
6 Months |
1 Year |
5 Years |
10 Years |
Fund: Schwab Target 2040 Fund (07/01/2005) 1 |
6.64% |
23.95% |
7.70% |
9.96% |
Dow Jones U.S. Total Stock Market Index SM |
6.19% |
31.37% |
11.86% |
14.71% |
Bloomberg US Aggregate Bond Index |
0.54% |
4.06% |
0.18% |
1.67% |
Target 2040 Composite Index |
6.61% |
23.64% |
8.45% |
10.35% |
All total returns on this page assume dividends and distributions were reinvested. Index figures do not include trading and management costs, which would lower
performance. Indices are unmanaged and cannot be invested in directly. Performance results less than one year are not annualized.
For index definitions, please see www.schwabassetmanagement.com/glossary.
1
Fund expenses may have been partially absorbed by the investment adviser and its affiliates. Without these reductions, the fund’s returns would have been lower.
These
returns do not reflect the deduction of taxes that a shareholder would pay on fund distributions or the redemption of fund shares.
These
returns do not reflect the deduction of taxes that a shareholder would pay on fund distributions or the redemption of fund shares.
To obtain performance information current to the most
recent month end, please visit
www.schwabassetmanagement.com/prospectus
.
Statistics
Net Assets (millions) |
$1,373 |
Number of Holdings |
21 |
Portfolio Turnover Rate (not annualized) |
5% |
Asset Class Weightings % of Investments
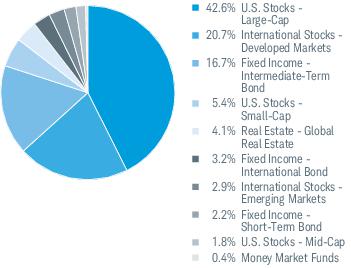
Top Holdings % of Net Assets
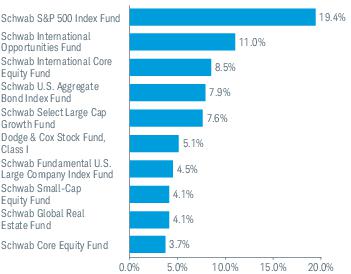
Portfolio holdings may have changed since the report date.
Top Holdings % of Net Assets
Portfolio holdings may have changed since the report date.
FUND COSTS FOR THE LAST six months
ENDED
April 30
, 2026
(BASED ON A HYPOTHETICAL $10,000 INVESTMENT)
COSTS OF A $10,000 INVESTMENT |
COSTS PAID AS A PERCENTAGE OF A $10,000 INVESTMENT | |
Schwab Target 2045 Fund* |
$0 |
0.00% ** |
*
Expenses were reduced by a contractual fee waiver in effect for so long as the investment adviser serves as adviser to the fund. This agreement to limit the total annual
fund operating expenses is limited to the fund’s direct operating expenses and, therefore, does not apply to acquired fund fees and expenses (AFFE), which are indirect
expenses incurred by the fund through its investments in the underlying funds.
**
Annualized.
Average Annual Total Returns
Fund and Inception Date |
6 Months |
1 Year |
5 Years |
10 Years |
Fund: Schwab Target 2045 Fund (01/23/2013) 1 |
7.31% |
26.14% |
8.24% |
10.48% |
Dow Jones U.S. Total Stock Market Index SM |
6.19% |
31.37% |
11.86% |
14.71% |
Bloomberg US Aggregate Bond Index |
0.54% |
4.06% |
0.18% |
1.67% |
Target 2045 Composite Index |
7.24% |
25.73% |
9.03% |
10.92% |
All total returns on this page assume dividends and distributions were reinvested. Index figures do not include trading and management costs, which would lower
performance. Indices are unmanaged and cannot be invested in directly. Performance results less than one year are not annualized.
For index definitions, please see www.schwabassetmanagement.com/glossary.
1
Fund expenses may have been partially absorbed by the investment adviser and its affiliates. Without these reductions, the fund’s returns would have been lower.
These
returns do not reflect the deduction of taxes that a shareholder would pay on fund distributions or the redemption of fund shares.
These
returns do not reflect the deduction of taxes that a shareholder would pay on fund distributions or the redemption of fund shares.
To obtain performance information current to the most
recent month end, please visit
www.schwabassetmanagement.com/prospectus
.
Statistics
Net Assets (millions) |
$396 |
Number of Holdings |
21 |
Portfolio Turnover Rate (not annualized) |
3% |
Asset Class Weightings % of Investments
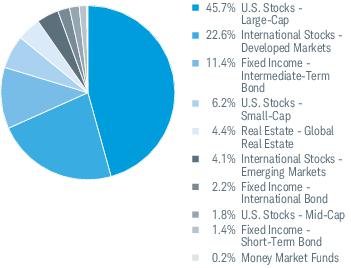
Top Holdings % of Net Assets
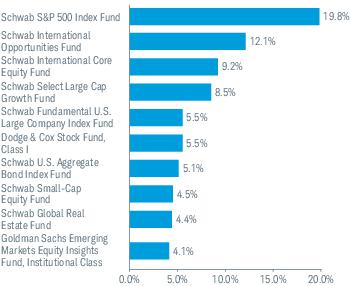
Portfolio holdings may have changed since the report date.
Top Holdings % of Net Assets
Portfolio holdings may have changed since the report date.
FUND COSTS FOR THE LAST six months ENDED
April
30, 2026
(BASED ON A HYPOTHETICAL $10,000 INVESTMENT)
COSTS OF A $10,000 INVESTMENT |
COSTS PAID AS A PERCENTAGE OF A $10,000 INVESTMENT | |
Schwab Target 2050 Fund* |
$0 |
0.00% ** |
*
Expenses were reduced by a contractual fee waiver in effect for so long as the investment adviser serves as adviser to the fund. This agreement to limit the total annual
fund operating expenses is limited to the fund’s direct operating expenses and, therefore, does not apply to acquired fund fees and expenses (AFFE), which are indirect
expenses incurred by the fund through its investments in the underlying funds.
**
Annualized.
Average Annual Total Returns
Fund and Inception Date |
6 Months |
1 Year |
5 Years |
10 Years |
Fund: Schwab Target 2050 Fund (01/23/2013) 1 |
7.89% |
27.83% |
8.63% |
10.83% |
Dow Jones U.S. Total Stock Market Index SM |
6.19% |
31.37% |
11.86% |
14.71% |
Bloomberg US Aggregate Bond Index |
0.54% |
4.06% |
0.18% |
1.67% |
Target 2050 Composite Index |
7.75% |
27.35% |
9.43% |
11.28% |
All total returns on this page assume dividends and distributions were reinvested. Index figures do not include trading and management costs, which would lower
performance. Indices are unmanaged and cannot be invested in directly. Performance results less than one year are not annualized.
For index definitions, please see www.schwabassetmanagement.com/glossary.
1
Fund expenses may have been partially absorbed by the investment adviser and its affiliates. Without these reductions, the fund’s returns would have been lower.
These
returns do not reflect the deduction of taxes that a shareholder would pay on fund distributions or the redemption of fund shares.
These
returns do not reflect the deduction of taxes that a shareholder would pay on fund distributions or the redemption of fund shares.
To obtain performance information current to the most
recent month end, please visit
www.schwabassetmanagement.com/prospectus
.
Statistics
Net Assets (millions) |
$414 |
Number of Holdings |
21 |
Portfolio Turnover Rate (not annualized) |
1% |
Asset Class Weightings % of Investments
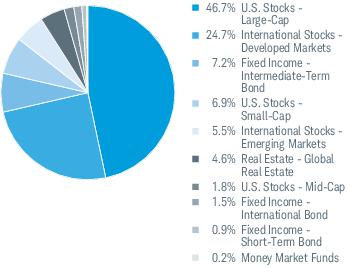
Top Holdings % of Net Assets
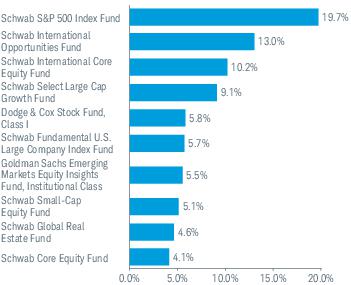
Portfolio holdings may have changed since the report date.
Top Holdings % of Net Assets
Portfolio holdings may have changed since the report date.
FUND COSTS FOR THE LAST six months ENDED
April
30, 2026
(BASED ON A HYPOTHETICAL $10,000 INVESTMENT)
COSTS OF A $10,000 INVESTMENT |
COSTS PAID AS A PERCENTAGE OF A $10,000 INVESTMENT | |
Schwab Target 2055 Fund* |
$0 |
0.00% ** |
*
Expenses were reduced by a contractual fee waiver in effect for so long as the investment adviser serves as adviser to the fund. This agreement to limit the total annual
fund operating expenses is limited to the fund’s direct operating expenses and, therefore, does not apply to acquired fund fees and expenses (AFFE), which are indirect
expenses incurred by the fund through its investments in the underlying funds.
**
Annualized.
Average Annual Total Returns
Fund and Inception Date |
6 Months |
1 Year |
5 Years |
10 Years |
Fund: Schwab Target 2055 Fund (01/23/2013) 1 |
8.25% |
28.80% |
8.79% |
11.03% |
Dow Jones U.S. Total Stock Market Index SM |
6.19% |
31.37% |
11.86% |
14.71% |
Bloomberg US Aggregate Bond Index |
0.54% |
4.06% |
0.18% |
1.67% |
Target 2055 Composite Index |
8.05% |
28.28% |
9.65% |
11.52% |
All total returns on this page assume dividends and distributions were reinvested. Index figures do not include trading and management costs, which would lower
performance. Indices are unmanaged and cannot be invested in directly. Performance results less than one year are not annualized.
For index definitions, please see www.schwabassetmanagement.com/glossary.
1
Fund expenses may have been partially absorbed by the investment adviser and its affiliates. Without these reductions, the fund’s returns would have been lower.
These
returns do not reflect the deduction of taxes that a shareholder would pay on fund distributions or the redemption of fund shares.
These
returns do not reflect the deduction of taxes that a shareholder would pay on fund distributions or the redemption of fund shares.
To obtain performance information current to the most
recent month end, please visit
www.schwabassetmanagement.com/prospectus
.
Statistics
Net Assets (millions) |
$307 |
Number of Holdings |
20 |
Portfolio Turnover Rate (not annualized) |
0% |
Asset Class Weightings % of Investments
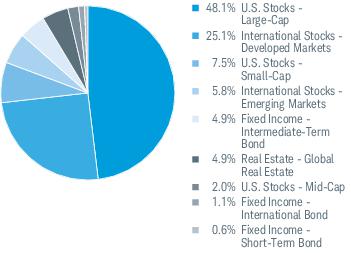
Top Holdings % of Net Assets
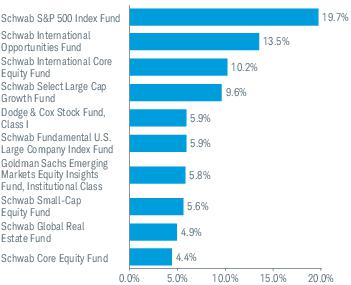
Portfolio holdings may have changed since the report date.
Top Holdings % of Net Assets
Portfolio holdings may have changed since the report date.
FUND COSTS FOR THE LAST six months ENDED
April
30, 2026
(BASED ON A HYPOTHETICAL $10,000 INVESTMENT)
COSTS OF A $10,000 INVESTMENT |
COSTS PAID AS A PERCENTAGE OF A $10,000 INVESTMENT | |
Schwab Target 2060 Fund* |
$0 |
0.00% ** |
*
Expenses were reduced by a contractual fee waiver in effect for so long as the investment adviser serves as adviser to the fund. This agreement to limit the total annual
fund operating expenses is limited to the fund’s direct operating expenses and, therefore, does not apply to acquired fund fees and expenses (AFFE), which are indirect
expenses incurred by the fund through its investments in the underlying funds.
**
Annualized.
Average Annual Total Returns
Fund and Inception Date |
6 Months |
1 Year |
5 Years |
Since Inception |
Fund: Schwab Target 2060 Fund (08/25/2016) 1 |
8.46% |
29.55% |
8.95% |
10.98% |
Dow Jones U.S. Total Stock Market Index SM |
6.19% |
31.37% |
11.86% |
14.50% |
Bloomberg US Aggregate Bond Index |
0.54% |
4.06% |
0.18% |
1.49% |
Target 2060 Composite Index |
8.25% |
28.93% |
9.82% |
11.49% |
All total returns on this page assume dividends and distributions were reinvested. Index figures do not include trading and management costs, which would lower
performance. Indices are unmanaged and cannot be invested in directly. Performance results less than one year are not annualized.
For index definitions, please see www.schwabassetmanagement.com/glossary.
1
Fund expenses may have been partially absorbed by the investment adviser and its affiliates. Without these reductions, the fund’s returns would have been lower.
These
returns do not reflect the deduction of taxes that a shareholder would pay on fund distributions or the redemption of fund shares.
These
returns do not reflect the deduction of taxes that a shareholder would pay on fund distributions or the redemption of fund shares.
To obtain performance information current to the most
recent month end, please visit
www.schwabassetmanagement.com/prospectus
.
Statistics
Net Assets (millions) |
$137 |
Number of Holdings |
19 |
Portfolio Turnover Rate (not annualized) |
1% |
Asset Class Weightings % of Investments
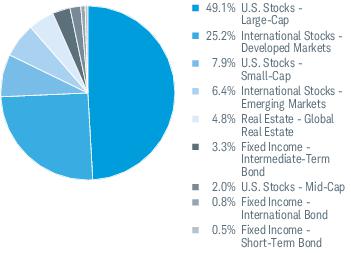
Top Holdings % of Net Assets
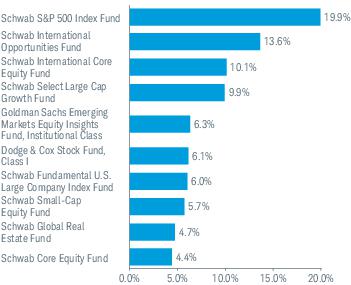
Portfolio holdings may have changed since the report date.
Top Holdings % of Net Assets
Portfolio holdings may have changed since the report date.
FUND COSTS FOR THE LAST six months
ENDED
April
30, 2026 (BASED ON A HYPOTHETICAL $10,000 INVESTMENT)
COSTS OF A $10,000 INVESTMENT |
COSTS PAID AS A PERCENTAGE OF A $10,000 INVESTMENT | |
Schwab Target 2065 Fund* |
$0 |
0.00% ** |
*
Expenses were reduced by a contractual fee waiver in effect for so long as the investment adviser serves as adviser to the fund. This agreement to limit the total annual
fund operating expenses is limited to the fund’s direct operating expenses and, therefore, does not apply to acquired fund fees and expenses (AFFE), which are indirect
expenses incurred by the fund through its investments in the underlying funds.
**
Annualized.
Average Annual Total Returns
Fund and Inception Date |
6 Months |
1 Year |
5 Years |
Since Inception |
Fund: Schwab Target 2065 Fund (02/25/2021) 1 |
8.77% |
30.26% |
9.09% |
10.12% |
Dow Jones U.S. Total Stock Market Index SM |
6.19% |
31.37% |
11.86% |
13.20% |
Bloomberg US Aggregate Bond Index |
0.54% |
4.06% |
0.18% |
0.24% |
Target 2065 Composite Index |
8.45% |
29.57% |
9.96% |
10.79% |
All total returns on this page assume dividends and distributions were reinvested. Index figures do not include trading and management costs, which would lower
performance. Indices are unmanaged and cannot be invested in directly. Performance results less than one year are not annualized.
For index definitions, please see www.schwabassetmanagement.com/glossary.
1
Fund expenses may have been partially absorbed by the investment adviser and its affiliates. Without these reductions, the fund’s returns would have been lower.
These
returns do not reflect the deduction of taxes that a shareholder would pay on fund distributions or the redemption of fund shares.
These
returns do not reflect the deduction of taxes that a shareholder would pay on fund distributions or the redemption of fund shares.
To obtain performance information current to the most
recent month end, please visit
www.schwabassetmanagement.com/prospectus
.
Statistics
Net Assets (millions) |
$50 |
Number of Holdings |
18 |
Portfolio Turnover Rate (not annualized) |
1% |
Asset Class Weightings % of Investments
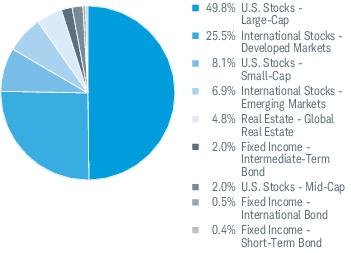
Top Holdings % of Net Assets
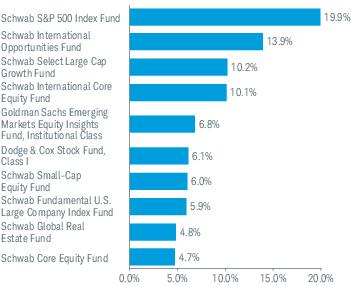
Portfolio holdings may have changed since the report date.
Top Holdings % of Net Assets
Portfolio holdings may have changed since the report date.
FUND COSTS FOR THE LAST six months ENDED
April
30, 2026
(BASED ON A HYPOTHETICAL $10,000 INVESTMENT)
COSTS OF A $10,000 INVESTMENT |
COSTS PAID AS A PERCENTAGE OF A $10,000 INVESTMENT | |
Schwab Target 2070 Fund* |
$0 ** |
0.00% *** |
*
Expenses were reduced by a contractual fee waiver in effect for so long as the investment adviser serves as adviser to the fund. This agreement to limit the total annual
fund operating expenses is limited to the fund’s direct operating expenses and, therefore, does not apply to acquired fund fees and expenses (AFFE), which are indirect
expenses incurred by the fund through its investments in the underlying funds.
**
For the period from 02/26/2026 (commencement of operations) through 04/30/2026.
***
Annualized.
Average Annual Total Returns
Fund and Inception Date |
Since Inception |
Fund: Schwab Target 2070 Fund (02/26/2026) 1 |
1.20% |
Dow Jones U.S. Total Stock Market Index SM |
4.01% |
Bloomberg US Aggregate Bond Index |
-1.28% |
Target 2070 Composite Index |
1.60% |
All total returns on this page assume dividends and distributions were reinvested. Index figures do not include trading and management costs, which
would
lower performance. Indices are unmanaged and cannot be invested in directly. Performance results less than one year are not annualized.
For index definitions, please see www.schwabassetmanagement.com/glossary.
1
Fund expenses may have been partially absorbed by the investment adviser and its affiliates. Without these reductions, the fund’s returns would have been lower.
These
returns do not reflect the deduction of taxes that a shareholder would pay on fund distributions or the redemption of fund shares.
These
returns do not reflect the deduction of taxes that a shareholder would pay on fund distributions or the redemption of fund shares.
To obtain performance information current to the most
recent month end, please visit
www.schwabassetmanagement.com/prospectus
.
Statistics
Net Assets (millions) |
$1 |
Number of Holdings |
18 |
Portfolio Turnover Rate (not annualized) |
9% |
Asset Class
Weightings
% of Investments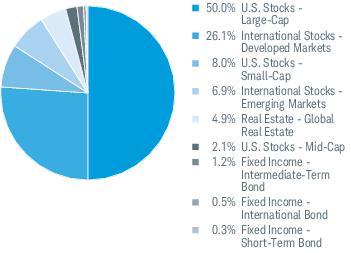
Top Holdings % of Net
Assets
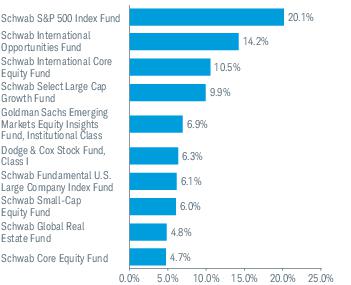
Portfolio holdings may have changed since the report date.
Top Holdings % of Net
Assets
Portfolio holdings may have changed since the report date.
| [1] | Annualized. |
| [2] | Expenses were reduced by a contractual fee waiver in effect for so long as the investment adviser serves as adviser to the fund. |
| [3] | Expenses were reduced by a contractual fee waiver in effect for so long as the investment adviser serves as adviser to the fund. This agreement to limit the total annual fund operating expenses is limited to the fund’s direct operating expenses and, therefore, does not apply to acquired fund fees and expenses (AFFE), which are indirect expenses incurred by the fund through its investments in the underlying funds. |
| [4] | For the period from 02/26/2026 (commencement of operations) through 04/30/2026. |