Shareholder Report
|
|
12 Months Ended |
May 01, 2025 |
Apr. 30, 2026
USD ($)
Holding
|
| Shareholder Report [Line Items] |
|
|
|
| Document Type |
|
|
N-CSR
|
| Amendment Flag |
|
|
false
|
| Registrant Name |
|
|
ALLSPRING FUNDS TRUST
|
| Entity Central Index Key |
|
|
0001081400
|
| Entity Investment Company Type |
|
|
N-1A
|
| Document Period End Date |
|
|
Apr. 30, 2026
|
| Shareholder Report Annual or Semi-Annual |
|
|
Annual Shareholder Report
|
| C000089555 |
|
|
|
| Shareholder Report [Line Items] |
|
|
|
| Fund Name |
|
|
Asset Allocation Fund
|
| Class Name |
|
|
Administrator Class
|
| Trading Symbol |
|
|
EAIFX
|
| Annual or Semi-Annual Statement [Text Block] |
|
|
This annual shareholder report contains important information about Asset Allocation Fund for the period from May 1, 2025 to April 30, 2026.
|
| Additional Information [Text Block] |
|
|
You can find additional information about the Fund at allspringglobal.com. You can also request this information by contacting us at 1-800-222-8222.
|
| Additional Information Phone Number |
|
|
<span style="white-space: nowrap; box-sizing: border-box; color: rgb(0, 0, 0); display: inline; flex-wrap: nowrap; font-size: 12px; font-weight: 400; grid-area: auto; line-height: 18px; margin: 0px; overflow: visible; text-align: left; text-align-last: auto;"> 1-800-222-8222.</span>
|
| Additional Information Website |
|
|
<span style="box-sizing: border-box; color: rgb(0, 0, 0); display: inline; flex-wrap: nowrap; font-size: 12px; font-weight: 400; grid-area: auto; line-height: 18px; margin: 0px; overflow: visible; text-align: left; text-align-last: auto; white-space-collapse: preserve-breaks;">allspringglobal.com</span>
|
| Expenses [Text Block] |
|
|
What were the Fund costs for the past year?The table explains the costs you would have paid within the reporting period based on a hypothetical $10,000 investment.
Table Summary
CLASS NAME |
COSTS OF A $10,000 INVESTMENT |
COSTS PAID AS A % OF A $10,000 INVESTMENT |
Administrator Class |
$75 |
0.68%Footnote Reference1 |
| Footnote |
Description |
Footnote1 |
Amounts reflect net expenses allocated from the affiliated Master Portfolios in which the Fund invests. | The manager has contractually committed to waive fees and/or reimburse certain expenses to the extent necessary to cap the Fund's total annual fund operating expense ratio at a specific amount. Without this cap, the costs shown above may have been higher. Please see the prospectus for the amount and the expiration date of the cap. Prior to or after the commitment expiration date, the cap may be increased or the commitment to maintain the cap may be terminated only with the approval of the Board of Trustees. |
| Expenses Paid, Amount |
|
|
$ 75
|
| Expense Ratio, Percent |
[1] |
|
0.68%
|
| Factors Affecting Performance [Text Block] |
|
|
How did the Fund perform last year and what affected its performance?The Fund outperformed its benchmark for the period. The past year saw a wide set of narratives drive the economy and financial markets. From an initial focus on the impact of tariffs, markets swiftly moved onto opportunities within artificial intelligence (AI) followed by a U.S. government shutdown. While the focus shifted, U.S. economic growth remained above trend, supported by AI-driven capital expenditures and resilient consumer spending. Outside the U.S., investment opportunities were divergent. Globally, expectations for earnings growth remain concentrated on a single theme: AI. There were limited portfolio changes over the past 12 months. We reduced overweight exposures to core bonds, large-cap core and international equities in November, and used the proceeds to fund a new, diversified high-yield income strategy. Security selection added to performance in our inflation-protected, large-cap core, and developed international equity strategies. Underperformance from active large-cap growth and large-cap value strategies detracted from relative performance. |
| Performance Past Does Not Indicate Future [Text] |
|
|
Figures quoted represent past performance, which is no guarantee of future results,
|
| Line Graph [Table Text Block] |
|
|
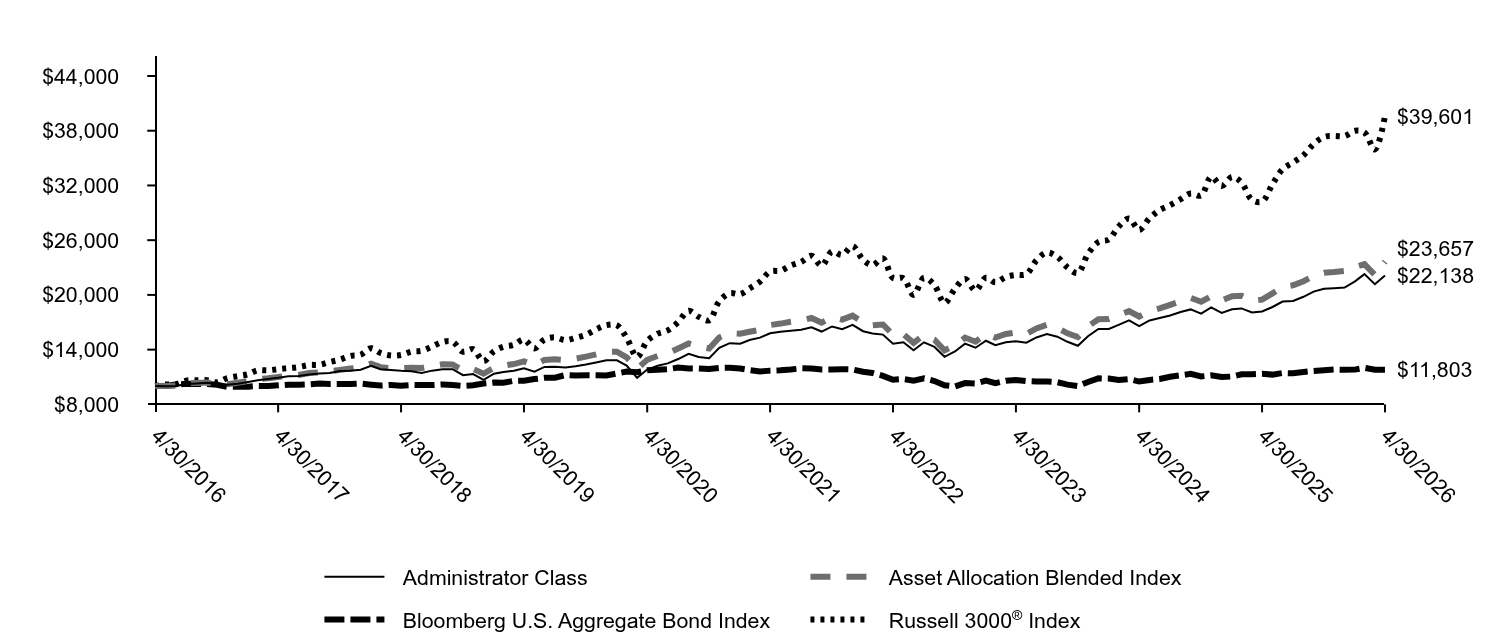
Table Summary
|
Administrator Class |
Asset Allocation Blended Index |
Bloomberg U.S. Aggregate Bond Index |
Russell 3000® Index |
4/30/2016 |
$10,000 |
$10,000 |
$10,000 |
$10,000 |
5/31/2016 |
$9,977 |
$10,009 |
$10,003 |
$10,179 |
6/30/2016 |
$10,008 |
$10,033 |
$10,182 |
$10,200 |
7/31/2016 |
$10,241 |
$10,336 |
$10,247 |
$10,605 |
8/31/2016 |
$10,296 |
$10,354 |
$10,235 |
$10,632 |
9/30/2016 |
$10,366 |
$10,393 |
$10,229 |
$10,648 |
10/31/2016 |
$10,273 |
$10,251 |
$10,151 |
$10,418 |
11/30/2016 |
$10,156 |
$10,217 |
$9,911 |
$10,884 |
12/31/2016 |
$10,264 |
$10,365 |
$9,925 |
$11,097 |
1/31/2017 |
$10,462 |
$10,557 |
$9,944 |
$11,305 |
2/28/2017 |
$10,652 |
$10,774 |
$10,011 |
$11,726 |
3/31/2017 |
$10,787 |
$10,858 |
$10,006 |
$11,734 |
4/30/2017 |
$10,914 |
$10,997 |
$10,083 |
$11,858 |
5/31/2017 |
$11,080 |
$11,184 |
$10,160 |
$11,980 |
6/30/2017 |
$11,104 |
$11,213 |
$10,150 |
$12,088 |
7/31/2017 |
$11,270 |
$11,434 |
$10,194 |
$12,316 |
8/31/2017 |
$11,381 |
$11,498 |
$10,285 |
$12,339 |
9/30/2017 |
$11,436 |
$11,624 |
$10,236 |
$12,640 |
10/31/2017 |
$11,650 |
$11,783 |
$10,242 |
$12,916 |
11/30/2017 |
$11,674 |
$11,926 |
$10,229 |
$13,308 |
12/31/2017 |
$11,802 |
$12,070 |
$10,276 |
$13,441 |
1/31/2018 |
$12,221 |
$12,464 |
$10,158 |
$14,150 |
2/28/2018 |
$11,858 |
$12,082 |
$10,061 |
$13,628 |
3/31/2018 |
$11,769 |
$11,941 |
$10,126 |
$13,355 |
4/30/2018 |
$11,689 |
$11,984 |
$10,051 |
$13,406 |
5/31/2018 |
$11,632 |
$12,024 |
$10,122 |
$13,784 |
6/30/2018 |
$11,439 |
$11,980 |
$10,110 |
$13,874 |
7/31/2018 |
$11,697 |
$12,217 |
$10,112 |
$14,335 |
8/31/2018 |
$11,850 |
$12,386 |
$10,177 |
$14,838 |
9/30/2018 |
$11,850 |
$12,379 |
$10,112 |
$14,863 |
10/31/2018 |
$11,197 |
$11,733 |
$10,032 |
$13,768 |
11/30/2018 |
$11,318 |
$11,886 |
$10,092 |
$14,044 |
12/31/2018 |
$10,685 |
$11,357 |
$10,277 |
$12,737 |
1/31/2019 |
$11,358 |
$12,009 |
$10,386 |
$13,830 |
2/28/2019 |
$11,559 |
$12,244 |
$10,380 |
$14,316 |
3/31/2019 |
$11,682 |
$12,421 |
$10,580 |
$14,526 |
4/30/2019 |
$11,944 |
$12,711 |
$10,582 |
$15,106 |
5/31/2019 |
$11,577 |
$12,283 |
$10,770 |
$14,128 |
6/30/2019 |
$12,101 |
$12,874 |
$10,906 |
$15,120 |
7/31/2019 |
$12,110 |
$12,939 |
$10,930 |
$15,345 |
8/31/2019 |
$12,049 |
$12,857 |
$11,213 |
$15,032 |
9/30/2019 |
$12,171 |
$13,001 |
$11,153 |
$15,296 |
10/31/2019 |
$12,364 |
$13,231 |
$11,187 |
$15,625 |
11/30/2019 |
$12,591 |
$13,479 |
$11,181 |
$16,219 |
12/31/2019 |
$12,828 |
$13,767 |
$11,173 |
$16,688 |
1/31/2020 |
$12,828 |
$13,779 |
$11,388 |
$16,669 |
2/29/2020 |
$12,250 |
$13,141 |
$11,593 |
$15,305 |
3/31/2020 |
$10,908 |
$11,920 |
$11,525 |
$13,200 |
4/30/2020 |
$11,815 |
$12,885 |
$11,730 |
$14,948 |
5/31/2020 |
$12,224 |
$13,300 |
$11,784 |
$15,748 |
6/30/2020 |
$12,490 |
$13,587 |
$11,859 |
$16,108 |
7/31/2020 |
$12,970 |
$14,126 |
$12,036 |
$17,022 |
8/31/2020 |
$13,548 |
$14,668 |
$11,939 |
$18,255 |
9/30/2020 |
$13,201 |
$14,352 |
$11,932 |
$17,591 |
10/31/2020 |
$13,050 |
$14,129 |
$11,879 |
$17,211 |
11/30/2020 |
$14,206 |
$15,331 |
$11,995 |
$19,305 |
12/31/2020 |
$14,708 |
$15,814 |
$12,012 |
$20,173 |
1/31/2021 |
$14,643 |
$15,750 |
$11,926 |
$20,084 |
2/28/2021 |
$15,050 |
$15,954 |
$11,753 |
$20,711 |
3/31/2021 |
$15,319 |
$16,182 |
$11,607 |
$21,454 |
4/30/2021 |
$15,790 |
$16,698 |
$11,698 |
$22,560 |
5/31/2021 |
$15,966 |
$16,855 |
$11,737 |
$22,663 |
6/30/2021 |
$16,077 |
$17,062 |
$11,819 |
$23,222 |
7/31/2021 |
$16,188 |
$17,203 |
$11,951 |
$23,614 |
8/31/2021 |
$16,456 |
$17,477 |
$11,929 |
$24,288 |
9/30/2021 |
$15,985 |
$16,959 |
$11,825 |
$23,198 |
10/31/2021 |
$16,540 |
$17,555 |
$11,822 |
$24,767 |
11/30/2021 |
$16,244 |
$17,295 |
$11,857 |
$24,390 |
12/31/2021 |
$16,714 |
$17,729 |
$11,827 |
$25,350 |
1/31/2022 |
$16,021 |
$16,995 |
$11,572 |
$23,859 |
2/28/2022 |
$15,765 |
$16,669 |
$11,443 |
$23,258 |
3/31/2022 |
$15,647 |
$16,755 |
$11,125 |
$24,012 |
4/30/2022 |
$14,656 |
$15,646 |
$10,703 |
$21,857 |
5/31/2022 |
$14,816 |
$15,694 |
$10,772 |
$21,828 |
6/30/2022 |
$13,930 |
$14,747 |
$10,603 |
$20,002 |
7/31/2022 |
$14,805 |
$15,597 |
$10,862 |
$21,878 |
8/31/2022 |
$14,293 |
$15,080 |
$10,555 |
$21,062 |
9/30/2022 |
$13,216 |
$13,921 |
$10,099 |
$19,109 |
10/31/2022 |
$13,802 |
$14,455 |
$9,968 |
$20,676 |
11/30/2022 |
$14,656 |
$15,322 |
$10,335 |
$21,755 |
12/31/2022 |
$14,211 |
$14,871 |
$10,288 |
$20,481 |
1/31/2023 |
$14,974 |
$15,733 |
$10,604 |
$21,892 |
2/28/2023 |
$14,496 |
$15,315 |
$10,330 |
$21,380 |
3/31/2023 |
$14,803 |
$15,710 |
$10,593 |
$21,952 |
4/30/2023 |
$14,905 |
$15,874 |
$10,657 |
$22,186 |
5/31/2023 |
$14,757 |
$15,726 |
$10,541 |
$22,272 |
6/30/2023 |
$15,338 |
$16,330 |
$10,503 |
$23,793 |
7/31/2023 |
$15,702 |
$16,723 |
$10,496 |
$24,646 |
8/31/2023 |
$15,417 |
$16,389 |
$10,429 |
$24,170 |
9/30/2023 |
$14,860 |
$15,788 |
$10,164 |
$23,019 |
10/31/2023 |
$14,427 |
$15,382 |
$10,003 |
$22,408 |
11/30/2023 |
$15,474 |
$16,549 |
$10,456 |
$24,498 |
12/31/2023 |
$16,271 |
$17,332 |
$10,857 |
$25,797 |
1/31/2024 |
$16,259 |
$17,367 |
$10,827 |
$26,083 |
2/29/2024 |
$16,714 |
$17,792 |
$10,674 |
$27,495 |
3/31/2024 |
$17,204 |
$18,219 |
$10,773 |
$28,382 |
4/30/2024 |
$16,589 |
$17,632 |
$10,500 |
$27,133 |
5/31/2024 |
$17,204 |
$18,214 |
$10,678 |
$28,415 |
6/30/2024 |
$17,477 |
$18,524 |
$10,780 |
$29,295 |
7/31/2024 |
$17,738 |
$18,916 |
$11,031 |
$29,839 |
8/31/2024 |
$18,125 |
$19,305 |
$11,190 |
$30,489 |
9/30/2024 |
$18,410 |
$19,679 |
$11,340 |
$31,120 |
10/31/2024 |
$17,943 |
$19,250 |
$11,058 |
$30,891 |
11/30/2024 |
$18,626 |
$19,862 |
$11,175 |
$32,946 |
12/31/2024 |
$18,025 |
$19,398 |
$10,992 |
$31,939 |
1/31/2025 |
$18,418 |
$19,866 |
$11,051 |
$32,947 |
2/28/2025 |
$18,517 |
$19,903 |
$11,294 |
$32,316 |
3/31/2025 |
$18,074 |
$19,374 |
$11,298 |
$30,431 |
4/30/2025 |
$18,185 |
$19,482 |
$11,343 |
$30,227 |
5/31/2025 |
$18,676 |
$20,168 |
$11,261 |
$32,143 |
6/30/2025 |
$19,266 |
$20,874 |
$11,435 |
$33,776 |
7/31/2025 |
$19,340 |
$21,050 |
$11,404 |
$34,520 |
8/31/2025 |
$19,795 |
$21,503 |
$11,541 |
$35,318 |
9/30/2025 |
$20,360 |
$22,074 |
$11,667 |
$36,537 |
10/31/2025 |
$20,667 |
$22,425 |
$11,740 |
$37,320 |
11/30/2025 |
$20,728 |
$22,500 |
$11,813 |
$37,423 |
12/31/2025 |
$20,802 |
$22,621 |
$11,795 |
$37,415 |
1/31/2026 |
$21,489 |
$23,058 |
$11,808 |
$37,996 |
2/28/2026 |
$22,281 |
$23,372 |
$12,001 |
$37,815 |
3/31/2026 |
$21,178 |
$22,201 |
$11,789 |
$35,935 |
4/30/2026 |
$22,138 |
$23,657 |
$11,803 |
$39,601 |
|
| Average Annual Return [Table Text Block] |
|
|
Table Summary
AATR |
1 Year |
5 Years |
10 Years |
Administrator Class |
21.74 |
6.99 |
8.27 |
Asset Allocation Blended IndexFootnote Reference* |
21.43 |
7.22 |
8.99 |
Bloomberg U.S. Aggregate Bond Index |
4.06 |
0.18 |
1.67 |
Russell 3000® Index |
31.01 |
11.91 |
14.75 | |
| No Deduction of Taxes [Text Block] |
|
|
do not reflect taxes that a shareholder may pay on an investment in a fund.
|
| AssetsNet |
|
|
$ 1,542,556,899
|
| Holdings Count | Holding |
|
|
31
|
| Advisory Fees Paid, Amount |
|
|
$ 4,042,967
|
| InvestmentCompanyPortfolioTurnover |
|
|
64.00%
|
| Additional Fund Statistics [Text Block] |
|
|
Table Summary
Total net assets |
$1,542,556,899 |
# of portfolio holdings |
31 |
Portfolio turnover rate |
64% |
Total advisory fees paid |
$4,042,967 | |
| Holdings [Text Block] |
|
|
ALLOCATION (% OF TOTAL INVESTMENTS)
Table Summary
Fund |
Effective AllocationFootnote Reference1 |
Bonds |
35.2 |
U.S. equities |
38.4 |
International stocks |
26.4 |
| Footnote |
Description |
Footnote1 |
Effective allocation is subject to change and may have changed since the date specified. Effective allocation excludes cash, and percent totals may not add to 100% due to rounding. | |
| Largest Holdings [Text Block] |
|
|
TOP TEN HOLDINGS (% OF NET ASSETS)
Table Summary
Allspring Disciplined U.S. Core Fund Class R6 |
10.8 |
Allspring Disciplined International Developed Markets Portfolio |
10.5 |
Allspring Special Large Value ETF |
9.8 |
Allspring Diversified Income Builder Fund Class R6 |
9.7 |
Allspring Core Plus ETF |
8.8 |
Allspring LT Large Growth ETF |
6.8 |
iShares Core S&P 500 ETF |
6.8 |
Allspring Real Return Portfolio |
6.6 |
Allspring Broad Market Core Bond ETF |
5.6 |
Allspring Emerging Markets Equity Advantage Fund Class R6 |
3.6 | |
| Material Fund Change [Text Block] |
|
|
|
| C000089552 |
|
|
|
| Shareholder Report [Line Items] |
|
|
|
| Fund Name |
|
|
Asset Allocation Fund
|
| Class Name |
|
|
Class A
|
| Trading Symbol |
|
|
EAAFX
|
| Annual or Semi-Annual Statement [Text Block] |
|
|
This annual shareholder report contains important information about Asset Allocation Fund for the period from May 1, 2025 to April 30, 2026.
|
| Additional Information [Text Block] |
|
|
You can find additional information about the Fund at allspringglobal.com. You can also request this information by contacting us at 1-800-222-8222.
|
| Additional Information Phone Number |
|
|
<span style="white-space: nowrap; box-sizing: border-box; color: rgb(0, 0, 0); display: inline; flex-wrap: nowrap; font-size: 12px; font-weight: 400; grid-area: auto; line-height: 18px; margin: 0px; overflow: visible; text-align: left; text-align-last: auto;"> 1-800-222-8222.</span>
|
| Additional Information Website |
|
|
<span style="box-sizing: border-box; color: rgb(0, 0, 0); display: inline; flex-wrap: nowrap; font-size: 12px; font-weight: 400; grid-area: auto; line-height: 18px; margin: 0px; overflow: visible; text-align: left; text-align-last: auto; white-space-collapse: preserve-breaks;">allspringglobal.com</span>
|
| Expenses [Text Block] |
|
|
What were the Fund costs for the past year?The table explains the costs you would have paid within the reporting period based on a hypothetical $10,000 investment.
Table Summary
CLASS NAME |
COSTS OF A $10,000 INVESTMENT |
COSTS PAID AS A % OF A $10,000 INVESTMENT |
Class A |
$93 |
0.84%Footnote Reference1 |
| Footnote |
Description |
Footnote1 |
Amounts reflect net expenses allocated from the affiliated Master Portfolios in which the Fund invests. | The manager has contractually committed to waive fees and/or reimburse certain expenses to the extent necessary to cap the Fund's total annual fund operating expense ratio at a specific amount. Without this cap, the costs shown above may have been higher. Please see the prospectus for the amount and the expiration date of the cap. Prior to or after the commitment expiration date, the cap may be increased or the commitment to maintain the cap may be terminated only with the approval of the Board of Trustees. |
| Expenses Paid, Amount |
|
|
$ 93
|
| Expense Ratio, Percent |
[2] |
|
0.84%
|
| Factors Affecting Performance [Text Block] |
|
|
How did the Fund perform last year and what affected its performance?The Fund outperformed its benchmark for the period. The past year saw a wide set of narratives drive the economy and financial markets. From an initial focus on the impact of tariffs, markets swiftly moved onto opportunities within artificial intelligence (AI) followed by a U.S. government shutdown. While the focus shifted, U.S. economic growth remained above trend, supported by AI-driven capital expenditures and resilient consumer spending. Outside the U.S., investment opportunities were divergent. Globally, expectations for earnings growth remain concentrated on a single theme: AI. There were limited portfolio changes over the past 12 months. We reduced overweight exposures to core bonds, large-cap core and international equities in November, and used the proceeds to fund a new, diversified high-yield income strategy. Security selection added to performance in our inflation-protected, large-cap core, and developed international equity strategies. Underperformance from active large-cap growth and large-cap value strategies detracted from relative performance. |
| Performance Past Does Not Indicate Future [Text] |
|
|
Figures quoted represent past performance, which is no guarantee of future results,
|
| Line Graph [Table Text Block] |
|
|
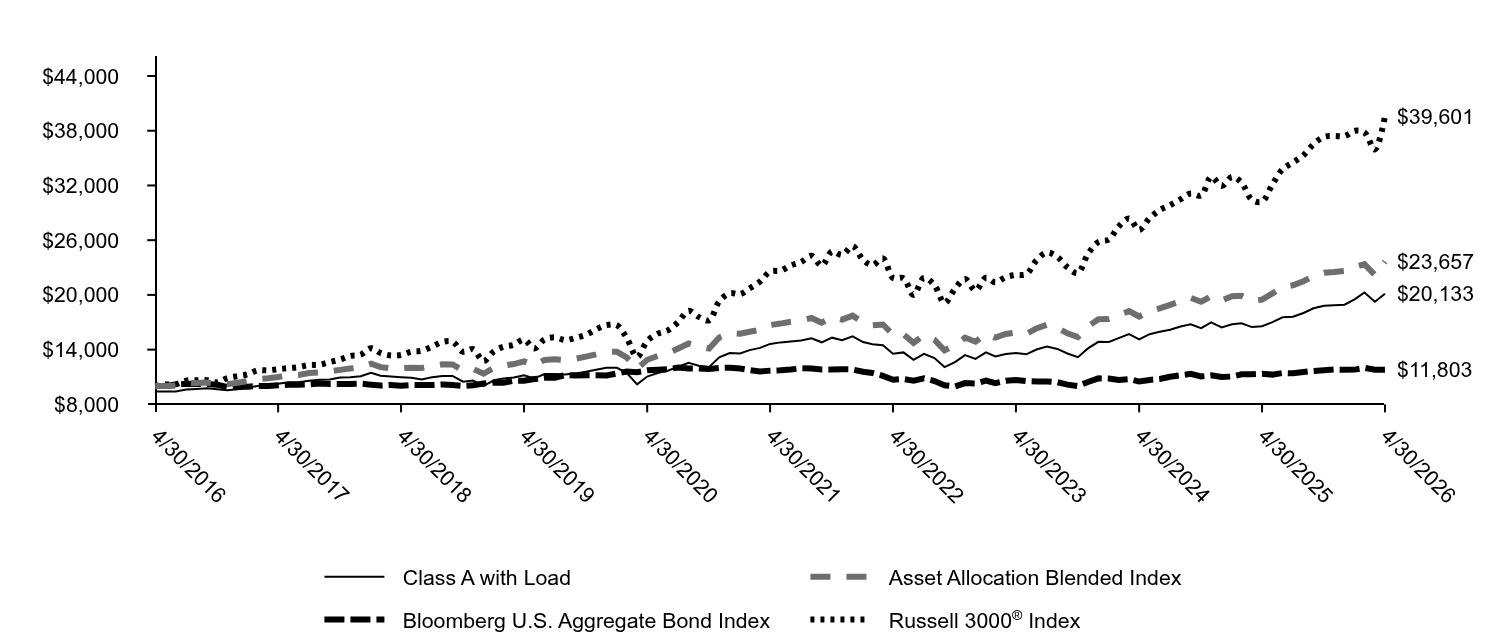
Table Summary
|
Class A with Load |
Asset Allocation Blended Index |
Bloomberg U.S. Aggregate Bond Index |
Russell 3000® Index |
4/30/2016 |
$9,422 |
$10,000 |
$10,000 |
$10,000 |
5/31/2016 |
$9,400 |
$10,009 |
$10,003 |
$10,179 |
6/30/2016 |
$9,422 |
$10,033 |
$10,182 |
$10,200 |
7/31/2016 |
$9,637 |
$10,336 |
$10,247 |
$10,605 |
8/31/2016 |
$9,689 |
$10,354 |
$10,235 |
$10,632 |
9/30/2016 |
$9,755 |
$10,393 |
$10,229 |
$10,648 |
10/31/2016 |
$9,666 |
$10,251 |
$10,151 |
$10,418 |
11/30/2016 |
$9,555 |
$10,217 |
$9,911 |
$10,884 |
12/31/2016 |
$9,654 |
$10,365 |
$9,925 |
$11,097 |
1/31/2017 |
$9,842 |
$10,557 |
$9,944 |
$11,305 |
2/28/2017 |
$10,015 |
$10,774 |
$10,011 |
$11,726 |
3/31/2017 |
$10,143 |
$10,858 |
$10,006 |
$11,734 |
4/30/2017 |
$10,256 |
$10,997 |
$10,083 |
$11,858 |
5/31/2017 |
$10,414 |
$11,184 |
$10,160 |
$11,980 |
6/30/2017 |
$10,437 |
$11,213 |
$10,150 |
$12,088 |
7/31/2017 |
$10,595 |
$11,434 |
$10,194 |
$12,316 |
8/31/2017 |
$10,701 |
$11,498 |
$10,285 |
$12,339 |
9/30/2017 |
$10,738 |
$11,624 |
$10,236 |
$12,640 |
10/31/2017 |
$10,949 |
$11,783 |
$10,242 |
$12,916 |
11/30/2017 |
$10,972 |
$11,926 |
$10,229 |
$13,308 |
12/31/2017 |
$11,083 |
$12,070 |
$10,276 |
$13,441 |
1/31/2018 |
$11,473 |
$12,464 |
$10,158 |
$14,150 |
2/28/2018 |
$11,136 |
$12,082 |
$10,061 |
$13,628 |
3/31/2018 |
$11,052 |
$11,941 |
$10,126 |
$13,355 |
4/30/2018 |
$10,976 |
$11,984 |
$10,051 |
$13,406 |
5/31/2018 |
$10,914 |
$12,024 |
$10,122 |
$13,784 |
6/30/2018 |
$10,731 |
$11,980 |
$10,110 |
$13,874 |
7/31/2018 |
$10,968 |
$12,217 |
$10,112 |
$14,335 |
8/31/2018 |
$11,114 |
$12,386 |
$10,177 |
$14,838 |
9/30/2018 |
$11,114 |
$12,379 |
$10,112 |
$14,863 |
10/31/2018 |
$10,493 |
$11,733 |
$10,032 |
$13,768 |
11/30/2018 |
$10,616 |
$11,886 |
$10,092 |
$14,044 |
12/31/2018 |
$10,021 |
$11,357 |
$10,277 |
$12,737 |
1/31/2019 |
$10,643 |
$12,009 |
$10,386 |
$13,830 |
2/28/2019 |
$10,834 |
$12,244 |
$10,380 |
$14,316 |
3/31/2019 |
$10,942 |
$12,421 |
$10,580 |
$14,526 |
4/30/2019 |
$11,191 |
$12,711 |
$10,582 |
$15,106 |
5/31/2019 |
$10,851 |
$12,283 |
$10,770 |
$14,128 |
6/30/2019 |
$11,332 |
$12,874 |
$10,906 |
$15,120 |
7/31/2019 |
$11,340 |
$12,939 |
$10,930 |
$15,345 |
8/31/2019 |
$11,282 |
$12,857 |
$11,213 |
$15,032 |
9/30/2019 |
$11,398 |
$13,001 |
$11,153 |
$15,296 |
10/31/2019 |
$11,572 |
$13,231 |
$11,187 |
$15,625 |
11/30/2019 |
$11,788 |
$13,479 |
$11,181 |
$16,219 |
12/31/2019 |
$12,002 |
$13,767 |
$11,173 |
$16,688 |
1/31/2020 |
$12,002 |
$13,779 |
$11,388 |
$16,669 |
2/29/2020 |
$11,454 |
$13,141 |
$11,593 |
$15,305 |
3/31/2020 |
$10,199 |
$11,920 |
$11,525 |
$13,200 |
4/30/2020 |
$11,050 |
$12,885 |
$11,730 |
$14,948 |
5/31/2020 |
$11,429 |
$13,300 |
$11,784 |
$15,748 |
6/30/2020 |
$11,682 |
$13,587 |
$11,859 |
$16,108 |
7/31/2020 |
$12,120 |
$14,126 |
$12,036 |
$17,022 |
8/31/2020 |
$12,558 |
$14,668 |
$11,939 |
$18,255 |
9/30/2020 |
$12,238 |
$14,352 |
$11,932 |
$17,591 |
10/31/2020 |
$12,094 |
$14,129 |
$11,879 |
$17,211 |
11/30/2020 |
$13,164 |
$15,331 |
$11,995 |
$19,305 |
12/31/2020 |
$13,631 |
$15,814 |
$12,012 |
$20,173 |
1/31/2021 |
$13,570 |
$15,750 |
$11,926 |
$20,084 |
2/28/2021 |
$13,946 |
$15,954 |
$11,753 |
$20,711 |
3/31/2021 |
$14,191 |
$16,182 |
$11,607 |
$21,454 |
4/30/2021 |
$14,629 |
$16,698 |
$11,698 |
$22,560 |
5/31/2021 |
$14,795 |
$16,855 |
$11,737 |
$22,663 |
6/30/2021 |
$14,891 |
$17,062 |
$11,819 |
$23,222 |
7/31/2021 |
$14,996 |
$17,203 |
$11,951 |
$23,614 |
8/31/2021 |
$15,241 |
$17,477 |
$11,929 |
$24,288 |
9/30/2021 |
$14,804 |
$16,959 |
$11,825 |
$23,198 |
10/31/2021 |
$15,311 |
$17,555 |
$11,822 |
$24,767 |
11/30/2021 |
$15,040 |
$17,295 |
$11,857 |
$24,390 |
12/31/2021 |
$15,466 |
$17,729 |
$11,827 |
$25,350 |
1/31/2022 |
$14,829 |
$16,995 |
$11,572 |
$23,859 |
2/28/2022 |
$14,587 |
$16,669 |
$11,443 |
$23,258 |
3/31/2022 |
$14,476 |
$16,755 |
$11,125 |
$24,012 |
4/30/2022 |
$13,556 |
$15,646 |
$10,703 |
$21,857 |
5/31/2022 |
$13,698 |
$15,694 |
$10,772 |
$21,828 |
6/30/2022 |
$12,890 |
$14,747 |
$10,603 |
$20,002 |
7/31/2022 |
$13,546 |
$15,597 |
$10,862 |
$21,878 |
8/31/2022 |
$13,082 |
$15,080 |
$10,555 |
$21,062 |
9/30/2022 |
$12,092 |
$13,921 |
$10,099 |
$19,109 |
10/31/2022 |
$12,627 |
$14,455 |
$9,968 |
$20,676 |
11/30/2022 |
$13,405 |
$15,322 |
$10,335 |
$21,755 |
12/31/2022 |
$12,993 |
$14,871 |
$10,288 |
$20,481 |
1/31/2023 |
$13,692 |
$15,733 |
$10,604 |
$21,892 |
2/28/2023 |
$13,251 |
$15,315 |
$10,330 |
$21,380 |
3/31/2023 |
$13,530 |
$15,710 |
$10,593 |
$21,952 |
4/30/2023 |
$13,627 |
$15,874 |
$10,657 |
$22,186 |
5/31/2023 |
$13,487 |
$15,726 |
$10,541 |
$22,272 |
6/30/2023 |
$14,014 |
$16,330 |
$10,503 |
$23,793 |
7/31/2023 |
$14,337 |
$16,723 |
$10,496 |
$24,646 |
8/31/2023 |
$14,079 |
$16,389 |
$10,429 |
$24,170 |
9/30/2023 |
$13,573 |
$15,788 |
$10,164 |
$23,019 |
10/31/2023 |
$13,175 |
$15,382 |
$10,003 |
$22,408 |
11/30/2023 |
$14,133 |
$16,549 |
$10,456 |
$24,498 |
12/31/2023 |
$14,853 |
$17,332 |
$10,857 |
$25,797 |
1/31/2024 |
$14,842 |
$17,367 |
$10,827 |
$26,083 |
2/29/2024 |
$15,262 |
$17,792 |
$10,674 |
$27,495 |
3/31/2024 |
$15,703 |
$18,219 |
$10,773 |
$28,382 |
4/30/2024 |
$15,133 |
$17,632 |
$10,500 |
$27,133 |
5/31/2024 |
$15,692 |
$18,214 |
$10,678 |
$28,415 |
6/30/2024 |
$15,950 |
$18,524 |
$10,780 |
$29,295 |
7/31/2024 |
$16,187 |
$18,916 |
$11,031 |
$29,839 |
8/31/2024 |
$16,531 |
$19,305 |
$11,190 |
$30,489 |
9/30/2024 |
$16,789 |
$19,679 |
$11,340 |
$31,120 |
10/31/2024 |
$16,359 |
$19,250 |
$11,058 |
$30,891 |
11/30/2024 |
$16,983 |
$19,862 |
$11,175 |
$32,946 |
12/31/2024 |
$16,436 |
$19,398 |
$10,992 |
$31,939 |
1/31/2025 |
$16,786 |
$19,866 |
$11,051 |
$32,947 |
2/28/2025 |
$16,879 |
$19,903 |
$11,294 |
$32,316 |
3/31/2025 |
$16,471 |
$19,374 |
$11,298 |
$30,431 |
4/30/2025 |
$16,565 |
$19,482 |
$11,343 |
$30,227 |
5/31/2025 |
$17,007 |
$20,168 |
$11,261 |
$32,143 |
6/30/2025 |
$17,542 |
$20,874 |
$11,435 |
$33,776 |
7/31/2025 |
$17,601 |
$21,050 |
$11,404 |
$34,520 |
8/31/2025 |
$18,020 |
$21,503 |
$11,541 |
$35,318 |
9/30/2025 |
$18,532 |
$22,074 |
$11,667 |
$36,537 |
10/31/2025 |
$18,811 |
$22,425 |
$11,740 |
$37,320 |
11/30/2025 |
$18,858 |
$22,500 |
$11,813 |
$37,423 |
12/31/2025 |
$18,926 |
$22,621 |
$11,795 |
$37,415 |
1/31/2026 |
$19,542 |
$23,058 |
$11,808 |
$37,996 |
2/28/2026 |
$20,268 |
$23,372 |
$12,001 |
$37,815 |
3/31/2026 |
$19,258 |
$22,201 |
$11,789 |
$35,935 |
4/30/2026 |
$20,133 |
$23,657 |
$11,803 |
$39,601 |
|
| Average Annual Return [Table Text Block] |
|
|
Table Summary
AATR |
1 Year |
5 Years |
10 Years |
Class A |
21.54 |
6.60 |
7.89 |
Class A with Load |
14.54 |
5.34 |
7.25 |
Asset Allocation Blended IndexFootnote Reference* |
21.43 |
7.22 |
8.99 |
Bloomberg U.S. Aggregate Bond Index |
4.06 |
0.18 |
1.67 |
Russell 3000® Index |
31.01 |
11.91 |
14.75 | |
| No Deduction of Taxes [Text Block] |
|
|
do not reflect taxes that a shareholder may pay on an investment in a fund.
|
| AssetsNet |
|
|
$ 1,542,556,899
|
| Holdings Count | Holding |
|
|
31
|
| Advisory Fees Paid, Amount |
|
|
$ 4,042,967
|
| InvestmentCompanyPortfolioTurnover |
|
|
64.00%
|
| Additional Fund Statistics [Text Block] |
|
|
Table Summary
Total net assets |
$1,542,556,899 |
# of portfolio holdings |
31 |
Portfolio turnover rate |
64% |
Total advisory fees paid |
$4,042,967 | |
| Holdings [Text Block] |
|
|
ALLOCATION (% OF TOTAL INVESTMENTS)
Table Summary
Fund |
Effective AllocationFootnote Reference1 |
Bonds |
35.2 |
U.S. equities |
38.4 |
International stocks |
26.4 |
| Footnote |
Description |
Footnote1 |
Effective allocation is subject to change and may have changed since the date specified. Effective allocation excludes cash, and percent totals may not add to 100% due to rounding. | |
| Largest Holdings [Text Block] |
|
|
TOP TEN HOLDINGS (% OF NET ASSETS)
Table Summary
Allspring Disciplined U.S. Core Fund Class R6 |
10.8 |
Allspring Disciplined International Developed Markets Portfolio |
10.5 |
Allspring Special Large Value ETF |
9.8 |
Allspring Diversified Income Builder Fund Class R6 |
9.7 |
Allspring Core Plus ETF |
8.8 |
Allspring LT Large Growth ETF |
6.8 |
iShares Core S&P 500 ETF |
6.8 |
Allspring Real Return Portfolio |
6.6 |
Allspring Broad Market Core Bond ETF |
5.6 |
Allspring Emerging Markets Equity Advantage Fund Class R6 |
3.6 | |
| Material Fund Change [Text Block] |
|
|
|
| C000089554 |
|
|
|
| Shareholder Report [Line Items] |
|
|
|
| Fund Name |
|
|
Asset Allocation Fund
|
| Class Name |
|
|
Class C
|
| Trading Symbol |
|
|
EACFX
|
| Annual or Semi-Annual Statement [Text Block] |
|
|
This annual shareholder report contains important information about Asset Allocation Fund for the period from May 1, 2025 to April 30, 2026.
|
| Additional Information [Text Block] |
|
|
You can find additional information about the Fund at allspringglobal.com. You can also request this information by contacting us at 1-800-222-8222.
|
| Additional Information Phone Number |
|
|
<span style="white-space: nowrap; box-sizing: border-box; color: rgb(0, 0, 0); display: inline; flex-wrap: nowrap; font-size: 12px; font-weight: 400; grid-area: auto; line-height: 18px; margin: 0px; overflow: visible; text-align: left; text-align-last: auto;"> 1-800-222-8222.</span>
|
| Additional Information Website |
|
|
<span style="box-sizing: border-box; color: rgb(0, 0, 0); display: inline; flex-wrap: nowrap; font-size: 12px; font-weight: 400; grid-area: auto; line-height: 18px; margin: 0px; overflow: visible; text-align: left; text-align-last: auto; white-space-collapse: preserve-breaks;">allspringglobal.com</span>
|
| Expenses [Text Block] |
|
|
What were the Fund costs for the past year?The table explains the costs you would have paid within the reporting period based on a hypothetical $10,000 investment.
Table Summary
CLASS NAME |
COSTS OF A $10,000 INVESTMENT |
COSTS PAID AS A % OF A $10,000 INVESTMENT |
Class C |
$175 |
1.59%Footnote Reference1 |
| Footnote |
Description |
Footnote1 |
Amounts reflect net expenses allocated from the affiliated Master Portfolios in which the Fund invests. | The manager has contractually committed to waive fees and/or reimburse certain expenses to the extent necessary to cap the Fund's total annual fund operating expense ratio at a specific amount. Without this cap, the costs shown above may have been higher. Please see the prospectus for the amount and the expiration date of the cap. Prior to or after the commitment expiration date, the cap may be increased or the commitment to maintain the cap may be terminated only with the approval of the Board of Trustees. |
| Expenses Paid, Amount |
|
|
$ 175
|
| Expense Ratio, Percent |
[3] |
|
1.59%
|
| Factors Affecting Performance [Text Block] |
|
|
How did the Fund perform last year and what affected its performance?The Fund outperformed its benchmark for the period. The past year saw a wide set of narratives drive the economy and financial markets. From an initial focus on the impact of tariffs, markets swiftly moved onto opportunities within artificial intelligence (AI) followed by a U.S. government shutdown. While the focus shifted, U.S. economic growth remained above trend, supported by AI-driven capital expenditures and resilient consumer spending. Outside the U.S., investment opportunities were divergent. Globally, expectations for earnings growth remain concentrated on a single theme: AI. There were limited portfolio changes over the past 12 months. We reduced overweight exposures to core bonds, large-cap core and international equities in November, and used the proceeds to fund a new, diversified high-yield income strategy. Security selection added to performance in our inflation-protected, large-cap core, and developed international equity strategies. Underperformance from active large-cap growth and large-cap value strategies detracted from relative performance. |
| Performance Past Does Not Indicate Future [Text] |
|
|
Figures quoted represent past performance, which is no guarantee of future results,
|
| Line Graph [Table Text Block] |
|
|
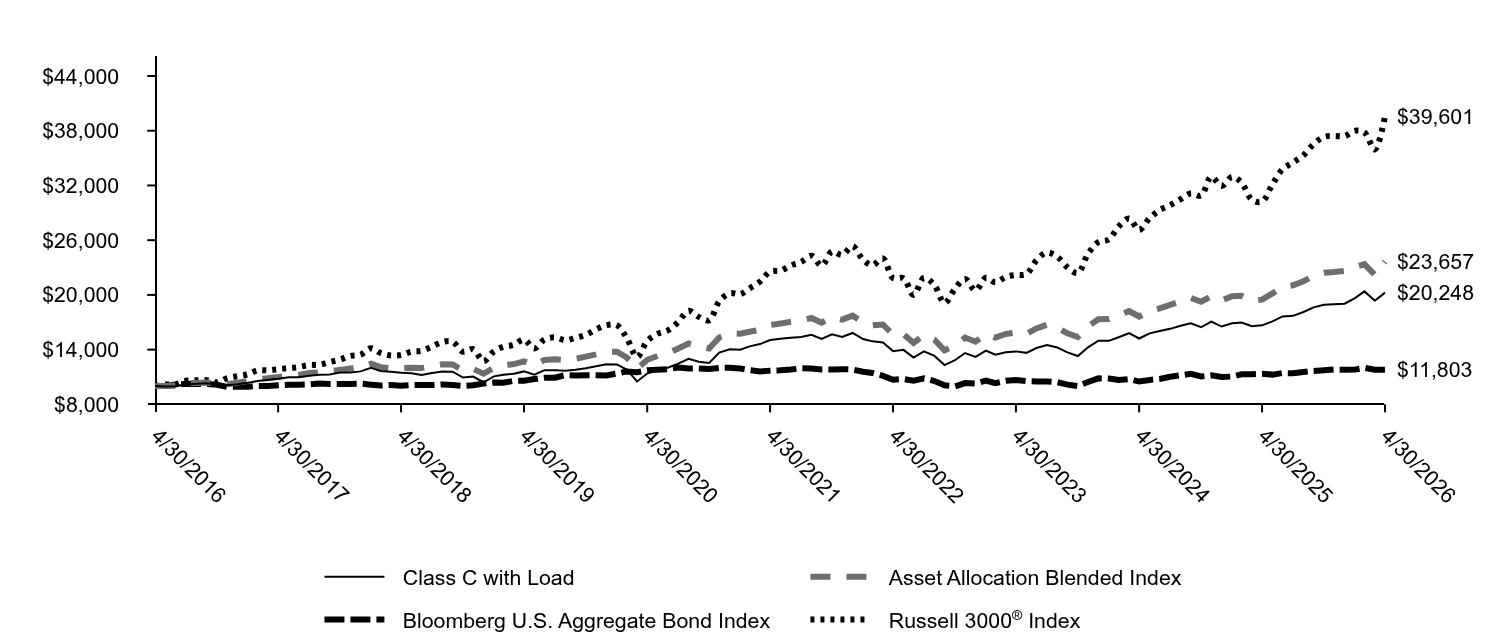
Table Summary
|
Class C with Load |
Asset Allocation Blended Index |
Bloomberg U.S. Aggregate Bond Index |
Russell 3000® Index |
4/30/2016 |
$10,000 |
$10,000 |
$10,000 |
$10,000 |
5/31/2016 |
$9,967 |
$10,009 |
$10,003 |
$10,179 |
6/30/2016 |
$9,984 |
$10,033 |
$10,182 |
$10,200 |
7/31/2016 |
$10,212 |
$10,336 |
$10,247 |
$10,605 |
8/31/2016 |
$10,252 |
$10,354 |
$10,235 |
$10,632 |
9/30/2016 |
$10,318 |
$10,393 |
$10,229 |
$10,648 |
10/31/2016 |
$10,220 |
$10,251 |
$10,151 |
$10,418 |
11/30/2016 |
$10,098 |
$10,217 |
$9,911 |
$10,884 |
12/31/2016 |
$10,200 |
$10,365 |
$9,925 |
$11,097 |
1/31/2017 |
$10,381 |
$10,557 |
$9,944 |
$11,305 |
2/28/2017 |
$10,570 |
$10,774 |
$10,011 |
$11,726 |
3/31/2017 |
$10,693 |
$10,858 |
$10,006 |
$11,734 |
4/30/2017 |
$10,808 |
$10,997 |
$10,083 |
$11,858 |
5/31/2017 |
$10,964 |
$11,184 |
$10,160 |
$11,980 |
6/30/2017 |
$10,980 |
$11,213 |
$10,150 |
$12,088 |
7/31/2017 |
$11,136 |
$11,434 |
$10,194 |
$12,316 |
8/31/2017 |
$11,243 |
$11,498 |
$10,285 |
$12,339 |
9/30/2017 |
$11,284 |
$11,624 |
$10,236 |
$12,640 |
10/31/2017 |
$11,489 |
$11,783 |
$10,242 |
$12,916 |
11/30/2017 |
$11,505 |
$11,926 |
$10,229 |
$13,308 |
12/31/2017 |
$11,615 |
$12,070 |
$10,276 |
$13,441 |
1/31/2018 |
$12,020 |
$12,464 |
$10,158 |
$14,150 |
2/28/2018 |
$11,656 |
$12,082 |
$10,061 |
$13,628 |
3/31/2018 |
$11,565 |
$11,941 |
$10,126 |
$13,355 |
4/30/2018 |
$11,474 |
$11,984 |
$10,051 |
$13,406 |
5/31/2018 |
$11,399 |
$12,024 |
$10,122 |
$13,784 |
6/30/2018 |
$11,209 |
$11,980 |
$10,110 |
$13,874 |
7/31/2018 |
$11,449 |
$12,217 |
$10,112 |
$14,335 |
8/31/2018 |
$11,590 |
$12,386 |
$10,177 |
$14,838 |
9/30/2018 |
$11,581 |
$12,379 |
$10,112 |
$14,863 |
10/31/2018 |
$10,936 |
$11,733 |
$10,032 |
$13,768 |
11/30/2018 |
$11,052 |
$11,886 |
$10,092 |
$14,044 |
12/31/2018 |
$10,424 |
$11,357 |
$10,277 |
$12,737 |
1/31/2019 |
$11,068 |
$12,009 |
$10,386 |
$13,830 |
2/28/2019 |
$11,255 |
$12,244 |
$10,380 |
$14,316 |
3/31/2019 |
$11,363 |
$12,421 |
$10,580 |
$14,526 |
4/30/2019 |
$11,613 |
$12,711 |
$10,582 |
$15,106 |
5/31/2019 |
$11,246 |
$12,283 |
$10,770 |
$14,128 |
6/30/2019 |
$11,747 |
$12,874 |
$10,906 |
$15,120 |
7/31/2019 |
$11,747 |
$12,939 |
$10,930 |
$15,345 |
8/31/2019 |
$11,676 |
$12,857 |
$11,213 |
$15,032 |
9/30/2019 |
$11,792 |
$13,001 |
$11,153 |
$15,296 |
10/31/2019 |
$11,971 |
$13,231 |
$11,187 |
$15,625 |
11/30/2019 |
$12,176 |
$13,479 |
$11,181 |
$16,219 |
12/31/2019 |
$12,392 |
$13,767 |
$11,173 |
$16,688 |
1/31/2020 |
$12,382 |
$13,779 |
$11,388 |
$16,669 |
2/29/2020 |
$11,813 |
$13,141 |
$11,593 |
$15,305 |
3/31/2020 |
$10,510 |
$11,920 |
$11,525 |
$13,200 |
4/30/2020 |
$11,379 |
$12,885 |
$11,730 |
$14,948 |
5/31/2020 |
$11,767 |
$13,300 |
$11,784 |
$15,748 |
6/30/2020 |
$12,021 |
$13,587 |
$11,859 |
$16,108 |
7/31/2020 |
$12,473 |
$14,126 |
$12,036 |
$17,022 |
8/31/2020 |
$12,998 |
$14,668 |
$11,939 |
$18,255 |
9/30/2020 |
$12,672 |
$14,352 |
$11,932 |
$17,591 |
10/31/2020 |
$12,536 |
$14,129 |
$11,879 |
$17,211 |
11/30/2020 |
$13,676 |
$15,331 |
$11,995 |
$19,305 |
12/31/2020 |
$14,049 |
$15,814 |
$12,012 |
$20,173 |
1/31/2021 |
$13,985 |
$15,750 |
$11,926 |
$20,084 |
2/28/2021 |
$14,360 |
$15,954 |
$11,753 |
$20,711 |
3/31/2021 |
$14,608 |
$16,182 |
$11,607 |
$21,454 |
4/30/2021 |
$15,047 |
$16,698 |
$11,698 |
$22,560 |
5/31/2021 |
$15,202 |
$16,855 |
$11,737 |
$22,663 |
6/30/2021 |
$15,294 |
$17,062 |
$11,819 |
$23,222 |
7/31/2021 |
$15,395 |
$17,203 |
$11,951 |
$23,614 |
8/31/2021 |
$15,633 |
$17,477 |
$11,929 |
$24,288 |
9/30/2021 |
$15,175 |
$16,959 |
$11,825 |
$23,198 |
10/31/2021 |
$15,688 |
$17,555 |
$11,822 |
$24,767 |
11/30/2021 |
$15,395 |
$17,295 |
$11,857 |
$24,390 |
12/31/2021 |
$15,828 |
$17,729 |
$11,827 |
$25,350 |
1/31/2022 |
$15,157 |
$16,995 |
$11,572 |
$23,859 |
2/28/2022 |
$14,906 |
$16,669 |
$11,443 |
$23,258 |
3/31/2022 |
$14,780 |
$16,755 |
$11,125 |
$24,012 |
4/30/2022 |
$13,837 |
$15,646 |
$10,703 |
$21,857 |
5/31/2022 |
$13,974 |
$15,694 |
$10,772 |
$21,828 |
6/30/2022 |
$13,136 |
$14,747 |
$10,603 |
$20,002 |
7/31/2022 |
$13,806 |
$15,597 |
$10,862 |
$21,878 |
8/31/2022 |
$13,314 |
$15,080 |
$10,555 |
$21,062 |
9/30/2022 |
$12,308 |
$13,921 |
$10,099 |
$19,109 |
10/31/2022 |
$12,842 |
$14,455 |
$9,968 |
$20,676 |
11/30/2022 |
$13,628 |
$15,322 |
$10,335 |
$21,755 |
12/31/2022 |
$13,204 |
$14,871 |
$10,288 |
$20,481 |
1/31/2023 |
$13,894 |
$15,733 |
$10,604 |
$21,892 |
2/28/2023 |
$13,441 |
$15,315 |
$10,330 |
$21,380 |
3/31/2023 |
$13,711 |
$15,710 |
$10,593 |
$21,952 |
4/30/2023 |
$13,808 |
$15,874 |
$10,657 |
$22,186 |
5/31/2023 |
$13,646 |
$15,726 |
$10,541 |
$22,272 |
6/30/2023 |
$14,174 |
$16,330 |
$10,503 |
$23,793 |
7/31/2023 |
$14,498 |
$16,723 |
$10,496 |
$24,646 |
8/31/2023 |
$14,228 |
$16,389 |
$10,429 |
$24,170 |
9/30/2023 |
$13,700 |
$15,788 |
$10,164 |
$23,019 |
10/31/2023 |
$13,301 |
$15,382 |
$10,003 |
$22,408 |
11/30/2023 |
$14,250 |
$16,549 |
$10,456 |
$24,498 |
12/31/2023 |
$14,972 |
$17,332 |
$10,857 |
$25,797 |
1/31/2024 |
$14,961 |
$17,367 |
$10,827 |
$26,083 |
2/29/2024 |
$15,360 |
$17,792 |
$10,674 |
$27,495 |
3/31/2024 |
$15,802 |
$18,219 |
$10,773 |
$28,382 |
4/30/2024 |
$15,220 |
$17,632 |
$10,500 |
$27,133 |
5/31/2024 |
$15,782 |
$18,214 |
$10,678 |
$28,415 |
6/30/2024 |
$16,042 |
$18,524 |
$10,780 |
$29,295 |
7/31/2024 |
$16,280 |
$18,916 |
$11,031 |
$29,839 |
8/31/2024 |
$16,626 |
$19,305 |
$11,190 |
$30,489 |
9/30/2024 |
$16,886 |
$19,679 |
$11,340 |
$31,120 |
10/31/2024 |
$16,453 |
$19,250 |
$11,058 |
$30,891 |
11/30/2024 |
$17,080 |
$19,862 |
$11,175 |
$32,946 |
12/31/2024 |
$16,531 |
$19,398 |
$10,992 |
$31,939 |
1/31/2025 |
$16,882 |
$19,866 |
$11,051 |
$32,947 |
2/28/2025 |
$16,976 |
$19,903 |
$11,294 |
$32,316 |
3/31/2025 |
$16,566 |
$19,374 |
$11,298 |
$30,431 |
4/30/2025 |
$16,660 |
$19,482 |
$11,343 |
$30,227 |
5/31/2025 |
$17,105 |
$20,168 |
$11,261 |
$32,143 |
6/30/2025 |
$17,643 |
$20,874 |
$11,435 |
$33,776 |
7/31/2025 |
$17,702 |
$21,050 |
$11,404 |
$34,520 |
8/31/2025 |
$18,123 |
$21,503 |
$11,541 |
$35,318 |
9/30/2025 |
$18,638 |
$22,074 |
$11,667 |
$36,537 |
10/31/2025 |
$18,919 |
$22,425 |
$11,740 |
$37,320 |
11/30/2025 |
$18,966 |
$22,500 |
$11,813 |
$37,423 |
12/31/2025 |
$19,035 |
$22,621 |
$11,795 |
$37,415 |
1/31/2026 |
$19,654 |
$23,058 |
$11,808 |
$37,996 |
2/28/2026 |
$20,385 |
$23,372 |
$12,001 |
$37,815 |
3/31/2026 |
$19,369 |
$22,201 |
$11,789 |
$35,935 |
4/30/2026 |
$20,248 |
$23,657 |
$11,803 |
$39,601 |
|
| Average Annual Return [Table Text Block] |
|
|
Table Summary
AATR |
1 Year |
5 Years |
10 Years |
Class C |
20.63 |
5.80 |
7.31 |
Class C with Load |
19.63 |
5.80 |
7.31 |
Asset Allocation Blended IndexFootnote Reference* |
21.43 |
7.22 |
8.99 |
Bloomberg U.S. Aggregate Bond Index |
4.06 |
0.18 |
1.67 |
Russell 3000® Index |
31.01 |
11.91 |
14.75 | |
| No Deduction of Taxes [Text Block] |
|
|
do not reflect taxes that a shareholder may pay on an investment in a fund.
|
| AssetsNet |
|
|
$ 1,542,556,899
|
| Holdings Count | Holding |
|
|
31
|
| Advisory Fees Paid, Amount |
|
|
$ 4,042,967
|
| InvestmentCompanyPortfolioTurnover |
|
|
64.00%
|
| Additional Fund Statistics [Text Block] |
|
|
Table Summary
Total net assets |
$1,542,556,899 |
# of portfolio holdings |
31 |
Portfolio turnover rate |
64% |
Total advisory fees paid |
$4,042,967 | |
| Holdings [Text Block] |
|
|
ALLOCATION (% OF TOTAL INVESTMENTS)
Table Summary
Fund |
Effective AllocationFootnote Reference1 |
Bonds |
35.2 |
U.S. equities |
38.4 |
International stocks |
26.4 |
| Footnote |
Description |
Footnote1 |
Effective allocation is subject to change and may have changed since the date specified. Effective allocation excludes cash, and percent totals may not add to 100% due to rounding. | |
| Largest Holdings [Text Block] |
|
|
TOP TEN HOLDINGS (% OF NET ASSETS)
Table Summary
Allspring Disciplined U.S. Core Fund Class R6 |
10.8 |
Allspring Disciplined International Developed Markets Portfolio |
10.5 |
Allspring Special Large Value ETF |
9.8 |
Allspring Diversified Income Builder Fund Class R6 |
9.7 |
Allspring Core Plus ETF |
8.8 |
Allspring LT Large Growth ETF |
6.8 |
iShares Core S&P 500 ETF |
6.8 |
Allspring Real Return Portfolio |
6.6 |
Allspring Broad Market Core Bond ETF |
5.6 |
Allspring Emerging Markets Equity Advantage Fund Class R6 |
3.6 | |
| Material Fund Change [Text Block] |
|
|
|
| C000123113 |
|
|
|
| Shareholder Report [Line Items] |
|
|
|
| Fund Name |
|
|
Asset Allocation Fund
|
| Class Name |
|
|
Institutional Class
|
| Trading Symbol |
|
|
EAAIX
|
| Annual or Semi-Annual Statement [Text Block] |
|
|
This annual shareholder report contains important information about Asset Allocation Fund for the period from May 1, 2025 to April 30, 2026.
|
| Additional Information [Text Block] |
|
|
You can find additional information about the Fund at allspringglobal.com. You can also request this information by contacting us at 1-800-222-8222.
|
| Additional Information Phone Number |
|
|
<span style="white-space: nowrap; box-sizing: border-box; color: rgb(0, 0, 0); display: inline; flex-wrap: nowrap; font-size: 12px; font-weight: 400; grid-area: auto; line-height: 18px; margin: 0px; overflow: visible; text-align: left; text-align-last: auto;"> 1-800-222-8222.</span>
|
| Additional Information Website |
|
|
<span style="box-sizing: border-box; color: rgb(0, 0, 0); display: inline; flex-wrap: nowrap; font-size: 12px; font-weight: 400; grid-area: auto; line-height: 18px; margin: 0px; overflow: visible; text-align: left; text-align-last: auto; white-space-collapse: preserve-breaks;">allspringglobal.com</span>
|
| Expenses [Text Block] |
|
|
What were the Fund costs for the past year?The table explains the costs you would have paid within the reporting period based on a hypothetical $10,000 investment.
Table Summary
CLASS NAME |
COSTS OF A $10,000 INVESTMENT |
COSTS PAID AS A % OF A $10,000 INVESTMENT |
Institutional Class |
$58 |
0.52%Footnote Reference1 |
| Footnote |
Description |
Footnote1 |
Amounts reflect net expenses allocated from the affiliated Master Portfolios in which the Fund invests. | The manager has contractually committed to waive fees and/or reimburse certain expenses to the extent necessary to cap the Fund's total annual fund operating expense ratio at a specific amount. Without this cap, the costs shown above may have been higher. Please see the prospectus for the amount and the expiration date of the cap. Prior to or after the commitment expiration date, the cap may be increased or the commitment to maintain the cap may be terminated only with the approval of the Board of Trustees. |
| Expenses Paid, Amount |
|
|
$ 58
|
| Expense Ratio, Percent |
[4] |
|
0.52%
|
| Factors Affecting Performance [Text Block] |
|
|
How did the Fund perform last year and what affected its performance?The Fund outperformed its benchmark for the period. The past year saw a wide set of narratives drive the economy and financial markets. From an initial focus on the impact of tariffs, markets swiftly moved onto opportunities within artificial intelligence (AI) followed by a U.S. government shutdown. While the focus shifted, U.S. economic growth remained above trend, supported by AI-driven capital expenditures and resilient consumer spending. Outside the U.S., investment opportunities were divergent. Globally, expectations for earnings growth remain concentrated on a single theme: AI. There were limited portfolio changes over the past 12 months. We reduced overweight exposures to core bonds, large-cap core and international equities in November, and used the proceeds to fund a new, diversified high-yield income strategy. Security selection added to performance in our inflation-protected, large-cap core, and developed international equity strategies. Underperformance from active large-cap growth and large-cap value strategies detracted from relative performance. |
| Performance Past Does Not Indicate Future [Text] |
|
|
Figures quoted represent past performance, which is no guarantee of future results,
|
| Line Graph [Table Text Block] |
|
|

Table Summary
|
Institutional Class |
Asset Allocation Blended Index |
Bloomberg U.S. Aggregate Bond Index |
Russell 3000® Index |
4/30/2016 |
$10,000 |
$10,000 |
$10,000 |
$10,000 |
5/31/2016 |
$9,976 |
$10,009 |
$10,003 |
$10,179 |
6/30/2016 |
$10,008 |
$10,033 |
$10,182 |
$10,200 |
7/31/2016 |
$10,243 |
$10,336 |
$10,247 |
$10,605 |
8/31/2016 |
$10,298 |
$10,354 |
$10,235 |
$10,632 |
9/30/2016 |
$10,369 |
$10,393 |
$10,229 |
$10,648 |
10/31/2016 |
$10,283 |
$10,251 |
$10,151 |
$10,418 |
11/30/2016 |
$10,165 |
$10,217 |
$9,911 |
$10,884 |
12/31/2016 |
$10,277 |
$10,365 |
$9,925 |
$11,097 |
1/31/2017 |
$10,477 |
$10,557 |
$9,944 |
$11,305 |
2/28/2017 |
$10,669 |
$10,774 |
$10,011 |
$11,726 |
3/31/2017 |
$10,805 |
$10,858 |
$10,006 |
$11,734 |
4/30/2017 |
$10,934 |
$10,997 |
$10,083 |
$11,858 |
5/31/2017 |
$11,102 |
$11,184 |
$10,160 |
$11,980 |
6/30/2017 |
$11,126 |
$11,213 |
$10,150 |
$12,088 |
7/31/2017 |
$11,302 |
$11,434 |
$10,194 |
$12,316 |
8/31/2017 |
$11,414 |
$11,498 |
$10,285 |
$12,339 |
9/30/2017 |
$11,462 |
$11,624 |
$10,236 |
$12,640 |
10/31/2017 |
$11,686 |
$11,783 |
$10,242 |
$12,916 |
11/30/2017 |
$11,710 |
$11,926 |
$10,229 |
$13,308 |
12/31/2017 |
$11,841 |
$12,070 |
$10,276 |
$13,441 |
1/31/2018 |
$12,258 |
$12,464 |
$10,158 |
$14,150 |
2/28/2018 |
$11,898 |
$12,082 |
$10,061 |
$13,628 |
3/31/2018 |
$11,816 |
$11,941 |
$10,126 |
$13,355 |
4/30/2018 |
$11,735 |
$11,984 |
$10,051 |
$13,406 |
5/31/2018 |
$11,677 |
$12,024 |
$10,122 |
$13,784 |
6/30/2018 |
$11,481 |
$11,980 |
$10,110 |
$13,874 |
7/31/2018 |
$11,743 |
$12,217 |
$10,112 |
$14,335 |
8/31/2018 |
$11,898 |
$12,386 |
$10,177 |
$14,838 |
9/30/2018 |
$11,906 |
$12,379 |
$10,112 |
$14,863 |
10/31/2018 |
$11,244 |
$11,733 |
$10,032 |
$13,768 |
11/30/2018 |
$11,375 |
$11,886 |
$10,092 |
$14,044 |
12/31/2018 |
$10,735 |
$11,357 |
$10,277 |
$12,737 |
1/31/2019 |
$11,419 |
$12,009 |
$10,386 |
$13,830 |
2/28/2019 |
$11,624 |
$12,244 |
$10,380 |
$14,316 |
3/31/2019 |
$11,739 |
$12,421 |
$10,580 |
$14,526 |
4/30/2019 |
$12,015 |
$12,711 |
$10,582 |
$15,106 |
5/31/2019 |
$11,641 |
$12,283 |
$10,770 |
$14,128 |
6/30/2019 |
$12,166 |
$12,874 |
$10,906 |
$15,120 |
7/31/2019 |
$12,183 |
$12,939 |
$10,930 |
$15,345 |
8/31/2019 |
$12,121 |
$12,857 |
$11,213 |
$15,032 |
9/30/2019 |
$12,246 |
$13,001 |
$11,153 |
$15,296 |
10/31/2019 |
$12,441 |
$13,231 |
$11,187 |
$15,625 |
11/30/2019 |
$12,672 |
$13,479 |
$11,181 |
$16,219 |
12/31/2019 |
$12,906 |
$13,767 |
$11,173 |
$16,688 |
1/31/2020 |
$12,906 |
$13,779 |
$11,388 |
$16,669 |
2/29/2020 |
$12,327 |
$13,141 |
$11,593 |
$15,305 |
3/31/2020 |
$10,979 |
$11,920 |
$11,525 |
$13,200 |
4/30/2020 |
$11,893 |
$12,885 |
$11,730 |
$14,948 |
5/31/2020 |
$12,318 |
$13,300 |
$11,784 |
$15,748 |
6/30/2020 |
$12,581 |
$13,587 |
$11,859 |
$16,108 |
7/31/2020 |
$13,060 |
$14,126 |
$12,036 |
$17,022 |
8/31/2020 |
$13,540 |
$14,668 |
$11,939 |
$18,255 |
9/30/2020 |
$13,205 |
$14,352 |
$11,932 |
$17,591 |
10/31/2020 |
$13,051 |
$14,129 |
$11,879 |
$17,211 |
11/30/2020 |
$14,210 |
$15,331 |
$11,995 |
$19,305 |
12/31/2020 |
$14,711 |
$15,814 |
$12,012 |
$20,173 |
1/31/2021 |
$14,645 |
$15,750 |
$11,926 |
$20,084 |
2/28/2021 |
$15,060 |
$15,954 |
$11,753 |
$20,711 |
3/31/2021 |
$15,334 |
$16,182 |
$11,607 |
$21,454 |
4/30/2021 |
$15,805 |
$16,698 |
$11,698 |
$22,560 |
5/31/2021 |
$15,985 |
$16,855 |
$11,737 |
$22,663 |
6/30/2021 |
$16,098 |
$17,062 |
$11,819 |
$23,222 |
7/31/2021 |
$16,211 |
$17,203 |
$11,951 |
$23,614 |
8/31/2021 |
$16,475 |
$17,477 |
$11,929 |
$24,288 |
9/30/2021 |
$16,013 |
$16,959 |
$11,825 |
$23,198 |
10/31/2021 |
$16,569 |
$17,555 |
$11,822 |
$24,767 |
11/30/2021 |
$16,277 |
$17,295 |
$11,857 |
$24,390 |
12/31/2021 |
$16,749 |
$17,729 |
$11,827 |
$25,350 |
1/31/2022 |
$16,061 |
$16,995 |
$11,572 |
$23,859 |
2/28/2022 |
$15,799 |
$16,669 |
$11,443 |
$23,258 |
3/31/2022 |
$15,679 |
$16,755 |
$11,125 |
$24,012 |
4/30/2022 |
$14,686 |
$15,646 |
$10,703 |
$21,857 |
5/31/2022 |
$14,849 |
$15,694 |
$10,772 |
$21,828 |
6/30/2022 |
$13,976 |
$14,747 |
$10,603 |
$20,002 |
7/31/2022 |
$14,697 |
$15,597 |
$10,862 |
$21,878 |
8/31/2022 |
$14,194 |
$15,080 |
$10,555 |
$21,062 |
9/30/2022 |
$13,124 |
$13,921 |
$10,099 |
$19,109 |
10/31/2022 |
$13,714 |
$14,455 |
$9,968 |
$20,676 |
11/30/2022 |
$14,555 |
$15,322 |
$10,335 |
$21,755 |
12/31/2022 |
$14,121 |
$14,871 |
$10,288 |
$20,481 |
1/31/2023 |
$14,880 |
$15,733 |
$10,604 |
$21,892 |
2/28/2023 |
$14,402 |
$15,315 |
$10,330 |
$21,380 |
3/31/2023 |
$14,705 |
$15,710 |
$10,593 |
$21,952 |
4/30/2023 |
$14,810 |
$15,874 |
$10,657 |
$22,186 |
5/31/2023 |
$14,670 |
$15,726 |
$10,541 |
$22,272 |
6/30/2023 |
$15,254 |
$16,330 |
$10,503 |
$23,793 |
7/31/2023 |
$15,604 |
$16,723 |
$10,496 |
$24,646 |
8/31/2023 |
$15,324 |
$16,389 |
$10,429 |
$24,170 |
9/30/2023 |
$14,775 |
$15,788 |
$10,164 |
$23,019 |
10/31/2023 |
$14,355 |
$15,382 |
$10,003 |
$22,408 |
11/30/2023 |
$15,394 |
$16,549 |
$10,456 |
$24,498 |
12/31/2023 |
$16,187 |
$17,332 |
$10,857 |
$25,797 |
1/31/2024 |
$16,187 |
$17,367 |
$10,827 |
$26,083 |
2/29/2024 |
$16,642 |
$17,792 |
$10,674 |
$27,495 |
3/31/2024 |
$17,121 |
$18,219 |
$10,773 |
$28,382 |
4/30/2024 |
$16,514 |
$17,632 |
$10,500 |
$27,133 |
5/31/2024 |
$17,121 |
$18,214 |
$10,678 |
$28,415 |
6/30/2024 |
$17,401 |
$18,524 |
$10,780 |
$29,295 |
7/31/2024 |
$17,669 |
$18,916 |
$11,031 |
$29,839 |
8/31/2024 |
$18,054 |
$19,305 |
$11,190 |
$30,489 |
9/30/2024 |
$18,335 |
$19,679 |
$11,340 |
$31,120 |
10/31/2024 |
$17,879 |
$19,250 |
$11,058 |
$30,891 |
11/30/2024 |
$18,556 |
$19,862 |
$11,175 |
$32,946 |
12/31/2024 |
$17,972 |
$19,398 |
$10,992 |
$31,939 |
1/31/2025 |
$18,352 |
$19,866 |
$11,051 |
$32,947 |
2/28/2025 |
$18,466 |
$19,903 |
$11,294 |
$32,316 |
3/31/2025 |
$18,023 |
$19,374 |
$11,298 |
$30,431 |
4/30/2025 |
$18,124 |
$19,482 |
$11,343 |
$30,227 |
5/31/2025 |
$18,631 |
$20,168 |
$11,261 |
$32,143 |
6/30/2025 |
$19,214 |
$20,874 |
$11,435 |
$33,776 |
7/31/2025 |
$19,290 |
$21,050 |
$11,404 |
$34,520 |
8/31/2025 |
$19,746 |
$21,503 |
$11,541 |
$35,318 |
9/30/2025 |
$20,315 |
$22,074 |
$11,667 |
$36,537 |
10/31/2025 |
$20,619 |
$22,425 |
$11,740 |
$37,320 |
11/30/2025 |
$20,683 |
$22,500 |
$11,813 |
$37,423 |
12/31/2025 |
$20,771 |
$22,621 |
$11,795 |
$37,415 |
1/31/2026 |
$21,443 |
$23,058 |
$11,808 |
$37,996 |
2/28/2026 |
$22,249 |
$23,372 |
$12,001 |
$37,815 |
3/31/2026 |
$21,147 |
$22,201 |
$11,789 |
$35,935 |
4/30/2026 |
$22,101 |
$23,657 |
$11,803 |
$39,601 |
|
| Average Annual Return [Table Text Block] |
|
|
Table Summary
AATR |
1 Year |
5 Years |
10 Years |
Institutional Class |
21.94 |
6.94 |
8.25 |
Asset Allocation Blended IndexFootnote Reference* |
21.43 |
7.22 |
8.99 |
Bloomberg U.S. Aggregate Bond Index |
4.06 |
0.18 |
1.67 |
Russell 3000® Index |
31.01 |
11.91 |
14.75 | |
| No Deduction of Taxes [Text Block] |
|
|
do not reflect taxes that a shareholder may pay on an investment in a fund.
|
| AssetsNet |
|
|
$ 1,542,556,899
|
| Holdings Count | Holding |
|
|
31
|
| Advisory Fees Paid, Amount |
|
|
$ 4,042,967
|
| InvestmentCompanyPortfolioTurnover |
|
|
64.00%
|
| Additional Fund Statistics [Text Block] |
|
|
Table Summary
Total net assets |
$1,542,556,899 |
# of portfolio holdings |
31 |
Portfolio turnover rate |
64% |
Total advisory fees paid |
$4,042,967 | |
| Holdings [Text Block] |
|
|
ALLOCATION (% OF TOTAL INVESTMENTS)
Table Summary
Fund |
Effective AllocationFootnote Reference1 |
Bonds |
35.2 |
U.S. equities |
38.4 |
International stocks |
26.4 |
| Footnote |
Description |
Footnote1 |
Effective allocation is subject to change and may have changed since the date specified. Effective allocation excludes cash, and percent totals may not add to 100% due to rounding. | |
| Largest Holdings [Text Block] |
|
|
TOP TEN HOLDINGS (% OF NET ASSETS)
Table Summary
Allspring Disciplined U.S. Core Fund Class R6 |
10.8 |
Allspring Disciplined International Developed Markets Portfolio |
10.5 |
Allspring Special Large Value ETF |
9.8 |
Allspring Diversified Income Builder Fund Class R6 |
9.7 |
Allspring Core Plus ETF |
8.8 |
Allspring LT Large Growth ETF |
6.8 |
iShares Core S&P 500 ETF |
6.8 |
Allspring Real Return Portfolio |
6.6 |
Allspring Broad Market Core Bond ETF |
5.6 |
Allspring Emerging Markets Equity Advantage Fund Class R6 |
3.6 | |
| Material Fund Change [Text Block] |
|
|
|
| C000020336 |
|
|
|
| Shareholder Report [Line Items] |
|
|
|
| Fund Name |
|
|
Core Bond Fund
|
| Class Name |
|
|
Administrator Class
|
| Trading Symbol |
|
|
MNTRX
|
| Annual or Semi-Annual Statement [Text Block] |
|
|
This annual shareholder report contains important information about Core Bond Fund for the period from May 1, 2025 to April 30, 2026.
|
| Additional Information [Text Block] |
|
|
You can find additional information about the Fund at allspringglobal.com. You can also request this information by contacting us at 1-800-222-8222.
|
| Additional Information Phone Number |
|
|
<span style="white-space: nowrap; box-sizing: border-box; color: rgb(0, 0, 0); display: inline; flex-wrap: nowrap; font-size: 12px; font-weight: 400; grid-area: auto; line-height: 18px; margin: 0px; overflow: visible; text-align: left; text-align-last: auto;"> 1-800-222-8222.</span>
|
| Additional Information Website |
|
|
<span style="box-sizing: border-box; color: rgb(0, 0, 0); display: inline; flex-wrap: nowrap; font-size: 12px; font-weight: 400; grid-area: auto; line-height: 18px; margin: 0px; overflow: visible; text-align: left; text-align-last: auto; white-space-collapse: preserve-breaks;">allspringglobal.com</span>
|
| Expenses [Text Block] |
|
|
What were the Fund costs for the past year?The table explains the costs you would have paid within the reporting period based on a hypothetical $10,000 investment.
Table Summary
CLASS NAME |
COSTS OF A $10,000 INVESTMENT |
COSTS PAID AS A % OF A $10,000 INVESTMENT |
Administrator Class |
$66 |
0.65%Footnote Reference1 |
| Footnote |
Description |
Footnote1 |
Includes the fees charged by the Manager for providing advisory services to the Master Portfolio in which the Fund invests substantially all of its assets. | The manager has contractually committed to waive fees and/or reimburse certain expenses to the extent necessary to cap the Fund's total annual fund operating expense ratio at a specific amount. Without this cap, the costs shown above may have been higher. Please see the prospectus for the amount and the expiration date of the cap. Prior to or after the commitment expiration date, the cap may be increased or the commitment to maintain the cap may be terminated only with the approval of the Board of Trustees. |
| Expenses Paid, Amount |
|
|
$ 66
|
| Expense Ratio, Percent |
[5] |
|
0.65%
|
| Expenses Represent Both Master and Feeder [Text] |
|
|
Includes the fees charged by the Manager for providing advisory services to the Master Portfolio in which the Fund invests substantially all of its assets.
|
| Factors Affecting Performance [Text Block] |
|
|
How did the Fund perform last year and what affected its performance?The Fund outperformed its benchmark for the period. The market was shaped by frequent repricing of Federal Reserve expectations and bouts of rate volatility driven by trade headlines, increasing investment in artificial intelligence, and geopolitical conflict. Despite this volatility, interest rates generally remained within a range while demand for credit was resilient and most risk assets performed well. Our positioning was nimble, as we adjusted credit exposure during tariff- and geopolitically driven volatility. We maintained an overweight to mortgage-backed securities (MBS). Sector positioning was the largest contributor to performance. Security selection within MBS also contributed as elevated interest rate volatility and price dislocations provided opportunities to extract relative value. Our tactical positioning in the credit sector contributed, as did a sector overweight and security selection within asset-backed securities. Security selection within credit was a small detractor, driven primarily by technology holdings. Our underweight to commercial mortgage-backed securities also modestly detracted as the sector performed well. |
| Performance Past Does Not Indicate Future [Text] |
|
|
Figures quoted represent past performance, which is no guarantee of future results,
|
| Line Graph [Table Text Block] |
|
|
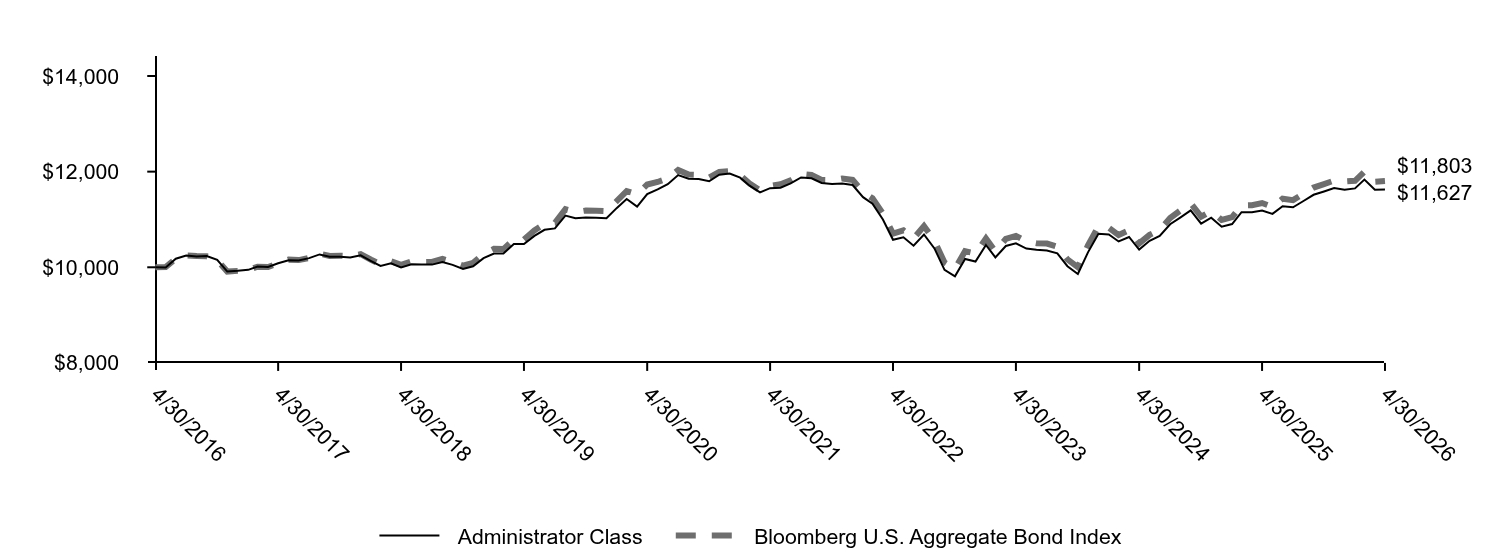
Table Summary
|
Administrator Class |
Bloomberg U.S. Aggregate Bond Index |
4/30/2016 |
$10,000 |
$10,000 |
5/31/2016 |
$9,997 |
$10,003 |
6/30/2016 |
$10,178 |
$10,182 |
7/31/2016 |
$10,244 |
$10,247 |
8/31/2016 |
$10,225 |
$10,235 |
9/30/2016 |
$10,236 |
$10,229 |
10/31/2016 |
$10,154 |
$10,151 |
11/30/2016 |
$9,910 |
$9,911 |
12/31/2016 |
$9,925 |
$9,925 |
1/31/2017 |
$9,946 |
$9,944 |
2/28/2017 |
$10,014 |
$10,011 |
3/31/2017 |
$10,005 |
$10,006 |
4/30/2017 |
$10,083 |
$10,083 |
5/31/2017 |
$10,145 |
$10,160 |
6/30/2017 |
$10,144 |
$10,150 |
7/31/2017 |
$10,191 |
$10,194 |
8/31/2017 |
$10,269 |
$10,285 |
9/30/2017 |
$10,221 |
$10,236 |
10/31/2017 |
$10,219 |
$10,242 |
11/30/2017 |
$10,203 |
$10,229 |
12/31/2017 |
$10,250 |
$10,276 |
1/31/2018 |
$10,131 |
$10,158 |
2/28/2018 |
$10,028 |
$10,061 |
3/31/2018 |
$10,085 |
$10,126 |
4/30/2018 |
$9,998 |
$10,051 |
5/31/2018 |
$10,065 |
$10,122 |
6/30/2018 |
$10,060 |
$10,110 |
7/31/2018 |
$10,056 |
$10,112 |
8/31/2018 |
$10,109 |
$10,177 |
9/30/2018 |
$10,050 |
$10,112 |
10/31/2018 |
$9,967 |
$10,032 |
11/30/2018 |
$10,022 |
$10,092 |
12/31/2018 |
$10,192 |
$10,277 |
1/31/2019 |
$10,288 |
$10,386 |
2/28/2019 |
$10,286 |
$10,380 |
3/31/2019 |
$10,489 |
$10,580 |
4/30/2019 |
$10,487 |
$10,582 |
5/31/2019 |
$10,656 |
$10,770 |
6/30/2019 |
$10,784 |
$10,906 |
7/31/2019 |
$10,813 |
$10,930 |
8/31/2019 |
$11,080 |
$11,213 |
9/30/2019 |
$11,025 |
$11,153 |
10/31/2019 |
$11,043 |
$11,187 |
11/30/2019 |
$11,035 |
$11,181 |
12/31/2019 |
$11,025 |
$11,173 |
1/31/2020 |
$11,242 |
$11,388 |
2/29/2020 |
$11,427 |
$11,593 |
3/31/2020 |
$11,268 |
$11,525 |
4/30/2020 |
$11,529 |
$11,730 |
5/31/2020 |
$11,630 |
$11,784 |
6/30/2020 |
$11,738 |
$11,859 |
7/31/2020 |
$11,929 |
$12,036 |
8/31/2020 |
$11,850 |
$11,939 |
9/30/2020 |
$11,845 |
$11,932 |
10/31/2020 |
$11,798 |
$11,879 |
11/30/2020 |
$11,936 |
$11,995 |
12/31/2020 |
$11,962 |
$12,012 |
1/31/2021 |
$11,874 |
$11,926 |
2/28/2021 |
$11,707 |
$11,753 |
3/31/2021 |
$11,565 |
$11,607 |
4/30/2021 |
$11,655 |
$11,698 |
5/31/2021 |
$11,665 |
$11,737 |
6/30/2021 |
$11,754 |
$11,819 |
7/31/2021 |
$11,879 |
$11,951 |
8/31/2021 |
$11,861 |
$11,929 |
9/30/2021 |
$11,762 |
$11,825 |
10/31/2021 |
$11,743 |
$11,822 |
11/30/2021 |
$11,751 |
$11,857 |
12/31/2021 |
$11,721 |
$11,827 |
1/31/2022 |
$11,467 |
$11,572 |
2/28/2022 |
$11,331 |
$11,443 |
3/31/2022 |
$10,998 |
$11,125 |
4/30/2022 |
$10,576 |
$10,703 |
5/31/2022 |
$10,626 |
$10,772 |
6/30/2022 |
$10,451 |
$10,603 |
7/31/2022 |
$10,686 |
$10,862 |
8/31/2022 |
$10,394 |
$10,555 |
9/30/2022 |
$9,947 |
$10,099 |
10/31/2022 |
$9,812 |
$9,968 |
11/30/2022 |
$10,173 |
$10,335 |
12/31/2022 |
$10,119 |
$10,288 |
1/31/2023 |
$10,467 |
$10,604 |
2/28/2023 |
$10,206 |
$10,330 |
3/31/2023 |
$10,445 |
$10,593 |
4/30/2023 |
$10,501 |
$10,657 |
5/31/2023 |
$10,391 |
$10,541 |
6/30/2023 |
$10,366 |
$10,503 |
7/31/2023 |
$10,351 |
$10,496 |
8/31/2023 |
$10,291 |
$10,429 |
9/30/2023 |
$10,023 |
$10,164 |
10/31/2023 |
$9,860 |
$10,003 |
11/30/2023 |
$10,312 |
$10,456 |
12/31/2023 |
$10,700 |
$10,857 |
1/31/2024 |
$10,688 |
$10,827 |
2/29/2024 |
$10,540 |
$10,674 |
3/31/2024 |
$10,634 |
$10,773 |
4/30/2024 |
$10,371 |
$10,500 |
5/31/2024 |
$10,553 |
$10,678 |
6/30/2024 |
$10,658 |
$10,780 |
7/31/2024 |
$10,900 |
$11,031 |
8/31/2024 |
$11,045 |
$11,190 |
9/30/2024 |
$11,190 |
$11,340 |
10/31/2024 |
$10,912 |
$11,058 |
11/30/2024 |
$11,038 |
$11,175 |
12/31/2024 |
$10,848 |
$10,992 |
1/31/2025 |
$10,905 |
$11,051 |
2/28/2025 |
$11,152 |
$11,294 |
3/31/2025 |
$11,150 |
$11,298 |
4/30/2025 |
$11,188 |
$11,343 |
5/31/2025 |
$11,116 |
$11,261 |
6/30/2025 |
$11,277 |
$11,435 |
7/31/2025 |
$11,255 |
$11,404 |
8/31/2025 |
$11,386 |
$11,541 |
9/30/2025 |
$11,516 |
$11,667 |
10/31/2025 |
$11,586 |
$11,740 |
11/30/2025 |
$11,656 |
$11,813 |
12/31/2025 |
$11,622 |
$11,795 |
1/31/2026 |
$11,650 |
$11,808 |
2/28/2026 |
$11,833 |
$12,001 |
3/31/2026 |
$11,621 |
$11,789 |
4/30/2026 |
$11,627 |
$11,803 |
|
| Average Annual Return [Table Text Block] |
|
|
Table Summary
AATR |
1 Year |
5 Years |
10 Years |
Administrator Class |
3.92 |
(0.05) |
1.52 |
Bloomberg U.S. Aggregate Bond Index |
4.06 |
0.18 |
1.67 | |
| No Deduction of Taxes [Text Block] |
|
|
do not reflect taxes that a shareholder may pay on an investment in a fund.
|
| AssetsNet |
|
|
$ 4,588,353,944
|
| Holdings Count | Holding |
|
|
993
|
| Advisory Fees Paid, Amount |
[6] |
|
$ 13,765,868
|
| InvestmentCompanyPortfolioTurnover |
|
|
363.00%
|
| Additional Fund Statistics [Text Block] |
|
|
Table Summary
Total net assets |
$4,588,353,944 |
# of portfolio holdings |
993 |
Portfolio turnover rate |
363% |
Total advisory fees paid |
$13,765,868Footnote Reference* |
| Footnote |
Description |
Footnote* |
Includes the fees charged by the Manager for providing advisory services to the Master Portfolio in which the Fund invests substantially all of its assets. | |
| Holdings [Text Block] |
|
|
PORTFOLIO ALLOCATION (% OF TOTAL INVESTMENT)
Table Summary
Agency securities |
37.9 |
U.S. Treasury securities |
25.8 |
Corporate bonds and notes |
23.3 |
Asset-backed securities |
5.8 |
Yankee corporate bonds and notes |
4.7 |
Non-agency mortgage-backed securities |
1.5 |
Yankee government bonds |
0.9 |
Municipal obligations |
0.1 | |
| Largest Holdings [Text Block] |
|
|
TOP TEN HOLDINGS (% OF NET ASSETS)
Table Summary
U.S. Treasury Notes, 3.88%, 4‑30‑2031 |
2.5 |
U.S. Treasury Notes, 3.63%, 8‑31‑2030 |
2.4 |
U.S. Treasury Bonds, 4.63%, 2‑15‑2046 |
2.3 |
FNMA, 5.50%, 6‑1‑2056 |
2.0 |
U.S. Treasury Bonds, 4.63%, 11‑15‑2055 |
1.8 |
U.S. Treasury Notes, 3.75%, 4‑30‑2028 |
1.7 |
U.S. Treasury Notes, 3.88%, 4‑30‑2030 |
1.7 |
FNMA, 5.00%, 5‑1‑2056 |
1.4 |
U.S. Treasury Bonds, 3.00%, 2‑15‑2049 |
1.1 |
U.S. Treasury Notes, 4.13%, 10‑31‑2027 |
1.1 | |
| Material Fund Change [Text Block] |
|
|
|
| C000020333 |
|
|
|
| Shareholder Report [Line Items] |
|
|
|
| Fund Name |
|
|
Core Bond Fund
|
| Class Name |
|
|
Class A
|
| Trading Symbol |
|
|
MBFAX
|
| Annual or Semi-Annual Statement [Text Block] |
|
|
This annual shareholder report contains important information about Core Bond Fund for the period from May 1, 2025 to April 30, 2026.
|
| Additional Information [Text Block] |
|
|
You can find additional information about the Fund at allspringglobal.com. You can also request this information by contacting us at 1-800-222-8222.
|
| Additional Information Phone Number |
|
|
<span style="white-space: nowrap; box-sizing: border-box; color: rgb(0, 0, 0); display: inline; flex-wrap: nowrap; font-size: 12px; font-weight: 400; grid-area: auto; line-height: 18px; margin: 0px; overflow: visible; text-align: left; text-align-last: auto;"> 1-800-222-8222.</span>
|
| Additional Information Website |
|
|
<span style="box-sizing: border-box; color: rgb(0, 0, 0); display: inline; flex-wrap: nowrap; font-size: 12px; font-weight: 400; grid-area: auto; line-height: 18px; margin: 0px; overflow: visible; text-align: left; text-align-last: auto; white-space-collapse: preserve-breaks;">allspringglobal.com</span>
|
| Expenses [Text Block] |
|
|
What were the Fund costs for the past year?The table explains the costs you would have paid within the reporting period based on a hypothetical $10,000 investment.
Table Summary
CLASS NAME |
COSTS OF A $10,000 INVESTMENT |
COSTS PAID AS A % OF A $10,000 INVESTMENT |
Class A |
$71 |
0.70%Footnote Reference1 |
| Footnote |
Description |
Footnote1 |
Includes the fees charged by the Manager for providing advisory services to the Master Portfolio in which the Fund invests substantially all of its assets. | The manager has contractually committed to waive fees and/or reimburse certain expenses to the extent necessary to cap the Fund's total annual fund operating expense ratio at a specific amount. Without this cap, the costs shown above may have been higher. Please see the prospectus for the amount and the expiration date of the cap. Prior to or after the commitment expiration date, the cap may be increased or the commitment to maintain the cap may be terminated only with the approval of the Board of Trustees. |
| Expenses Paid, Amount |
|
|
$ 71
|
| Expense Ratio, Percent |
[7] |
|
0.70%
|
| Expenses Represent Both Master and Feeder [Text] |
|
|
Includes the fees charged by the Manager for providing advisory services to the Master Portfolio in which the Fund invests substantially all of its assets.
|
| Factors Affecting Performance [Text Block] |
|
|
How did the Fund perform last year and what affected its performance?The Fund outperformed its benchmark for the period. The market was shaped by frequent repricing of Federal Reserve expectations and bouts of rate volatility driven by trade headlines, increasing investment in artificial intelligence, and geopolitical conflict. Despite this volatility, interest rates generally remained within a range while demand for credit was resilient and most risk assets performed well. Our positioning was nimble, as we adjusted credit exposure during tariff- and geopolitically driven volatility. We maintained an overweight to mortgage-backed securities (MBS). Sector positioning was the largest contributor to performance. Security selection within MBS also contributed as elevated interest rate volatility and price dislocations provided opportunities to extract relative value. Our tactical positioning in the credit sector contributed, as did a sector overweight and security selection within asset-backed securities. Security selection within credit was a small detractor, driven primarily by technology holdings. Our underweight to commercial mortgage-backed securities also modestly detracted as the sector performed well. |
| Performance Past Does Not Indicate Future [Text] |
|
|
Figures quoted represent past performance, which is no guarantee of future results,
|
| Line Graph [Table Text Block] |
|
|
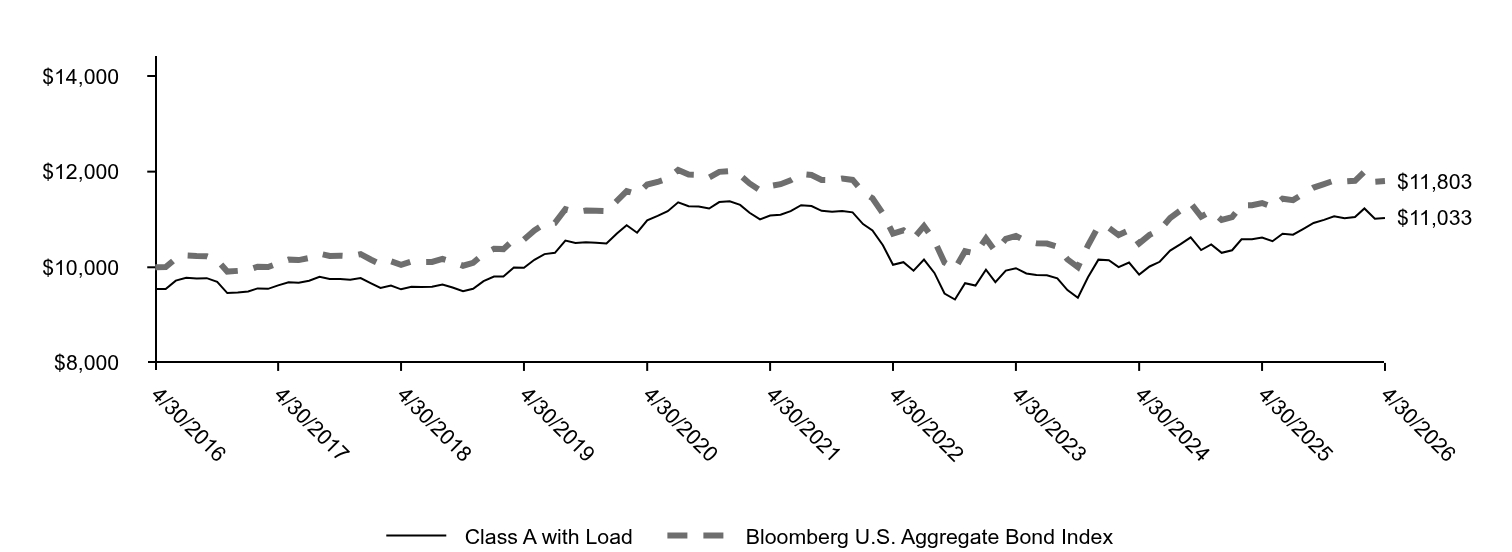
Table Summary
|
Class A with Load |
Bloomberg U.S. Aggregate Bond Index |
4/30/2016 |
$9,548 |
$10,000 |
5/31/2016 |
$9,544 |
$10,003 |
6/30/2016 |
$9,721 |
$10,182 |
7/31/2016 |
$9,782 |
$10,247 |
8/31/2016 |
$9,763 |
$10,235 |
9/30/2016 |
$9,773 |
$10,229 |
10/31/2016 |
$9,696 |
$10,151 |
11/30/2016 |
$9,461 |
$9,911 |
12/31/2016 |
$9,475 |
$9,925 |
1/31/2017 |
$9,494 |
$9,944 |
2/28/2017 |
$9,558 |
$10,011 |
3/31/2017 |
$9,549 |
$10,006 |
4/30/2017 |
$9,621 |
$10,083 |
5/31/2017 |
$9,685 |
$10,160 |
6/30/2017 |
$9,677 |
$10,150 |
7/31/2017 |
$9,720 |
$10,194 |
8/31/2017 |
$9,800 |
$10,285 |
9/30/2017 |
$9,755 |
$10,236 |
10/31/2017 |
$9,753 |
$10,242 |
11/30/2017 |
$9,738 |
$10,229 |
12/31/2017 |
$9,774 |
$10,276 |
1/31/2018 |
$9,663 |
$10,158 |
2/28/2018 |
$9,567 |
$10,061 |
3/31/2018 |
$9,619 |
$10,126 |
4/30/2018 |
$9,539 |
$10,051 |
5/31/2018 |
$9,593 |
$10,122 |
6/30/2018 |
$9,588 |
$10,110 |
7/31/2018 |
$9,592 |
$10,112 |
8/31/2018 |
$9,641 |
$10,177 |
9/30/2018 |
$9,578 |
$10,112 |
10/31/2018 |
$9,501 |
$10,032 |
11/30/2018 |
$9,552 |
$10,092 |
12/31/2018 |
$9,710 |
$10,277 |
1/31/2019 |
$9,807 |
$10,386 |
2/28/2019 |
$9,805 |
$10,380 |
3/31/2019 |
$9,994 |
$10,580 |
4/30/2019 |
$9,991 |
$10,582 |
5/31/2019 |
$10,156 |
$10,770 |
6/30/2019 |
$10,275 |
$10,906 |
7/31/2019 |
$10,302 |
$10,930 |
8/31/2019 |
$10,558 |
$11,213 |
9/30/2019 |
$10,506 |
$11,153 |
10/31/2019 |
$10,523 |
$11,187 |
11/30/2019 |
$10,515 |
$11,181 |
12/31/2019 |
$10,497 |
$11,173 |
1/31/2020 |
$10,707 |
$11,388 |
2/29/2020 |
$10,878 |
$11,593 |
3/31/2020 |
$10,723 |
$11,525 |
4/30/2020 |
$10,980 |
$11,730 |
5/31/2020 |
$11,074 |
$11,784 |
6/30/2020 |
$11,174 |
$11,859 |
7/31/2020 |
$11,359 |
$12,036 |
8/31/2020 |
$11,277 |
$11,939 |
9/30/2020 |
$11,272 |
$11,932 |
10/31/2020 |
$11,228 |
$11,879 |
11/30/2020 |
$11,363 |
$11,995 |
12/31/2020 |
$11,379 |
$12,012 |
1/31/2021 |
$11,305 |
$11,926 |
2/28/2021 |
$11,141 |
$11,753 |
3/31/2021 |
$11,001 |
$11,607 |
4/30/2021 |
$11,084 |
$11,698 |
5/31/2021 |
$11,100 |
$11,737 |
6/30/2021 |
$11,175 |
$11,819 |
7/31/2021 |
$11,299 |
$11,951 |
8/31/2021 |
$11,281 |
$11,929 |
9/30/2021 |
$11,180 |
$11,825 |
10/31/2021 |
$11,162 |
$11,822 |
11/30/2021 |
$11,177 |
$11,857 |
12/31/2021 |
$11,149 |
$11,827 |
1/31/2022 |
$10,904 |
$11,572 |
2/28/2022 |
$10,770 |
$11,443 |
3/31/2022 |
$10,460 |
$11,125 |
4/30/2022 |
$10,052 |
$10,703 |
5/31/2022 |
$10,107 |
$10,772 |
6/30/2022 |
$9,928 |
$10,603 |
7/31/2022 |
$10,161 |
$10,862 |
8/31/2022 |
$9,882 |
$10,555 |
9/30/2022 |
$9,451 |
$10,099 |
10/31/2022 |
$9,326 |
$9,968 |
11/30/2022 |
$9,668 |
$10,335 |
12/31/2022 |
$9,619 |
$10,288 |
1/31/2023 |
$9,950 |
$10,604 |
2/28/2023 |
$9,690 |
$10,330 |
3/31/2023 |
$9,930 |
$10,593 |
4/30/2023 |
$9,981 |
$10,657 |
5/31/2023 |
$9,871 |
$10,541 |
6/30/2023 |
$9,839 |
$10,503 |
7/31/2023 |
$9,835 |
$10,496 |
8/31/2023 |
$9,770 |
$10,429 |
9/30/2023 |
$9,523 |
$10,164 |
10/31/2023 |
$9,364 |
$10,003 |
11/30/2023 |
$9,792 |
$10,456 |
12/31/2023 |
$10,160 |
$10,857 |
1/31/2024 |
$10,149 |
$10,827 |
2/29/2024 |
$10,004 |
$10,674 |
3/31/2024 |
$10,100 |
$10,773 |
4/30/2024 |
$9,848 |
$10,500 |
5/31/2024 |
$10,017 |
$10,678 |
6/30/2024 |
$10,115 |
$10,780 |
7/31/2024 |
$10,349 |
$11,031 |
8/31/2024 |
$10,483 |
$11,190 |
9/30/2024 |
$10,627 |
$11,340 |
10/31/2024 |
$10,361 |
$11,058 |
11/30/2024 |
$10,478 |
$11,175 |
12/31/2024 |
$10,303 |
$10,992 |
1/31/2025 |
$10,356 |
$11,051 |
2/28/2025 |
$10,585 |
$11,294 |
3/31/2025 |
$10,585 |
$11,298 |
4/30/2025 |
$10,621 |
$11,343 |
5/31/2025 |
$10,545 |
$11,261 |
6/30/2025 |
$10,703 |
$11,435 |
7/31/2025 |
$10,683 |
$11,404 |
8/31/2025 |
$10,805 |
$11,541 |
9/30/2025 |
$10,927 |
$11,667 |
10/31/2025 |
$10,992 |
$11,740 |
11/30/2025 |
$11,066 |
$11,813 |
12/31/2025 |
$11,026 |
$11,795 |
1/31/2026 |
$11,052 |
$11,808 |
2/28/2026 |
$11,231 |
$12,001 |
3/31/2026 |
$11,016 |
$11,789 |
4/30/2026 |
$11,033 |
$11,803 |
|
| Average Annual Return [Table Text Block] |
|
|
Table Summary
AATR |
1 Year |
5 Years |
10 Years |
Class A |
3.88 |
(0.09) |
1.46 |
Class A with Load |
(0.82) |
(1.00) |
0.99 |
Bloomberg U.S. Aggregate Bond Index |
4.06 |
0.18 |
1.67 | |
| No Deduction of Taxes [Text Block] |
|
|
do not reflect taxes that a shareholder may pay on an investment in a fund.
|
| AssetsNet |
|
|
$ 4,588,353,944
|
| Holdings Count | Holding |
|
|
993
|
| Advisory Fees Paid, Amount |
[8] |
|
$ 13,765,868
|
| InvestmentCompanyPortfolioTurnover |
|
|
363.00%
|
| Additional Fund Statistics [Text Block] |
|
|
Table Summary
Total net assets |
$4,588,353,944 |
# of portfolio holdings |
993 |
Portfolio turnover rate |
363% |
Total advisory fees paid |
$13,765,868Footnote Reference* |
| Footnote |
Description |
Footnote* |
Includes the fees charged by the Manager for providing advisory services to the Master Portfolio in which the Fund invests substantially all of its assets. | |
| Holdings [Text Block] |
|
|
PORTFOLIO ALLOCATION (% OF TOTAL INVESTMENT)
Table Summary
Agency securities |
37.9 |
U.S. Treasury securities |
25.8 |
Corporate bonds and notes |
23.3 |
Asset-backed securities |
5.8 |
Yankee corporate bonds and notes |
4.7 |
Non-agency mortgage-backed securities |
1.5 |
Yankee government bonds |
0.9 |
Municipal obligations |
0.1 | |
| Largest Holdings [Text Block] |
|
|
TOP TEN HOLDINGS (% OF NET ASSETS)
Table Summary
U.S. Treasury Notes, 3.88%, 4‑30‑2031 |
2.5 |
U.S. Treasury Notes, 3.63%, 8‑31‑2030 |
2.4 |
U.S. Treasury Bonds, 4.63%, 2‑15‑2046 |
2.3 |
FNMA, 5.50%, 6‑1‑2056 |
2.0 |
U.S. Treasury Bonds, 4.63%, 11‑15‑2055 |
1.8 |
U.S. Treasury Notes, 3.75%, 4‑30‑2028 |
1.7 |
U.S. Treasury Notes, 3.88%, 4‑30‑2030 |
1.7 |
FNMA, 5.00%, 5‑1‑2056 |
1.4 |
U.S. Treasury Bonds, 3.00%, 2‑15‑2049 |
1.1 |
U.S. Treasury Notes, 4.13%, 10‑31‑2027 |
1.1 | |
| Material Fund Change [Text Block] |
|
|
|
| C000020335 |
|
|
|
| Shareholder Report [Line Items] |
|
|
|
| Fund Name |
|
|
Core Bond Fund
|
| Class Name |
|
|
Class C
|
| Trading Symbol |
|
|
MBFCX
|
| Annual or Semi-Annual Statement [Text Block] |
|
|
This annual shareholder report contains important information about Core Bond Fund for the period from May 1, 2025 to April 30, 2026.
|
| Additional Information [Text Block] |
|
|
You can find additional information about the Fund at allspringglobal.com. You can also request this information by contacting us at 1-800-222-8222.
|
| Additional Information Phone Number |
|
|
<span style="white-space: nowrap; box-sizing: border-box; color: rgb(0, 0, 0); display: inline; flex-wrap: nowrap; font-size: 12px; font-weight: 400; grid-area: auto; line-height: 18px; margin: 0px; overflow: visible; text-align: left; text-align-last: auto;"> 1-800-222-8222.</span>
|
| Additional Information Website |
|
|
<span style="box-sizing: border-box; color: rgb(0, 0, 0); display: inline; flex-wrap: nowrap; font-size: 12px; font-weight: 400; grid-area: auto; line-height: 18px; margin: 0px; overflow: visible; text-align: left; text-align-last: auto; white-space-collapse: preserve-breaks;">allspringglobal.com</span>
|
| Expenses [Text Block] |
|
|
What were the Fund costs for the past year?The table explains the costs you would have paid within the reporting period based on a hypothetical $10,000 investment.
Table Summary
CLASS NAME |
COSTS OF A $10,000 INVESTMENT |
COSTS PAID AS A % OF A $10,000 INVESTMENT |
Class C |
$147 |
1.45%Footnote Reference1 |
| Footnote |
Description |
Footnote1 |
Includes the fees charged by the Manager for providing advisory services to the Master Portfolio in which the Fund invests substantially all of its assets. | The manager has contractually committed to waive fees and/or reimburse certain expenses to the extent necessary to cap the Fund's total annual fund operating expense ratio at a specific amount. Without this cap, the costs shown above may have been higher. Please see the prospectus for the amount and the expiration date of the cap. Prior to or after the commitment expiration date, the cap may be increased or the commitment to maintain the cap may be terminated only with the approval of the Board of Trustees. |
| Expenses Paid, Amount |
|
|
$ 147
|
| Expense Ratio, Percent |
[9] |
|
1.45%
|
| Expenses Represent Both Master and Feeder [Text] |
|
|
Includes the fees charged by the Manager for providing advisory services to the Master Portfolio in which the Fund invests substantially all of its assets.
|
| Factors Affecting Performance [Text Block] |
|
|
How did the Fund perform last year and what affected its performance?The Fund outperformed its benchmark for the period. The market was shaped by frequent repricing of Federal Reserve expectations and bouts of rate volatility driven by trade headlines, increasing investment in artificial intelligence, and geopolitical conflict. Despite this volatility, interest rates generally remained within a range while demand for credit was resilient and most risk assets performed well. Our positioning was nimble, as we adjusted credit exposure during tariff- and geopolitically driven volatility. We maintained an overweight to mortgage-backed securities (MBS). Sector positioning was the largest contributor to performance. Security selection within MBS also contributed as elevated interest rate volatility and price dislocations provided opportunities to extract relative value. Our tactical positioning in the credit sector contributed, as did a sector overweight and security selection within asset-backed securities. Security selection within credit was a small detractor, driven primarily by technology holdings. Our underweight to commercial mortgage-backed securities also modestly detracted as the sector performed well. |
| Performance Past Does Not Indicate Future [Text] |
|
|
Figures quoted represent past performance, which is no guarantee of future results,
|
| Line Graph [Table Text Block] |
|
|
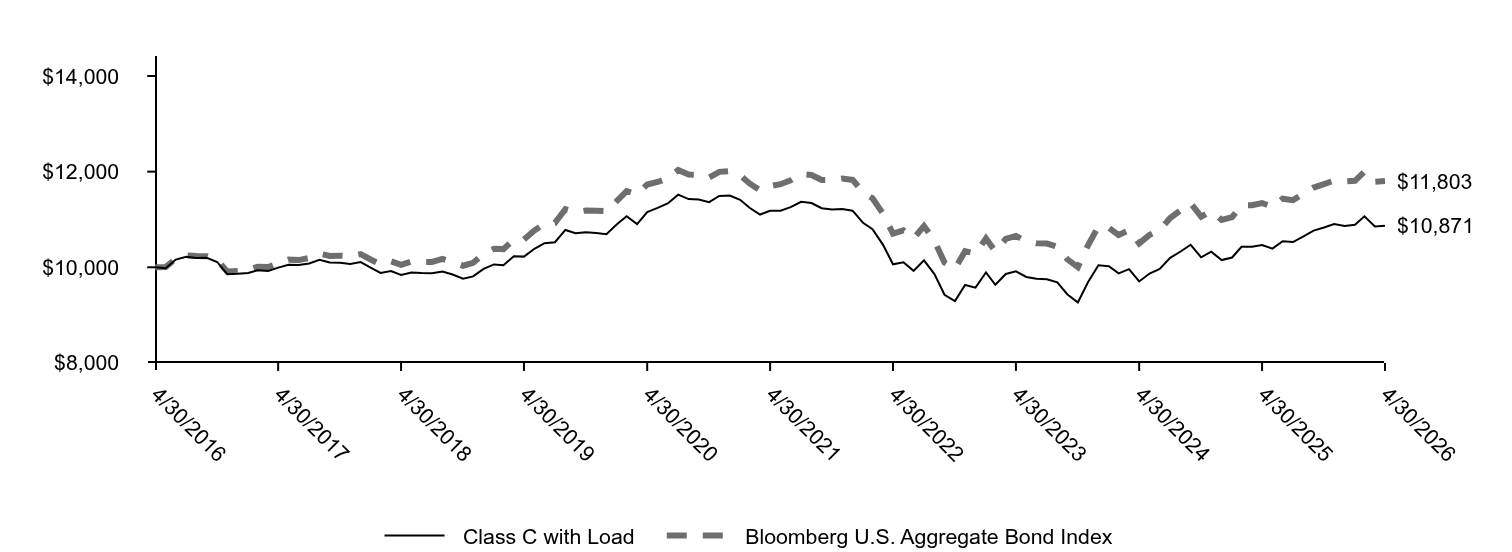
Table Summary
|
Class C with Load |
Bloomberg U.S. Aggregate Bond Index |
4/30/2016 |
$10,000 |
$10,000 |
5/31/2016 |
$9,982 |
$10,003 |
6/30/2016 |
$10,162 |
$10,182 |
7/31/2016 |
$10,220 |
$10,247 |
8/31/2016 |
$10,194 |
$10,235 |
9/30/2016 |
$10,198 |
$10,229 |
10/31/2016 |
$10,111 |
$10,151 |
11/30/2016 |
$9,857 |
$9,911 |
12/31/2016 |
$9,865 |
$9,925 |
1/31/2017 |
$9,879 |
$9,944 |
2/28/2017 |
$9,939 |
$10,011 |
3/31/2017 |
$9,924 |
$10,006 |
4/30/2017 |
$9,993 |
$10,083 |
5/31/2017 |
$10,054 |
$10,160 |
6/30/2017 |
$10,047 |
$10,150 |
7/31/2017 |
$10,078 |
$10,194 |
8/31/2017 |
$10,155 |
$10,285 |
9/30/2017 |
$10,101 |
$10,236 |
10/31/2017 |
$10,093 |
$10,242 |
11/30/2017 |
$10,070 |
$10,229 |
12/31/2017 |
$10,110 |
$10,276 |
1/31/2018 |
$9,987 |
$10,158 |
2/28/2018 |
$9,881 |
$10,061 |
3/31/2018 |
$9,921 |
$10,126 |
4/30/2018 |
$9,839 |
$10,051 |
5/31/2018 |
$9,889 |
$10,122 |
6/30/2018 |
$9,878 |
$10,110 |
7/31/2018 |
$9,875 |
$10,112 |
8/31/2018 |
$9,912 |
$10,177 |
9/30/2018 |
$9,848 |
$10,112 |
10/31/2018 |
$9,762 |
$10,032 |
11/30/2018 |
$9,809 |
$10,092 |
12/31/2018 |
$9,965 |
$10,277 |
1/31/2019 |
$10,060 |
$10,386 |
2/28/2019 |
$10,044 |
$10,380 |
3/31/2019 |
$10,232 |
$10,580 |
4/30/2019 |
$10,223 |
$10,582 |
5/31/2019 |
$10,387 |
$10,770 |
6/30/2019 |
$10,503 |
$10,906 |
7/31/2019 |
$10,524 |
$10,930 |
8/31/2019 |
$10,781 |
$11,213 |
9/30/2019 |
$10,713 |
$11,153 |
10/31/2019 |
$10,731 |
$11,187 |
11/30/2019 |
$10,717 |
$11,181 |
12/31/2019 |
$10,691 |
$11,173 |
1/31/2020 |
$10,900 |
$11,388 |
2/29/2020 |
$11,069 |
$11,593 |
3/31/2020 |
$10,902 |
$11,525 |
4/30/2020 |
$11,152 |
$11,730 |
5/31/2020 |
$11,241 |
$11,784 |
6/30/2020 |
$11,336 |
$11,859 |
7/31/2020 |
$11,518 |
$12,036 |
8/31/2020 |
$11,426 |
$11,939 |
9/30/2020 |
$11,415 |
$11,932 |
10/31/2020 |
$11,362 |
$11,879 |
11/30/2020 |
$11,493 |
$11,995 |
12/31/2020 |
$11,502 |
$12,012 |
1/31/2021 |
$11,411 |
$11,926 |
2/28/2021 |
$11,245 |
$11,753 |
3/31/2021 |
$11,103 |
$11,607 |
4/30/2021 |
$11,181 |
$11,698 |
5/31/2021 |
$11,182 |
$11,737 |
6/30/2021 |
$11,259 |
$11,819 |
7/31/2021 |
$11,369 |
$11,951 |
8/31/2021 |
$11,344 |
$11,929 |
9/30/2021 |
$11,235 |
$11,825 |
10/31/2021 |
$11,210 |
$11,822 |
11/30/2021 |
$11,219 |
$11,857 |
12/31/2021 |
$11,183 |
$11,827 |
1/31/2022 |
$10,929 |
$11,572 |
2/28/2022 |
$10,795 |
$11,443 |
3/31/2022 |
$10,474 |
$11,125 |
4/30/2022 |
$10,063 |
$10,703 |
5/31/2022 |
$10,103 |
$10,772 |
6/30/2022 |
$9,925 |
$10,603 |
7/31/2022 |
$10,146 |
$10,862 |
8/31/2022 |
$9,857 |
$10,555 |
9/30/2022 |
$9,425 |
$10,099 |
10/31/2022 |
$9,292 |
$9,968 |
11/30/2022 |
$9,631 |
$10,335 |
12/31/2022 |
$9,575 |
$10,288 |
1/31/2023 |
$9,893 |
$10,604 |
2/28/2023 |
$9,635 |
$10,330 |
3/31/2023 |
$9,860 |
$10,593 |
4/30/2023 |
$9,914 |
$10,657 |
5/31/2023 |
$9,797 |
$10,541 |
6/30/2023 |
$9,759 |
$10,503 |
7/31/2023 |
$9,748 |
$10,496 |
8/31/2023 |
$9,686 |
$10,429 |
9/30/2023 |
$9,432 |
$10,164 |
10/31/2023 |
$9,266 |
$10,003 |
11/30/2023 |
$9,688 |
$10,456 |
12/31/2023 |
$10,041 |
$10,857 |
1/31/2024 |
$10,023 |
$10,827 |
2/29/2024 |
$9,872 |
$10,674 |
3/31/2024 |
$9,961 |
$10,773 |
4/30/2024 |
$9,703 |
$10,500 |
5/31/2024 |
$9,870 |
$10,678 |
6/30/2024 |
$9,967 |
$10,780 |
7/31/2024 |
$10,197 |
$11,031 |
8/31/2024 |
$10,330 |
$11,190 |
9/30/2024 |
$10,471 |
$11,340 |
10/31/2024 |
$10,209 |
$11,058 |
11/30/2024 |
$10,325 |
$11,175 |
12/31/2024 |
$10,151 |
$10,992 |
1/31/2025 |
$10,204 |
$11,051 |
2/28/2025 |
$10,430 |
$11,294 |
3/31/2025 |
$10,429 |
$11,298 |
4/30/2025 |
$10,465 |
$11,343 |
5/31/2025 |
$10,390 |
$11,261 |
6/30/2025 |
$10,546 |
$11,435 |
7/31/2025 |
$10,527 |
$11,404 |
8/31/2025 |
$10,647 |
$11,541 |
9/30/2025 |
$10,766 |
$11,667 |
10/31/2025 |
$10,831 |
$11,740 |
11/30/2025 |
$10,904 |
$11,813 |
12/31/2025 |
$10,864 |
$11,795 |
1/31/2026 |
$10,890 |
$11,808 |
2/28/2026 |
$11,067 |
$12,001 |
3/31/2026 |
$10,855 |
$11,789 |
4/30/2026 |
$10,871 |
$11,803 |
|
| Average Annual Return [Table Text Block] |
|
|
Table Summary
AATR |
1 Year |
5 Years |
10 Years |
Class C |
3.10 |
(0.85) |
0.84 |
Class C with Load |
2.10 |
(0.85) |
0.84 |
Bloomberg U.S. Aggregate Bond Index |
4.06 |
0.18 |
1.67 | |
| No Deduction of Taxes [Text Block] |
|
|
do not reflect taxes that a shareholder may pay on an investment in a fund.
|
| AssetsNet |
|
|
$ 4,588,353,944
|
| Holdings Count | Holding |
|
|
993
|
| Advisory Fees Paid, Amount |
[10] |
|
$ 13,765,868
|
| InvestmentCompanyPortfolioTurnover |
|
|
363.00%
|
| Additional Fund Statistics [Text Block] |
|
|
Table Summary
Total net assets |
$4,588,353,944 |
# of portfolio holdings |
993 |
Portfolio turnover rate |
363% |
Total advisory fees paid |
$13,765,868Footnote Reference* |
| Footnote |
Description |
Footnote* |
Includes the fees charged by the Manager for providing advisory services to the Master Portfolio in which the Fund invests substantially all of its assets. | |
| Holdings [Text Block] |
|
|
PORTFOLIO ALLOCATION (% OF TOTAL INVESTMENT)
Table Summary
Agency securities |
37.9 |
U.S. Treasury securities |
25.8 |
Corporate bonds and notes |
23.3 |
Asset-backed securities |
5.8 |
Yankee corporate bonds and notes |
4.7 |
Non-agency mortgage-backed securities |
1.5 |
Yankee government bonds |
0.9 |
Municipal obligations |
0.1 | |
| Largest Holdings [Text Block] |
|
|
TOP TEN HOLDINGS (% OF NET ASSETS)
Table Summary
U.S. Treasury Notes, 3.88%, 4‑30‑2031 |
2.5 |
U.S. Treasury Notes, 3.63%, 8‑31‑2030 |
2.4 |
U.S. Treasury Bonds, 4.63%, 2‑15‑2046 |
2.3 |
FNMA, 5.50%, 6‑1‑2056 |
2.0 |
U.S. Treasury Bonds, 4.63%, 11‑15‑2055 |
1.8 |
U.S. Treasury Notes, 3.75%, 4‑30‑2028 |
1.7 |
U.S. Treasury Notes, 3.88%, 4‑30‑2030 |
1.7 |
FNMA, 5.00%, 5‑1‑2056 |
1.4 |
U.S. Treasury Bonds, 3.00%, 2‑15‑2049 |
1.1 |
U.S. Treasury Notes, 4.13%, 10‑31‑2027 |
1.1 | |
| Material Fund Change [Text Block] |
|
|
|
| C000120078 |
|
|
|
| Shareholder Report [Line Items] |
|
|
|
| Fund Name |
|
|
Core Bond Fund
|
| Class Name |
|
|
Class R6
|
| Trading Symbol |
|
|
WTRIX
|
| Annual or Semi-Annual Statement [Text Block] |
|
|
This annual shareholder report contains important information about Core Bond Fund for the period from May 1, 2025 to April 30, 2026.
|
| Additional Information [Text Block] |
|
|
You can find additional information about the Fund at allspringglobal.com. You can also request this information by contacting us at 1-800-222-8222.
|
| Additional Information Phone Number |
|
|
<span style="white-space: nowrap; box-sizing: border-box; color: rgb(0, 0, 0); display: inline; flex-wrap: nowrap; font-size: 12px; font-weight: 400; grid-area: auto; line-height: 18px; margin: 0px; overflow: visible; text-align: left; text-align-last: auto;"> 1-800-222-8222.</span>
|
| Additional Information Website |
|
|
<span style="box-sizing: border-box; color: rgb(0, 0, 0); display: inline; flex-wrap: nowrap; font-size: 12px; font-weight: 400; grid-area: auto; line-height: 18px; margin: 0px; overflow: visible; text-align: left; text-align-last: auto; white-space-collapse: preserve-breaks;">allspringglobal.com</span>
|
| Expenses [Text Block] |
|
|
What were the Fund costs for the past year?The table explains the costs you would have paid within the reporting period based on a hypothetical $10,000 investment.
Table Summary
CLASS NAME |
COSTS OF A $10,000 INVESTMENT |
COSTS PAID AS A % OF A $10,000 INVESTMENT |
Class R6 |
$34 |
0.33%Footnote Reference1 |
| Footnote |
Description |
Footnote1 |
Includes the fees charged by the Manager for providing advisory services to the Master Portfolio in which the Fund invests substantially all of its assets. | The manager has contractually committed to waive fees and/or reimburse certain expenses to the extent necessary to cap the Fund's total annual fund operating expense ratio at a specific amount. Without this cap, the costs shown above may have been higher. Please see the prospectus for the amount and the expiration date of the cap. Prior to or after the commitment expiration date, the cap may be increased or the commitment to maintain the cap may be terminated only with the approval of the Board of Trustees. |
| Expenses Paid, Amount |
|
|
$ 34
|
| Expense Ratio, Percent |
[11] |
|
0.33%
|
| Expenses Represent Both Master and Feeder [Text] |
|
|
Includes the fees charged by the Manager for providing advisory services to the Master Portfolio in which the Fund invests substantially all of its assets.
|
| Factors Affecting Performance [Text Block] |
|
|
How did the Fund perform last year and what affected its performance?The Fund outperformed its benchmark for the period. The market was shaped by frequent repricing of Federal Reserve expectations and bouts of rate volatility driven by trade headlines, increasing investment in artificial intelligence, and geopolitical conflict. Despite this volatility, interest rates generally remained within a range while demand for credit was resilient and most risk assets performed well. Our positioning was nimble, as we adjusted credit exposure during tariff- and geopolitically driven volatility. We maintained an overweight to mortgage-backed securities (MBS). Sector positioning was the largest contributor to performance. Security selection within MBS also contributed as elevated interest rate volatility and price dislocations provided opportunities to extract relative value. Our tactical positioning in the credit sector contributed, as did a sector overweight and security selection within asset-backed securities. Security selection within credit was a small detractor, driven primarily by technology holdings. Our underweight to commercial mortgage-backed securities also modestly detracted as the sector performed well. |
| Performance Past Does Not Indicate Future [Text] |
|
|
Figures quoted represent past performance, which is no guarantee of future results,
|
| Line Graph [Table Text Block] |
|
|
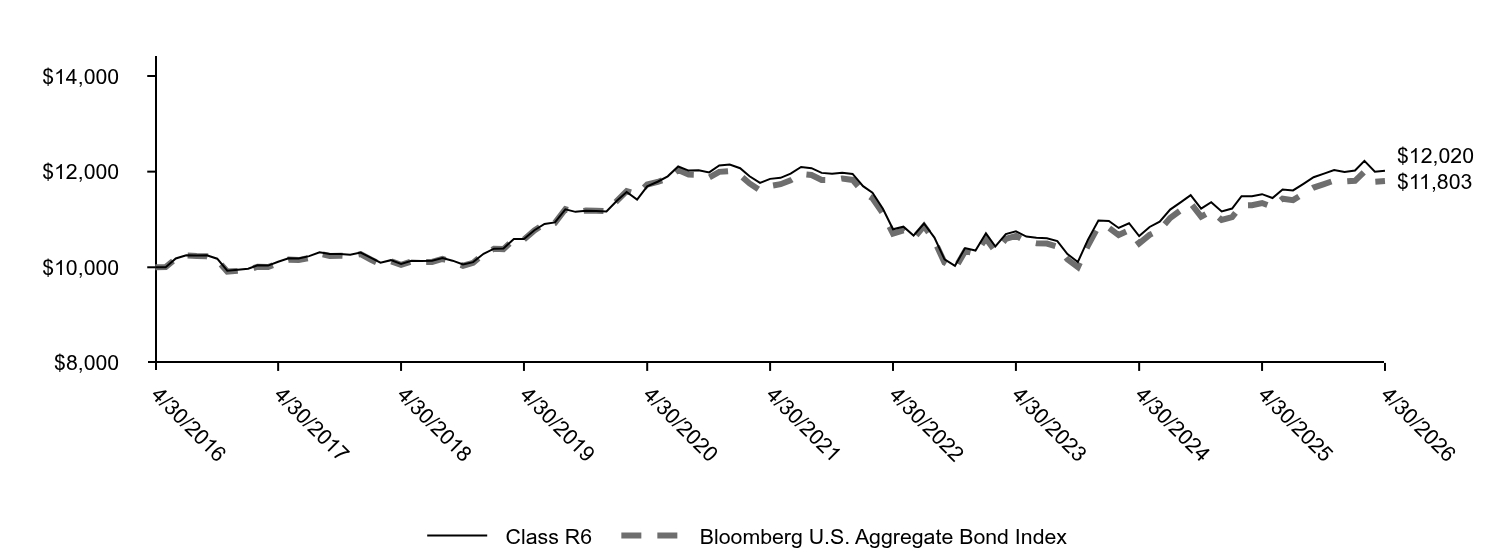
Table Summary
|
Class R6 |
Bloomberg U.S. Aggregate Bond Index |
4/30/2016 |
$10,000 |
$10,000 |
5/31/2016 |
$9,999 |
$10,003 |
6/30/2016 |
$10,184 |
$10,182 |
7/31/2016 |
$10,253 |
$10,247 |
8/31/2016 |
$10,244 |
$10,235 |
9/30/2016 |
$10,250 |
$10,229 |
10/31/2016 |
$10,179 |
$10,151 |
11/30/2016 |
$9,929 |
$9,911 |
12/31/2016 |
$9,947 |
$9,925 |
1/31/2017 |
$9,971 |
$9,944 |
2/28/2017 |
$10,042 |
$10,011 |
3/31/2017 |
$10,036 |
$10,006 |
4/30/2017 |
$10,116 |
$10,083 |
5/31/2017 |
$10,189 |
$10,160 |
6/30/2017 |
$10,183 |
$10,150 |
7/31/2017 |
$10,233 |
$10,194 |
8/31/2017 |
$10,314 |
$10,285 |
9/30/2017 |
$10,277 |
$10,236 |
10/31/2017 |
$10,278 |
$10,242 |
11/30/2017 |
$10,264 |
$10,229 |
12/31/2017 |
$10,307 |
$10,276 |
1/31/2018 |
$10,198 |
$10,158 |
2/28/2018 |
$10,097 |
$10,061 |
3/31/2018 |
$10,149 |
$10,126 |
4/30/2018 |
$10,072 |
$10,051 |
5/31/2018 |
$10,134 |
$10,122 |
6/30/2018 |
$10,132 |
$10,110 |
7/31/2018 |
$10,139 |
$10,112 |
8/31/2018 |
$10,195 |
$10,177 |
9/30/2018 |
$10,138 |
$10,112 |
10/31/2018 |
$10,058 |
$10,032 |
11/30/2018 |
$10,108 |
$10,092 |
12/31/2018 |
$10,282 |
$10,277 |
1/31/2019 |
$10,390 |
$10,386 |
2/28/2019 |
$10,391 |
$10,380 |
3/31/2019 |
$10,590 |
$10,580 |
4/30/2019 |
$10,591 |
$10,582 |
5/31/2019 |
$10,774 |
$10,770 |
6/30/2019 |
$10,906 |
$10,906 |
7/31/2019 |
$10,938 |
$10,930 |
8/31/2019 |
$11,212 |
$11,213 |
9/30/2019 |
$11,159 |
$11,153 |
10/31/2019 |
$11,181 |
$11,187 |
11/30/2019 |
$11,176 |
$11,181 |
12/31/2019 |
$11,168 |
$11,173 |
1/31/2020 |
$11,392 |
$11,388 |
2/29/2020 |
$11,573 |
$11,593 |
3/31/2020 |
$11,416 |
$11,525 |
4/30/2020 |
$11,692 |
$11,730 |
5/31/2020 |
$11,789 |
$11,784 |
6/30/2020 |
$11,902 |
$11,859 |
7/31/2020 |
$12,108 |
$12,036 |
8/31/2020 |
$12,022 |
$11,939 |
9/30/2020 |
$12,029 |
$11,932 |
10/31/2020 |
$11,984 |
$11,879 |
11/30/2020 |
$12,128 |
$11,995 |
12/31/2020 |
$12,149 |
$12,012 |
1/31/2021 |
$12,072 |
$11,926 |
2/28/2021 |
$11,904 |
$11,753 |
3/31/2021 |
$11,764 |
$11,607 |
4/30/2021 |
$11,849 |
$11,698 |
5/31/2021 |
$11,871 |
$11,737 |
6/30/2021 |
$11,957 |
$11,819 |
7/31/2021 |
$12,097 |
$11,951 |
8/31/2021 |
$12,072 |
$11,929 |
9/30/2021 |
$11,974 |
$11,825 |
10/31/2021 |
$11,958 |
$11,822 |
11/30/2021 |
$11,979 |
$11,857 |
12/31/2021 |
$11,952 |
$11,827 |
1/31/2022 |
$11,696 |
$11,572 |
2/28/2022 |
$11,560 |
$11,443 |
3/31/2022 |
$11,223 |
$11,125 |
4/30/2022 |
$10,794 |
$10,703 |
5/31/2022 |
$10,849 |
$10,772 |
6/30/2022 |
$10,664 |
$10,603 |
7/31/2022 |
$10,916 |
$10,862 |
8/31/2022 |
$10,620 |
$10,555 |
9/30/2022 |
$10,166 |
$10,099 |
10/31/2022 |
$10,030 |
$9,968 |
11/30/2022 |
$10,402 |
$10,335 |
12/31/2022 |
$10,351 |
$10,288 |
1/31/2023 |
$10,710 |
$10,604 |
2/28/2023 |
$10,435 |
$10,330 |
3/31/2023 |
$10,693 |
$10,593 |
4/30/2023 |
$10,753 |
$10,657 |
5/31/2023 |
$10,643 |
$10,541 |
6/30/2023 |
$10,620 |
$10,503 |
7/31/2023 |
$10,608 |
$10,496 |
8/31/2023 |
$10,549 |
$10,429 |
9/30/2023 |
$10,277 |
$10,164 |
10/31/2023 |
$10,112 |
$10,003 |
11/30/2023 |
$10,579 |
$10,456 |
12/31/2023 |
$10,980 |
$10,857 |
1/31/2024 |
$10,970 |
$10,827 |
2/29/2024 |
$10,822 |
$10,674 |
3/31/2024 |
$10,921 |
$10,773 |
4/30/2024 |
$10,653 |
$10,500 |
5/31/2024 |
$10,843 |
$10,678 |
6/30/2024 |
$10,954 |
$10,780 |
7/31/2024 |
$11,206 |
$11,031 |
8/31/2024 |
$11,358 |
$11,190 |
9/30/2024 |
$11,510 |
$11,340 |
10/31/2024 |
$11,227 |
$11,058 |
11/30/2024 |
$11,360 |
$11,175 |
12/31/2024 |
$11,167 |
$10,992 |
1/31/2025 |
$11,229 |
$11,051 |
2/28/2025 |
$11,486 |
$11,294 |
3/31/2025 |
$11,487 |
$11,298 |
4/30/2025 |
$11,529 |
$11,343 |
5/31/2025 |
$11,448 |
$11,261 |
6/30/2025 |
$11,627 |
$11,435 |
7/31/2025 |
$11,607 |
$11,404 |
8/31/2025 |
$11,745 |
$11,541 |
9/30/2025 |
$11,883 |
$11,667 |
10/31/2025 |
$11,959 |
$11,740 |
11/30/2025 |
$12,034 |
$11,813 |
12/31/2025 |
$11,992 |
$11,795 |
1/31/2026 |
$12,024 |
$11,808 |
2/28/2026 |
$12,226 |
$12,001 |
3/31/2026 |
$11,999 |
$11,789 |
4/30/2026 |
$12,020 |
$11,803 |
|
| Average Annual Return [Table Text Block] |
|
|
Table Summary
AATR |
1 Year |
5 Years |
10 Years |
Class R6 |
4.26 |
0.29 |
1.86 |
Bloomberg U.S. Aggregate Bond Index |
4.06 |
0.18 |
1.67 | |
| No Deduction of Taxes [Text Block] |
|
|
do not reflect taxes that a shareholder may pay on an investment in a fund.
|
| AssetsNet |
|
|
$ 4,588,353,944
|
| Holdings Count | Holding |
|
|
993
|
| Advisory Fees Paid, Amount |
[12] |
|
$ 13,765,868
|
| InvestmentCompanyPortfolioTurnover |
|
|
363.00%
|
| Additional Fund Statistics [Text Block] |
|
|
Table Summary
Total net assets |
$4,588,353,944 |
# of portfolio holdings |
993 |
Portfolio turnover rate |
363% |
Total advisory fees paid |
$13,765,868Footnote Reference* |
| Footnote |
Description |
Footnote* |
Includes the fees charged by the Manager for providing advisory services to the Master Portfolio in which the Fund invests substantially all of its assets. | |
| Holdings [Text Block] |
|
|
PORTFOLIO ALLOCATION (% OF TOTAL INVESTMENT)
Table Summary
Agency securities |
37.9 |
U.S. Treasury securities |
25.8 |
Corporate bonds and notes |
23.3 |
Asset-backed securities |
5.8 |
Yankee corporate bonds and notes |
4.7 |
Non-agency mortgage-backed securities |
1.5 |
Yankee government bonds |
0.9 |
Municipal obligations |
0.1 | |
| Largest Holdings [Text Block] |
|
|
TOP TEN HOLDINGS (% OF NET ASSETS)
Table Summary
U.S. Treasury Notes, 3.88%, 4‑30‑2031 |
2.5 |
U.S. Treasury Notes, 3.63%, 8‑31‑2030 |
2.4 |
U.S. Treasury Bonds, 4.63%, 2‑15‑2046 |
2.3 |
FNMA, 5.50%, 6‑1‑2056 |
2.0 |
U.S. Treasury Bonds, 4.63%, 11‑15‑2055 |
1.8 |
U.S. Treasury Notes, 3.75%, 4‑30‑2028 |
1.7 |
U.S. Treasury Notes, 3.88%, 4‑30‑2030 |
1.7 |
FNMA, 5.00%, 5‑1‑2056 |
1.4 |
U.S. Treasury Bonds, 3.00%, 2‑15‑2049 |
1.1 |
U.S. Treasury Notes, 4.13%, 10‑31‑2027 |
1.1 | |
| Material Fund Change [Text Block] |
|
|
|
| C000020337 |
|
|
|
| Shareholder Report [Line Items] |
|
|
|
| Fund Name |
|
|
Core Bond Fund
|
| Class Name |
|
|
Institutional Class
|
| Trading Symbol |
|
|
MBFIX
|
| Annual or Semi-Annual Statement [Text Block] |
|
|
This annual shareholder report contains important information about Core Bond Fund for the period from May 1, 2025 to April 30, 2026.
|
| Additional Information [Text Block] |
|
|
You can find additional information about the Fund at allspringglobal.com. You can also request this information by contacting us at 1-800-222-8222.
|
| Additional Information Phone Number |
|
|
<span style="white-space: nowrap; box-sizing: border-box; color: rgb(0, 0, 0); display: inline; flex-wrap: nowrap; font-size: 12px; font-weight: 400; grid-area: auto; line-height: 18px; margin: 0px; overflow: visible; text-align: left; text-align-last: auto;"> 1-800-222-8222.</span>
|
| Additional Information Website |
|
|
<span style="box-sizing: border-box; color: rgb(0, 0, 0); display: inline; flex-wrap: nowrap; font-size: 12px; font-weight: 400; grid-area: auto; line-height: 18px; margin: 0px; overflow: visible; text-align: left; text-align-last: auto; white-space-collapse: preserve-breaks;">allspringglobal.com</span>
|
| Expenses [Text Block] |
|
|
What were the Fund costs for the past year?The table explains the costs you would have paid within the reporting period based on a hypothetical $10,000 investment.
Table Summary
CLASS NAME |
COSTS OF A $10,000 INVESTMENT |
COSTS PAID AS A % OF A $10,000 INVESTMENT |
Institutional Class |
$39 |
0.38%Footnote Reference1 |
| Footnote |
Description |
Footnote1 |
Includes the fees charged by the Manager for providing advisory services to the Master Portfolio in which the Fund invests substantially all of its assets. | The manager has contractually committed to waive fees and/or reimburse certain expenses to the extent necessary to cap the Fund's total annual fund operating expense ratio at a specific amount. Without this cap, the costs shown above may have been higher. Please see the prospectus for the amount and the expiration date of the cap. Prior to or after the commitment expiration date, the cap may be increased or the commitment to maintain the cap may be terminated only with the approval of the Board of Trustees. |
| Expenses Paid, Amount |
|
|
$ 39
|
| Expense Ratio, Percent |
[13] |
|
0.38%
|
| Expenses Represent Both Master and Feeder [Text] |
|
|
Includes the fees charged by the Manager for providing advisory services to the Master Portfolio in which the Fund invests substantially all of its assets.
|
| Factors Affecting Performance [Text Block] |
|
|
How did the Fund perform last year and what affected its performance?The Fund outperformed its benchmark for the period. The market was shaped by frequent repricing of Federal Reserve expectations and bouts of rate volatility driven by trade headlines, increasing investment in artificial intelligence, and geopolitical conflict. Despite this volatility, interest rates generally remained within a range while demand for credit was resilient and most risk assets performed well. Our positioning was nimble, as we adjusted credit exposure during tariff- and geopolitically driven volatility. We maintained an overweight to mortgage-backed securities (MBS). Sector positioning was the largest contributor to performance. Security selection within MBS also contributed as elevated interest rate volatility and price dislocations provided opportunities to extract relative value. Our tactical positioning in the credit sector contributed, as did a sector overweight and security selection within asset-backed securities. Security selection within credit was a small detractor, driven primarily by technology holdings. Our underweight to commercial mortgage-backed securities also modestly detracted as the sector performed well. |
| Performance Past Does Not Indicate Future [Text] |
|
|
Figures quoted represent past performance, which is no guarantee of future results,
|
| Line Graph [Table Text Block] |
|
|
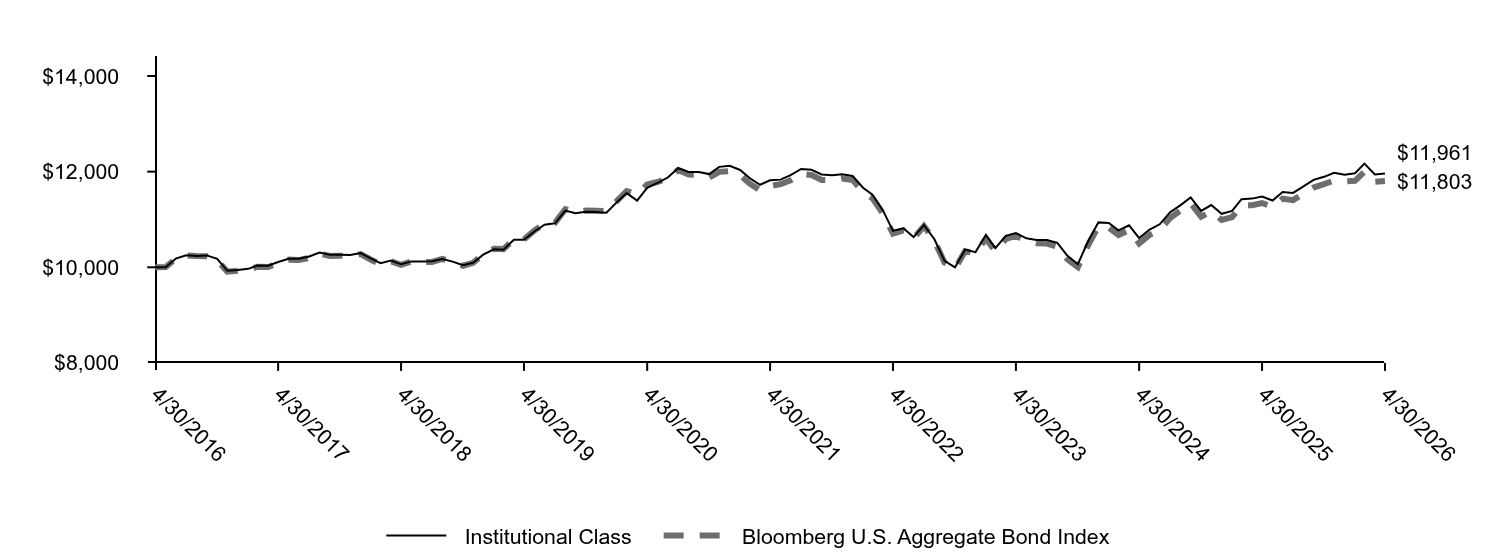
Table Summary
|
Institutional Class |
Bloomberg U.S. Aggregate Bond Index |
4/30/2016 |
$10,000 |
$10,000 |
5/31/2016 |
$9,999 |
$10,003 |
6/30/2016 |
$10,183 |
$10,182 |
7/31/2016 |
$10,252 |
$10,247 |
8/31/2016 |
$10,235 |
$10,235 |
9/30/2016 |
$10,248 |
$10,229 |
10/31/2016 |
$10,176 |
$10,151 |
11/30/2016 |
$9,926 |
$9,911 |
12/31/2016 |
$9,944 |
$9,925 |
1/31/2017 |
$9,967 |
$9,944 |
2/28/2017 |
$10,038 |
$10,011 |
3/31/2017 |
$10,031 |
$10,006 |
4/30/2017 |
$10,111 |
$10,083 |
5/31/2017 |
$10,176 |
$10,160 |
6/30/2017 |
$10,177 |
$10,150 |
7/31/2017 |
$10,227 |
$10,194 |
8/31/2017 |
$10,308 |
$10,285 |
9/30/2017 |
$10,262 |
$10,236 |
10/31/2017 |
$10,263 |
$10,242 |
11/30/2017 |
$10,256 |
$10,229 |
12/31/2017 |
$10,298 |
$10,276 |
1/31/2018 |
$10,181 |
$10,158 |
2/28/2018 |
$10,087 |
$10,061 |
3/31/2018 |
$10,139 |
$10,126 |
4/30/2018 |
$10,062 |
$10,051 |
5/31/2018 |
$10,123 |
$10,122 |
6/30/2018 |
$10,121 |
$10,110 |
7/31/2018 |
$10,127 |
$10,112 |
8/31/2018 |
$10,175 |
$10,177 |
9/30/2018 |
$10,118 |
$10,112 |
10/31/2018 |
$10,045 |
$10,032 |
11/30/2018 |
$10,095 |
$10,092 |
12/31/2018 |
$10,268 |
$10,277 |
1/31/2019 |
$10,376 |
$10,386 |
2/28/2019 |
$10,368 |
$10,380 |
3/31/2019 |
$10,575 |
$10,580 |
4/30/2019 |
$10,575 |
$10,582 |
5/31/2019 |
$10,749 |
$10,770 |
6/30/2019 |
$10,889 |
$10,906 |
7/31/2019 |
$10,920 |
$10,930 |
8/31/2019 |
$11,185 |
$11,213 |
9/30/2019 |
$11,131 |
$11,153 |
10/31/2019 |
$11,161 |
$11,187 |
11/30/2019 |
$11,156 |
$11,181 |
12/31/2019 |
$11,139 |
$11,173 |
1/31/2020 |
$11,362 |
$11,388 |
2/29/2020 |
$11,551 |
$11,593 |
3/31/2020 |
$11,393 |
$11,525 |
4/30/2020 |
$11,660 |
$11,730 |
5/31/2020 |
$11,765 |
$11,784 |
6/30/2020 |
$11,877 |
$11,859 |
7/31/2020 |
$12,073 |
$12,036 |
8/31/2020 |
$11,995 |
$11,939 |
9/30/2020 |
$11,994 |
$11,932 |
10/31/2020 |
$11,949 |
$11,879 |
11/30/2020 |
$12,100 |
$11,995 |
12/31/2020 |
$12,121 |
$12,012 |
1/31/2021 |
$12,035 |
$11,926 |
2/28/2021 |
$11,867 |
$11,753 |
3/31/2021 |
$11,726 |
$11,607 |
4/30/2021 |
$11,820 |
$11,698 |
5/31/2021 |
$11,833 |
$11,737 |
6/30/2021 |
$11,927 |
$11,819 |
7/31/2021 |
$12,056 |
$11,951 |
8/31/2021 |
$12,040 |
$11,929 |
9/30/2021 |
$11,942 |
$11,825 |
10/31/2021 |
$11,926 |
$11,822 |
11/30/2021 |
$11,946 |
$11,857 |
12/31/2021 |
$11,909 |
$11,827 |
1/31/2022 |
$11,663 |
$11,572 |
2/28/2022 |
$11,518 |
$11,443 |
3/31/2022 |
$11,190 |
$11,125 |
4/30/2022 |
$10,762 |
$10,703 |
5/31/2022 |
$10,816 |
$10,772 |
6/30/2022 |
$10,631 |
$10,603 |
7/31/2022 |
$10,882 |
$10,862 |
8/31/2022 |
$10,587 |
$10,555 |
9/30/2022 |
$10,134 |
$10,099 |
10/31/2022 |
$9,998 |
$9,968 |
11/30/2022 |
$10,369 |
$10,335 |
12/31/2022 |
$10,317 |
$10,288 |
1/31/2023 |
$10,674 |
$10,604 |
2/28/2023 |
$10,400 |
$10,330 |
3/31/2023 |
$10,657 |
$10,593 |
4/30/2023 |
$10,716 |
$10,657 |
5/31/2023 |
$10,606 |
$10,541 |
6/30/2023 |
$10,573 |
$10,503 |
7/31/2023 |
$10,570 |
$10,496 |
8/31/2023 |
$10,510 |
$10,429 |
9/30/2023 |
$10,239 |
$10,164 |
10/31/2023 |
$10,065 |
$10,003 |
11/30/2023 |
$10,539 |
$10,456 |
12/31/2023 |
$10,939 |
$10,857 |
1/31/2024 |
$10,928 |
$10,827 |
2/29/2024 |
$10,770 |
$10,674 |
3/31/2024 |
$10,878 |
$10,773 |
4/30/2024 |
$10,610 |
$10,500 |
5/31/2024 |
$10,790 |
$10,678 |
6/30/2024 |
$10,899 |
$10,780 |
7/31/2024 |
$11,150 |
$11,031 |
8/31/2024 |
$11,301 |
$11,190 |
9/30/2024 |
$11,462 |
$11,340 |
10/31/2024 |
$11,180 |
$11,058 |
11/30/2024 |
$11,301 |
$11,175 |
12/31/2024 |
$11,119 |
$10,992 |
1/31/2025 |
$11,180 |
$11,051 |
2/28/2025 |
$11,425 |
$11,294 |
3/31/2025 |
$11,436 |
$11,298 |
4/30/2025 |
$11,478 |
$11,343 |
5/31/2025 |
$11,396 |
$11,261 |
6/30/2025 |
$11,574 |
$11,435 |
7/31/2025 |
$11,554 |
$11,404 |
8/31/2025 |
$11,691 |
$11,541 |
9/30/2025 |
$11,828 |
$11,667 |
10/31/2025 |
$11,892 |
$11,740 |
11/30/2025 |
$11,977 |
$11,813 |
12/31/2025 |
$11,934 |
$11,795 |
1/31/2026 |
$11,966 |
$11,808 |
2/28/2026 |
$12,167 |
$12,001 |
3/31/2026 |
$11,940 |
$11,789 |
4/30/2026 |
$11,961 |
$11,803 |
|
| Average Annual Return [Table Text Block] |
|
|
Table Summary
AATR |
1 Year |
5 Years |
10 Years |
Institutional Class |
4.20 |
0.24 |
1.81 |
Bloomberg U.S. Aggregate Bond Index |
4.06 |
0.18 |
1.67 | |
| No Deduction of Taxes [Text Block] |
|
|
do not reflect taxes that a shareholder may pay on an investment in a fund.
|
| AssetsNet |
|
|
$ 4,588,353,944
|
| Holdings Count | Holding |
|
|
993
|
| Advisory Fees Paid, Amount |
[14] |
|
$ 13,765,868
|
| InvestmentCompanyPortfolioTurnover |
|
|
363.00%
|
| Additional Fund Statistics [Text Block] |
|
|
Table Summary
Total net assets |
$4,588,353,944 |
# of portfolio holdings |
993 |
Portfolio turnover rate |
363% |
Total advisory fees paid |
$13,765,868Footnote Reference* |
| Footnote |
Description |
Footnote* |
Includes the fees charged by the Manager for providing advisory services to the Master Portfolio in which the Fund invests substantially all of its assets. | |
| Holdings [Text Block] |
|
|
PORTFOLIO ALLOCATION (% OF TOTAL INVESTMENT)
Table Summary
Agency securities |
37.9 |
U.S. Treasury securities |
25.8 |
Corporate bonds and notes |
23.3 |
Asset-backed securities |
5.8 |
Yankee corporate bonds and notes |
4.7 |
Non-agency mortgage-backed securities |
1.5 |
Yankee government bonds |
0.9 |
Municipal obligations |
0.1 | |
| Largest Holdings [Text Block] |
|
|
TOP TEN HOLDINGS (% OF NET ASSETS)
Table Summary
U.S. Treasury Notes, 3.88%, 4‑30‑2031 |
2.5 |
U.S. Treasury Notes, 3.63%, 8‑31‑2030 |
2.4 |
U.S. Treasury Bonds, 4.63%, 2‑15‑2046 |
2.3 |
FNMA, 5.50%, 6‑1‑2056 |
2.0 |
U.S. Treasury Bonds, 4.63%, 11‑15‑2055 |
1.8 |
U.S. Treasury Notes, 3.75%, 4‑30‑2028 |
1.7 |
U.S. Treasury Notes, 3.88%, 4‑30‑2030 |
1.7 |
FNMA, 5.00%, 5‑1‑2056 |
1.4 |
U.S. Treasury Bonds, 3.00%, 2‑15‑2049 |
1.1 |
U.S. Treasury Notes, 4.13%, 10‑31‑2027 |
1.1 | |
| Material Fund Change [Text Block] |
|
|
|
| C000064993 |
|
|
|
| Shareholder Report [Line Items] |
|
|
|
| Fund Name |
|
|
Emerging Growth Fund
|
| Class Name |
|
|
Class A
|
| Trading Symbol |
|
|
WEMAX
|
| Annual or Semi-Annual Statement [Text Block] |
|
|
This annual shareholder report contains important information about Emerging Growth Fund for the period from May 1, 2025 to April 30, 2026.
|
| Additional Information [Text Block] |
|
|
You can find additional information about the Fund at allspringglobal.com. You can also request this information by contacting us at 1-800-222-8222.
|
| Additional Information Phone Number |
|
|
<span style="white-space: nowrap; box-sizing: border-box; color: rgb(0, 0, 0); display: inline; flex-wrap: nowrap; font-size: 12px; font-weight: 400; grid-area: auto; line-height: 18px; margin: 0px; overflow: visible; text-align: left; text-align-last: auto;"> 1-800-222-8222.</span>
|
| Additional Information Website |
|
|
<span style="box-sizing: border-box; color: rgb(0, 0, 0); display: inline; flex-wrap: nowrap; font-size: 12px; font-weight: 400; grid-area: auto; line-height: 18px; margin: 0px; overflow: visible; text-align: left; text-align-last: auto; white-space-collapse: preserve-breaks;">allspringglobal.com</span>
|
| Expenses [Text Block] |
|
|
What were the Fund costs for the past year?The table explains the costs you would have paid within the reporting period based on a hypothetical $10,000 investment.
Table Summary
CLASS NAME |
COSTS OF A $10,000 INVESTMENT |
COSTS PAID AS A % OF A $10,000 INVESTMENT |
Class A |
$141 |
1.20% | The manager has contractually committed to waive fees and/or reimburse certain expenses to the extent necessary to cap the Fund's total annual fund operating expense ratio at a specific amount. Without this cap, the costs shown above may have been higher. Please see the prospectus for the amount and the expiration date of the cap. Prior to or after the commitment expiration date, the cap may be increased or the commitment to maintain the cap may be terminated only with the approval of the Board of Trustees. |
| Expenses Paid, Amount |
|
|
$ 141
|
| Expense Ratio, Percent |
|
|
1.20%
|
| Factors Affecting Performance [Text Block] |
|
|
How did the Fund perform last year and what affected its performance?The Fund underperformed its benchmark, the Russell 2000® Growth Index, for the period. The 12-month period that ended on April 30, 2026, was a strong but volatile one for U.S. equities. Despite aggressive shifts in U.S. government policies, economic growth remained positive though slowing, inflation eased, and consumer strength persisted. Additionally, a super cycle of artificial intelligence (AI)-related investments continued and the race for computing power drove historically high index concentration. This sparked an intense focus on AI capital commitments, prompting concerns about future monetization and a potential bubble. With the outbreak of the Iran war, the period ended with elevated geopolitical risk and volatile shifts in market leadership. Against this backdrop, security selection within industrials contributed to performance, led by CECO Environmental Corp. and Argan, Inc., which benefited from strong demand tied to the buildout of cleaner, reliable power infrastructure. Holdings within information technology detracted from returns. We exited Commvault Systems, Inc. due to renewed pessimism around potential AI disruption in software. |
| Performance Past Does Not Indicate Future [Text] |
|
|
Figures quoted represent past performance, which is no guarantee of future results,
|
| Line Graph [Table Text Block] |
|
|
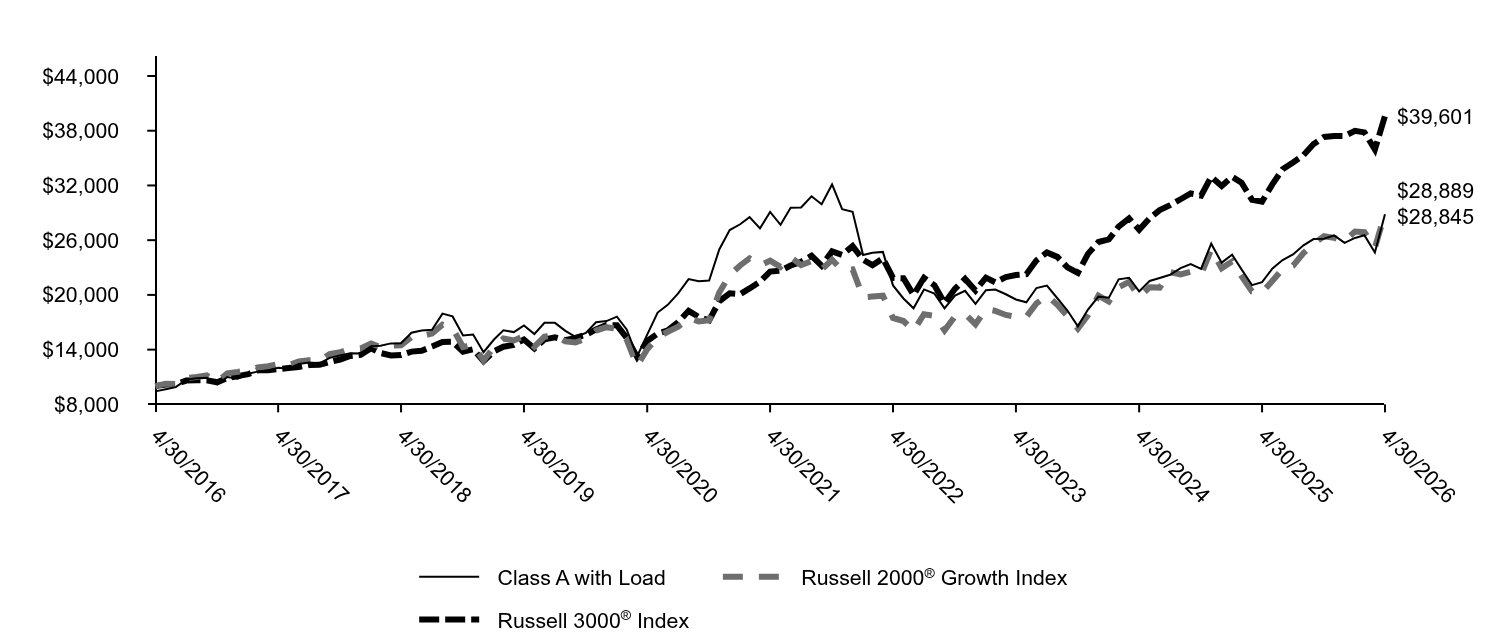
Table Summary
|
Class A with Load |
Russell 2000® Growth Index |
Russell 3000® Index |
4/30/2016 |
$9,425 |
$10,000 |
$10,000 |
5/31/2016 |
$9,664 |
$10,269 |
$10,179 |
6/30/2016 |
$9,887 |
$10,222 |
$10,200 |
7/31/2016 |
$10,711 |
$10,891 |
$10,605 |
8/31/2016 |
$10,850 |
$11,006 |
$10,632 |
9/30/2016 |
$10,919 |
$11,165 |
$10,648 |
10/31/2016 |
$10,195 |
$10,471 |
$10,418 |
11/30/2016 |
$11,004 |
$11,408 |
$10,884 |
12/31/2016 |
$10,811 |
$11,563 |
$11,097 |
1/31/2017 |
$11,351 |
$11,751 |
$11,305 |
2/28/2017 |
$11,588 |
$12,039 |
$11,726 |
3/31/2017 |
$11,719 |
$12,182 |
$11,734 |
4/30/2017 |
$12,014 |
$12,406 |
$11,858 |
5/31/2017 |
$11,924 |
$12,293 |
$11,980 |
6/30/2017 |
$12,423 |
$12,717 |
$12,088 |
7/31/2017 |
$12,587 |
$12,825 |
$12,316 |
8/31/2017 |
$12,489 |
$12,810 |
$12,339 |
9/30/2017 |
$13,094 |
$13,507 |
$12,640 |
10/31/2017 |
$13,364 |
$13,717 |
$12,916 |
11/30/2017 |
$13,610 |
$14,110 |
$13,308 |
12/31/2017 |
$13,588 |
$14,127 |
$13,441 |
1/31/2018 |
$14,369 |
$14,677 |
$14,150 |
2/28/2018 |
$14,434 |
$14,259 |
$13,628 |
3/31/2018 |
$14,685 |
$14,451 |
$13,355 |
4/30/2018 |
$14,695 |
$14,466 |
$13,406 |
5/31/2018 |
$15,848 |
$15,376 |
$13,784 |
6/30/2018 |
$16,108 |
$15,497 |
$13,874 |
7/31/2018 |
$16,174 |
$15,763 |
$14,335 |
8/31/2018 |
$17,950 |
$16,744 |
$14,838 |
9/30/2018 |
$17,643 |
$16,353 |
$14,863 |
10/31/2018 |
$15,560 |
$14,283 |
$13,768 |
11/30/2018 |
$15,653 |
$14,507 |
$14,044 |
12/31/2018 |
$13,714 |
$12,812 |
$12,737 |
1/31/2019 |
$15,110 |
$14,291 |
$13,830 |
2/28/2019 |
$16,110 |
$15,214 |
$14,316 |
3/31/2019 |
$15,924 |
$15,008 |
$14,526 |
4/30/2019 |
$16,657 |
$15,465 |
$15,106 |
5/31/2019 |
$15,714 |
$14,318 |
$14,128 |
6/30/2019 |
$16,936 |
$15,421 |
$15,120 |
7/31/2019 |
$16,936 |
$15,571 |
$15,345 |
8/31/2019 |
$16,052 |
$14,900 |
$15,032 |
9/30/2019 |
$15,389 |
$14,777 |
$15,296 |
10/31/2019 |
$15,842 |
$15,198 |
$15,625 |
11/30/2019 |
$16,994 |
$16,092 |
$16,219 |
12/31/2019 |
$17,133 |
$16,461 |
$16,688 |
1/31/2020 |
$17,612 |
$16,280 |
$16,669 |
2/29/2020 |
$16,212 |
$15,104 |
$15,305 |
3/31/2020 |
$13,252 |
$12,220 |
$13,200 |
4/30/2020 |
$15,647 |
$14,040 |
$14,948 |
5/31/2020 |
$18,067 |
$15,367 |
$15,748 |
6/30/2020 |
$18,914 |
$15,957 |
$16,108 |
7/31/2020 |
$20,167 |
$16,505 |
$17,022 |
8/31/2020 |
$21,739 |
$17,474 |
$18,255 |
9/30/2020 |
$21,505 |
$17,099 |
$17,591 |
10/31/2020 |
$21,567 |
$17,229 |
$17,211 |
11/30/2020 |
$24,981 |
$20,267 |
$19,305 |
12/31/2020 |
$27,114 |
$22,162 |
$20,173 |
1/31/2021 |
$27,743 |
$23,230 |
$20,084 |
2/28/2021 |
$28,525 |
$23,997 |
$20,711 |
3/31/2021 |
$27,298 |
$23,242 |
$21,454 |
4/30/2021 |
$29,093 |
$23,749 |
$22,560 |
5/31/2021 |
$27,682 |
$23,071 |
$22,663 |
6/30/2021 |
$29,568 |
$24,153 |
$23,222 |
7/31/2021 |
$29,583 |
$23,273 |
$23,614 |
8/31/2021 |
$30,810 |
$23,696 |
$24,288 |
9/30/2021 |
$29,936 |
$22,787 |
$23,198 |
10/31/2021 |
$32,114 |
$23,855 |
$24,767 |
11/30/2021 |
$29,399 |
$22,689 |
$24,390 |
12/31/2021 |
$29,119 |
$22,790 |
$25,350 |
1/31/2022 |
$24,365 |
$19,736 |
$23,859 |
2/28/2022 |
$24,629 |
$19,822 |
$23,258 |
3/31/2022 |
$24,717 |
$19,912 |
$24,012 |
4/30/2022 |
$21,042 |
$17,469 |
$21,857 |
5/31/2022 |
$19,611 |
$17,139 |
$21,828 |
6/30/2022 |
$18,532 |
$16,078 |
$20,002 |
7/31/2022 |
$20,601 |
$17,878 |
$21,878 |
8/31/2022 |
$20,139 |
$17,710 |
$21,062 |
9/30/2022 |
$18,532 |
$16,117 |
$19,109 |
10/31/2022 |
$19,919 |
$17,647 |
$20,676 |
11/30/2022 |
$20,447 |
$17,934 |
$21,755 |
12/31/2022 |
$19,017 |
$16,783 |
$20,481 |
1/31/2023 |
$20,513 |
$18,453 |
$21,892 |
2/28/2023 |
$20,579 |
$18,253 |
$21,380 |
3/31/2023 |
$20,073 |
$17,802 |
$21,952 |
4/30/2023 |
$19,501 |
$17,596 |
$22,186 |
5/31/2023 |
$19,193 |
$17,599 |
$22,272 |
6/30/2023 |
$20,755 |
$19,058 |
$23,793 |
7/31/2023 |
$21,019 |
$19,949 |
$24,646 |
8/31/2023 |
$19,633 |
$18,910 |
$24,170 |
9/30/2023 |
$18,290 |
$17,663 |
$23,019 |
10/31/2023 |
$16,551 |
$16,301 |
$22,408 |
11/30/2023 |
$18,400 |
$17,785 |
$24,498 |
12/31/2023 |
$19,809 |
$19,915 |
$25,797 |
1/31/2024 |
$19,699 |
$19,276 |
$26,083 |
2/29/2024 |
$21,702 |
$20,842 |
$27,495 |
3/31/2024 |
$21,878 |
$21,425 |
$28,382 |
4/30/2024 |
$20,381 |
$19,775 |
$27,133 |
5/31/2024 |
$21,526 |
$20,834 |
$28,415 |
6/30/2024 |
$21,856 |
$20,799 |
$29,295 |
7/31/2024 |
$22,208 |
$22,502 |
$29,839 |
8/31/2024 |
$22,934 |
$22,253 |
$30,489 |
9/30/2024 |
$23,375 |
$22,548 |
$31,120 |
10/31/2024 |
$22,846 |
$22,249 |
$30,891 |
11/30/2024 |
$25,620 |
$24,977 |
$32,946 |
12/31/2024 |
$23,536 |
$22,933 |
$31,939 |
1/31/2025 |
$24,413 |
$23,658 |
$32,947 |
2/28/2025 |
$22,802 |
$22,056 |
$32,316 |
3/31/2025 |
$21,071 |
$20,383 |
$30,431 |
4/30/2025 |
$21,403 |
$20,253 |
$30,227 |
5/31/2025 |
$22,896 |
$21,553 |
$32,143 |
6/30/2025 |
$23,821 |
$22,822 |
$33,776 |
7/31/2025 |
$24,442 |
$23,211 |
$34,520 |
8/31/2025 |
$25,440 |
$24,584 |
$35,318 |
9/30/2025 |
$26,122 |
$25,605 |
$36,537 |
10/31/2025 |
$26,149 |
$26,434 |
$37,320 |
11/30/2025 |
$26,516 |
$26,253 |
$37,423 |
12/31/2025 |
$25,714 |
$25,917 |
$37,415 |
1/31/2026 |
$26,245 |
$26,947 |
$37,996 |
2/28/2026 |
$26,537 |
$26,882 |
$37,815 |
3/31/2026 |
$24,653 |
$25,189 |
$35,935 |
4/30/2026 |
$28,845 |
$28,889 |
$39,601 |
|
| Average Annual Return [Table Text Block] |
|
|
Table Summary
AATR |
1 Year |
5 Years |
10 Years |
Class A |
34.77 |
(0.17) |
11.84 |
Class A with Load |
27.02 |
(1.35) |
11.18 |
Russell 2000® Growth Index |
42.64 |
4.00 |
11.19 |
Russell 3000® Index |
31.01 |
11.91 |
14.75 | |
| No Deduction of Taxes [Text Block] |
|
|
do not reflect taxes that a shareholder may pay on an investment in a fund.
|
| AssetsNet |
|
|
$ 324,538,507
|
| Holdings Count | Holding |
|
|
80
|
| Advisory Fees Paid, Amount |
|
|
$ 1,986,022
|
| InvestmentCompanyPortfolioTurnover |
|
|
58.00%
|
| Additional Fund Statistics [Text Block] |
|
|
Table Summary
Total net assets |
$324,538,507 |
# of portfolio holdings |
80 |
Portfolio turnover rate |
58% |
Total advisory fees paid |
$1,986,022 | |
| Holdings [Text Block] |
|
|
SECTOR ALLOCATION (% OF LONG-TERM INVESTMENTS)
Table Summary
Industrials |
36.1 |
Health care |
23.2 |
Information technology |
22.5 |
Consumer discretionary |
6.9 |
Financials |
6.4 |
Utilities |
1.9 |
Real estate |
1.4 |
Consumer staples |
1.2 |
Energy |
0.4 | |
| Largest Holdings [Text Block] |
|
|
TOP TEN HOLDINGS (% OF NET ASSETS)
Table Summary
Bloom Energy Corp. Class A |
3.7 |
Fabrinet |
3.5 |
Modine Manufacturing Co. |
2.7 |
Construction Partners, Inc. Class A |
2.6 |
Semtech Corp. |
2.4 |
Legence Corp. Class A |
2.2 |
Ensign Group, Inc. |
2.2 |
Viavi Solutions, Inc. |
2.2 |
Carpenter Technology Corp. |
2.1 |
RBC Bearings, Inc. |
2.0 | |
| Material Fund Change [Text Block] |
|
|
|
| C000205249 |
|
|
|
| Shareholder Report [Line Items] |
|
|
|
| Fund Name |
|
|
Emerging Growth Fund
|
| Class Name |
|
|
Class R6
|
| Trading Symbol |
|
|
WEGRX
|
| Annual or Semi-Annual Statement [Text Block] |
|
|
This annual shareholder report contains important information about Emerging Growth Fund for the period from May 1, 2025 to April 30, 2026.
|
| Additional Information [Text Block] |
|
|
You can find additional information about the Fund at allspringglobal.com. You can also request this information by contacting us at 1-800-222-8222.
|
| Additional Information Phone Number |
|
|
<span style="white-space: nowrap; box-sizing: border-box; color: rgb(0, 0, 0); display: inline; flex-wrap: nowrap; font-size: 12px; font-weight: 400; grid-area: auto; line-height: 18px; margin: 0px; overflow: visible; text-align: left; text-align-last: auto;"> 1-800-222-8222.</span>
|
| Additional Information Website |
|
|
<span style="box-sizing: border-box; color: rgb(0, 0, 0); display: inline; flex-wrap: nowrap; font-size: 12px; font-weight: 400; grid-area: auto; line-height: 18px; margin: 0px; overflow: visible; text-align: left; text-align-last: auto; white-space-collapse: preserve-breaks;">allspringglobal.com</span>
|
| Expenses [Text Block] |
|
|
What were the Fund costs for the past year?The table explains the costs you would have paid within the reporting period based on a hypothetical $10,000 investment.
Table Summary
CLASS NAME |
COSTS OF A $10,000 INVESTMENT |
COSTS PAID AS A % OF A $10,000 INVESTMENT |
Class R6 |
$94 |
0.80% | The manager has contractually committed to waive fees and/or reimburse certain expenses to the extent necessary to cap the Fund's total annual fund operating expense ratio at a specific amount. Without this cap, the costs shown above may have been higher. Please see the prospectus for the amount and the expiration date of the cap. Prior to or after the commitment expiration date, the cap may be increased or the commitment to maintain the cap may be terminated only with the approval of the Board of Trustees. |
| Expenses Paid, Amount |
|
|
$ 94
|
| Expense Ratio, Percent |
|
|
0.80%
|
| Factors Affecting Performance [Text Block] |
|
|
How did the Fund perform last year and what affected its performance?The Fund underperformed its benchmark, the Russell 2000® Growth Index, for the period. The 12-month period that ended on April 30, 2026, was a strong but volatile one for U.S. equities. Despite aggressive shifts in U.S. government policies, economic growth remained positive though slowing, inflation eased, and consumer strength persisted. Additionally, a super cycle of artificial intelligence (AI)-related investments continued and the race for computing power drove historically high index concentration. This sparked an intense focus on AI capital commitments, prompting concerns about future monetization and a potential bubble. With the outbreak of the Iran war, the period ended with elevated geopolitical risk and volatile shifts in market leadership. Against this backdrop, security selection within industrials contributed to performance, led by CECO Environmental Corp. and Argan, Inc., which benefited from strong demand tied to the buildout of cleaner, reliable power infrastructure. Holdings within information technology detracted from returns. We exited Commvault Systems, Inc. due to renewed pessimism around potential AI disruption in software. |
| Performance Past Does Not Indicate Future [Text] |
|
|
Figures quoted represent past performance, which is no guarantee of future results,
|
| Line Graph [Table Text Block] |
|
|
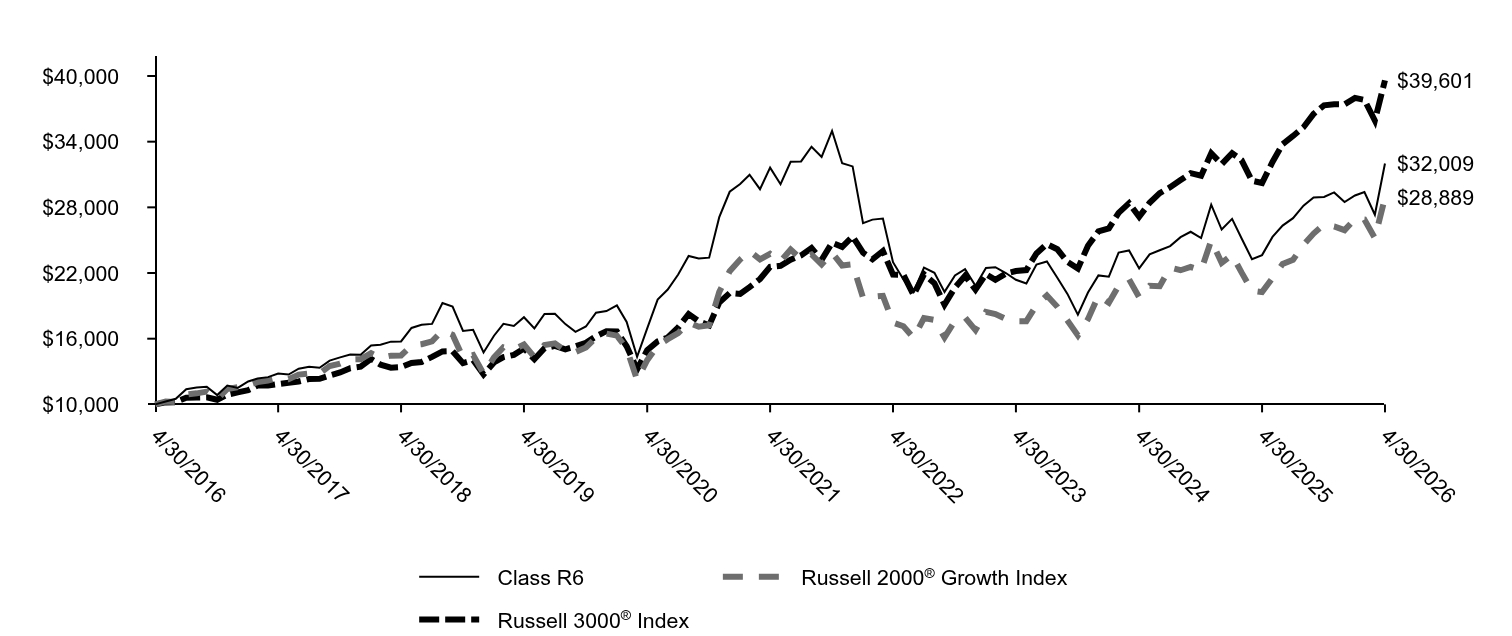
Table Summary
|
Class R6 |
Russell 2000® Growth Index |
Russell 3000® Index |
4/30/2016 |
$10,000 |
$10,000 |
$10,000 |
5/31/2016 |
$10,256 |
$10,269 |
$10,179 |
6/30/2016 |
$10,505 |
$10,222 |
$10,200 |
7/31/2016 |
$11,383 |
$10,891 |
$10,605 |
8/31/2016 |
$11,531 |
$11,006 |
$10,632 |
9/30/2016 |
$11,616 |
$11,165 |
$10,648 |
10/31/2016 |
$10,847 |
$10,471 |
$10,418 |
11/30/2016 |
$11,717 |
$11,408 |
$10,884 |
12/31/2016 |
$11,507 |
$11,563 |
$11,097 |
1/31/2017 |
$12,092 |
$11,751 |
$11,305 |
2/28/2017 |
$12,355 |
$12,039 |
$11,726 |
3/31/2017 |
$12,487 |
$12,182 |
$11,734 |
4/30/2017 |
$12,808 |
$12,406 |
$11,858 |
5/31/2017 |
$12,726 |
$12,293 |
$11,980 |
6/30/2017 |
$13,261 |
$12,717 |
$12,088 |
7/31/2017 |
$13,442 |
$12,825 |
$12,316 |
8/31/2017 |
$13,343 |
$12,810 |
$12,339 |
9/30/2017 |
$13,993 |
$13,507 |
$12,640 |
10/31/2017 |
$14,290 |
$13,717 |
$12,916 |
11/30/2017 |
$14,553 |
$14,110 |
$13,308 |
12/31/2017 |
$14,531 |
$14,127 |
$13,441 |
1/31/2018 |
$15,375 |
$14,677 |
$14,150 |
2/28/2018 |
$15,449 |
$14,259 |
$13,628 |
3/31/2018 |
$15,728 |
$14,451 |
$13,355 |
4/30/2018 |
$15,746 |
$14,466 |
$13,406 |
5/31/2018 |
$16,981 |
$15,376 |
$13,784 |
6/30/2018 |
$17,268 |
$15,497 |
$13,874 |
7/31/2018 |
$17,352 |
$15,763 |
$14,335 |
8/31/2018 |
$19,263 |
$16,744 |
$14,838 |
9/30/2018 |
$18,938 |
$16,353 |
$14,863 |
10/31/2018 |
$16,711 |
$14,283 |
$13,768 |
11/30/2018 |
$16,814 |
$14,507 |
$14,044 |
12/31/2018 |
$14,743 |
$12,812 |
$12,737 |
1/31/2019 |
$16,271 |
$14,291 |
$13,830 |
2/28/2019 |
$17,354 |
$15,214 |
$14,316 |
3/31/2019 |
$17,160 |
$15,008 |
$14,526 |
4/30/2019 |
$17,958 |
$15,465 |
$15,106 |
5/31/2019 |
$16,943 |
$14,318 |
$14,128 |
6/30/2019 |
$18,266 |
$15,421 |
$15,120 |
7/31/2019 |
$18,277 |
$15,571 |
$15,345 |
8/31/2019 |
$17,331 |
$14,900 |
$15,032 |
9/30/2019 |
$16,624 |
$14,777 |
$15,296 |
10/31/2019 |
$17,114 |
$15,198 |
$15,625 |
11/30/2019 |
$18,369 |
$16,092 |
$16,219 |
12/31/2019 |
$18,528 |
$16,461 |
$16,688 |
1/31/2020 |
$19,044 |
$16,280 |
$16,669 |
2/29/2020 |
$17,534 |
$15,104 |
$15,305 |
3/31/2020 |
$14,348 |
$12,220 |
$13,200 |
4/30/2020 |
$16,936 |
$14,040 |
$14,948 |
5/31/2020 |
$19,570 |
$15,367 |
$15,748 |
6/30/2020 |
$20,493 |
$15,957 |
$16,108 |
7/31/2020 |
$21,858 |
$16,505 |
$17,022 |
8/31/2020 |
$23,559 |
$17,474 |
$18,255 |
9/30/2020 |
$23,319 |
$17,099 |
$17,591 |
10/31/2020 |
$23,403 |
$17,229 |
$17,211 |
11/30/2020 |
$27,104 |
$20,267 |
$19,305 |
12/31/2020 |
$29,424 |
$22,162 |
$20,173 |
1/31/2021 |
$30,138 |
$23,230 |
$20,084 |
2/28/2021 |
$30,984 |
$23,997 |
$20,711 |
3/31/2021 |
$29,657 |
$23,242 |
$21,454 |
4/30/2021 |
$31,626 |
$23,749 |
$22,560 |
5/31/2021 |
$30,109 |
$23,071 |
$22,663 |
6/30/2021 |
$32,166 |
$24,153 |
$23,222 |
7/31/2021 |
$32,195 |
$23,273 |
$23,614 |
8/31/2021 |
$33,537 |
$23,696 |
$24,288 |
9/30/2021 |
$32,604 |
$22,787 |
$23,198 |
10/31/2021 |
$34,981 |
$23,855 |
$24,767 |
11/30/2021 |
$32,035 |
$22,689 |
$24,390 |
12/31/2021 |
$31,739 |
$22,790 |
$25,350 |
1/31/2022 |
$26,562 |
$19,736 |
$23,859 |
2/28/2022 |
$26,879 |
$19,822 |
$23,258 |
3/31/2022 |
$26,978 |
$19,912 |
$24,012 |
4/30/2022 |
$22,991 |
$17,469 |
$21,857 |
5/31/2022 |
$21,404 |
$17,139 |
$21,828 |
6/30/2022 |
$20,254 |
$16,078 |
$20,002 |
7/31/2022 |
$22,495 |
$17,878 |
$21,878 |
8/31/2022 |
$22,019 |
$17,710 |
$21,062 |
9/30/2022 |
$20,274 |
$16,117 |
$19,109 |
10/31/2022 |
$21,781 |
$17,647 |
$20,676 |
11/30/2022 |
$22,356 |
$17,934 |
$21,755 |
12/31/2022 |
$20,829 |
$16,783 |
$20,481 |
1/31/2023 |
$22,456 |
$18,453 |
$21,892 |
2/28/2023 |
$22,535 |
$18,253 |
$21,380 |
3/31/2023 |
$21,999 |
$17,802 |
$21,952 |
4/30/2023 |
$21,384 |
$17,596 |
$22,186 |
5/31/2023 |
$21,047 |
$17,599 |
$22,272 |
6/30/2023 |
$22,773 |
$19,058 |
$23,793 |
7/31/2023 |
$23,051 |
$19,949 |
$24,646 |
8/31/2023 |
$21,563 |
$18,910 |
$24,170 |
9/30/2023 |
$20,095 |
$17,663 |
$23,019 |
10/31/2023 |
$18,191 |
$16,301 |
$22,408 |
11/30/2023 |
$20,214 |
$17,785 |
$24,498 |
12/31/2023 |
$21,781 |
$19,915 |
$25,797 |
1/31/2024 |
$21,662 |
$19,276 |
$26,083 |
2/29/2024 |
$23,864 |
$20,842 |
$27,495 |
3/31/2024 |
$24,062 |
$21,425 |
$28,382 |
4/30/2024 |
$22,416 |
$19,775 |
$27,133 |
5/31/2024 |
$23,705 |
$20,834 |
$28,415 |
6/30/2024 |
$24,082 |
$20,799 |
$29,295 |
7/31/2024 |
$24,459 |
$22,502 |
$29,839 |
8/31/2024 |
$25,272 |
$22,253 |
$30,489 |
9/30/2024 |
$25,768 |
$22,548 |
$31,120 |
10/31/2024 |
$25,193 |
$22,249 |
$30,891 |
11/30/2024 |
$28,248 |
$24,977 |
$32,946 |
12/31/2024 |
$25,974 |
$22,933 |
$31,939 |
1/31/2025 |
$26,943 |
$23,658 |
$32,947 |
2/28/2025 |
$25,174 |
$22,056 |
$32,316 |
3/31/2025 |
$23,257 |
$20,383 |
$30,431 |
4/30/2025 |
$23,636 |
$20,253 |
$30,227 |
5/31/2025 |
$25,300 |
$21,553 |
$32,143 |
6/30/2025 |
$26,333 |
$22,822 |
$33,776 |
7/31/2025 |
$27,011 |
$23,211 |
$34,520 |
8/31/2025 |
$28,153 |
$24,584 |
$35,318 |
9/30/2025 |
$28,907 |
$25,605 |
$36,537 |
10/31/2025 |
$28,953 |
$26,434 |
$37,320 |
11/30/2025 |
$29,364 |
$26,253 |
$37,423 |
12/31/2025 |
$28,483 |
$25,917 |
$37,415 |
1/31/2026 |
$29,082 |
$26,947 |
$37,996 |
2/28/2026 |
$29,405 |
$26,882 |
$37,815 |
3/31/2026 |
$27,331 |
$25,189 |
$35,935 |
4/30/2026 |
$32,009 |
$28,889 |
$39,601 |
|
| Average Annual Return [Table Text Block] |
|
|
Table Summary
AATR |
1 Year |
5 Years |
10 Years |
Class R6Footnote Reference* |
35.42 |
0.24 |
12.34 |
Russell 2000® Growth Index |
42.64 |
4.00 |
11.19 |
Russell 3000® Index |
31.01 |
11.91 |
14.75 | |
| No Deduction of Taxes [Text Block] |
|
|
do not reflect taxes that a shareholder may pay on an investment in a fund.
|
| AssetsNet |
|
|
$ 324,538,507
|
| Holdings Count | Holding |
|
|
80
|
| Advisory Fees Paid, Amount |
|
|
$ 1,986,022
|
| InvestmentCompanyPortfolioTurnover |
|
|
58.00%
|
| Additional Fund Statistics [Text Block] |
|
|
Table Summary
Total net assets |
$324,538,507 |
# of portfolio holdings |
80 |
Portfolio turnover rate |
58% |
Total advisory fees paid |
$1,986,022 | |
| Holdings [Text Block] |
|
|
SECTOR ALLOCATION (% OF LONG-TERM INVESTMENTS)
Table Summary
Industrials |
36.1 |
Health care |
23.2 |
Information technology |
22.5 |
Consumer discretionary |
6.9 |
Financials |
6.4 |
Utilities |
1.9 |
Real estate |
1.4 |
Consumer staples |
1.2 |
Energy |
0.4 | |
| Largest Holdings [Text Block] |
|
|
TOP TEN HOLDINGS (% OF NET ASSETS)
Table Summary
Bloom Energy Corp. Class A |
3.7 |
Fabrinet |
3.5 |
Modine Manufacturing Co. |
2.7 |
Construction Partners, Inc. Class A |
2.6 |
Semtech Corp. |
2.4 |
Legence Corp. Class A |
2.2 |
Ensign Group, Inc. |
2.2 |
Viavi Solutions, Inc. |
2.2 |
Carpenter Technology Corp. |
2.1 |
RBC Bearings, Inc. |
2.0 | |
| Material Fund Change [Text Block] |
|
|
|
| C000064995 |
|
|
|
| Shareholder Report [Line Items] |
|
|
|
| Fund Name |
|
|
Emerging Growth Fund
|
| Class Name |
|
|
Institutional Class
|
| Trading Symbol |
|
|
WEMIX
|
| Annual or Semi-Annual Statement [Text Block] |
|
|
This annual shareholder report contains important information about Emerging Growth Fund for the period from May 1, 2025 to April 30, 2026.
|
| Additional Information [Text Block] |
|
|
You can find additional information about the Fund at allspringglobal.com. You can also request this information by contacting us at 1-800-222-8222.
|
| Additional Information Phone Number |
|
|
<span style="white-space: nowrap; box-sizing: border-box; color: rgb(0, 0, 0); display: inline; flex-wrap: nowrap; font-size: 12px; font-weight: 400; grid-area: auto; line-height: 18px; margin: 0px; overflow: visible; text-align: left; text-align-last: auto;"> 1-800-222-8222.</span>
|
| Additional Information Website |
|
|
<span style="box-sizing: border-box; color: rgb(0, 0, 0); display: inline; flex-wrap: nowrap; font-size: 12px; font-weight: 400; grid-area: auto; line-height: 18px; margin: 0px; overflow: visible; text-align: left; text-align-last: auto; white-space-collapse: preserve-breaks;">allspringglobal.com</span>
|
| Expenses [Text Block] |
|
|
What were the Fund costs for the past year?The table explains the costs you would have paid within the reporting period based on a hypothetical $10,000 investment.
Table Summary
CLASS NAME |
COSTS OF A $10,000 INVESTMENT |
COSTS PAID AS A % OF A $10,000 INVESTMENT |
Institutional Class |
$106 |
0.90% | The manager has contractually committed to waive fees and/or reimburse certain expenses to the extent necessary to cap the Fund's total annual fund operating expense ratio at a specific amount. Without this cap, the costs shown above may have been higher. Please see the prospectus for the amount and the expiration date of the cap. Prior to or after the commitment expiration date, the cap may be increased or the commitment to maintain the cap may be terminated only with the approval of the Board of Trustees. |
| Expenses Paid, Amount |
|
|
$ 106
|
| Expense Ratio, Percent |
|
|
0.90%
|
| Factors Affecting Performance [Text Block] |
|
|
How did the Fund perform last year and what affected its performance?The Fund underperformed its benchmark, the Russell 2000® Growth Index, for the period. The 12-month period that ended on April 30, 2026, was a strong but volatile one for U.S. equities. Despite aggressive shifts in U.S. government policies, economic growth remained positive though slowing, inflation eased, and consumer strength persisted. Additionally, a super cycle of artificial intelligence (AI)-related investments continued and the race for computing power drove historically high index concentration. This sparked an intense focus on AI capital commitments, prompting concerns about future monetization and a potential bubble. With the outbreak of the Iran war, the period ended with elevated geopolitical risk and volatile shifts in market leadership. Against this backdrop, security selection within industrials contributed to performance, led by CECO Environmental Corp. and Argan, Inc., which benefited from strong demand tied to the buildout of cleaner, reliable power infrastructure. Holdings within information technology detracted from returns. We exited Commvault Systems, Inc. due to renewed pessimism around potential AI disruption in software. |
| Performance Past Does Not Indicate Future [Text] |
|
|
Figures quoted represent past performance, which is no guarantee of future results,
|
| Line Graph [Table Text Block] |
|
|
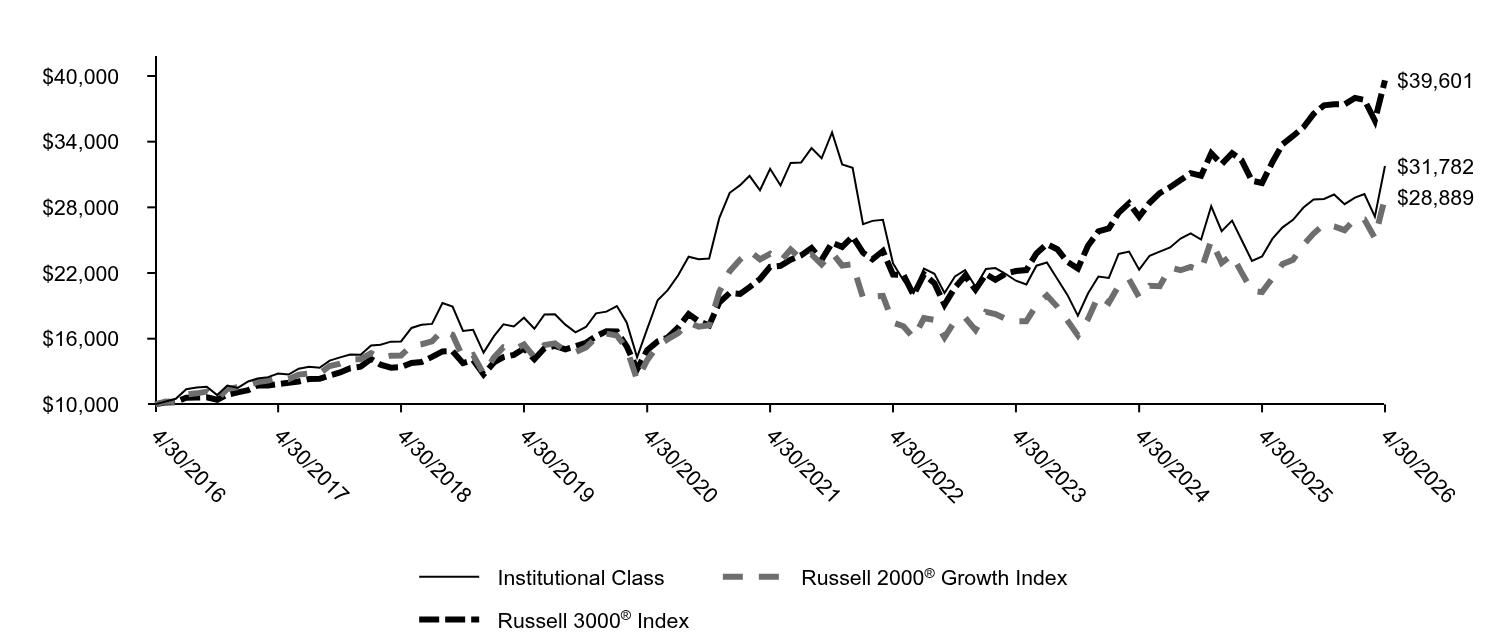
Table Summary
|
Institutional Class |
Russell 2000® Growth Index |
Russell 3000® Index |
4/30/2016 |
$10,000 |
$10,000 |
$10,000 |
5/31/2016 |
$10,256 |
$10,269 |
$10,179 |
6/30/2016 |
$10,505 |
$10,222 |
$10,200 |
7/31/2016 |
$11,383 |
$10,891 |
$10,605 |
8/31/2016 |
$11,531 |
$11,006 |
$10,632 |
9/30/2016 |
$11,616 |
$11,165 |
$10,648 |
10/31/2016 |
$10,847 |
$10,471 |
$10,418 |
11/30/2016 |
$11,717 |
$11,408 |
$10,884 |
12/31/2016 |
$11,507 |
$11,563 |
$11,097 |
1/31/2017 |
$12,092 |
$11,751 |
$11,305 |
2/28/2017 |
$12,355 |
$12,039 |
$11,726 |
3/31/2017 |
$12,487 |
$12,182 |
$11,734 |
4/30/2017 |
$12,808 |
$12,406 |
$11,858 |
5/31/2017 |
$12,726 |
$12,293 |
$11,980 |
6/30/2017 |
$13,261 |
$12,717 |
$12,088 |
7/31/2017 |
$13,442 |
$12,825 |
$12,316 |
8/31/2017 |
$13,343 |
$12,810 |
$12,339 |
9/30/2017 |
$13,993 |
$13,507 |
$12,640 |
10/31/2017 |
$14,290 |
$13,717 |
$12,916 |
11/30/2017 |
$14,553 |
$14,110 |
$13,308 |
12/31/2017 |
$14,531 |
$14,127 |
$13,441 |
1/31/2018 |
$15,375 |
$14,677 |
$14,150 |
2/28/2018 |
$15,449 |
$14,259 |
$13,628 |
3/31/2018 |
$15,728 |
$14,451 |
$13,355 |
4/30/2018 |
$15,746 |
$14,466 |
$13,406 |
5/31/2018 |
$16,981 |
$15,376 |
$13,784 |
6/30/2018 |
$17,268 |
$15,497 |
$13,874 |
7/31/2018 |
$17,352 |
$15,763 |
$14,335 |
8/31/2018 |
$19,254 |
$16,744 |
$14,838 |
9/30/2018 |
$18,929 |
$16,353 |
$14,863 |
10/31/2018 |
$16,702 |
$14,283 |
$13,768 |
11/30/2018 |
$16,814 |
$14,507 |
$14,044 |
12/31/2018 |
$14,731 |
$12,812 |
$12,737 |
1/31/2019 |
$16,236 |
$14,291 |
$13,830 |
2/28/2019 |
$17,308 |
$15,214 |
$14,316 |
3/31/2019 |
$17,114 |
$15,008 |
$14,526 |
4/30/2019 |
$17,913 |
$15,465 |
$15,106 |
5/31/2019 |
$16,909 |
$14,318 |
$14,128 |
6/30/2019 |
$18,220 |
$15,421 |
$15,120 |
7/31/2019 |
$18,232 |
$15,571 |
$15,345 |
8/31/2019 |
$17,285 |
$14,900 |
$15,032 |
9/30/2019 |
$16,579 |
$14,777 |
$15,296 |
10/31/2019 |
$17,069 |
$15,198 |
$15,625 |
11/30/2019 |
$18,312 |
$16,092 |
$16,219 |
12/31/2019 |
$18,471 |
$16,461 |
$16,688 |
1/31/2020 |
$18,986 |
$16,280 |
$16,669 |
2/29/2020 |
$17,489 |
$15,104 |
$15,305 |
3/31/2020 |
$14,302 |
$12,220 |
$13,200 |
4/30/2020 |
$16,890 |
$14,040 |
$14,948 |
5/31/2020 |
$19,513 |
$15,367 |
$15,748 |
6/30/2020 |
$20,435 |
$15,957 |
$16,108 |
7/31/2020 |
$21,789 |
$16,505 |
$17,022 |
8/31/2020 |
$23,490 |
$17,474 |
$18,255 |
9/30/2020 |
$23,250 |
$17,099 |
$17,591 |
10/31/2020 |
$23,322 |
$17,229 |
$17,211 |
11/30/2020 |
$27,012 |
$20,267 |
$19,305 |
12/31/2020 |
$29,330 |
$22,162 |
$20,173 |
1/31/2021 |
$30,031 |
$23,230 |
$20,084 |
2/28/2021 |
$30,877 |
$23,997 |
$20,711 |
3/31/2021 |
$29,563 |
$23,242 |
$21,454 |
4/30/2021 |
$31,520 |
$23,749 |
$22,560 |
5/31/2021 |
$30,001 |
$23,071 |
$22,663 |
6/30/2021 |
$32,060 |
$24,153 |
$23,222 |
7/31/2021 |
$32,089 |
$23,273 |
$23,614 |
8/31/2021 |
$33,418 |
$23,696 |
$24,288 |
9/30/2021 |
$32,483 |
$22,787 |
$23,198 |
10/31/2021 |
$34,848 |
$23,855 |
$24,767 |
11/30/2021 |
$31,929 |
$22,689 |
$24,390 |
12/31/2021 |
$31,615 |
$22,790 |
$25,350 |
1/31/2022 |
$26,465 |
$19,736 |
$23,859 |
2/28/2022 |
$26,764 |
$19,822 |
$23,258 |
3/31/2022 |
$26,863 |
$19,912 |
$24,012 |
4/30/2022 |
$22,886 |
$17,469 |
$21,857 |
5/31/2022 |
$21,315 |
$17,139 |
$21,828 |
6/30/2022 |
$20,162 |
$16,078 |
$20,002 |
7/31/2022 |
$22,409 |
$17,878 |
$21,878 |
8/31/2022 |
$21,932 |
$17,710 |
$21,062 |
9/30/2022 |
$20,182 |
$16,117 |
$19,109 |
10/31/2022 |
$21,693 |
$17,647 |
$20,676 |
11/30/2022 |
$22,270 |
$17,934 |
$21,755 |
12/31/2022 |
$20,739 |
$16,783 |
$20,481 |
1/31/2023 |
$22,369 |
$18,453 |
$21,892 |
2/28/2023 |
$22,449 |
$18,253 |
$21,380 |
3/31/2023 |
$21,912 |
$17,802 |
$21,952 |
4/30/2023 |
$21,296 |
$17,596 |
$22,186 |
5/31/2023 |
$20,958 |
$17,599 |
$22,272 |
6/30/2023 |
$22,668 |
$19,058 |
$23,793 |
7/31/2023 |
$22,966 |
$19,949 |
$24,646 |
8/31/2023 |
$21,455 |
$18,910 |
$24,170 |
9/30/2023 |
$20,003 |
$17,663 |
$23,019 |
10/31/2023 |
$18,094 |
$16,301 |
$22,408 |
11/30/2023 |
$20,122 |
$17,785 |
$24,498 |
12/31/2023 |
$21,673 |
$19,915 |
$25,797 |
1/31/2024 |
$21,554 |
$19,276 |
$26,083 |
2/29/2024 |
$23,741 |
$20,842 |
$27,495 |
3/31/2024 |
$23,960 |
$21,425 |
$28,382 |
4/30/2024 |
$22,310 |
$19,775 |
$27,133 |
5/31/2024 |
$23,582 |
$20,834 |
$28,415 |
6/30/2024 |
$23,960 |
$20,799 |
$29,295 |
7/31/2024 |
$24,338 |
$22,502 |
$29,839 |
8/31/2024 |
$25,153 |
$22,253 |
$30,489 |
9/30/2024 |
$25,630 |
$22,548 |
$31,120 |
10/31/2024 |
$25,054 |
$22,249 |
$30,891 |
11/30/2024 |
$28,096 |
$24,977 |
$32,946 |
12/31/2024 |
$25,816 |
$22,933 |
$31,939 |
1/31/2025 |
$26,788 |
$23,658 |
$32,947 |
2/28/2025 |
$25,034 |
$22,056 |
$32,316 |
3/31/2025 |
$23,112 |
$20,383 |
$30,431 |
4/30/2025 |
$23,513 |
$20,253 |
$30,227 |
5/31/2025 |
$25,140 |
$21,553 |
$32,143 |
6/30/2025 |
$26,175 |
$22,822 |
$33,776 |
7/31/2025 |
$26,857 |
$23,211 |
$34,520 |
8/31/2025 |
$27,981 |
$24,584 |
$35,318 |
9/30/2025 |
$28,715 |
$25,605 |
$36,537 |
10/31/2025 |
$28,761 |
$26,434 |
$37,320 |
11/30/2025 |
$29,174 |
$26,253 |
$37,423 |
12/31/2025 |
$28,290 |
$25,917 |
$37,415 |
1/31/2026 |
$28,891 |
$26,947 |
$37,996 |
2/28/2026 |
$29,215 |
$26,882 |
$37,815 |
3/31/2026 |
$27,156 |
$25,189 |
$35,935 |
4/30/2026 |
$31,782 |
$28,889 |
$39,601 |
|
| Average Annual Return [Table Text Block] |
|
|
Table Summary
AATR |
1 Year |
5 Years |
10 Years |
Institutional Class |
35.17 |
0.17 |
12.26 |
Russell 2000® Growth Index |
42.64 |
4.00 |
11.19 |
Russell 3000® Index |
31.01 |
11.91 |
14.75 | |
| No Deduction of Taxes [Text Block] |
|
|
do not reflect taxes that a shareholder may pay on an investment in a fund.
|
| AssetsNet |
|
|
$ 324,538,507
|
| Holdings Count | Holding |
|
|
80
|
| Advisory Fees Paid, Amount |
|
|
$ 1,986,022
|
| InvestmentCompanyPortfolioTurnover |
|
|
58.00%
|
| Additional Fund Statistics [Text Block] |
|
|
Table Summary
Total net assets |
$324,538,507 |
# of portfolio holdings |
80 |
Portfolio turnover rate |
58% |
Total advisory fees paid |
$1,986,022 | |
| Holdings [Text Block] |
|
|
SECTOR ALLOCATION (% OF LONG-TERM INVESTMENTS)
Table Summary
Industrials |
36.1 |
Health care |
23.2 |
Information technology |
22.5 |
Consumer discretionary |
6.9 |
Financials |
6.4 |
Utilities |
1.9 |
Real estate |
1.4 |
Consumer staples |
1.2 |
Energy |
0.4 | |
| Largest Holdings [Text Block] |
|
|
TOP TEN HOLDINGS (% OF NET ASSETS)
Table Summary
Bloom Energy Corp. Class A |
3.7 |
Fabrinet |
3.5 |
Modine Manufacturing Co. |
2.7 |
Construction Partners, Inc. Class A |
2.6 |
Semtech Corp. |
2.4 |
Legence Corp. Class A |
2.2 |
Ensign Group, Inc. |
2.2 |
Viavi Solutions, Inc. |
2.2 |
Carpenter Technology Corp. |
2.1 |
RBC Bearings, Inc. |
2.0 | |
| Material Fund Change [Text Block] |
|
|
|
| C000019957 |
|
|
|
| Shareholder Report [Line Items] |
|
|
|
| Fund Name |
|
|
Large Cap Value Fund
|
| Class Name |
|
|
Class A
|
| Trading Symbol |
|
|
CBEAX
|
| Annual or Semi-Annual Statement [Text Block] |
|
|
This annual shareholder report contains important information about Large Cap Value Fund for the period from May 1, 2025 to April 30, 2026.
|
| Additional Information [Text Block] |
|
|
You can find additional information about the Fund at allspringglobal.com. You can also request this information by contacting us at 1-800-222-8222.
|
| Material Fund Change Notice [Text Block] |
|
|
This report describes changes to the Fund that occurred either during or after the reporting period.
|
| Additional Information Phone Number |
|
|
<span style="white-space: nowrap; box-sizing: border-box; color: rgb(0, 0, 0); display: inline; flex-wrap: nowrap; font-size: 12px; font-weight: 400; grid-area: auto; line-height: 18px; margin: 0px; overflow: visible; text-align: left; text-align-last: auto;"> 1-800-222-8222.</span>
|
| Additional Information Website |
|
|
<span style="box-sizing: border-box; color: rgb(0, 0, 0); display: inline; flex-wrap: nowrap; font-size: 12px; font-weight: 400; grid-area: auto; line-height: 18px; margin: 0px; overflow: visible; text-align: left; text-align-last: auto; white-space-collapse: preserve-breaks;">allspringglobal.com</span>
|
| Expenses [Text Block] |
|
|
What were the Fund costs for the past year?The table explains the costs you would have paid within the reporting period based on a hypothetical $10,000 investment.
Table Summary
CLASS NAME |
COSTS OF A $10,000 INVESTMENT |
COSTS PAID AS A % OF A $10,000 INVESTMENT |
Class A |
$90 |
0.81%Footnote Reference1 |
| Footnote |
Description |
Footnote1 |
Expenses shown aggregate those of both the Fund and the Master Portfolio. | The manager has contractually committed to waive fees and/or reimburse certain expenses to the extent necessary to cap the Fund's total annual fund operating expense ratio at a specific amount. Without this cap, the costs shown above may have been higher. Please see the prospectus for the amount and the expiration date of the cap. Prior to or after the commitment expiration date, the cap may be increased or the commitment to maintain the cap may be terminated only with the approval of the Board of Trustees. |
| Expenses Paid, Amount |
|
|
$ 90
|
| Expense Ratio, Percent |
[15] |
|
0.81%
|
| Expenses Represent Both Master and Feeder [Text] |
|
|
Expenses shown aggregate those of both the Fund and the Master Portfolio.
|
| Factors Affecting Performance [Text Block] |
|
|
How did the Fund perform last year and what affected its performance?In a volatile year, the Fund underperformed its benchmark, driven by stock selection. Investors’ risk appetites fluctuated as the “tariff tantrum” led to a narrow, high-risk, low-quality, rally. Risk appetites became more balanced in October 2025 as investors digested inflation and employment data, emerging credit concerns, and skepticism about data center buildout skepticism. In March 2026, the Iran conflict led energy prices higher until a ceasefire was announced in April. The Fund made minor changes to sector allocation, increasing exposure to information technology while reducing exposure to financials. A large contributor was Citigroup, Inc., one of the world’s largest diversified financial institutions. Its management continues to exit lower margin, non-core franchises and cut costs to improve returns and reduce credit needs. The largest detractor was Fiserv, Inc. (This security was no longer held at the end of the reporting period.), a leading provider of financial technology platforms. Its management reset expectations across several business areas, tempering prior optimism built over years of strong performance. |
| Performance Past Does Not Indicate Future [Text] |
|
|
Figures quoted represent past performance, which is no guarantee of future results,
|
| Line Graph [Table Text Block] |
|
|
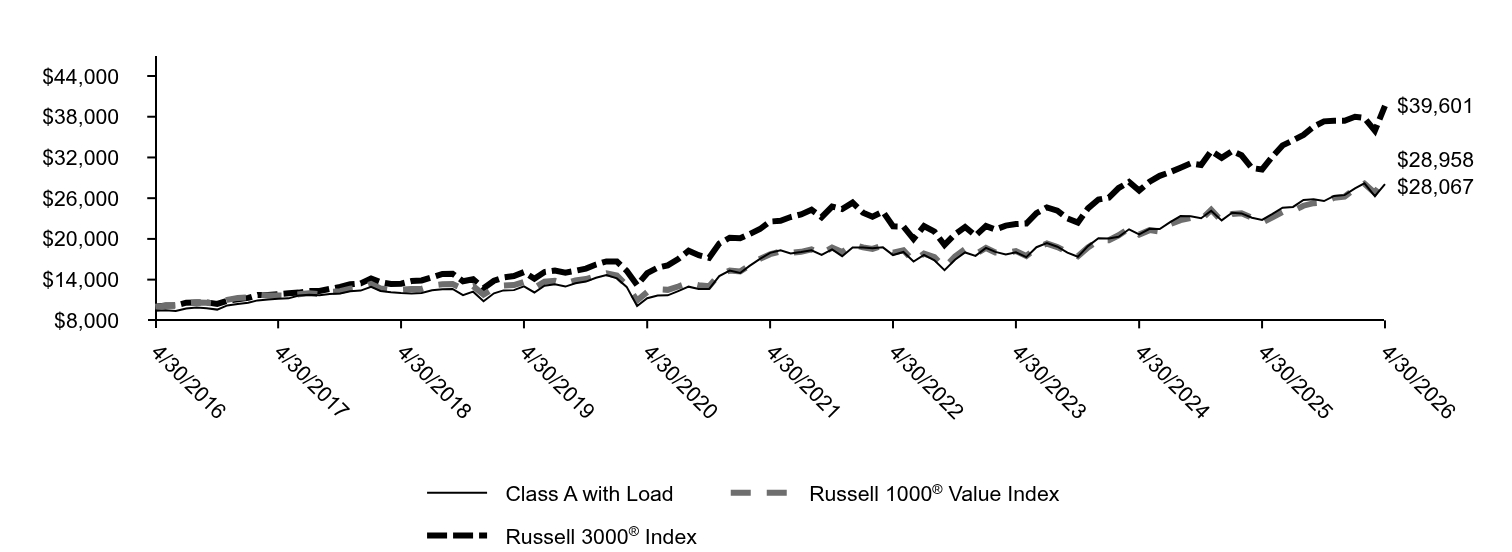
Table Summary
|
Class A with Load |
Russell 1000® Value Index |
Russell 3000® Index |
4/30/2016 |
$9,426 |
$10,000 |
$10,000 |
5/31/2016 |
$9,478 |
$10,155 |
$10,179 |
6/30/2016 |
$9,365 |
$10,243 |
$10,200 |
7/31/2016 |
$9,751 |
$10,541 |
$10,605 |
8/31/2016 |
$9,887 |
$10,622 |
$10,632 |
9/30/2016 |
$9,796 |
$10,600 |
$10,648 |
10/31/2016 |
$9,584 |
$10,436 |
$10,418 |
11/30/2016 |
$10,197 |
$11,032 |
$10,884 |
12/31/2016 |
$10,408 |
$11,307 |
$11,097 |
1/31/2017 |
$10,586 |
$11,388 |
$11,305 |
2/28/2017 |
$10,942 |
$11,797 |
$11,726 |
3/31/2017 |
$11,065 |
$11,677 |
$11,734 |
4/30/2017 |
$11,174 |
$11,655 |
$11,858 |
5/31/2017 |
$11,243 |
$11,644 |
$11,980 |
6/30/2017 |
$11,661 |
$11,834 |
$12,088 |
7/31/2017 |
$11,784 |
$11,991 |
$12,316 |
8/31/2017 |
$11,692 |
$11,852 |
$12,339 |
9/30/2017 |
$11,885 |
$12,203 |
$12,640 |
10/31/2017 |
$11,947 |
$12,291 |
$12,916 |
11/30/2017 |
$12,272 |
$12,668 |
$13,308 |
12/31/2017 |
$12,389 |
$12,852 |
$13,441 |
1/31/2018 |
$12,947 |
$13,349 |
$14,150 |
2/28/2018 |
$12,320 |
$12,712 |
$13,628 |
3/31/2018 |
$12,157 |
$12,488 |
$13,355 |
4/30/2018 |
$12,037 |
$12,530 |
$13,406 |
5/31/2018 |
$11,951 |
$12,604 |
$13,784 |
6/30/2018 |
$12,037 |
$12,635 |
$13,874 |
7/31/2018 |
$12,440 |
$13,135 |
$14,335 |
8/31/2018 |
$12,595 |
$13,329 |
$14,838 |
9/30/2018 |
$12,621 |
$13,356 |
$14,863 |
10/31/2018 |
$11,719 |
$12,664 |
$13,768 |
11/30/2018 |
$12,226 |
$13,042 |
$14,044 |
12/31/2018 |
$10,816 |
$11,790 |
$12,737 |
1/31/2019 |
$11,989 |
$12,708 |
$13,830 |
2/28/2019 |
$12,417 |
$13,114 |
$14,316 |
3/31/2019 |
$12,454 |
$13,197 |
$14,526 |
4/30/2019 |
$13,004 |
$13,665 |
$15,106 |
5/31/2019 |
$12,110 |
$12,786 |
$14,128 |
6/30/2019 |
$13,115 |
$13,704 |
$15,120 |
7/31/2019 |
$13,320 |
$13,818 |
$15,345 |
8/31/2019 |
$12,976 |
$13,412 |
$15,032 |
9/30/2019 |
$13,460 |
$13,890 |
$15,296 |
10/31/2019 |
$13,711 |
$14,084 |
$15,625 |
11/30/2019 |
$14,270 |
$14,520 |
$16,219 |
12/31/2019 |
$14,670 |
$14,919 |
$16,688 |
1/31/2020 |
$14,182 |
$14,598 |
$16,669 |
2/29/2020 |
$12,933 |
$13,184 |
$15,305 |
3/31/2020 |
$10,109 |
$10,931 |
$13,200 |
4/30/2020 |
$11,257 |
$12,160 |
$14,948 |
5/31/2020 |
$11,673 |
$12,577 |
$15,748 |
6/30/2020 |
$11,683 |
$12,493 |
$16,108 |
7/31/2020 |
$12,313 |
$12,987 |
$17,022 |
8/31/2020 |
$12,963 |
$13,524 |
$18,255 |
9/30/2020 |
$12,618 |
$13,192 |
$17,591 |
10/31/2020 |
$12,628 |
$13,019 |
$17,211 |
11/30/2020 |
$14,528 |
$14,770 |
$19,305 |
12/31/2020 |
$15,335 |
$15,336 |
$20,173 |
1/31/2021 |
$14,971 |
$15,196 |
$20,084 |
2/28/2021 |
$16,018 |
$16,114 |
$20,711 |
3/31/2021 |
$17,054 |
$17,062 |
$21,454 |
4/30/2021 |
$17,940 |
$17,745 |
$22,560 |
5/31/2021 |
$18,325 |
$18,159 |
$22,663 |
6/30/2021 |
$17,844 |
$17,951 |
$23,222 |
7/31/2021 |
$18,058 |
$18,094 |
$23,614 |
8/31/2021 |
$18,314 |
$18,453 |
$24,288 |
9/30/2021 |
$17,630 |
$17,811 |
$23,198 |
10/31/2021 |
$18,463 |
$18,715 |
$24,767 |
11/30/2021 |
$17,460 |
$18,056 |
$24,390 |
12/31/2021 |
$18,732 |
$19,195 |
$25,350 |
1/31/2022 |
$18,719 |
$18,748 |
$23,859 |
2/28/2022 |
$18,622 |
$18,530 |
$23,258 |
3/31/2022 |
$18,756 |
$19,053 |
$24,012 |
4/30/2022 |
$17,622 |
$17,979 |
$21,857 |
5/31/2022 |
$18,073 |
$18,328 |
$21,828 |
6/30/2022 |
$16,671 |
$16,727 |
$20,002 |
7/31/2022 |
$17,634 |
$17,836 |
$21,878 |
8/31/2022 |
$16,854 |
$17,304 |
$21,062 |
9/30/2022 |
$15,402 |
$15,787 |
$19,109 |
10/31/2022 |
$16,927 |
$17,406 |
$20,676 |
11/30/2022 |
$18,000 |
$18,493 |
$21,755 |
12/31/2022 |
$17,497 |
$17,748 |
$20,481 |
1/31/2023 |
$18,669 |
$18,668 |
$21,892 |
2/28/2023 |
$18,083 |
$18,009 |
$21,380 |
3/31/2023 |
$17,707 |
$17,927 |
$21,952 |
4/30/2023 |
$18,038 |
$18,197 |
$22,186 |
5/31/2023 |
$17,316 |
$17,495 |
$22,272 |
6/30/2023 |
$18,774 |
$18,657 |
$23,793 |
7/31/2023 |
$19,375 |
$19,313 |
$24,646 |
8/31/2023 |
$18,849 |
$18,792 |
$24,170 |
9/30/2023 |
$17,978 |
$18,066 |
$23,019 |
10/31/2023 |
$17,376 |
$17,429 |
$22,408 |
11/30/2023 |
$18,940 |
$18,744 |
$24,498 |
12/31/2023 |
$20,112 |
$19,782 |
$25,797 |
1/31/2024 |
$20,045 |
$19,803 |
$26,083 |
2/29/2024 |
$20,315 |
$20,533 |
$27,495 |
3/31/2024 |
$21,415 |
$21,560 |
$28,382 |
4/30/2024 |
$20,654 |
$20,639 |
$27,133 |
5/31/2024 |
$21,482 |
$21,293 |
$28,415 |
6/30/2024 |
$21,465 |
$21,093 |
$29,295 |
7/31/2024 |
$22,480 |
$22,171 |
$29,839 |
8/31/2024 |
$23,360 |
$22,766 |
$30,489 |
9/30/2024 |
$23,343 |
$23,082 |
$31,120 |
10/31/2024 |
$23,039 |
$22,828 |
$30,891 |
11/30/2024 |
$24,138 |
$24,286 |
$32,946 |
12/31/2024 |
$22,730 |
$22,625 |
$31,939 |
1/31/2025 |
$23,844 |
$23,672 |
$32,947 |
2/28/2025 |
$23,753 |
$23,768 |
$32,316 |
3/31/2025 |
$23,116 |
$23,108 |
$30,431 |
4/30/2025 |
$22,798 |
$22,404 |
$30,227 |
5/31/2025 |
$23,685 |
$23,190 |
$32,143 |
6/30/2025 |
$24,595 |
$23,983 |
$33,776 |
7/31/2025 |
$24,709 |
$24,121 |
$34,520 |
8/31/2025 |
$25,733 |
$24,890 |
$35,318 |
9/30/2025 |
$25,824 |
$25,261 |
$36,537 |
10/31/2025 |
$25,574 |
$25,373 |
$37,320 |
11/30/2025 |
$26,325 |
$26,047 |
$37,423 |
12/31/2025 |
$26,448 |
$26,224 |
$37,415 |
1/31/2026 |
$27,450 |
$27,420 |
$37,996 |
2/28/2026 |
$28,196 |
$28,131 |
$37,815 |
3/31/2026 |
$26,294 |
$26,774 |
$35,935 |
4/30/2026 |
$28,067 |
$28,958 |
$39,601 |
|
| Average Annual Return [Table Text Block] |
|
|
Table Summary
AATR |
1 Year |
5 Years |
10 Years |
Class A |
23.11 |
9.36 |
11.53 |
Class A with Load |
16.05 |
8.08 |
10.87 |
Russell 1000® Value Index |
29.25 |
10.29 |
11.22 |
Russell 3000® Index |
31.01 |
11.91 |
14.75 | |
| No Deduction of Taxes [Text Block] |
|
|
do not reflect taxes that a shareholder may pay on an investment in a fund.
|
| Material Change Date |
|
May 01, 2025
|
|
| AssetsNet |
|
|
$ 154,848,961
|
| Holdings Count | Holding |
|
|
45
|
| Advisory Fees Paid, Amount |
[16] |
|
$ 321,858
|
| InvestmentCompanyPortfolioTurnover |
|
|
56.00%
|
| Additional Fund Statistics [Text Block] |
|
|
Table Summary
Total net assets |
$154,848,961 |
# of portfolio holdings |
45 |
Portfolio turnover rate |
56% |
Total advisory fees paid |
$321,858Footnote Reference* |
| Footnote |
Description |
Footnote* |
Includes the fees charged by the Manager for providing advisory services to the Master Portfolio in which the Fund invests substantially all of its assets. | |
| Holdings [Text Block] |
|
|
SECTOR ALLOCATION (% OF LONG-TERM INVESTMENTS)
Table Summary
Financials |
18.3 |
Industrials |
16.6 |
Information technology |
12.1 |
Health care |
11.7 |
Consumer discretionary |
8.9 |
Energy |
7.0 |
Consumer staples |
6.2 |
Communication services |
5.9 |
Materials |
5.6 |
Utilities |
4.4 |
Real estate |
3.3 | |
| Largest Holdings [Text Block] |
|
|
TOP TEN HOLDINGS (% OF NET ASSETS)
Table Summary
Alphabet, Inc. Class C |
5.8 |
Amazon.com, Inc. |
5.2 |
NextEra Energy, Inc. |
4.4 |
Qnity Electronics, Inc. |
4.1 |
Canadian Pacific Kansas City Ltd. |
3.8 |
Berkshire Hathaway, Inc. Class B |
3.3 |
Capital One Financial Corp. |
3.2 |
Eaton Corp. PLC |
3.1 |
Honeywell International, Inc. |
2.8 |
Labcorp Holdings, Inc. |
2.8 | |
| Material Fund Change [Text Block] |
|
|
This is a summary of certain changes and planned changes to the Fund since May 1, 2025. Effective December 31, 2026, James M. Tringas, CFA, will no longer serve as a portfolio manager of the Fund. |
| Summary of Change Legend [Text Block] |
|
|
This is a summary of certain changes and planned changes to the Fund since May 1, 2025.
|
| C000176621 |
|
|
|
| Shareholder Report [Line Items] |
|
|
|
| Fund Name |
|
|
Large Cap Value Fund
|
| Class Name |
|
|
Class R6
|
| Trading Symbol |
|
|
CBEJX
|
| Annual or Semi-Annual Statement [Text Block] |
|
|
This annual shareholder report contains important information about Large Cap Value Fund for the period from May 1, 2025 to April 30, 2026.
|
| Additional Information [Text Block] |
|
|
You can find additional information about the Fund at allspringglobal.com. You can also request this information by contacting us at 1-800-222-8222.
|
| Material Fund Change Notice [Text Block] |
|
|
This report describes changes to the Fund that occurred either during or after the reporting period.
|
| Additional Information Phone Number |
|
|
<span style="white-space: nowrap; box-sizing: border-box; color: rgb(0, 0, 0); display: inline; flex-wrap: nowrap; font-size: 12px; font-weight: 400; grid-area: auto; line-height: 18px; margin: 0px; overflow: visible; text-align: left; text-align-last: auto;"> 1-800-222-8222.</span>
|
| Additional Information Website |
|
|
<span style="box-sizing: border-box; color: rgb(0, 0, 0); display: inline; flex-wrap: nowrap; font-size: 12px; font-weight: 400; grid-area: auto; line-height: 18px; margin: 0px; overflow: visible; text-align: left; text-align-last: auto; white-space-collapse: preserve-breaks;">allspringglobal.com</span>
|
| Expenses [Text Block] |
|
|
What were the Fund costs for the past year?The table explains the costs you would have paid within the reporting period based on a hypothetical $10,000 investment.
Table Summary
CLASS NAME |
COSTS OF A $10,000 INVESTMENT |
COSTS PAID AS A % OF A $10,000 INVESTMENT |
Class R6 |
$45 |
0.40%Footnote Reference1 |
| Footnote |
Description |
Footnote1 |
Expenses shown aggregate those of both the Fund and the Master Portfolio. | The manager has contractually committed to waive fees and/or reimburse certain expenses to the extent necessary to cap the Fund's total annual fund operating expense ratio at a specific amount. Without this cap, the costs shown above may have been higher. Please see the prospectus for the amount and the expiration date of the cap. Prior to or after the commitment expiration date, the cap may be increased or the commitment to maintain the cap may be terminated only with the approval of the Board of Trustees. |
| Expenses Paid, Amount |
|
|
$ 45
|
| Expense Ratio, Percent |
[17] |
|
0.40%
|
| Expenses Represent Both Master and Feeder [Text] |
|
|
Expenses shown aggregate those of both the Fund and the Master Portfolio.
|
| Factors Affecting Performance [Text Block] |
|
|
How did the Fund perform last year and what affected its performance?In a volatile year, the Fund underperformed its benchmark, driven by stock selection. Investors’ risk appetites fluctuated as the “tariff tantrum” led to a narrow, high-risk, low-quality, rally. Risk appetites became more balanced in October 2025 as investors digested inflation and employment data, emerging credit concerns, and skepticism about data center buildout skepticism. In March 2026, the Iran conflict led energy prices higher until a ceasefire was announced in April. The Fund made minor changes to sector allocation, increasing exposure to information technology while reducing exposure to financials. A large contributor was Citigroup, Inc., one of the world’s largest diversified financial institutions. Its management continues to exit lower margin, non-core franchises and cut costs to improve returns and reduce credit needs. The largest detractor was Fiserv, Inc. (This security was no longer held at the end of the reporting period.), a leading provider of financial technology platforms. Its management reset expectations across several business areas, tempering prior optimism built over years of strong performance. |
| Performance Past Does Not Indicate Future [Text] |
|
|
Figures quoted represent past performance, which is no guarantee of future results,
|
| Line Graph [Table Text Block] |
|
|
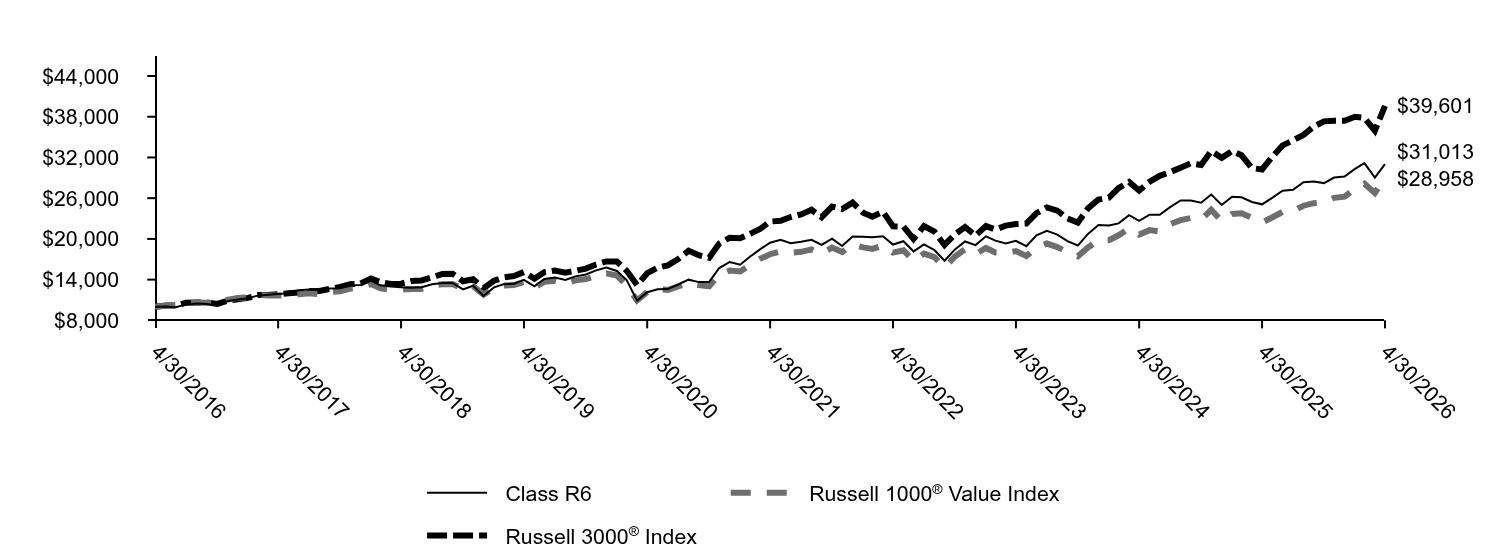
Table Summary
|
Class R6 |
Russell 1000® Value Index |
Russell 3000® Index |
4/30/2016 |
$10,000 |
$10,000 |
$10,000 |
5/31/2016 |
$10,055 |
$10,155 |
$10,179 |
6/30/2016 |
$9,935 |
$10,243 |
$10,200 |
7/31/2016 |
$10,350 |
$10,541 |
$10,605 |
8/31/2016 |
$10,494 |
$10,622 |
$10,632 |
9/30/2016 |
$10,397 |
$10,600 |
$10,648 |
10/31/2016 |
$10,181 |
$10,436 |
$10,418 |
11/30/2016 |
$10,837 |
$11,032 |
$10,884 |
12/31/2016 |
$11,067 |
$11,307 |
$11,097 |
1/31/2017 |
$11,256 |
$11,388 |
$11,305 |
2/28/2017 |
$11,642 |
$11,797 |
$11,726 |
3/31/2017 |
$11,773 |
$11,677 |
$11,734 |
4/30/2017 |
$11,896 |
$11,655 |
$11,858 |
5/31/2017 |
$11,978 |
$11,644 |
$11,980 |
6/30/2017 |
$12,421 |
$11,834 |
$12,088 |
7/31/2017 |
$12,561 |
$11,991 |
$12,316 |
8/31/2017 |
$12,471 |
$11,852 |
$12,339 |
9/30/2017 |
$12,676 |
$12,203 |
$12,640 |
10/31/2017 |
$12,742 |
$12,291 |
$12,916 |
11/30/2017 |
$13,095 |
$12,668 |
$13,308 |
12/31/2017 |
$13,227 |
$12,852 |
$13,441 |
1/31/2018 |
$13,831 |
$13,349 |
$14,150 |
2/28/2018 |
$13,163 |
$12,712 |
$13,628 |
3/31/2018 |
$12,998 |
$12,488 |
$13,355 |
4/30/2018 |
$12,870 |
$12,530 |
$13,406 |
5/31/2018 |
$12,787 |
$12,604 |
$13,784 |
6/30/2018 |
$12,879 |
$12,635 |
$13,874 |
7/31/2018 |
$13,318 |
$13,135 |
$14,335 |
8/31/2018 |
$13,492 |
$13,329 |
$14,838 |
9/30/2018 |
$13,520 |
$13,356 |
$14,863 |
10/31/2018 |
$12,559 |
$12,664 |
$13,768 |
11/30/2018 |
$13,108 |
$13,042 |
$14,044 |
12/31/2018 |
$11,595 |
$11,790 |
$12,737 |
1/31/2019 |
$12,860 |
$12,708 |
$13,830 |
2/28/2019 |
$13,329 |
$13,114 |
$14,316 |
3/31/2019 |
$13,378 |
$13,197 |
$14,526 |
4/30/2019 |
$13,966 |
$13,665 |
$15,106 |
5/31/2019 |
$13,010 |
$12,786 |
$14,128 |
6/30/2019 |
$14,086 |
$13,704 |
$15,120 |
7/31/2019 |
$14,325 |
$13,818 |
$15,345 |
8/31/2019 |
$13,956 |
$13,412 |
$15,032 |
9/30/2019 |
$14,484 |
$13,890 |
$15,296 |
10/31/2019 |
$14,763 |
$14,084 |
$15,625 |
11/30/2019 |
$15,361 |
$14,520 |
$16,219 |
12/31/2019 |
$15,797 |
$14,919 |
$16,688 |
1/31/2020 |
$15,273 |
$14,598 |
$16,669 |
2/29/2020 |
$13,941 |
$13,184 |
$15,305 |
3/31/2020 |
$10,906 |
$10,931 |
$13,200 |
4/30/2020 |
$12,140 |
$12,160 |
$14,948 |
5/31/2020 |
$12,587 |
$12,577 |
$15,748 |
6/30/2020 |
$12,609 |
$12,493 |
$16,108 |
7/31/2020 |
$13,286 |
$12,987 |
$17,022 |
8/31/2020 |
$13,995 |
$13,524 |
$18,255 |
9/30/2020 |
$13,635 |
$13,192 |
$17,591 |
10/31/2020 |
$13,657 |
$13,019 |
$17,211 |
11/30/2020 |
$15,709 |
$14,770 |
$19,305 |
12/31/2020 |
$16,597 |
$15,336 |
$20,173 |
1/31/2021 |
$16,194 |
$15,196 |
$20,084 |
2/28/2021 |
$17,334 |
$16,114 |
$20,711 |
3/31/2021 |
$18,463 |
$17,062 |
$21,454 |
4/30/2021 |
$19,430 |
$17,745 |
$22,560 |
5/31/2021 |
$19,857 |
$18,159 |
$22,663 |
6/30/2021 |
$19,350 |
$17,951 |
$23,222 |
7/31/2021 |
$19,569 |
$18,094 |
$23,614 |
8/31/2021 |
$19,857 |
$18,453 |
$24,288 |
9/30/2021 |
$19,131 |
$17,811 |
$23,198 |
10/31/2021 |
$20,041 |
$18,715 |
$24,767 |
11/30/2021 |
$18,958 |
$18,056 |
$24,390 |
12/31/2021 |
$20,348 |
$19,195 |
$25,350 |
1/31/2022 |
$20,335 |
$18,748 |
$23,859 |
2/28/2022 |
$20,243 |
$18,530 |
$23,258 |
3/31/2022 |
$20,401 |
$19,053 |
$24,012 |
4/30/2022 |
$19,174 |
$17,979 |
$21,857 |
5/31/2022 |
$19,662 |
$18,328 |
$21,828 |
6/30/2022 |
$18,158 |
$16,727 |
$20,002 |
7/31/2022 |
$19,200 |
$17,836 |
$21,878 |
8/31/2022 |
$18,356 |
$17,304 |
$21,062 |
9/30/2022 |
$16,785 |
$15,787 |
$19,109 |
10/31/2022 |
$18,448 |
$17,406 |
$20,676 |
11/30/2022 |
$19,623 |
$18,493 |
$21,755 |
12/31/2022 |
$19,088 |
$17,748 |
$20,481 |
1/31/2023 |
$20,377 |
$18,668 |
$21,892 |
2/28/2023 |
$19,741 |
$18,009 |
$21,380 |
3/31/2023 |
$19,332 |
$17,927 |
$21,952 |
4/30/2023 |
$19,708 |
$18,197 |
$22,186 |
5/31/2023 |
$18,924 |
$17,495 |
$22,272 |
6/30/2023 |
$20,524 |
$18,657 |
$23,793 |
7/31/2023 |
$21,194 |
$19,313 |
$24,646 |
8/31/2023 |
$20,622 |
$18,792 |
$24,170 |
9/30/2023 |
$19,675 |
$18,066 |
$23,019 |
10/31/2023 |
$19,022 |
$17,429 |
$22,408 |
11/30/2023 |
$20,737 |
$18,744 |
$24,498 |
12/31/2023 |
$22,049 |
$19,782 |
$25,797 |
1/31/2024 |
$21,975 |
$19,803 |
$26,083 |
2/29/2024 |
$22,289 |
$20,533 |
$27,495 |
3/31/2024 |
$23,487 |
$21,560 |
$28,382 |
4/30/2024 |
$22,658 |
$20,639 |
$27,133 |
5/31/2024 |
$23,561 |
$21,293 |
$28,415 |
6/30/2024 |
$23,561 |
$21,093 |
$29,295 |
7/31/2024 |
$24,686 |
$22,171 |
$29,839 |
8/31/2024 |
$25,663 |
$22,766 |
$30,489 |
9/30/2024 |
$25,644 |
$23,082 |
$31,120 |
10/31/2024 |
$25,331 |
$22,828 |
$30,891 |
11/30/2024 |
$26,529 |
$24,286 |
$32,946 |
12/31/2024 |
$24,997 |
$22,625 |
$31,939 |
1/31/2025 |
$26,213 |
$23,672 |
$32,947 |
2/28/2025 |
$26,139 |
$23,768 |
$32,316 |
3/31/2025 |
$25,444 |
$23,108 |
$30,431 |
4/30/2025 |
$25,096 |
$22,404 |
$30,227 |
5/31/2025 |
$26,089 |
$23,190 |
$32,143 |
6/30/2025 |
$27,107 |
$23,983 |
$33,776 |
7/31/2025 |
$27,231 |
$24,121 |
$34,520 |
8/31/2025 |
$28,348 |
$24,890 |
$35,318 |
9/30/2025 |
$28,472 |
$25,261 |
$36,537 |
10/31/2025 |
$28,224 |
$25,373 |
$37,320 |
11/30/2025 |
$29,043 |
$26,047 |
$37,423 |
12/31/2025 |
$29,185 |
$26,224 |
$37,415 |
1/31/2026 |
$30,310 |
$27,420 |
$37,996 |
2/28/2026 |
$31,153 |
$28,131 |
$37,815 |
3/31/2026 |
$29,045 |
$26,774 |
$35,935 |
4/30/2026 |
$31,013 |
$28,958 |
$39,601 |
|
| Average Annual Return [Table Text Block] |
|
|
Table Summary
AATR |
1 Year |
5 Years |
10 Years |
Class R6Footnote Reference* |
23.58 |
9.80 |
11.98 |
Russell 1000® Value Index |
29.25 |
10.29 |
11.22 |
Russell 3000® Index |
31.01 |
11.91 |
14.75 | |
| No Deduction of Taxes [Text Block] |
|
|
do not reflect taxes that a shareholder may pay on an investment in a fund.
|
| Material Change Date |
|
May 01, 2025
|
|
| AssetsNet |
|
|
$ 154,848,961
|
| Holdings Count | Holding |
|
|
45
|
| Advisory Fees Paid, Amount |
[18] |
|
$ 321,858
|
| InvestmentCompanyPortfolioTurnover |
|
|
56.00%
|
| Additional Fund Statistics [Text Block] |
|
|
Table Summary
Total net assets |
$154,848,961 |
# of portfolio holdings |
45 |
Portfolio turnover rate |
56% |
Total advisory fees paid |
$321,858Footnote Reference* |
| Footnote |
Description |
Footnote* |
Includes the fees charged by the Manager for providing advisory services to the Master Portfolio in which the Fund invests substantially all of its assets. | |
| Holdings [Text Block] |
|
|
SECTOR ALLOCATION (% OF LONG-TERM INVESTMENTS)
Table Summary
Financials |
18.3 |
Industrials |
16.6 |
Information technology |
12.1 |
Health care |
11.7 |
Consumer discretionary |
8.9 |
Energy |
7.0 |
Consumer staples |
6.2 |
Communication services |
5.9 |
Materials |
5.6 |
Utilities |
4.4 |
Real estate |
3.3 | |
| Largest Holdings [Text Block] |
|
|
TOP TEN HOLDINGS (% OF NET ASSETS)
Table Summary
Alphabet, Inc. Class C |
5.8 |
Amazon.com, Inc. |
5.2 |
NextEra Energy, Inc. |
4.4 |
Qnity Electronics, Inc. |
4.1 |
Canadian Pacific Kansas City Ltd. |
3.8 |
Berkshire Hathaway, Inc. Class B |
3.3 |
Capital One Financial Corp. |
3.2 |
Eaton Corp. PLC |
3.1 |
Honeywell International, Inc. |
2.8 |
Labcorp Holdings, Inc. |
2.8 | |
| Material Fund Change [Text Block] |
|
|
This is a summary of certain changes and planned changes to the Fund since May 1, 2025. Effective December 31, 2026, James M. Tringas, CFA, will no longer serve as a portfolio manager of the Fund. |
| Summary of Change Legend [Text Block] |
|
|
This is a summary of certain changes and planned changes to the Fund since May 1, 2025.
|
| C000019962 |
|
|
|
| Shareholder Report [Line Items] |
|
|
|
| Fund Name |
|
|
Large Cap Value Fund
|
| Class Name |
|
|
Institutional Class
|
| Trading Symbol |
|
|
CBLSX
|
| Annual or Semi-Annual Statement [Text Block] |
|
|
This annual shareholder report contains important information about Large Cap Value Fund for the period from May 1, 2025 to April 30, 2026.
|
| Additional Information [Text Block] |
|
|
You can find additional information about the Fund at allspringglobal.com. You can also request this information by contacting us at 1-800-222-8222.
|
| Material Fund Change Notice [Text Block] |
|
|
This report describes changes to the Fund that occurred either during or after the reporting period.
|
| Additional Information Phone Number |
|
|
<span style="white-space: nowrap; box-sizing: border-box; color: rgb(0, 0, 0); display: inline; flex-wrap: nowrap; font-size: 12px; font-weight: 400; grid-area: auto; line-height: 18px; margin: 0px; overflow: visible; text-align: left; text-align-last: auto;"> 1-800-222-8222.</span>
|
| Additional Information Website |
|
|
<span style="box-sizing: border-box; color: rgb(0, 0, 0); display: inline; flex-wrap: nowrap; font-size: 12px; font-weight: 400; grid-area: auto; line-height: 18px; margin: 0px; overflow: visible; text-align: left; text-align-last: auto; white-space-collapse: preserve-breaks;">allspringglobal.com</span>
|
| Expenses [Text Block] |
|
|
What were the Fund costs for the past year?The table explains the costs you would have paid within the reporting period based on a hypothetical $10,000 investment.
Table Summary
CLASS NAME |
COSTS OF A $10,000 INVESTMENT |
COSTS PAID AS A % OF A $10,000 INVESTMENT |
Institutional Class |
$56 |
0.50%Footnote Reference1 |
| Footnote |
Description |
Footnote1 |
Expenses shown aggregate those of both the Fund and the Master Portfolio. | The manager has contractually committed to waive fees and/or reimburse certain expenses to the extent necessary to cap the Fund's total annual fund operating expense ratio at a specific amount. Without this cap, the costs shown above may have been higher. Please see the prospectus for the amount and the expiration date of the cap. Prior to or after the commitment expiration date, the cap may be increased or the commitment to maintain the cap may be terminated only with the approval of the Board of Trustees. |
| Expenses Paid, Amount |
|
|
$ 56
|
| Expense Ratio, Percent |
[19] |
|
0.50%
|
| Expenses Represent Both Master and Feeder [Text] |
|
|
Expenses shown aggregate those of both the Fund and the Master Portfolio.
|
| Factors Affecting Performance [Text Block] |
|
|
How did the Fund perform last year and what affected its performance?In a volatile year, the Fund underperformed its benchmark, driven by stock selection. Investors’ risk appetites fluctuated as the “tariff tantrum” led to a narrow, high-risk, low-quality, rally. Risk appetites became more balanced in October 2025 as investors digested inflation and employment data, emerging credit concerns, and skepticism about data center buildout skepticism. In March 2026, the Iran conflict led energy prices higher until a ceasefire was announced in April. The Fund made minor changes to sector allocation, increasing exposure to information technology while reducing exposure to financials. A large contributor was Citigroup, Inc., one of the world’s largest diversified financial institutions. Its management continues to exit lower margin, non-core franchises and cut costs to improve returns and reduce credit needs. The largest detractor was Fiserv, Inc. (This security was no longer held at the end of the reporting period.), a leading provider of financial technology platforms. Its management reset expectations across several business areas, tempering prior optimism built over years of strong performance. |
| Performance Past Does Not Indicate Future [Text] |
|
|
Figures quoted represent past performance, which is no guarantee of future results,
|
| Line Graph [Table Text Block] |
|
|
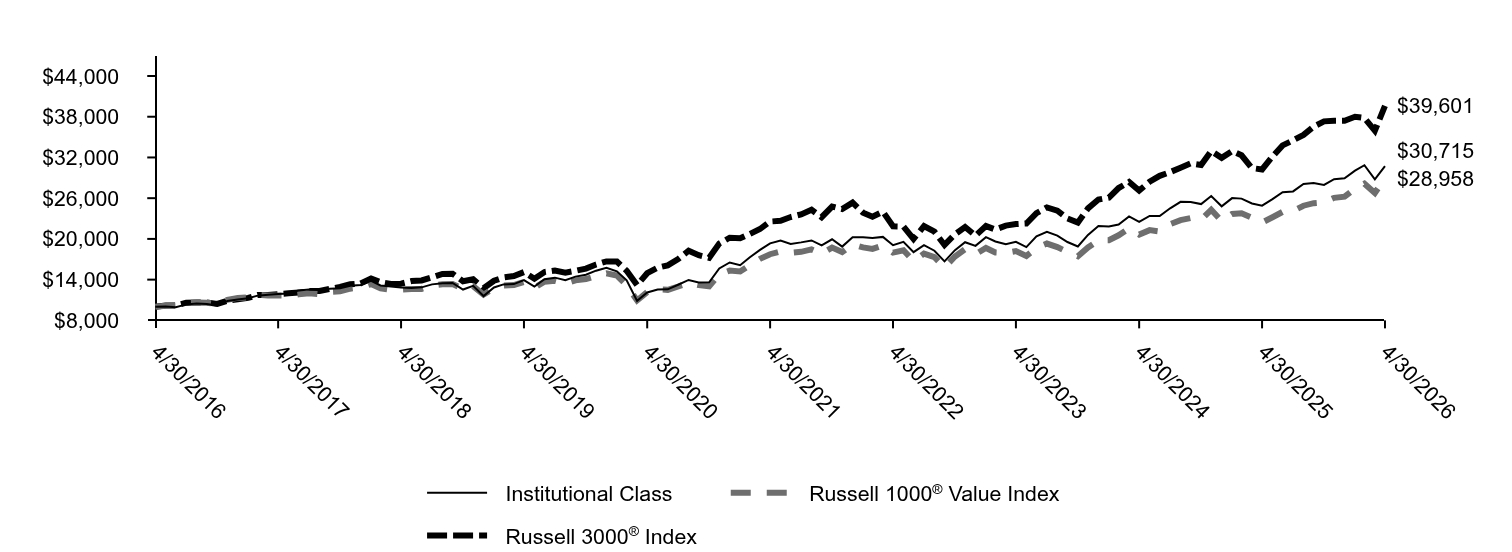
Table Summary
|
Institutional Class |
Russell 1000® Value Index |
Russell 3000® Index |
4/30/2016 |
$10,000 |
$10,000 |
$10,000 |
5/31/2016 |
$10,056 |
$10,155 |
$10,179 |
6/30/2016 |
$9,936 |
$10,243 |
$10,200 |
7/31/2016 |
$10,352 |
$10,541 |
$10,605 |
8/31/2016 |
$10,496 |
$10,622 |
$10,632 |
9/30/2016 |
$10,400 |
$10,600 |
$10,648 |
10/31/2016 |
$10,184 |
$10,436 |
$10,418 |
11/30/2016 |
$10,840 |
$11,032 |
$10,884 |
12/31/2016 |
$11,068 |
$11,307 |
$11,097 |
1/31/2017 |
$11,257 |
$11,388 |
$11,305 |
2/28/2017 |
$11,643 |
$11,797 |
$11,726 |
3/31/2017 |
$11,774 |
$11,677 |
$11,734 |
4/30/2017 |
$11,897 |
$11,655 |
$11,858 |
5/31/2017 |
$11,971 |
$11,644 |
$11,980 |
6/30/2017 |
$12,415 |
$11,834 |
$12,088 |
7/31/2017 |
$12,554 |
$11,991 |
$12,316 |
8/31/2017 |
$12,464 |
$11,852 |
$12,339 |
9/30/2017 |
$12,669 |
$12,203 |
$12,640 |
10/31/2017 |
$12,735 |
$12,291 |
$12,916 |
11/30/2017 |
$13,088 |
$12,668 |
$13,308 |
12/31/2017 |
$13,210 |
$12,852 |
$13,441 |
1/31/2018 |
$13,814 |
$13,349 |
$14,150 |
2/28/2018 |
$13,146 |
$12,712 |
$13,628 |
3/31/2018 |
$12,982 |
$12,488 |
$13,355 |
4/30/2018 |
$12,853 |
$12,530 |
$13,406 |
5/31/2018 |
$12,771 |
$12,604 |
$13,784 |
6/30/2018 |
$12,863 |
$12,635 |
$13,874 |
7/31/2018 |
$13,302 |
$13,135 |
$14,335 |
8/31/2018 |
$13,466 |
$13,329 |
$14,838 |
9/30/2018 |
$13,503 |
$13,356 |
$14,863 |
10/31/2018 |
$12,542 |
$12,664 |
$13,768 |
11/30/2018 |
$13,082 |
$13,042 |
$14,044 |
12/31/2018 |
$11,578 |
$11,790 |
$12,737 |
1/31/2019 |
$12,841 |
$12,708 |
$13,830 |
2/28/2019 |
$13,299 |
$13,114 |
$14,316 |
3/31/2019 |
$13,348 |
$13,197 |
$14,526 |
4/30/2019 |
$13,935 |
$13,665 |
$15,106 |
5/31/2019 |
$12,980 |
$12,786 |
$14,128 |
6/30/2019 |
$14,054 |
$13,704 |
$15,120 |
7/31/2019 |
$14,293 |
$13,818 |
$15,345 |
8/31/2019 |
$13,925 |
$13,412 |
$15,032 |
9/30/2019 |
$14,442 |
$13,890 |
$15,296 |
10/31/2019 |
$14,721 |
$14,084 |
$15,625 |
11/30/2019 |
$15,318 |
$14,520 |
$16,219 |
12/31/2019 |
$15,758 |
$14,919 |
$16,688 |
1/31/2020 |
$15,225 |
$14,598 |
$16,669 |
2/29/2020 |
$13,897 |
$13,184 |
$15,305 |
3/31/2020 |
$10,872 |
$10,931 |
$13,200 |
4/30/2020 |
$12,102 |
$12,160 |
$14,948 |
5/31/2020 |
$12,548 |
$12,577 |
$15,748 |
6/30/2020 |
$12,570 |
$12,493 |
$16,108 |
7/31/2020 |
$13,244 |
$12,987 |
$17,022 |
8/31/2020 |
$13,952 |
$13,524 |
$18,255 |
9/30/2020 |
$13,582 |
$13,192 |
$17,591 |
10/31/2020 |
$13,604 |
$13,019 |
$17,211 |
11/30/2020 |
$15,650 |
$14,770 |
$19,305 |
12/31/2020 |
$16,527 |
$15,336 |
$20,173 |
1/31/2021 |
$16,126 |
$15,196 |
$20,084 |
2/28/2021 |
$17,262 |
$16,114 |
$20,711 |
3/31/2021 |
$18,386 |
$17,062 |
$21,454 |
4/30/2021 |
$19,349 |
$17,745 |
$22,560 |
5/31/2021 |
$19,773 |
$18,159 |
$22,663 |
6/30/2021 |
$19,257 |
$17,951 |
$23,222 |
7/31/2021 |
$19,487 |
$18,094 |
$23,614 |
8/31/2021 |
$19,773 |
$18,453 |
$24,288 |
9/30/2021 |
$19,051 |
$17,811 |
$23,198 |
10/31/2021 |
$19,945 |
$18,715 |
$24,767 |
11/30/2021 |
$18,867 |
$18,056 |
$24,390 |
12/31/2021 |
$20,243 |
$19,195 |
$25,350 |
1/31/2022 |
$20,243 |
$18,748 |
$23,859 |
2/28/2022 |
$20,138 |
$18,530 |
$23,258 |
3/31/2022 |
$20,296 |
$19,053 |
$24,012 |
4/30/2022 |
$19,075 |
$17,979 |
$21,857 |
5/31/2022 |
$19,561 |
$18,328 |
$21,828 |
6/30/2022 |
$18,051 |
$16,727 |
$20,002 |
7/31/2022 |
$19,088 |
$17,836 |
$21,878 |
8/31/2022 |
$18,261 |
$17,304 |
$21,062 |
9/30/2022 |
$16,686 |
$15,787 |
$19,109 |
10/31/2022 |
$18,340 |
$17,406 |
$20,676 |
11/30/2022 |
$19,508 |
$18,493 |
$21,755 |
12/31/2022 |
$18,973 |
$17,748 |
$20,481 |
1/31/2023 |
$20,254 |
$18,668 |
$21,892 |
2/28/2023 |
$19,621 |
$18,009 |
$21,380 |
3/31/2023 |
$19,216 |
$17,927 |
$21,952 |
4/30/2023 |
$19,573 |
$18,197 |
$22,186 |
5/31/2023 |
$18,794 |
$17,495 |
$22,272 |
6/30/2023 |
$20,383 |
$18,657 |
$23,793 |
7/31/2023 |
$21,048 |
$19,313 |
$24,646 |
8/31/2023 |
$20,481 |
$18,792 |
$24,170 |
9/30/2023 |
$19,540 |
$18,066 |
$23,019 |
10/31/2023 |
$18,892 |
$17,429 |
$22,408 |
11/30/2023 |
$20,594 |
$18,744 |
$24,498 |
12/31/2023 |
$21,892 |
$19,782 |
$25,797 |
1/31/2024 |
$21,819 |
$19,803 |
$26,083 |
2/29/2024 |
$22,130 |
$20,533 |
$27,495 |
3/31/2024 |
$23,319 |
$21,560 |
$28,382 |
4/30/2024 |
$22,496 |
$20,639 |
$27,133 |
5/31/2024 |
$23,392 |
$21,293 |
$28,415 |
6/30/2024 |
$23,374 |
$21,093 |
$29,295 |
7/31/2024 |
$24,507 |
$22,171 |
$29,839 |
8/31/2024 |
$25,458 |
$22,766 |
$30,489 |
9/30/2024 |
$25,440 |
$23,082 |
$31,120 |
10/31/2024 |
$25,129 |
$22,828 |
$30,891 |
11/30/2024 |
$26,318 |
$24,286 |
$32,946 |
12/31/2024 |
$24,804 |
$22,625 |
$31,939 |
1/31/2025 |
$26,010 |
$23,672 |
$32,947 |
2/28/2025 |
$25,936 |
$23,768 |
$32,316 |
3/31/2025 |
$25,222 |
$23,108 |
$30,431 |
4/30/2025 |
$24,902 |
$22,404 |
$30,227 |
5/31/2025 |
$25,862 |
$23,190 |
$32,143 |
6/30/2025 |
$26,871 |
$23,983 |
$33,776 |
7/31/2025 |
$26,994 |
$24,121 |
$34,520 |
8/31/2025 |
$28,101 |
$24,890 |
$35,318 |
9/30/2025 |
$28,224 |
$25,261 |
$36,537 |
10/31/2025 |
$27,953 |
$25,373 |
$37,320 |
11/30/2025 |
$28,790 |
$26,047 |
$37,423 |
12/31/2025 |
$28,933 |
$26,224 |
$37,415 |
1/31/2026 |
$30,047 |
$27,420 |
$37,996 |
2/28/2026 |
$30,854 |
$28,131 |
$37,815 |
3/31/2026 |
$28,766 |
$26,774 |
$35,935 |
4/30/2026 |
$30,715 |
$28,958 |
$39,601 |
|
| Average Annual Return [Table Text Block] |
|
|
Table Summary
AATR |
1 Year |
5 Years |
10 Years |
Institutional Class |
23.34 |
9.68 |
11.88 |
Russell 1000® Value Index |
29.25 |
10.29 |
11.22 |
Russell 3000® Index |
31.01 |
11.91 |
14.75 | |
| No Deduction of Taxes [Text Block] |
|
|
do not reflect taxes that a shareholder may pay on an investment in a fund.
|
| Material Change Date |
|
May 01, 2025
|
|
| AssetsNet |
|
|
$ 154,848,961
|
| Holdings Count | Holding |
|
|
45
|
| Advisory Fees Paid, Amount |
[20] |
|
$ 321,858
|
| InvestmentCompanyPortfolioTurnover |
|
|
56.00%
|
| Additional Fund Statistics [Text Block] |
|
|
Table Summary
Total net assets |
$154,848,961 |
# of portfolio holdings |
45 |
Portfolio turnover rate |
56% |
Total advisory fees paid |
$321,858Footnote Reference* |
| Footnote |
Description |
Footnote* |
Includes the fees charged by the Manager for providing advisory services to the Master Portfolio in which the Fund invests substantially all of its assets. | |
| Holdings [Text Block] |
|
|
SECTOR ALLOCATION (% OF LONG-TERM INVESTMENTS)
Table Summary
Financials |
18.3 |
Industrials |
16.6 |
Information technology |
12.1 |
Health care |
11.7 |
Consumer discretionary |
8.9 |
Energy |
7.0 |
Consumer staples |
6.2 |
Communication services |
5.9 |
Materials |
5.6 |
Utilities |
4.4 |
Real estate |
3.3 | |
| Largest Holdings [Text Block] |
|
|
TOP TEN HOLDINGS (% OF NET ASSETS)
Table Summary
Alphabet, Inc. Class C |
5.8 |
Amazon.com, Inc. |
5.2 |
NextEra Energy, Inc. |
4.4 |
Qnity Electronics, Inc. |
4.1 |
Canadian Pacific Kansas City Ltd. |
3.8 |
Berkshire Hathaway, Inc. Class B |
3.3 |
Capital One Financial Corp. |
3.2 |
Eaton Corp. PLC |
3.1 |
Honeywell International, Inc. |
2.8 |
Labcorp Holdings, Inc. |
2.8 | |
| Material Fund Change [Text Block] |
|
|
This is a summary of certain changes and planned changes to the Fund since May 1, 2025. Effective December 31, 2026, James M. Tringas, CFA, will no longer serve as a portfolio manager of the Fund. |
| Summary of Change Legend [Text Block] |
|
|
This is a summary of certain changes and planned changes to the Fund since May 1, 2025.
|
| C000020321 |
|
|
|
| Shareholder Report [Line Items] |
|
|
|
| Fund Name |
|
|
Real Return Fund
|
| Class Name |
|
|
Class A
|
| Trading Symbol |
|
|
IPBAX
|
| Annual or Semi-Annual Statement [Text Block] |
|
|
This annual shareholder report contains important information about Real Return Fund for the period from May 1, 2025 to April 30, 2026.
|
| Additional Information [Text Block] |
|
|
You can find additional information about the Fund at allspringglobal.com. You can also request this information by contacting us at 1-800-222-8222.
|
| Additional Information Phone Number |
|
|
<span style="white-space: nowrap; box-sizing: border-box; color: rgb(0, 0, 0); display: inline; flex-wrap: nowrap; font-size: 12px; font-weight: 400; grid-area: auto; line-height: 18px; margin: 0px; overflow: visible; text-align: left; text-align-last: auto;"> 1-800-222-8222.</span>
|
| Additional Information Website |
|
|
<span style="box-sizing: border-box; color: rgb(0, 0, 0); display: inline; flex-wrap: nowrap; font-size: 12px; font-weight: 400; grid-area: auto; line-height: 18px; margin: 0px; overflow: visible; text-align: left; text-align-last: auto; white-space-collapse: preserve-breaks;">allspringglobal.com</span>
|
| Expenses [Text Block] |
|
|
What were the Fund costs for the past year?The table explains the costs you would have paid within the reporting period based on a hypothetical $10,000 investment.
Table Summary
CLASS NAME |
COSTS OF A $10,000 INVESTMENT |
COSTS PAID AS A % OF A $10,000 INVESTMENT |
Class A |
$86 |
0.77%Footnote Reference1 |
| Footnote |
Description |
Footnote1 |
Includes the fees charged by the Manager for providing advisory services to the Master Portfolio in which the Fund invests substantially all of its assets. | The manager has contractually committed to waive fees and/or reimburse certain expenses to the extent necessary to cap the Fund's total annual fund operating expense ratio at a specific amount. Without this cap, the costs shown above may have been higher. Please see the prospectus for the amount and the expiration date of the cap. Prior to or after the commitment expiration date, the cap may be increased or the commitment to maintain the cap may be terminated only with the approval of the Board of Trustees. |
| Expenses Paid, Amount |
|
|
$ 86
|
| Expense Ratio, Percent |
[21] |
|
0.77%
|
| Expenses Represent Both Master and Feeder [Text] |
|
|
Includes the fees charged by the Manager for providing advisory services to the Master Portfolio in which the Fund invests substantially all of its assets.
|
| Factors Affecting Performance [Text Block] |
|
|
How did the Fund perform last year and what affected its performance?The Fund outperformed its benchmark for the period. The past year saw a wide set of narratives drive the economy and financial markets. From an initial focus on tariffs, markets swiftly moved onto opportunities within artificial intelligence (AI) followed by a U.S. government shutdown that lead to a dearth of data. Geopolitical risk remained. U.S. economic growth remained above trend, supported initially by AI-driven capital expenditures and resilient consumer spending. Inflation remained above target. Outside the U.S., investment opportunities were divergent. Globally, expectations for earnings growth remain concentrated in one theme: AI. We spent the bulk of the period with lower-than-benchmark exposure to U.S. assets, preferring emerging markets and developed ex U.S. equities. Early in 2026, we moderated this positioning slightly. We also increased exposure to commodities during the period. Exposure to precious metals equities and commodities and tactical asset allocation were the primary drivers of outperformance. No major portfolio components detracted significantly from the benchmark. |
| Performance Past Does Not Indicate Future [Text] |
|
|
Figures quoted represent past performance, which is no guarantee of future results,
|
| Line Graph [Table Text Block] |
|
|

Table Summary
|
Class A with Load |
Real Return Blended Index |
Bloomberg U.S. Aggregate Bond Index |
Russell 3000® Index |
4/30/2016 |
$9,550 |
$10,000 |
$10,000 |
$10,000 |
5/31/2016 |
$9,494 |
$9,929 |
$10,003 |
$10,179 |
6/30/2016 |
$9,732 |
$10,136 |
$10,182 |
$10,200 |
7/31/2016 |
$9,810 |
$10,224 |
$10,247 |
$10,605 |
8/31/2016 |
$9,722 |
$10,178 |
$10,235 |
$10,632 |
9/30/2016 |
$9,790 |
$10,233 |
$10,229 |
$10,648 |
10/31/2016 |
$9,682 |
$10,192 |
$10,151 |
$10,418 |
11/30/2016 |
$9,504 |
$9,997 |
$9,911 |
$10,884 |
12/31/2016 |
$9,553 |
$9,987 |
$9,925 |
$11,097 |
1/31/2017 |
$9,650 |
$10,071 |
$9,944 |
$11,305 |
2/28/2017 |
$9,689 |
$10,118 |
$10,011 |
$11,726 |
3/31/2017 |
$9,683 |
$10,113 |
$10,006 |
$11,734 |
4/30/2017 |
$9,702 |
$10,173 |
$10,083 |
$11,858 |
5/31/2017 |
$9,705 |
$10,168 |
$10,160 |
$11,980 |
6/30/2017 |
$9,617 |
$10,072 |
$10,150 |
$12,088 |
7/31/2017 |
$9,689 |
$10,117 |
$10,194 |
$12,316 |
8/31/2017 |
$9,759 |
$10,225 |
$10,285 |
$12,339 |
9/30/2017 |
$9,733 |
$10,159 |
$10,236 |
$12,640 |
10/31/2017 |
$9,774 |
$10,181 |
$10,242 |
$12,916 |
11/30/2017 |
$9,794 |
$10,194 |
$10,229 |
$13,308 |
12/31/2017 |
$9,941 |
$10,287 |
$10,276 |
$13,441 |
1/31/2018 |
$9,922 |
$10,199 |
$10,158 |
$14,150 |
2/28/2018 |
$9,704 |
$10,100 |
$10,061 |
$13,628 |
3/31/2018 |
$9,784 |
$10,206 |
$10,126 |
$13,355 |
4/30/2018 |
$9,804 |
$10,200 |
$10,051 |
$13,406 |
5/31/2018 |
$9,826 |
$10,244 |
$10,122 |
$13,784 |
6/30/2018 |
$9,873 |
$10,285 |
$10,110 |
$13,874 |
7/31/2018 |
$9,882 |
$10,235 |
$10,112 |
$14,335 |
8/31/2018 |
$9,868 |
$10,309 |
$10,177 |
$14,838 |
9/30/2018 |
$9,820 |
$10,201 |
$10,112 |
$14,863 |
10/31/2018 |
$9,623 |
$10,054 |
$10,032 |
$13,768 |
11/30/2018 |
$9,657 |
$10,102 |
$10,092 |
$14,044 |
12/31/2018 |
$9,542 |
$10,158 |
$10,277 |
$12,737 |
1/31/2019 |
$9,796 |
$10,294 |
$10,386 |
$13,830 |
2/28/2019 |
$9,816 |
$10,293 |
$10,380 |
$14,316 |
3/31/2019 |
$9,999 |
$10,482 |
$10,580 |
$14,526 |
4/30/2019 |
$10,052 |
$10,517 |
$10,582 |
$15,106 |
5/31/2019 |
$10,078 |
$10,691 |
$10,770 |
$14,128 |
6/30/2019 |
$10,224 |
$10,782 |
$10,906 |
$15,120 |
7/31/2019 |
$10,273 |
$10,821 |
$10,930 |
$15,345 |
8/31/2019 |
$10,453 |
$11,078 |
$11,213 |
$15,032 |
9/30/2019 |
$10,381 |
$10,927 |
$11,153 |
$15,296 |
10/31/2019 |
$10,376 |
$10,955 |
$11,187 |
$15,625 |
11/30/2019 |
$10,398 |
$10,972 |
$11,181 |
$16,219 |
12/31/2019 |
$10,484 |
$11,014 |
$11,173 |
$16,688 |
1/31/2020 |
$10,598 |
$11,245 |
$11,388 |
$16,669 |
2/29/2020 |
$10,515 |
$11,400 |
$11,593 |
$15,305 |
3/31/2020 |
$10,114 |
$11,200 |
$11,525 |
$13,200 |
4/30/2020 |
$10,508 |
$11,512 |
$11,730 |
$14,948 |
5/31/2020 |
$10,630 |
$11,546 |
$11,784 |
$15,748 |
6/30/2020 |
$10,734 |
$11,675 |
$11,859 |
$16,108 |
7/31/2020 |
$11,046 |
$11,943 |
$12,036 |
$17,022 |
8/31/2020 |
$11,148 |
$12,074 |
$11,939 |
$18,255 |
9/30/2020 |
$11,072 |
$12,029 |
$11,932 |
$17,591 |
10/31/2020 |
$10,982 |
$11,952 |
$11,879 |
$17,211 |
11/30/2020 |
$11,193 |
$12,086 |
$11,995 |
$19,305 |
12/31/2020 |
$11,326 |
$12,224 |
$12,012 |
$20,173 |
1/31/2021 |
$11,316 |
$12,265 |
$11,926 |
$20,084 |
2/28/2021 |
$11,186 |
$12,067 |
$11,753 |
$20,711 |
3/31/2021 |
$11,279 |
$12,044 |
$11,607 |
$21,454 |
4/30/2021 |
$11,471 |
$12,213 |
$11,698 |
$22,560 |
5/31/2021 |
$11,598 |
$12,361 |
$11,737 |
$22,663 |
6/30/2021 |
$11,651 |
$12,436 |
$11,819 |
$23,222 |
7/31/2021 |
$11,894 |
$12,767 |
$11,951 |
$23,614 |
8/31/2021 |
$11,913 |
$12,745 |
$11,929 |
$24,288 |
9/30/2021 |
$11,771 |
$12,653 |
$11,825 |
$23,198 |
10/31/2021 |
$11,967 |
$12,797 |
$11,822 |
$24,767 |
11/30/2021 |
$12,021 |
$12,911 |
$11,857 |
$24,390 |
12/31/2021 |
$12,202 |
$12,952 |
$11,827 |
$25,350 |
1/31/2022 |
$11,902 |
$12,690 |
$11,572 |
$23,859 |
2/28/2022 |
$11,963 |
$12,799 |
$11,443 |
$23,258 |
3/31/2022 |
$11,916 |
$12,561 |
$11,125 |
$24,012 |
4/30/2022 |
$11,670 |
$12,304 |
$10,703 |
$21,857 |
5/31/2022 |
$11,538 |
$12,182 |
$10,772 |
$21,828 |
6/30/2022 |
$11,072 |
$11,797 |
$10,603 |
$20,002 |
7/31/2022 |
$11,572 |
$12,310 |
$10,862 |
$21,878 |
8/31/2022 |
$11,274 |
$11,983 |
$10,555 |
$21,062 |
9/30/2022 |
$10,572 |
$11,190 |
$10,099 |
$19,109 |
10/31/2022 |
$10,825 |
$11,329 |
$9,968 |
$20,676 |
11/30/2022 |
$11,113 |
$11,536 |
$10,335 |
$21,755 |
12/31/2022 |
$10,964 |
$11,418 |
$10,288 |
$20,481 |
1/31/2023 |
$11,241 |
$11,627 |
$10,604 |
$21,892 |
2/28/2023 |
$11,056 |
$11,468 |
$10,330 |
$21,380 |
3/31/2023 |
$11,334 |
$11,799 |
$10,593 |
$21,952 |
4/30/2023 |
$11,376 |
$11,812 |
$10,657 |
$22,186 |
5/31/2023 |
$11,181 |
$11,671 |
$10,541 |
$22,272 |
6/30/2023 |
$11,234 |
$11,632 |
$10,503 |
$23,793 |
7/31/2023 |
$11,299 |
$11,646 |
$10,496 |
$24,646 |
8/31/2023 |
$11,193 |
$11,542 |
$10,429 |
$24,170 |
9/30/2023 |
$10,975 |
$11,329 |
$10,164 |
$23,019 |
10/31/2023 |
$10,868 |
$11,247 |
$10,003 |
$22,408 |
11/30/2023 |
$11,196 |
$11,583 |
$10,456 |
$24,498 |
12/31/2023 |
$11,551 |
$12,032 |
$10,857 |
$25,797 |
1/31/2024 |
$11,467 |
$12,098 |
$10,827 |
$26,083 |
2/29/2024 |
$11,551 |
$12,271 |
$10,674 |
$27,495 |
3/31/2024 |
$11,867 |
$12,492 |
$10,773 |
$28,382 |
4/30/2024 |
$11,399 |
$12,127 |
$10,500 |
$27,133 |
5/31/2024 |
$11,723 |
$12,480 |
$10,678 |
$28,415 |
6/30/2024 |
$11,986 |
$12,709 |
$10,780 |
$29,295 |
7/31/2024 |
$12,228 |
$12,936 |
$11,031 |
$29,839 |
8/31/2024 |
$12,470 |
$13,141 |
$11,190 |
$30,489 |
9/30/2024 |
$12,659 |
$13,366 |
$11,340 |
$31,120 |
10/31/2024 |
$12,416 |
$13,162 |
$11,058 |
$30,891 |
11/30/2024 |
$12,841 |
$13,558 |
$11,175 |
$32,946 |
12/31/2024 |
$12,489 |
$13,276 |
$10,992 |
$31,939 |
1/31/2025 |
$12,636 |
$13,523 |
$11,051 |
$32,947 |
2/28/2025 |
$12,795 |
$13,606 |
$11,294 |
$32,316 |
3/31/2025 |
$12,584 |
$13,323 |
$11,298 |
$30,431 |
4/30/2025 |
$12,719 |
$13,310 |
$11,343 |
$30,227 |
5/31/2025 |
$12,854 |
$13,599 |
$11,261 |
$32,143 |
6/30/2025 |
$13,045 |
$13,972 |
$11,435 |
$33,776 |
7/31/2025 |
$13,045 |
$14,093 |
$11,404 |
$34,520 |
8/31/2025 |
$13,305 |
$14,329 |
$11,541 |
$35,318 |
9/30/2025 |
$13,636 |
$14,589 |
$11,667 |
$36,537 |
10/31/2025 |
$13,823 |
$14,756 |
$11,740 |
$37,320 |
11/30/2025 |
$13,861 |
$14,802 |
$11,813 |
$37,423 |
12/31/2025 |
$13,850 |
$14,776 |
$11,795 |
$37,415 |
1/31/2026 |
$14,746 |
$14,878 |
$11,808 |
$37,996 |
2/28/2026 |
$15,490 |
$14,975 |
$12,001 |
$37,815 |
3/31/2026 |
$15,456 |
$14,541 |
$11,789 |
$35,935 |
4/30/2026 |
$15,633 |
$15,192 |
$11,803 |
$39,601 |
|
| Average Annual Return [Table Text Block] |
|
|
Table Summary
AATR |
1 Year |
5 Years |
10 Years |
Class A |
22.91 |
6.39 |
5.05 |
Class A with Load |
17.38 |
5.41 |
4.57 |
Real Return Blended IndexFootnote Reference* |
14.14 |
4.46 |
4.27 |
Bloomberg U.S. Aggregate Bond Index |
4.06 |
0.18 |
1.67 |
Russell 3000® Index |
31.01 |
11.91 |
14.75 | |
| No Deduction of Taxes [Text Block] |
|
|
do not reflect taxes that a shareholder may pay on an investment in a fund.
|
| AssetsNet |
|
|
$ 216,642,552
|
| Holdings Count | Holding |
|
|
433
|
| Advisory Fees Paid, Amount |
[22] |
|
$ 345,013
|
| InvestmentCompanyPortfolioTurnover |
|
|
59.00%
|
| Additional Fund Statistics [Text Block] |
|
|
Table Summary
Total net assets |
$216,642,552 |
# of portfolio holdings |
433 |
Portfolio turnover rate |
59% |
Total advisory fees paid |
$345,013Footnote Reference* |
| Footnote |
Description |
Footnote* |
Includes the fees charged by the Manager for providing advisory services to the Master Portfolio in which the Fund invests substantially all of its assets. | |
| Holdings [Text Block] |
|
|
PORTFOLIO ALLOCATION (% OF TOTAL INVESTMENT)
Table Summary
Common stocks |
48.3 |
U.S. Treasury securities |
28.7 |
Investment companies |
11.6 |
Corporate bonds and notes |
9.8 |
Yankee corporate bonds and notes |
1.5 |
Loans |
0.1 | |
| Largest Holdings [Text Block] |
|
|
TOP TEN HOLDINGS (% OF NET ASSETS)
Table Summary
iShares MSCI Brazil ETF |
3.5 |
iShares MSCI South Korea ETF |
3.3 |
TIPS, 2.13%, 1‑15‑2035 |
1.4 |
TIPS, 0.13%, 4‑15‑2027 |
1.2 |
TIPS, 0.13%, 1‑15‑2030 |
1.2 |
TIPS, 1.38%, 7‑15‑2033 |
1.1 |
TIPS, 0.50%, 1‑15‑2028 |
1.1 |
TIPS, 0.13%, 7‑15‑2030 |
1.0 |
TIPS, 1.63%, 10‑15‑2027 |
1.0 |
Alphabet, Inc. Class A |
1.0 | |
| Material Fund Change [Text Block] |
|
|
|
| C000176626 |
|
|
|
| Shareholder Report [Line Items] |
|
|
|
| Fund Name |
|
|
Real Return Fund
|
| Class Name |
|
|
Class R6
|
| Trading Symbol |
|
|
IPBJX
|
| Annual or Semi-Annual Statement [Text Block] |
|
|
This annual shareholder report contains important information about Real Return Fund for the period from May 1, 2025 to April 30, 2026.
|
| Additional Information [Text Block] |
|
|
You can find additional information about the Fund at allspringglobal.com. You can also request this information by contacting us at 1-800-222-8222.
|
| Additional Information Phone Number |
|
|
<span style="white-space: nowrap; box-sizing: border-box; color: rgb(0, 0, 0); display: inline; flex-wrap: nowrap; font-size: 12px; font-weight: 400; grid-area: auto; line-height: 18px; margin: 0px; overflow: visible; text-align: left; text-align-last: auto;"> 1-800-222-8222.</span>
|
| Additional Information Website |
|
|
<span style="box-sizing: border-box; color: rgb(0, 0, 0); display: inline; flex-wrap: nowrap; font-size: 12px; font-weight: 400; grid-area: auto; line-height: 18px; margin: 0px; overflow: visible; text-align: left; text-align-last: auto; white-space-collapse: preserve-breaks;">allspringglobal.com</span>
|
| Expenses [Text Block] |
|
|
What were the Fund costs for the past year?The table explains the costs you would have paid within the reporting period based on a hypothetical $10,000 investment.
Table Summary
CLASS NAME |
COSTS OF A $10,000 INVESTMENT |
COSTS PAID AS A % OF A $10,000 INVESTMENT |
Class R6 |
$45 |
0.40%Footnote Reference1 |
| Footnote |
Description |
Footnote1 |
Includes the fees charged by the Manager for providing advisory services to the Master Portfolio in which the Fund invests substantially all of its assets. | The manager has contractually committed to waive fees and/or reimburse certain expenses to the extent necessary to cap the Fund's total annual fund operating expense ratio at a specific amount. Without this cap, the costs shown above may have been higher. Please see the prospectus for the amount and the expiration date of the cap. Prior to or after the commitment expiration date, the cap may be increased or the commitment to maintain the cap may be terminated only with the approval of the Board of Trustees. |
| Expenses Paid, Amount |
|
|
$ 45
|
| Expense Ratio, Percent |
[23] |
|
0.40%
|
| Expenses Represent Both Master and Feeder [Text] |
|
|
Includes the fees charged by the Manager for providing advisory services to the Master Portfolio in which the Fund invests substantially all of its assets.
|
| Factors Affecting Performance [Text Block] |
|
|
How did the Fund perform last year and what affected its performance?The Fund outperformed its benchmark for the period. The past year saw a wide set of narratives drive the economy and financial markets. From an initial focus on tariffs, markets swiftly moved onto opportunities within artificial intelligence (AI) followed by a U.S. government shutdown that lead to a dearth of data. Geopolitical risk remained. U.S. economic growth remained above trend, supported initially by AI-driven capital expenditures and resilient consumer spending. Inflation remained above target. Outside the U.S., investment opportunities were divergent. Globally, expectations for earnings growth remain concentrated in one theme: AI. We spent the bulk of the period with lower-than-benchmark exposure to U.S. assets, preferring emerging markets and developed ex U.S. equities. Early in 2026, we moderated this positioning slightly. We also increased exposure to commodities during the period. Exposure to precious metals equities and commodities and tactical asset allocation were the primary drivers of outperformance. No major portfolio components detracted significantly from the benchmark. |
| Performance Past Does Not Indicate Future [Text] |
|
|
Figures quoted represent past performance, which is no guarantee of future results,
|
| Line Graph [Table Text Block] |
|
|
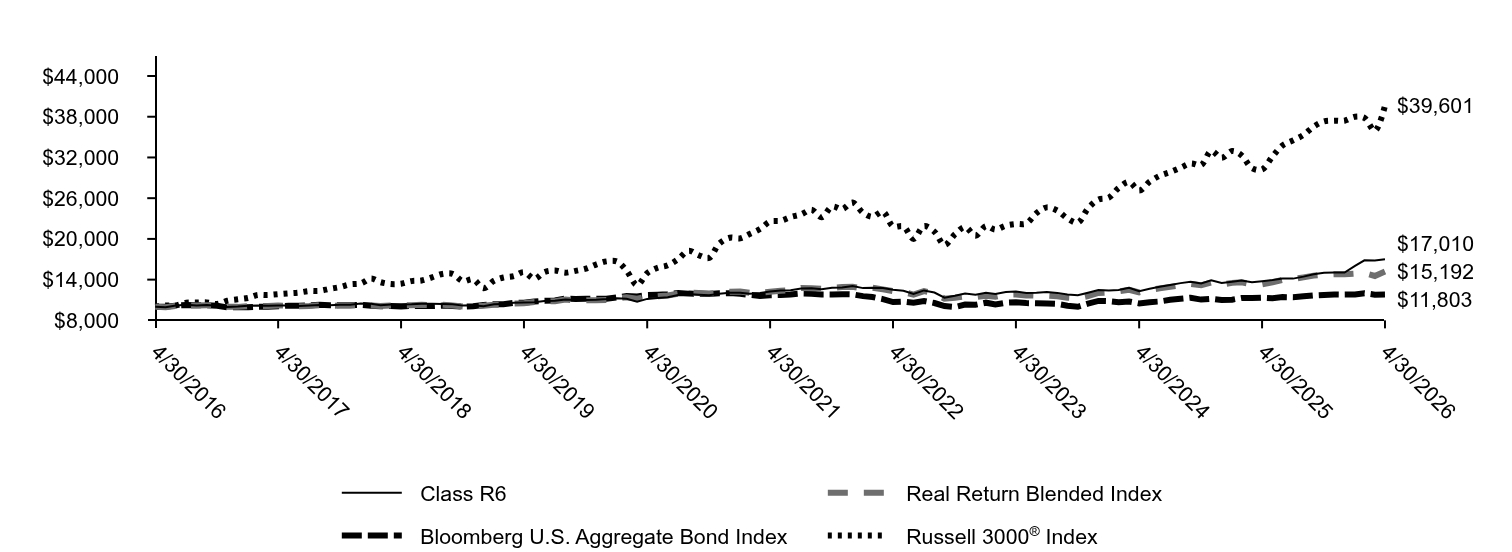
Table Summary
|
Class R6 |
Real Return Blended Index |
Bloomberg U.S. Aggregate Bond Index |
Russell 3000® Index |
4/30/2016 |
$10,000 |
$10,000 |
$10,000 |
$10,000 |
5/31/2016 |
$9,945 |
$9,929 |
$10,003 |
$10,179 |
6/30/2016 |
$10,202 |
$10,136 |
$10,182 |
$10,200 |
7/31/2016 |
$10,294 |
$10,224 |
$10,247 |
$10,605 |
8/31/2016 |
$10,193 |
$10,178 |
$10,235 |
$10,632 |
9/30/2016 |
$10,265 |
$10,233 |
$10,229 |
$10,648 |
10/31/2016 |
$10,163 |
$10,192 |
$10,151 |
$10,418 |
11/30/2016 |
$9,980 |
$9,997 |
$9,911 |
$10,884 |
12/31/2016 |
$10,036 |
$9,987 |
$9,925 |
$11,097 |
1/31/2017 |
$10,137 |
$10,071 |
$9,944 |
$11,305 |
2/28/2017 |
$10,178 |
$10,118 |
$10,011 |
$11,726 |
3/31/2017 |
$10,169 |
$10,113 |
$10,006 |
$11,734 |
4/30/2017 |
$10,190 |
$10,173 |
$10,083 |
$11,858 |
5/31/2017 |
$10,199 |
$10,168 |
$10,160 |
$11,980 |
6/30/2017 |
$10,112 |
$10,072 |
$10,150 |
$12,088 |
7/31/2017 |
$10,189 |
$10,117 |
$10,194 |
$12,316 |
8/31/2017 |
$10,266 |
$10,225 |
$10,285 |
$12,339 |
9/30/2017 |
$10,242 |
$10,159 |
$10,236 |
$12,640 |
10/31/2017 |
$10,289 |
$10,181 |
$10,242 |
$12,916 |
11/30/2017 |
$10,313 |
$10,194 |
$10,229 |
$13,308 |
12/31/2017 |
$10,472 |
$10,287 |
$10,276 |
$13,441 |
1/31/2018 |
$10,451 |
$10,199 |
$10,158 |
$14,150 |
2/28/2018 |
$10,234 |
$10,100 |
$10,061 |
$13,628 |
3/31/2018 |
$10,325 |
$10,206 |
$10,126 |
$13,355 |
4/30/2018 |
$10,346 |
$10,200 |
$10,051 |
$13,406 |
5/31/2018 |
$10,366 |
$10,244 |
$10,122 |
$13,784 |
6/30/2018 |
$10,429 |
$10,285 |
$10,110 |
$13,874 |
7/31/2018 |
$10,431 |
$10,235 |
$10,112 |
$14,335 |
8/31/2018 |
$10,420 |
$10,309 |
$10,177 |
$14,838 |
9/30/2018 |
$10,373 |
$10,201 |
$10,112 |
$14,863 |
10/31/2018 |
$10,171 |
$10,054 |
$10,032 |
$13,768 |
11/30/2018 |
$10,209 |
$10,102 |
$10,092 |
$14,044 |
12/31/2018 |
$10,094 |
$10,158 |
$10,277 |
$12,737 |
1/31/2019 |
$10,371 |
$10,294 |
$10,386 |
$13,830 |
2/28/2019 |
$10,392 |
$10,293 |
$10,380 |
$14,316 |
3/31/2019 |
$10,587 |
$10,482 |
$10,580 |
$14,526 |
4/30/2019 |
$10,645 |
$10,517 |
$10,582 |
$15,106 |
5/31/2019 |
$10,676 |
$10,691 |
$10,770 |
$14,128 |
6/30/2019 |
$10,834 |
$10,782 |
$10,906 |
$15,120 |
7/31/2019 |
$10,887 |
$10,821 |
$10,930 |
$15,345 |
8/31/2019 |
$11,080 |
$11,078 |
$11,213 |
$15,032 |
9/30/2019 |
$11,008 |
$10,927 |
$11,153 |
$15,296 |
10/31/2019 |
$11,017 |
$10,955 |
$11,187 |
$15,625 |
11/30/2019 |
$11,044 |
$10,972 |
$11,181 |
$16,219 |
12/31/2019 |
$11,129 |
$11,014 |
$11,173 |
$16,688 |
1/31/2020 |
$11,260 |
$11,245 |
$11,388 |
$16,669 |
2/29/2020 |
$11,172 |
$11,400 |
$11,593 |
$15,305 |
3/31/2020 |
$10,748 |
$11,200 |
$11,525 |
$13,200 |
4/30/2020 |
$11,163 |
$11,512 |
$11,730 |
$14,948 |
5/31/2020 |
$11,310 |
$11,546 |
$11,784 |
$15,748 |
6/30/2020 |
$11,419 |
$11,675 |
$11,859 |
$16,108 |
7/31/2020 |
$11,748 |
$11,943 |
$12,036 |
$17,022 |
8/31/2020 |
$11,866 |
$12,074 |
$11,939 |
$18,255 |
9/30/2020 |
$11,790 |
$12,029 |
$11,932 |
$17,591 |
10/31/2020 |
$11,700 |
$11,952 |
$11,879 |
$17,211 |
11/30/2020 |
$11,925 |
$12,086 |
$11,995 |
$19,305 |
12/31/2020 |
$12,071 |
$12,224 |
$12,012 |
$20,173 |
1/31/2021 |
$12,063 |
$12,265 |
$11,926 |
$20,084 |
2/28/2021 |
$11,929 |
$12,067 |
$11,753 |
$20,711 |
3/31/2021 |
$12,030 |
$12,044 |
$11,607 |
$21,454 |
4/30/2021 |
$12,238 |
$12,213 |
$11,698 |
$22,560 |
5/31/2021 |
$12,386 |
$12,361 |
$11,737 |
$22,663 |
6/30/2021 |
$12,445 |
$12,436 |
$11,819 |
$23,222 |
7/31/2021 |
$12,706 |
$12,767 |
$11,951 |
$23,614 |
8/31/2021 |
$12,730 |
$12,745 |
$11,929 |
$24,288 |
9/30/2021 |
$12,584 |
$12,653 |
$11,825 |
$23,198 |
10/31/2021 |
$12,795 |
$12,797 |
$11,822 |
$24,767 |
11/30/2021 |
$12,856 |
$12,911 |
$11,857 |
$24,390 |
12/31/2021 |
$13,065 |
$12,952 |
$11,827 |
$25,350 |
1/31/2022 |
$12,750 |
$12,690 |
$11,572 |
$23,859 |
2/28/2022 |
$12,806 |
$12,799 |
$11,443 |
$23,258 |
3/31/2022 |
$12,771 |
$12,561 |
$11,125 |
$24,012 |
4/30/2022 |
$12,515 |
$12,304 |
$10,703 |
$21,857 |
5/31/2022 |
$12,368 |
$12,182 |
$10,772 |
$21,828 |
6/30/2022 |
$11,878 |
$11,797 |
$10,603 |
$20,002 |
7/31/2022 |
$12,411 |
$12,310 |
$10,862 |
$21,878 |
8/31/2022 |
$12,100 |
$11,983 |
$10,555 |
$21,062 |
9/30/2022 |
$11,347 |
$11,190 |
$10,099 |
$19,109 |
10/31/2022 |
$11,618 |
$11,329 |
$9,968 |
$20,676 |
11/30/2022 |
$11,940 |
$11,536 |
$10,335 |
$21,755 |
12/31/2022 |
$11,776 |
$11,418 |
$10,288 |
$20,481 |
1/31/2023 |
$12,070 |
$11,627 |
$10,604 |
$21,892 |
2/28/2023 |
$11,886 |
$11,468 |
$10,330 |
$21,380 |
3/31/2023 |
$12,180 |
$11,799 |
$10,593 |
$21,952 |
4/30/2023 |
$12,240 |
$11,812 |
$10,657 |
$22,186 |
5/31/2023 |
$12,036 |
$11,671 |
$10,541 |
$22,272 |
6/30/2023 |
$12,085 |
$11,632 |
$10,503 |
$23,793 |
7/31/2023 |
$12,170 |
$11,646 |
$10,496 |
$24,646 |
8/31/2023 |
$12,048 |
$11,542 |
$10,429 |
$24,170 |
9/30/2023 |
$11,820 |
$11,329 |
$10,164 |
$23,019 |
10/31/2023 |
$11,709 |
$11,247 |
$10,003 |
$22,408 |
11/30/2023 |
$12,075 |
$11,583 |
$10,456 |
$24,498 |
12/31/2023 |
$12,459 |
$12,032 |
$10,857 |
$25,797 |
1/31/2024 |
$12,383 |
$12,098 |
$10,827 |
$26,083 |
2/29/2024 |
$12,472 |
$12,271 |
$10,674 |
$27,495 |
3/31/2024 |
$12,805 |
$12,492 |
$10,773 |
$28,382 |
4/30/2024 |
$12,306 |
$12,127 |
$10,500 |
$27,133 |
5/31/2024 |
$12,664 |
$12,480 |
$10,678 |
$28,415 |
6/30/2024 |
$12,956 |
$12,709 |
$10,780 |
$29,295 |
7/31/2024 |
$13,214 |
$12,936 |
$11,031 |
$29,839 |
8/31/2024 |
$13,485 |
$13,141 |
$11,190 |
$30,489 |
9/30/2024 |
$13,687 |
$13,366 |
$11,340 |
$31,120 |
10/31/2024 |
$13,427 |
$13,162 |
$11,058 |
$30,891 |
11/30/2024 |
$13,895 |
$13,558 |
$11,175 |
$32,946 |
12/31/2024 |
$13,520 |
$13,276 |
$10,992 |
$31,939 |
1/31/2025 |
$13,677 |
$13,523 |
$11,051 |
$32,947 |
2/28/2025 |
$13,860 |
$13,606 |
$11,294 |
$32,316 |
3/31/2025 |
$13,632 |
$13,323 |
$11,298 |
$30,431 |
4/30/2025 |
$13,777 |
$13,310 |
$11,343 |
$30,227 |
5/31/2025 |
$13,934 |
$13,599 |
$11,261 |
$32,143 |
6/30/2025 |
$14,151 |
$13,972 |
$11,435 |
$33,776 |
7/31/2025 |
$14,151 |
$14,093 |
$11,404 |
$34,520 |
8/31/2025 |
$14,442 |
$14,329 |
$11,541 |
$35,318 |
9/30/2025 |
$14,798 |
$14,589 |
$11,667 |
$36,537 |
10/31/2025 |
$14,999 |
$14,756 |
$11,740 |
$37,320 |
11/30/2025 |
$15,053 |
$14,802 |
$11,813 |
$37,423 |
12/31/2025 |
$15,043 |
$14,776 |
$11,795 |
$37,415 |
1/31/2026 |
$16,031 |
$14,878 |
$11,808 |
$37,996 |
2/28/2026 |
$16,842 |
$14,975 |
$12,001 |
$37,815 |
3/31/2026 |
$16,807 |
$14,541 |
$11,789 |
$35,935 |
4/30/2026 |
$17,010 |
$15,192 |
$11,803 |
$39,601 |
|
| Average Annual Return [Table Text Block] |
|
|
Table Summary
AATR |
1 Year |
5 Years |
10 Years |
Class R6Footnote Reference* |
23.47 |
6.81 |
5.46 |
Real Return Blended IndexFootnote Reference† |
14.14 |
4.46 |
4.27 |
Bloomberg U.S. Aggregate Bond Index |
4.06 |
0.18 |
1.67 |
Russell 3000® Index |
31.01 |
11.91 |
14.75 | |
| No Deduction of Taxes [Text Block] |
|
|
do not reflect taxes that a shareholder may pay on an investment in a fund.
|
| AssetsNet |
|
|
$ 216,642,552
|
| Holdings Count | Holding |
|
|
433
|
| Advisory Fees Paid, Amount |
[24] |
|
$ 345,013
|
| InvestmentCompanyPortfolioTurnover |
|
|
59.00%
|
| Additional Fund Statistics [Text Block] |
|
|
Table Summary
Total net assets |
$216,642,552 |
# of portfolio holdings |
433 |
Portfolio turnover rate |
59% |
Total advisory fees paid |
$345,013Footnote Reference* |
| Footnote |
Description |
Footnote* |
Includes the fees charged by the Manager for providing advisory services to the Master Portfolio in which the Fund invests substantially all of its assets. | |
| Holdings [Text Block] |
|
|
PORTFOLIO ALLOCATION (% OF TOTAL INVESTMENT)
Table Summary
Common stocks |
48.3 |
U.S. Treasury securities |
28.7 |
Investment companies |
11.6 |
Corporate bonds and notes |
9.8 |
Yankee corporate bonds and notes |
1.5 |
Loans |
0.1 | |
| Largest Holdings [Text Block] |
|
|
TOP TEN HOLDINGS (% OF NET ASSETS)
Table Summary
iShares MSCI Brazil ETF |
3.5 |
iShares MSCI South Korea ETF |
3.3 |
TIPS, 2.13%, 1‑15‑2035 |
1.4 |
TIPS, 0.13%, 4‑15‑2027 |
1.2 |
TIPS, 0.13%, 1‑15‑2030 |
1.2 |
TIPS, 1.38%, 7‑15‑2033 |
1.1 |
TIPS, 0.50%, 1‑15‑2028 |
1.1 |
TIPS, 0.13%, 7‑15‑2030 |
1.0 |
TIPS, 1.63%, 10‑15‑2027 |
1.0 |
Alphabet, Inc. Class A |
1.0 | |
| Material Fund Change [Text Block] |
|
|
|
| C000176627 |
|
|
|
| Shareholder Report [Line Items] |
|
|
|
| Fund Name |
|
|
Real Return Fund
|
| Class Name |
|
|
Institutional Class
|
| Trading Symbol |
|
|
IPBNX
|
| Annual or Semi-Annual Statement [Text Block] |
|
|
This annual shareholder report contains important information about Real Return Fund for the period from May 1, 2025 to April 30, 2026.
|
| Additional Information [Text Block] |
|
|
You can find additional information about the Fund at allspringglobal.com. You can also request this information by contacting us at 1-800-222-8222.
|
| Additional Information Phone Number |
|
|
<span style="white-space: nowrap; box-sizing: border-box; color: rgb(0, 0, 0); display: inline; flex-wrap: nowrap; font-size: 12px; font-weight: 400; grid-area: auto; line-height: 18px; margin: 0px; overflow: visible; text-align: left; text-align-last: auto;"> 1-800-222-8222.</span>
|
| Additional Information Website |
|
|
<span style="box-sizing: border-box; color: rgb(0, 0, 0); display: inline; flex-wrap: nowrap; font-size: 12px; font-weight: 400; grid-area: auto; line-height: 18px; margin: 0px; overflow: visible; text-align: left; text-align-last: auto; white-space-collapse: preserve-breaks;">allspringglobal.com</span>
|
| Expenses [Text Block] |
|
|
What were the Fund costs for the past year?The table explains the costs you would have paid within the reporting period based on a hypothetical $10,000 investment.
Table Summary
CLASS NAME |
COSTS OF A $10,000 INVESTMENT |
COSTS PAID AS A % OF A $10,000 INVESTMENT |
Institutional Class |
$50 |
0.45%Footnote Reference1 |
| Footnote |
Description |
Footnote1 |
Includes the fees charged by the Manager for providing advisory services to the Master Portfolio in which the Fund invests substantially all of its assets. | The manager has contractually committed to waive fees and/or reimburse certain expenses to the extent necessary to cap the Fund's total annual fund operating expense ratio at a specific amount. Without this cap, the costs shown above may have been higher. Please see the prospectus for the amount and the expiration date of the cap. Prior to or after the commitment expiration date, the cap may be increased or the commitment to maintain the cap may be terminated only with the approval of the Board of Trustees. |
| Expenses Paid, Amount |
|
|
$ 50
|
| Expense Ratio, Percent |
[25] |
|
0.45%
|
| Expenses Represent Both Master and Feeder [Text] |
|
|
Includes the fees charged by the Manager for providing advisory services to the Master Portfolio in which the Fund invests substantially all of its assets.
|
| Factors Affecting Performance [Text Block] |
|
|
How did the Fund perform last year and what affected its performance?The Fund outperformed its benchmark for the period. The past year saw a wide set of narratives drive the economy and financial markets. From an initial focus on tariffs, markets swiftly moved onto opportunities within artificial intelligence (AI) followed by a U.S. government shutdown that lead to a dearth of data. Geopolitical risk remained. U.S. economic growth remained above trend, supported initially by AI-driven capital expenditures and resilient consumer spending. Inflation remained above target. Outside the U.S., investment opportunities were divergent. Globally, expectations for earnings growth remain concentrated in one theme: AI. We spent the bulk of the period with lower-than-benchmark exposure to U.S. assets, preferring emerging markets and developed ex U.S. equities. Early in 2026, we moderated this positioning slightly. We also increased exposure to commodities during the period. Exposure to precious metals equities and commodities and tactical asset allocation were the primary drivers of outperformance. No major portfolio components detracted significantly from the benchmark. |
| Performance Past Does Not Indicate Future [Text] |
|
|
Figures quoted represent past performance, which is no guarantee of future results,
|
| Line Graph [Table Text Block] |
|
|
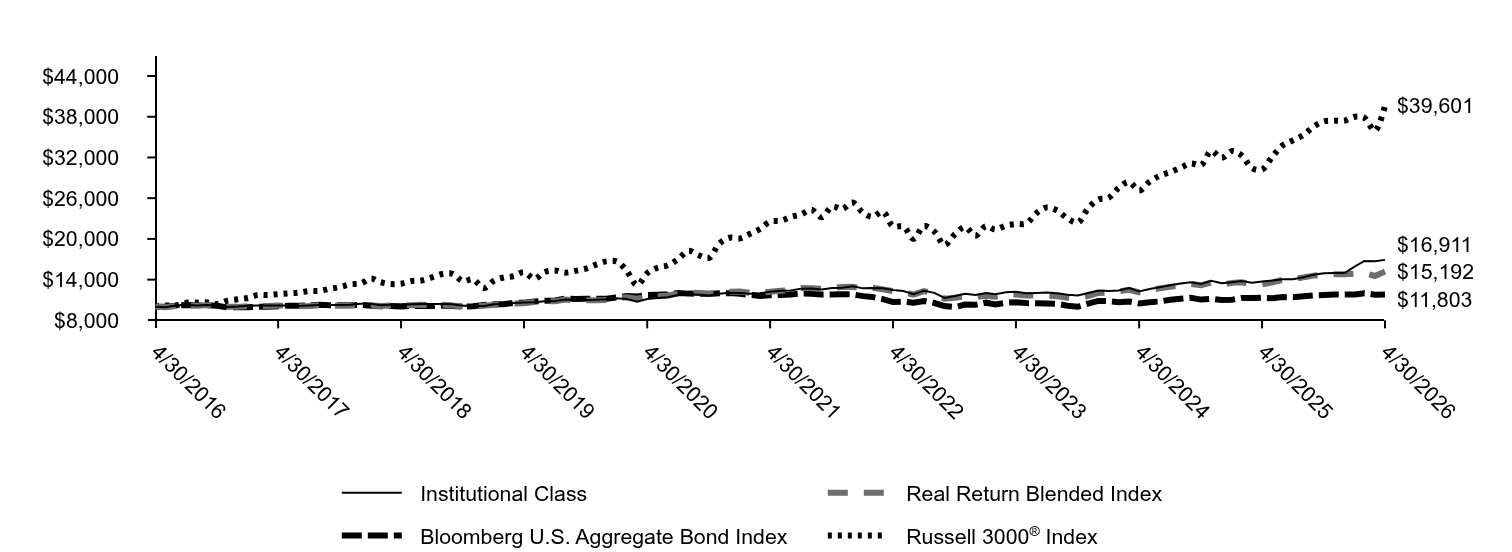
Table Summary
|
Institutional Class |
Real Return Blended Index |
Bloomberg U.S. Aggregate Bond Index |
Russell 3000® Index |
4/30/2016 |
$10,000 |
$10,000 |
$10,000 |
$10,000 |
5/31/2016 |
$9,945 |
$9,929 |
$10,003 |
$10,179 |
6/30/2016 |
$10,202 |
$10,136 |
$10,182 |
$10,200 |
7/31/2016 |
$10,294 |
$10,224 |
$10,247 |
$10,605 |
8/31/2016 |
$10,193 |
$10,178 |
$10,235 |
$10,632 |
9/30/2016 |
$10,265 |
$10,233 |
$10,229 |
$10,648 |
10/31/2016 |
$10,163 |
$10,192 |
$10,151 |
$10,418 |
11/30/2016 |
$9,980 |
$9,997 |
$9,911 |
$10,884 |
12/31/2016 |
$10,036 |
$9,987 |
$9,925 |
$11,097 |
1/31/2017 |
$10,137 |
$10,071 |
$9,944 |
$11,305 |
2/28/2017 |
$10,177 |
$10,118 |
$10,011 |
$11,726 |
3/31/2017 |
$10,178 |
$10,113 |
$10,006 |
$11,734 |
4/30/2017 |
$10,198 |
$10,173 |
$10,083 |
$11,858 |
5/31/2017 |
$10,205 |
$10,168 |
$10,160 |
$11,980 |
6/30/2017 |
$10,106 |
$10,072 |
$10,150 |
$12,088 |
7/31/2017 |
$10,193 |
$10,117 |
$10,194 |
$12,316 |
8/31/2017 |
$10,270 |
$10,225 |
$10,285 |
$12,339 |
9/30/2017 |
$10,245 |
$10,159 |
$10,236 |
$12,640 |
10/31/2017 |
$10,281 |
$10,181 |
$10,242 |
$12,916 |
11/30/2017 |
$10,314 |
$10,194 |
$10,229 |
$13,308 |
12/31/2017 |
$10,462 |
$10,287 |
$10,276 |
$13,441 |
1/31/2018 |
$10,451 |
$10,199 |
$10,158 |
$14,150 |
2/28/2018 |
$10,225 |
$10,100 |
$10,061 |
$13,628 |
3/31/2018 |
$10,315 |
$10,206 |
$10,126 |
$13,355 |
4/30/2018 |
$10,336 |
$10,200 |
$10,051 |
$13,406 |
5/31/2018 |
$10,365 |
$10,244 |
$10,122 |
$13,784 |
6/30/2018 |
$10,417 |
$10,285 |
$10,110 |
$13,874 |
7/31/2018 |
$10,419 |
$10,235 |
$10,112 |
$14,335 |
8/31/2018 |
$10,418 |
$10,309 |
$10,177 |
$14,838 |
9/30/2018 |
$10,361 |
$10,201 |
$10,112 |
$14,863 |
10/31/2018 |
$10,157 |
$10,054 |
$10,032 |
$13,768 |
11/30/2018 |
$10,195 |
$10,102 |
$10,092 |
$14,044 |
12/31/2018 |
$10,080 |
$10,158 |
$10,277 |
$12,737 |
1/31/2019 |
$10,356 |
$10,294 |
$10,386 |
$13,830 |
2/28/2019 |
$10,377 |
$10,293 |
$10,380 |
$14,316 |
3/31/2019 |
$10,571 |
$10,482 |
$10,580 |
$14,526 |
4/30/2019 |
$10,629 |
$10,517 |
$10,582 |
$15,106 |
5/31/2019 |
$10,670 |
$10,691 |
$10,770 |
$14,128 |
6/30/2019 |
$10,827 |
$10,782 |
$10,906 |
$15,120 |
7/31/2019 |
$10,870 |
$10,821 |
$10,930 |
$15,345 |
8/31/2019 |
$11,073 |
$11,078 |
$11,213 |
$15,032 |
9/30/2019 |
$10,989 |
$10,927 |
$11,153 |
$15,296 |
10/31/2019 |
$10,998 |
$10,955 |
$11,187 |
$15,625 |
11/30/2019 |
$11,024 |
$10,972 |
$11,181 |
$16,219 |
12/31/2019 |
$11,108 |
$11,014 |
$11,173 |
$16,688 |
1/31/2020 |
$11,239 |
$11,245 |
$11,388 |
$16,669 |
2/29/2020 |
$11,152 |
$11,400 |
$11,593 |
$15,305 |
3/31/2020 |
$10,738 |
$11,200 |
$11,525 |
$13,200 |
4/30/2020 |
$11,152 |
$11,512 |
$11,730 |
$14,948 |
5/31/2020 |
$11,287 |
$11,546 |
$11,784 |
$15,748 |
6/30/2020 |
$11,396 |
$11,675 |
$11,859 |
$16,108 |
7/31/2020 |
$11,734 |
$11,943 |
$12,036 |
$17,022 |
8/31/2020 |
$11,840 |
$12,074 |
$11,939 |
$18,255 |
9/30/2020 |
$11,764 |
$12,029 |
$11,932 |
$17,591 |
10/31/2020 |
$11,673 |
$11,952 |
$11,879 |
$17,211 |
11/30/2020 |
$11,908 |
$12,086 |
$11,995 |
$19,305 |
12/31/2020 |
$12,053 |
$12,224 |
$12,012 |
$20,173 |
1/31/2021 |
$12,034 |
$12,265 |
$11,926 |
$20,084 |
2/28/2021 |
$11,911 |
$12,067 |
$11,753 |
$20,711 |
3/31/2021 |
$12,000 |
$12,044 |
$11,607 |
$21,454 |
4/30/2021 |
$12,218 |
$12,213 |
$11,698 |
$22,560 |
5/31/2021 |
$12,354 |
$12,361 |
$11,737 |
$22,663 |
6/30/2021 |
$12,401 |
$12,436 |
$11,819 |
$23,222 |
7/31/2021 |
$12,673 |
$12,767 |
$11,951 |
$23,614 |
8/31/2021 |
$12,696 |
$12,745 |
$11,929 |
$24,288 |
9/30/2021 |
$12,550 |
$12,653 |
$11,825 |
$23,198 |
10/31/2021 |
$12,760 |
$12,797 |
$11,822 |
$24,767 |
11/30/2021 |
$12,820 |
$12,911 |
$11,857 |
$24,390 |
12/31/2021 |
$13,028 |
$12,952 |
$11,827 |
$25,350 |
1/31/2022 |
$12,713 |
$12,690 |
$11,572 |
$23,859 |
2/28/2022 |
$12,769 |
$12,799 |
$11,443 |
$23,258 |
3/31/2022 |
$12,734 |
$12,561 |
$11,125 |
$24,012 |
4/30/2022 |
$12,467 |
$12,304 |
$10,703 |
$21,857 |
5/31/2022 |
$12,331 |
$12,182 |
$10,772 |
$21,828 |
6/30/2022 |
$11,841 |
$11,797 |
$10,603 |
$20,002 |
7/31/2022 |
$12,373 |
$12,310 |
$10,862 |
$21,878 |
8/31/2022 |
$12,050 |
$11,983 |
$10,555 |
$21,062 |
9/30/2022 |
$11,311 |
$11,190 |
$10,099 |
$19,109 |
10/31/2022 |
$11,581 |
$11,329 |
$9,968 |
$20,676 |
11/30/2022 |
$11,901 |
$11,536 |
$10,335 |
$21,755 |
12/31/2022 |
$11,737 |
$11,418 |
$10,288 |
$20,481 |
1/31/2023 |
$12,030 |
$11,627 |
$10,604 |
$21,892 |
2/28/2023 |
$11,834 |
$11,468 |
$10,330 |
$21,380 |
3/31/2023 |
$12,138 |
$11,799 |
$10,593 |
$21,952 |
4/30/2023 |
$12,197 |
$11,812 |
$10,657 |
$22,186 |
5/31/2023 |
$11,982 |
$11,671 |
$10,541 |
$22,272 |
6/30/2023 |
$12,041 |
$11,632 |
$10,503 |
$23,793 |
7/31/2023 |
$12,113 |
$11,646 |
$10,496 |
$24,646 |
8/31/2023 |
$12,004 |
$11,542 |
$10,429 |
$24,170 |
9/30/2023 |
$11,776 |
$11,329 |
$10,164 |
$23,019 |
10/31/2023 |
$11,665 |
$11,247 |
$10,003 |
$22,408 |
11/30/2023 |
$12,029 |
$11,583 |
$10,456 |
$24,498 |
12/31/2023 |
$12,398 |
$12,032 |
$10,857 |
$25,797 |
1/31/2024 |
$12,322 |
$12,098 |
$10,827 |
$26,083 |
2/29/2024 |
$12,411 |
$12,271 |
$10,674 |
$27,495 |
3/31/2024 |
$12,754 |
$12,492 |
$10,773 |
$28,382 |
4/30/2024 |
$12,257 |
$12,127 |
$10,500 |
$27,133 |
5/31/2024 |
$12,614 |
$12,480 |
$10,678 |
$28,415 |
6/30/2024 |
$12,889 |
$12,709 |
$10,780 |
$29,295 |
7/31/2024 |
$13,159 |
$12,936 |
$11,031 |
$29,839 |
8/31/2024 |
$13,416 |
$13,141 |
$11,190 |
$30,489 |
9/30/2024 |
$13,628 |
$13,366 |
$11,340 |
$31,120 |
10/31/2024 |
$13,357 |
$13,162 |
$11,058 |
$30,891 |
11/30/2024 |
$13,822 |
$13,558 |
$11,175 |
$32,946 |
12/31/2024 |
$13,460 |
$13,276 |
$10,992 |
$31,939 |
1/31/2025 |
$13,616 |
$13,523 |
$11,051 |
$32,947 |
2/28/2025 |
$13,785 |
$13,606 |
$11,294 |
$32,316 |
3/31/2025 |
$13,558 |
$13,323 |
$11,298 |
$30,431 |
4/30/2025 |
$13,715 |
$13,310 |
$11,343 |
$30,227 |
5/31/2025 |
$13,872 |
$13,599 |
$11,261 |
$32,143 |
6/30/2025 |
$14,073 |
$13,972 |
$11,435 |
$33,776 |
7/31/2025 |
$14,073 |
$14,093 |
$11,404 |
$34,520 |
8/31/2025 |
$14,362 |
$14,329 |
$11,541 |
$35,318 |
9/30/2025 |
$14,727 |
$14,589 |
$11,667 |
$36,537 |
10/31/2025 |
$14,928 |
$14,756 |
$11,740 |
$37,320 |
11/30/2025 |
$14,968 |
$14,802 |
$11,813 |
$37,423 |
12/31/2025 |
$14,969 |
$14,776 |
$11,795 |
$37,415 |
1/31/2026 |
$15,939 |
$14,878 |
$11,808 |
$37,996 |
2/28/2026 |
$16,746 |
$14,975 |
$12,001 |
$37,815 |
3/31/2026 |
$16,709 |
$14,541 |
$11,789 |
$35,935 |
4/30/2026 |
$16,911 |
$15,192 |
$11,803 |
$39,601 |
|
| Average Annual Return [Table Text Block] |
|
|
Table Summary
AATR |
1 Year |
5 Years |
10 Years |
Institutional ClassFootnote Reference* |
23.31 |
6.72 |
5.39 |
Real Return Blended IndexFootnote Reference† |
14.14 |
4.46 |
4.27 |
Bloomberg U.S. Aggregate Bond Index |
4.06 |
0.18 |
1.67 |
Russell 3000® Index |
31.01 |
11.91 |
14.75 | |
| No Deduction of Taxes [Text Block] |
|
|
do not reflect taxes that a shareholder may pay on an investment in a fund.
|
| AssetsNet |
|
|
$ 216,642,552
|
| Holdings Count | Holding |
|
|
433
|
| Advisory Fees Paid, Amount |
[26] |
|
$ 345,013
|
| InvestmentCompanyPortfolioTurnover |
|
|
59.00%
|
| Additional Fund Statistics [Text Block] |
|
|
Table Summary
Total net assets |
$216,642,552 |
# of portfolio holdings |
433 |
Portfolio turnover rate |
59% |
Total advisory fees paid |
$345,013Footnote Reference* |
| Footnote |
Description |
Footnote* |
Includes the fees charged by the Manager for providing advisory services to the Master Portfolio in which the Fund invests substantially all of its assets. | |
| Holdings [Text Block] |
|
|
PORTFOLIO ALLOCATION (% OF TOTAL INVESTMENT)
Table Summary
Common stocks |
48.3 |
U.S. Treasury securities |
28.7 |
Investment companies |
11.6 |
Corporate bonds and notes |
9.8 |
Yankee corporate bonds and notes |
1.5 |
Loans |
0.1 | |
| Largest Holdings [Text Block] |
|
|
TOP TEN HOLDINGS (% OF NET ASSETS)
Table Summary
iShares MSCI Brazil ETF |
3.5 |
iShares MSCI South Korea ETF |
3.3 |
TIPS, 2.13%, 1‑15‑2035 |
1.4 |
TIPS, 0.13%, 4‑15‑2027 |
1.2 |
TIPS, 0.13%, 1‑15‑2030 |
1.2 |
TIPS, 1.38%, 7‑15‑2033 |
1.1 |
TIPS, 0.50%, 1‑15‑2028 |
1.1 |
TIPS, 0.13%, 7‑15‑2030 |
1.0 |
TIPS, 1.63%, 10‑15‑2027 |
1.0 |
Alphabet, Inc. Class A |
1.0 | |
| Material Fund Change [Text Block] |
|
|
|
| C000020212 |
|
|
|
| Shareholder Report [Line Items] |
|
|
|
| Fund Name |
|
|
Small Company Growth Fund
|
| Class Name |
|
|
Class A
|
| Trading Symbol |
|
|
WFSAX
|
| Annual or Semi-Annual Statement [Text Block] |
|
|
This annual shareholder report contains important information about Small Company Growth Fund for the period from May 1, 2025 to April 30, 2026.
|
| Additional Information [Text Block] |
|
|
You can find additional information about the Fund at allspringglobal.com. You can also request this information by contacting us at 1-800-222-8222.
|
| Additional Information Phone Number |
|
|
<span style="white-space: nowrap; box-sizing: border-box; color: rgb(0, 0, 0); display: inline; flex-wrap: nowrap; font-size: 12px; font-weight: 400; grid-area: auto; line-height: 18px; margin: 0px; overflow: visible; text-align: left; text-align-last: auto;"> 1-800-222-8222.</span>
|
| Additional Information Website |
|
|
<span style="box-sizing: border-box; color: rgb(0, 0, 0); display: inline; flex-wrap: nowrap; font-size: 12px; font-weight: 400; grid-area: auto; line-height: 18px; margin: 0px; overflow: visible; text-align: left; text-align-last: auto; white-space-collapse: preserve-breaks;">allspringglobal.com</span>
|
| Expenses [Text Block] |
|
|
What were the Fund costs for the past year?The table explains the costs you would have paid within the reporting period based on a hypothetical $10,000 investment.
Table Summary
CLASS NAME |
COSTS OF A $10,000 INVESTMENT |
COSTS PAID AS A % OF A $10,000 INVESTMENT |
Class A |
$146 |
1.28%Footnote Reference1 |
| Footnote |
Description |
Footnote1 |
Expenses shown aggregate those of both the Fund and the Master Portfolio. | The manager has contractually committed to waive fees and/or reimburse certain expenses to the extent necessary to cap the Fund's total annual fund operating expense ratio at a specific amount. Without this cap, the costs shown above may have been higher. Please see the prospectus for the amount and the expiration date of the cap. Prior to or after the commitment expiration date, the cap may be increased or the commitment to maintain the cap may be terminated only with the approval of the Board of Trustees. |
| Expenses Paid, Amount |
|
|
$ 146
|
| Expense Ratio, Percent |
[27] |
|
1.28%
|
| Expenses Represent Both Master and Feeder [Text] |
|
|
Expenses shown aggregate those of both the Fund and the Master Portfolio.
|
| Factors Affecting Performance [Text Block] |
|
|
How did the Fund perform last year and what affected its performance?The Fund underperformed its benchmark for the period. Extreme concentration in benchmark returns was a headwind to the Fund's relative performance. That served as a headwind to the Fund. Speculative areas of the market, such as alternative aviation, defense, quantum computing, and biotech outperformed meaningfully in the third quarter of 2025, with 20 stocks in the benchmark driving more than 70% of returns during that quarter. Additionally, in April 2026, returns were concentrated in the information technology (IT) and industrials sectors, while all other sectors lagged. Against this backdrop, IT was the largest contributor to relative performance, driven by positive stock selection within communication equipment. Health care was the largest detractor, driven by adverse stock selection and an underweight to biotechnology. Market volatility and concentration of benchmark returns have created a favorable environment to add attractively valued high-growth stocks. These additions were made across sectors, with health care, industrials, and IT having the most attractive opportunities. We also reduced software exposure in light of AI-related headwinds. |
| Performance Past Does Not Indicate Future [Text] |
|
|
Figures quoted represent past performance, which is no guarantee of future results,
|
| Line Graph [Table Text Block] |
|
|
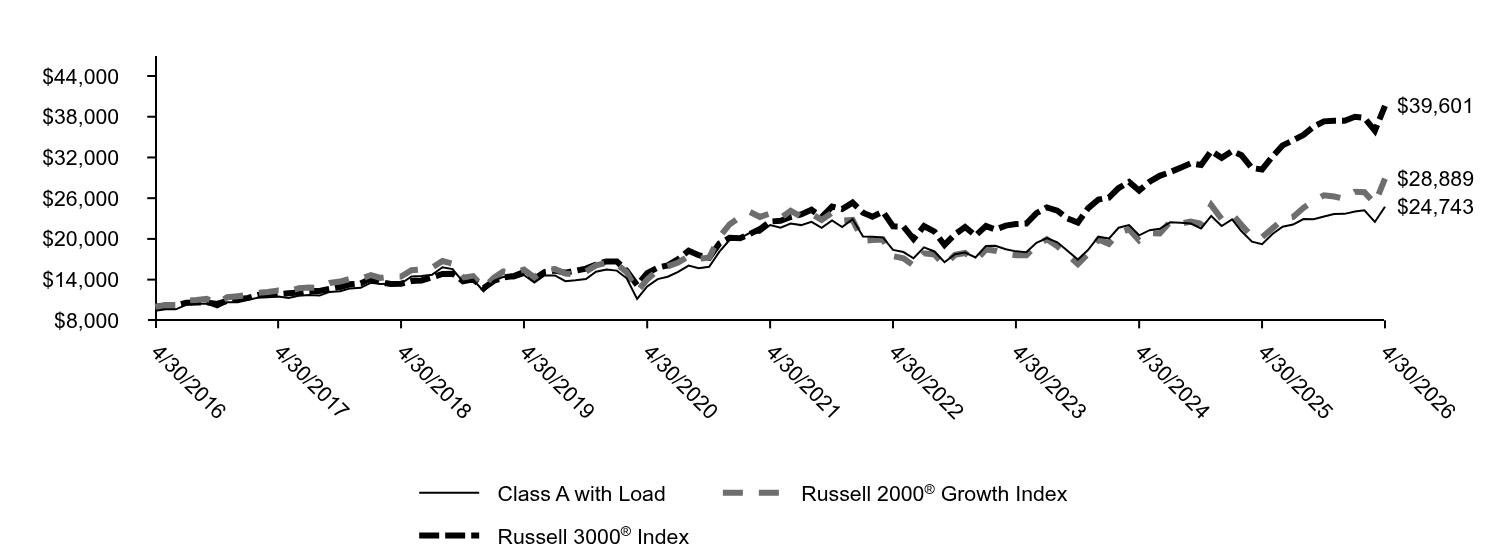
Table Summary
|
Class A with Load |
Russell 2000® Growth Index |
Russell 3000® Index |
4/30/2016 |
$9,425 |
$10,000 |
$10,000 |
5/31/2016 |
$9,619 |
$10,269 |
$10,179 |
6/30/2016 |
$9,627 |
$10,222 |
$10,200 |
7/31/2016 |
$10,285 |
$10,891 |
$10,605 |
8/31/2016 |
$10,405 |
$11,006 |
$10,632 |
9/30/2016 |
$10,487 |
$11,165 |
$10,648 |
10/31/2016 |
$9,892 |
$10,471 |
$10,418 |
11/30/2016 |
$10,658 |
$11,408 |
$10,884 |
12/31/2016 |
$10,650 |
$11,563 |
$11,097 |
1/31/2017 |
$11,015 |
$11,751 |
$11,305 |
2/28/2017 |
$11,326 |
$12,039 |
$11,726 |
3/31/2017 |
$11,403 |
$12,182 |
$11,734 |
4/30/2017 |
$11,513 |
$12,406 |
$11,858 |
5/31/2017 |
$11,296 |
$12,293 |
$11,980 |
6/30/2017 |
$11,630 |
$12,717 |
$12,088 |
7/31/2017 |
$11,735 |
$12,825 |
$12,316 |
8/31/2017 |
$11,648 |
$12,810 |
$12,339 |
9/30/2017 |
$12,194 |
$13,507 |
$12,640 |
10/31/2017 |
$12,286 |
$13,717 |
$12,916 |
11/30/2017 |
$12,710 |
$14,110 |
$13,308 |
12/31/2017 |
$12,799 |
$14,127 |
$13,441 |
1/31/2018 |
$13,547 |
$14,677 |
$14,150 |
2/28/2018 |
$13,343 |
$14,259 |
$13,628 |
3/31/2018 |
$13,386 |
$14,451 |
$13,355 |
4/30/2018 |
$13,422 |
$14,466 |
$13,406 |
5/31/2018 |
$14,460 |
$15,376 |
$13,784 |
6/30/2018 |
$14,532 |
$15,497 |
$13,874 |
7/31/2018 |
$14,710 |
$15,763 |
$14,335 |
8/31/2018 |
$15,831 |
$16,744 |
$14,838 |
9/30/2018 |
$15,550 |
$16,353 |
$14,863 |
10/31/2018 |
$13,682 |
$14,283 |
$13,768 |
11/30/2018 |
$14,001 |
$14,507 |
$14,044 |
12/31/2018 |
$12,288 |
$12,812 |
$12,737 |
1/31/2019 |
$13,831 |
$14,291 |
$13,830 |
2/28/2019 |
$14,430 |
$15,214 |
$14,316 |
3/31/2019 |
$14,153 |
$15,008 |
$14,526 |
4/30/2019 |
$14,674 |
$15,465 |
$15,106 |
5/31/2019 |
$13,574 |
$14,318 |
$14,128 |
6/30/2019 |
$14,602 |
$15,421 |
$15,120 |
7/31/2019 |
$14,619 |
$15,571 |
$15,345 |
8/31/2019 |
$13,773 |
$14,900 |
$15,032 |
9/30/2019 |
$13,904 |
$14,777 |
$15,296 |
10/31/2019 |
$14,098 |
$15,198 |
$15,625 |
11/30/2019 |
$15,164 |
$16,092 |
$16,219 |
12/31/2019 |
$15,483 |
$16,461 |
$16,688 |
1/31/2020 |
$15,329 |
$16,280 |
$16,669 |
2/29/2020 |
$14,200 |
$15,104 |
$15,305 |
3/31/2020 |
$11,156 |
$12,220 |
$13,200 |
4/30/2020 |
$12,995 |
$14,040 |
$14,948 |
5/31/2020 |
$14,076 |
$15,367 |
$15,748 |
6/30/2020 |
$14,423 |
$15,957 |
$16,108 |
7/31/2020 |
$15,151 |
$16,505 |
$17,022 |
8/31/2020 |
$16,066 |
$17,474 |
$18,255 |
9/30/2020 |
$15,670 |
$17,099 |
$17,591 |
10/31/2020 |
$15,900 |
$17,229 |
$17,211 |
11/30/2020 |
$18,089 |
$20,267 |
$19,305 |
12/31/2020 |
$19,868 |
$22,162 |
$20,173 |
1/31/2021 |
$20,118 |
$23,230 |
$20,084 |
2/28/2021 |
$20,869 |
$23,997 |
$20,711 |
3/31/2021 |
$20,890 |
$23,242 |
$21,454 |
4/30/2021 |
$22,039 |
$23,749 |
$22,560 |
5/31/2021 |
$21,655 |
$23,071 |
$22,663 |
6/30/2021 |
$22,254 |
$24,153 |
$23,222 |
7/31/2021 |
$22,032 |
$23,273 |
$23,614 |
8/31/2021 |
$22,519 |
$23,696 |
$24,288 |
9/30/2021 |
$21,641 |
$22,787 |
$23,198 |
10/31/2021 |
$22,719 |
$23,855 |
$24,767 |
11/30/2021 |
$21,736 |
$22,689 |
$24,390 |
12/31/2021 |
$22,886 |
$22,790 |
$25,350 |
1/31/2022 |
$20,345 |
$19,736 |
$23,859 |
2/28/2022 |
$20,316 |
$19,822 |
$23,258 |
3/31/2022 |
$20,229 |
$19,912 |
$24,012 |
4/30/2022 |
$18,377 |
$17,469 |
$21,857 |
5/31/2022 |
$18,062 |
$17,139 |
$21,828 |
6/30/2022 |
$17,145 |
$16,078 |
$20,002 |
7/31/2022 |
$18,745 |
$17,878 |
$21,878 |
8/31/2022 |
$18,150 |
$17,710 |
$21,062 |
9/30/2022 |
$16,561 |
$16,117 |
$19,109 |
10/31/2022 |
$17,753 |
$17,647 |
$20,676 |
11/30/2022 |
$17,980 |
$17,934 |
$21,755 |
12/31/2022 |
$17,270 |
$16,783 |
$20,481 |
1/31/2023 |
$18,967 |
$18,453 |
$21,892 |
2/28/2023 |
$18,993 |
$18,253 |
$21,380 |
3/31/2023 |
$18,475 |
$17,802 |
$21,952 |
4/30/2023 |
$18,164 |
$17,596 |
$22,186 |
5/31/2023 |
$18,022 |
$17,599 |
$22,272 |
6/30/2023 |
$19,414 |
$19,058 |
$23,793 |
7/31/2023 |
$20,126 |
$19,949 |
$24,646 |
8/31/2023 |
$19,505 |
$18,910 |
$24,170 |
9/30/2023 |
$18,261 |
$17,663 |
$23,019 |
10/31/2023 |
$16,960 |
$16,301 |
$22,408 |
11/30/2023 |
$18,365 |
$17,785 |
$24,498 |
12/31/2023 |
$20,328 |
$19,915 |
$25,797 |
1/31/2024 |
$20,045 |
$19,276 |
$26,083 |
2/29/2024 |
$21,643 |
$20,842 |
$27,495 |
3/31/2024 |
$22,050 |
$21,425 |
$28,382 |
4/30/2024 |
$20,534 |
$19,775 |
$27,133 |
5/31/2024 |
$21,285 |
$20,834 |
$28,415 |
6/30/2024 |
$21,485 |
$20,799 |
$29,295 |
7/31/2024 |
$22,442 |
$22,502 |
$29,839 |
8/31/2024 |
$22,394 |
$22,253 |
$30,489 |
9/30/2024 |
$22,263 |
$22,548 |
$31,120 |
10/31/2024 |
$21,540 |
$22,249 |
$30,891 |
11/30/2024 |
$23,379 |
$24,977 |
$32,946 |
12/31/2024 |
$21,893 |
$22,933 |
$31,939 |
1/31/2025 |
$22,884 |
$23,658 |
$32,947 |
2/28/2025 |
$21,125 |
$22,056 |
$32,316 |
3/31/2025 |
$19,603 |
$20,383 |
$30,431 |
4/30/2025 |
$19,222 |
$20,253 |
$30,227 |
5/31/2025 |
$20,720 |
$21,553 |
$32,143 |
6/30/2025 |
$21,806 |
$22,822 |
$33,776 |
7/31/2025 |
$22,107 |
$23,211 |
$34,520 |
8/31/2025 |
$22,924 |
$24,584 |
$35,318 |
9/30/2025 |
$22,908 |
$25,605 |
$36,537 |
10/31/2025 |
$23,289 |
$26,434 |
$37,320 |
11/30/2025 |
$23,677 |
$26,253 |
$37,423 |
12/31/2025 |
$23,689 |
$25,917 |
$37,415 |
1/31/2026 |
$24,028 |
$26,947 |
$37,996 |
2/28/2026 |
$24,216 |
$26,882 |
$37,815 |
3/31/2026 |
$22,500 |
$25,189 |
$35,935 |
4/30/2026 |
$24,743 |
$28,889 |
$39,601 |
|
| Average Annual Return [Table Text Block] |
|
|
Table Summary
AATR |
1 Year |
5 Years |
10 Years |
Class A |
28.72 |
2.34 |
10.13 |
Class A with Load |
21.32 |
1.14 |
9.48 |
Russell 2000® Growth Index |
42.64 |
4.00 |
11.19 |
Russell 3000® Index |
31.01 |
11.91 |
14.75 | |
| No Deduction of Taxes [Text Block] |
|
|
do not reflect taxes that a shareholder may pay on an investment in a fund.
|
| AssetsNet |
|
|
$ 515,413,913
|
| Holdings Count | Holding |
|
|
125
|
| Advisory Fees Paid, Amount |
[28] |
|
$ 4,039,027
|
| InvestmentCompanyPortfolioTurnover |
|
|
53.00%
|
| Additional Fund Statistics [Text Block] |
|
|
Table Summary
Total net assets |
$515,413,913 |
# of portfolio holdings |
125 |
Portfolio turnover rate |
53% |
Total advisory fees paid |
$4,039,027Footnote Reference* |
| Footnote |
Description |
Footnote* |
Includes the fees charged by the Manager for providing advisory services to the Master Portfolio in which the Fund invests substantially all of its assets. | |
| Holdings [Text Block] |
|
|
SECTOR ALLOCATION (% OF LONG-TERM INVESTMENTS)
Table Summary
Industrials |
29.3 |
Information technology |
22.3 |
Health care |
19.6 |
Financials |
11.2 |
Consumer discretionary |
9.6 |
Energy |
3.3 |
Materials |
2.7 |
Consumer staples |
1.4 |
Communication services |
0.6 | |
| Largest Holdings [Text Block] |
|
|
TOP TEN HOLDINGS (% OF NET ASSETS)
Table Summary
Advanced Energy Industries, Inc. |
1.8 |
TechnipFMC PLC |
1.8 |
Element Solutions, Inc. |
1.6 |
SPX Technologies, Inc. |
1.6 |
MACOM Technology Solutions Holdings, Inc. |
1.5 |
Modine Manufacturing Co. |
1.5 |
Legence Corp. Class A |
1.5 |
ESCO Technologies, Inc. |
1.4 |
MYR Group, Inc. |
1.3 |
Viavi Solutions, Inc. |
1.3 | |
| Material Fund Change [Text Block] |
|
|
|
| C000150667 |
|
|
|
| Shareholder Report [Line Items] |
|
|
|
| Fund Name |
|
|
Small Company Growth Fund
|
| Class Name |
|
|
Class R6
|
| Trading Symbol |
|
|
WSCRX
|
| Annual or Semi-Annual Statement [Text Block] |
|
|
This annual shareholder report contains important information about Small Company Growth Fund for the period from May 1, 2025 to April 30, 2026.
|
| Additional Information [Text Block] |
|
|
You can find additional information about the Fund at allspringglobal.com. You can also request this information by contacting us at 1-800-222-8222.
|
| Additional Information Phone Number |
|
|
<span style="white-space: nowrap; box-sizing: border-box; color: rgb(0, 0, 0); display: inline; flex-wrap: nowrap; font-size: 12px; font-weight: 400; grid-area: auto; line-height: 18px; margin: 0px; overflow: visible; text-align: left; text-align-last: auto;"> 1-800-222-8222.</span>
|
| Additional Information Website |
|
|
<span style="box-sizing: border-box; color: rgb(0, 0, 0); display: inline; flex-wrap: nowrap; font-size: 12px; font-weight: 400; grid-area: auto; line-height: 18px; margin: 0px; overflow: visible; text-align: left; text-align-last: auto; white-space-collapse: preserve-breaks;">allspringglobal.com</span>
|
| Expenses [Text Block] |
|
|
What were the Fund costs for the past year?The table explains the costs you would have paid within the reporting period based on a hypothetical $10,000 investment.
Table Summary
CLASS NAME |
COSTS OF A $10,000 INVESTMENT |
COSTS PAID AS A % OF A $10,000 INVESTMENT |
Class R6 |
$99 |
0.86%Footnote Reference1 |
| Footnote |
Description |
Footnote1 |
Expenses shown aggregate those of both the Fund and the Master Portfolio. | The manager has contractually committed to waive fees and/or reimburse certain expenses to the extent necessary to cap the Fund's total annual fund operating expense ratio at a specific amount. Without this cap, the costs shown above may have been higher. Please see the prospectus for the amount and the expiration date of the cap. Prior to or after the commitment expiration date, the cap may be increased or the commitment to maintain the cap may be terminated only with the approval of the Board of Trustees. |
| Expenses Paid, Amount |
|
|
$ 99
|
| Expense Ratio, Percent |
[29] |
|
0.86%
|
| Expenses Represent Both Master and Feeder [Text] |
|
|
Expenses shown aggregate those of both the Fund and the Master Portfolio.
|
| Factors Affecting Performance [Text Block] |
|
|
How did the Fund perform last year and what affected its performance?The Fund underperformed its benchmark for the period. Extreme concentration in benchmark returns was a headwind to the Fund's relative performance. That served as a headwind to the Fund. Speculative areas of the market, such as alternative aviation, defense, quantum computing, and biotech outperformed meaningfully in the third quarter of 2025, with 20 stocks in the benchmark driving more than 70% of returns during that quarter. Additionally, in April 2026, returns were concentrated in the information technology (IT) and industrials sectors, while all other sectors lagged. Against this backdrop, IT was the largest contributor to relative performance, driven by positive stock selection within communication equipment. Health care was the largest detractor, driven by adverse stock selection and an underweight to biotechnology. Market volatility and concentration of benchmark returns have created a favorable environment to add attractively valued high-growth stocks. These additions were made across sectors, with health care, industrials, and IT having the most attractive opportunities. We also reduced software exposure in light of AI-related headwinds. |
| Performance Past Does Not Indicate Future [Text] |
|
|
Figures quoted represent past performance, which is no guarantee of future results,
|
| Line Graph [Table Text Block] |
|
|
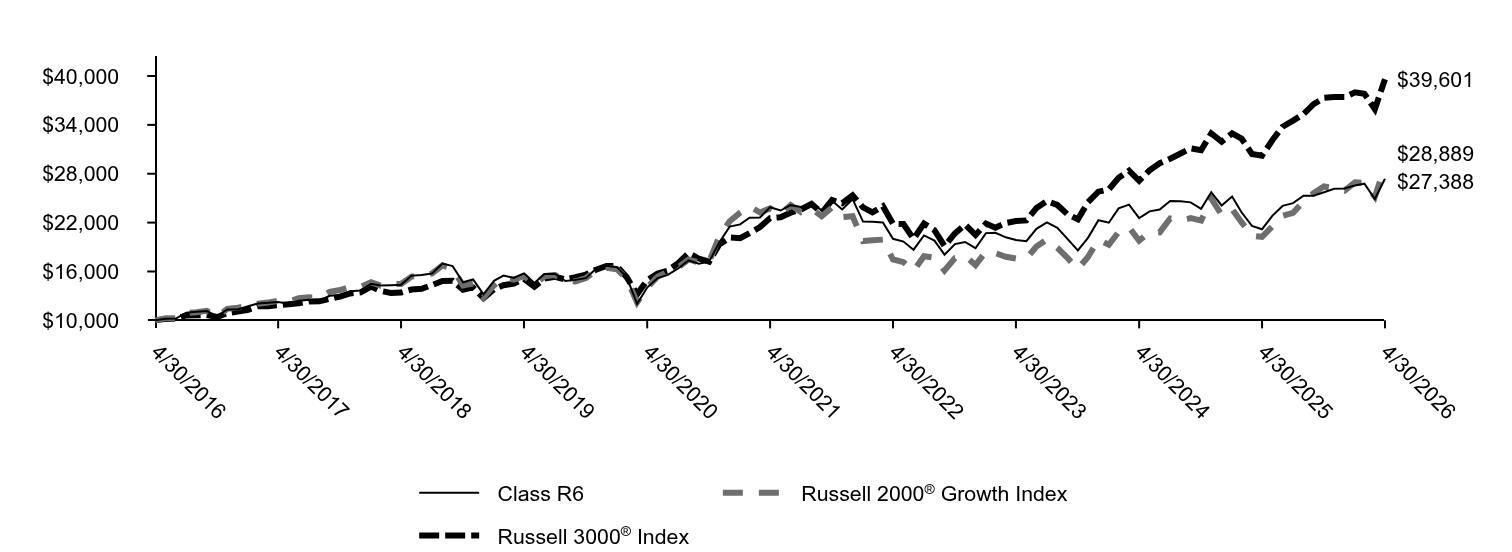
Table Summary
|
Class R6 |
Russell 2000® Growth Index |
Russell 3000® Index |
4/30/2016 |
$10,000 |
$10,000 |
$10,000 |
5/31/2016 |
$10,208 |
$10,269 |
$10,179 |
6/30/2016 |
$10,221 |
$10,222 |
$10,200 |
7/31/2016 |
$10,924 |
$10,891 |
$10,605 |
8/31/2016 |
$11,055 |
$11,006 |
$10,632 |
9/30/2016 |
$11,145 |
$11,165 |
$10,648 |
10/31/2016 |
$10,518 |
$10,471 |
$10,418 |
11/30/2016 |
$11,335 |
$11,408 |
$10,884 |
12/31/2016 |
$11,332 |
$11,563 |
$11,097 |
1/31/2017 |
$11,725 |
$11,751 |
$11,305 |
2/28/2017 |
$12,061 |
$12,039 |
$11,726 |
3/31/2017 |
$12,148 |
$12,182 |
$11,734 |
4/30/2017 |
$12,266 |
$12,406 |
$11,858 |
5/31/2017 |
$12,041 |
$12,293 |
$11,980 |
6/30/2017 |
$12,400 |
$12,717 |
$12,088 |
7/31/2017 |
$12,518 |
$12,825 |
$12,316 |
8/31/2017 |
$12,428 |
$12,810 |
$12,339 |
9/30/2017 |
$13,016 |
$13,507 |
$12,640 |
10/31/2017 |
$13,121 |
$13,717 |
$12,916 |
11/30/2017 |
$13,578 |
$14,110 |
$13,308 |
12/31/2017 |
$13,676 |
$14,127 |
$13,441 |
1/31/2018 |
$14,482 |
$14,677 |
$14,150 |
2/28/2018 |
$14,268 |
$14,259 |
$13,628 |
3/31/2018 |
$14,320 |
$14,451 |
$13,355 |
4/30/2018 |
$14,361 |
$14,466 |
$13,406 |
5/31/2018 |
$15,483 |
$15,376 |
$13,784 |
6/30/2018 |
$15,562 |
$15,497 |
$13,874 |
7/31/2018 |
$15,760 |
$15,763 |
$14,335 |
8/31/2018 |
$16,966 |
$16,744 |
$14,838 |
9/30/2018 |
$16,671 |
$16,353 |
$14,863 |
10/31/2018 |
$14,674 |
$14,283 |
$13,768 |
11/30/2018 |
$15,023 |
$14,507 |
$14,044 |
12/31/2018 |
$13,187 |
$12,812 |
$12,737 |
1/31/2019 |
$14,851 |
$14,291 |
$13,830 |
2/28/2019 |
$15,497 |
$15,214 |
$14,316 |
3/31/2019 |
$15,205 |
$15,008 |
$14,526 |
4/30/2019 |
$15,771 |
$15,465 |
$15,106 |
5/31/2019 |
$14,596 |
$14,318 |
$14,128 |
6/30/2019 |
$15,704 |
$15,421 |
$15,120 |
7/31/2019 |
$15,727 |
$15,571 |
$15,345 |
8/31/2019 |
$14,826 |
$14,900 |
$15,032 |
9/30/2019 |
$14,970 |
$14,777 |
$15,296 |
10/31/2019 |
$15,186 |
$15,198 |
$15,625 |
11/30/2019 |
$16,342 |
$16,092 |
$16,219 |
12/31/2019 |
$16,689 |
$16,461 |
$16,688 |
1/31/2020 |
$16,530 |
$16,280 |
$16,669 |
2/29/2020 |
$15,317 |
$15,104 |
$15,305 |
3/31/2020 |
$12,037 |
$12,220 |
$13,200 |
4/30/2020 |
$14,027 |
$14,040 |
$14,948 |
5/31/2020 |
$15,197 |
$15,367 |
$15,748 |
6/30/2020 |
$15,578 |
$15,957 |
$16,108 |
7/31/2020 |
$16,374 |
$16,505 |
$17,022 |
8/31/2020 |
$17,364 |
$17,474 |
$18,255 |
9/30/2020 |
$16,947 |
$17,099 |
$17,591 |
10/31/2020 |
$17,199 |
$17,229 |
$17,211 |
11/30/2020 |
$19,573 |
$20,267 |
$19,305 |
12/31/2020 |
$21,507 |
$22,162 |
$20,173 |
1/31/2021 |
$21,784 |
$23,230 |
$20,084 |
2/28/2021 |
$22,606 |
$23,997 |
$20,711 |
3/31/2021 |
$22,634 |
$23,242 |
$21,454 |
4/30/2021 |
$23,892 |
$23,749 |
$22,560 |
5/31/2021 |
$23,484 |
$23,071 |
$22,663 |
6/30/2021 |
$24,144 |
$24,153 |
$23,222 |
7/31/2021 |
$23,909 |
$23,273 |
$23,614 |
8/31/2021 |
$24,445 |
$23,696 |
$24,288 |
9/30/2021 |
$23,501 |
$22,787 |
$23,198 |
10/31/2021 |
$24,680 |
$23,855 |
$24,767 |
11/30/2021 |
$23,622 |
$22,689 |
$24,390 |
12/31/2021 |
$24,879 |
$22,790 |
$25,350 |
1/31/2022 |
$22,124 |
$19,736 |
$23,859 |
2/28/2022 |
$22,103 |
$19,822 |
$23,258 |
3/31/2022 |
$22,017 |
$19,912 |
$24,012 |
4/30/2022 |
$20,010 |
$17,469 |
$21,857 |
5/31/2022 |
$19,671 |
$17,139 |
$21,828 |
6/30/2022 |
$18,675 |
$16,078 |
$20,002 |
7/31/2022 |
$20,429 |
$17,878 |
$21,878 |
8/31/2022 |
$19,789 |
$17,710 |
$21,062 |
9/30/2022 |
$18,062 |
$16,117 |
$19,109 |
10/31/2022 |
$19,369 |
$17,647 |
$20,676 |
11/30/2022 |
$19,628 |
$17,934 |
$21,755 |
12/31/2022 |
$18,856 |
$16,783 |
$20,481 |
1/31/2023 |
$20,710 |
$18,453 |
$21,892 |
2/28/2023 |
$20,751 |
$18,253 |
$21,380 |
3/31/2023 |
$20,194 |
$17,802 |
$21,952 |
4/30/2023 |
$19,859 |
$17,596 |
$22,186 |
5/31/2023 |
$19,713 |
$17,599 |
$22,272 |
6/30/2023 |
$21,244 |
$19,058 |
$23,793 |
7/31/2023 |
$22,024 |
$19,949 |
$24,646 |
8/31/2023 |
$21,355 |
$18,910 |
$24,170 |
9/30/2023 |
$20,000 |
$17,663 |
$23,019 |
10/31/2023 |
$18,586 |
$16,301 |
$22,408 |
11/30/2023 |
$20,129 |
$17,785 |
$24,498 |
12/31/2023 |
$22,289 |
$19,915 |
$25,797 |
1/31/2024 |
$21,986 |
$19,276 |
$26,083 |
2/29/2024 |
$23,746 |
$20,842 |
$27,495 |
3/31/2024 |
$24,202 |
$21,425 |
$28,382 |
4/30/2024 |
$22,548 |
$19,775 |
$27,133 |
5/31/2024 |
$23,381 |
$20,834 |
$28,415 |
6/30/2024 |
$23,610 |
$20,799 |
$29,295 |
7/31/2024 |
$24,665 |
$22,502 |
$29,839 |
8/31/2024 |
$24,622 |
$22,253 |
$30,489 |
9/30/2024 |
$24,486 |
$22,548 |
$31,120 |
10/31/2024 |
$23,696 |
$22,249 |
$30,891 |
11/30/2024 |
$25,733 |
$24,977 |
$32,946 |
12/31/2024 |
$24,106 |
$22,933 |
$31,939 |
1/31/2025 |
$25,198 |
$23,658 |
$32,947 |
2/28/2025 |
$23,270 |
$22,056 |
$32,316 |
3/31/2025 |
$21,598 |
$20,383 |
$30,431 |
4/30/2025 |
$21,191 |
$20,253 |
$30,227 |
5/31/2025 |
$22,856 |
$21,553 |
$32,143 |
6/30/2025 |
$24,051 |
$22,822 |
$33,776 |
7/31/2025 |
$24,397 |
$23,211 |
$34,520 |
8/31/2025 |
$25,309 |
$24,584 |
$35,318 |
9/30/2025 |
$25,302 |
$25,605 |
$36,537 |
10/31/2025 |
$25,723 |
$26,434 |
$37,320 |
11/30/2025 |
$26,165 |
$26,253 |
$37,423 |
12/31/2025 |
$26,190 |
$25,917 |
$37,415 |
1/31/2026 |
$26,569 |
$26,947 |
$37,996 |
2/28/2026 |
$26,781 |
$26,882 |
$37,815 |
3/31/2026 |
$24,900 |
$25,189 |
$35,935 |
4/30/2026 |
$27,388 |
$28,889 |
$39,601 |
|
| Average Annual Return [Table Text Block] |
|
|
Table Summary
AATR |
1 Year |
5 Years |
10 Years |
Class R6 |
29.25 |
2.77 |
10.60 |
Russell 2000® Growth Index |
42.64 |
4.00 |
11.19 |
Russell 3000® Index |
31.01 |
11.91 |
14.75 | |
| No Deduction of Taxes [Text Block] |
|
|
do not reflect taxes that a shareholder may pay on an investment in a fund.
|
| AssetsNet |
|
|
$ 515,413,913
|
| Holdings Count | Holding |
|
|
125
|
| Advisory Fees Paid, Amount |
[30] |
|
$ 4,039,027
|
| InvestmentCompanyPortfolioTurnover |
|
|
53.00%
|
| Additional Fund Statistics [Text Block] |
|
|
Table Summary
Total net assets |
$515,413,913 |
# of portfolio holdings |
125 |
Portfolio turnover rate |
53% |
Total advisory fees paid |
$4,039,027Footnote Reference* |
| Footnote |
Description |
Footnote* |
Includes the fees charged by the Manager for providing advisory services to the Master Portfolio in which the Fund invests substantially all of its assets. | |
| Holdings [Text Block] |
|
|
SECTOR ALLOCATION (% OF LONG-TERM INVESTMENTS)
Table Summary
Industrials |
29.3 |
Information technology |
22.3 |
Health care |
19.6 |
Financials |
11.2 |
Consumer discretionary |
9.6 |
Energy |
3.3 |
Materials |
2.7 |
Consumer staples |
1.4 |
Communication services |
0.6 | |
| Largest Holdings [Text Block] |
|
|
TOP TEN HOLDINGS (% OF NET ASSETS)
Table Summary
Advanced Energy Industries, Inc. |
1.8 |
TechnipFMC PLC |
1.8 |
Element Solutions, Inc. |
1.6 |
SPX Technologies, Inc. |
1.6 |
MACOM Technology Solutions Holdings, Inc. |
1.5 |
Modine Manufacturing Co. |
1.5 |
Legence Corp. Class A |
1.5 |
ESCO Technologies, Inc. |
1.4 |
MYR Group, Inc. |
1.3 |
Viavi Solutions, Inc. |
1.3 | |
| Material Fund Change [Text Block] |
|
|
|
| C000064972 |
|
|
|
| Shareholder Report [Line Items] |
|
|
|
| Fund Name |
|
|
Small Company Growth Fund
|
| Class Name |
|
|
Institutional Class
|
| Trading Symbol |
|
|
WSCGX
|
| Annual or Semi-Annual Statement [Text Block] |
|
|
This annual shareholder report contains important information about Small Company Growth Fund for the period from May 1, 2025 to April 30, 2026.
|
| Additional Information [Text Block] |
|
|
You can find additional information about the Fund at allspringglobal.com. You can also request this information by contacting us at 1-800-222-8222.
|
| Additional Information Phone Number |
|
|
<span style="white-space: nowrap; box-sizing: border-box; color: rgb(0, 0, 0); display: inline; flex-wrap: nowrap; font-size: 12px; font-weight: 400; grid-area: auto; line-height: 18px; margin: 0px; overflow: visible; text-align: left; text-align-last: auto;"> 1-800-222-8222.</span>
|
| Additional Information Website |
|
|
<span style="box-sizing: border-box; color: rgb(0, 0, 0); display: inline; flex-wrap: nowrap; font-size: 12px; font-weight: 400; grid-area: auto; line-height: 18px; margin: 0px; overflow: visible; text-align: left; text-align-last: auto; white-space-collapse: preserve-breaks;">allspringglobal.com</span>
|
| Expenses [Text Block] |
|
|
What were the Fund costs for the past year?The table explains the costs you would have paid within the reporting period based on a hypothetical $10,000 investment.
Table Summary
CLASS NAME |
COSTS OF A $10,000 INVESTMENT |
COSTS PAID AS A % OF A $10,000 INVESTMENT |
Institutional Class |
$108 |
0.94%Footnote Reference1 |
| Footnote |
Description |
Footnote1 |
Expenses shown aggregate those of both the Fund and the Master Portfolio. | The manager has contractually committed to waive fees and/or reimburse certain expenses to the extent necessary to cap the Fund's total annual fund operating expense ratio at a specific amount. Without this cap, the costs shown above may have been higher. Please see the prospectus for the amount and the expiration date of the cap. Prior to or after the commitment expiration date, the cap may be increased or the commitment to maintain the cap may be terminated only with the approval of the Board of Trustees. |
| Expenses Paid, Amount |
|
|
$ 108
|
| Expense Ratio, Percent |
[31] |
|
0.94%
|
| Expenses Represent Both Master and Feeder [Text] |
|
|
Expenses shown aggregate those of both the Fund and the Master Portfolio.
|
| Factors Affecting Performance [Text Block] |
|
|
How did the Fund perform last year and what affected its performance?The Fund underperformed its benchmark for the period. Extreme concentration in benchmark returns was a headwind to the Fund's relative performance. That served as a headwind to the Fund. Speculative areas of the market, such as alternative aviation, defense, quantum computing, and biotech outperformed meaningfully in the third quarter of 2025, with 20 stocks in the benchmark driving more than 70% of returns during that quarter. Additionally, in April 2026, returns were concentrated in the information technology (IT) and industrials sectors, while all other sectors lagged. Against this backdrop, IT was the largest contributor to relative performance, driven by positive stock selection within communication equipment. Health care was the largest detractor, driven by adverse stock selection and an underweight to biotechnology. Market volatility and concentration of benchmark returns have created a favorable environment to add attractively valued high-growth stocks. These additions were made across sectors, with health care, industrials, and IT having the most attractive opportunities. We also reduced software exposure in light of AI-related headwinds. |
| Performance Past Does Not Indicate Future [Text] |
|
|
Figures quoted represent past performance, which is no guarantee of future results,
|
| Line Graph [Table Text Block] |
|
|
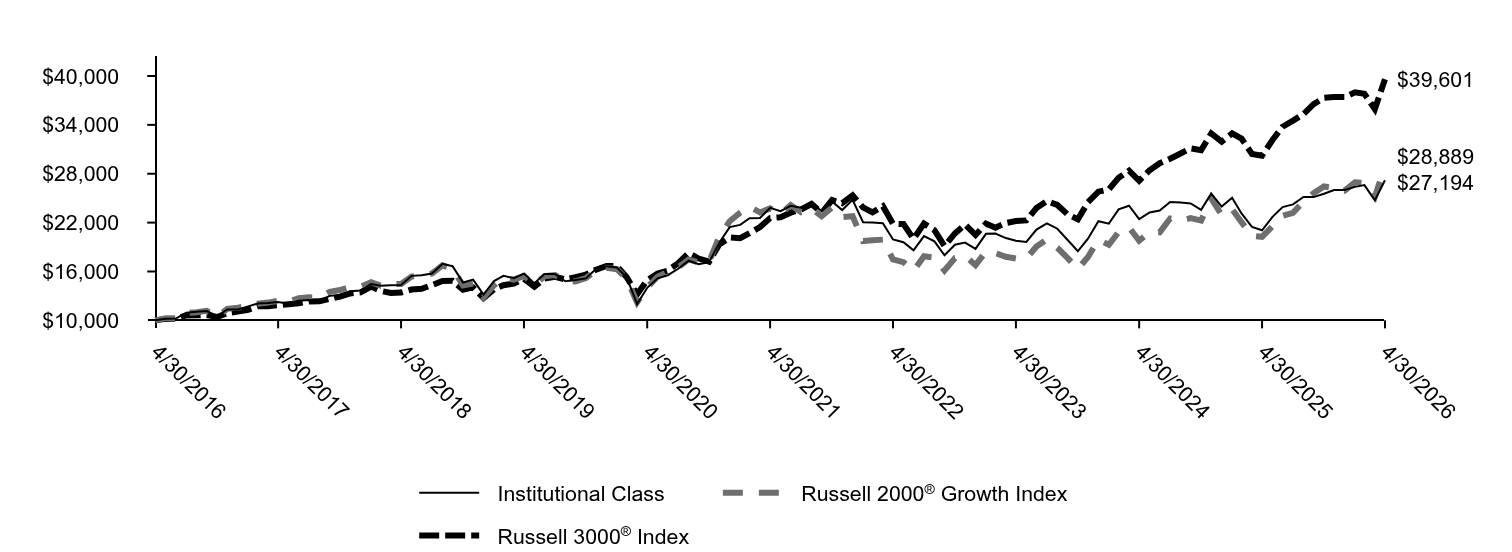
Table Summary
|
Institutional Class |
Russell 2000® Growth Index |
Russell 3000® Index |
4/30/2016 |
$10,000 |
$10,000 |
$10,000 |
5/31/2016 |
$10,211 |
$10,269 |
$10,179 |
6/30/2016 |
$10,221 |
$10,222 |
$10,200 |
7/31/2016 |
$10,925 |
$10,891 |
$10,605 |
8/31/2016 |
$11,056 |
$11,006 |
$10,632 |
9/30/2016 |
$11,143 |
$11,165 |
$10,648 |
10/31/2016 |
$10,516 |
$10,471 |
$10,418 |
11/30/2016 |
$11,333 |
$11,408 |
$10,884 |
12/31/2016 |
$11,331 |
$11,563 |
$11,097 |
1/31/2017 |
$11,721 |
$11,751 |
$11,305 |
2/28/2017 |
$12,058 |
$12,039 |
$11,726 |
3/31/2017 |
$12,142 |
$12,182 |
$11,734 |
4/30/2017 |
$12,263 |
$12,406 |
$11,858 |
5/31/2017 |
$12,034 |
$12,293 |
$11,980 |
6/30/2017 |
$12,394 |
$12,717 |
$12,088 |
7/31/2017 |
$12,512 |
$12,825 |
$12,316 |
8/31/2017 |
$12,422 |
$12,810 |
$12,339 |
9/30/2017 |
$13,008 |
$13,507 |
$12,640 |
10/31/2017 |
$13,111 |
$13,717 |
$12,916 |
11/30/2017 |
$13,568 |
$14,110 |
$13,308 |
12/31/2017 |
$13,666 |
$14,127 |
$13,441 |
1/31/2018 |
$14,470 |
$14,677 |
$14,150 |
2/28/2018 |
$14,256 |
$14,259 |
$13,628 |
3/31/2018 |
$14,308 |
$14,451 |
$13,355 |
4/30/2018 |
$14,349 |
$14,466 |
$13,406 |
5/31/2018 |
$15,464 |
$15,376 |
$13,784 |
6/30/2018 |
$15,543 |
$15,497 |
$13,874 |
7/31/2018 |
$15,741 |
$15,763 |
$14,335 |
8/31/2018 |
$16,946 |
$16,744 |
$14,838 |
9/30/2018 |
$16,648 |
$16,353 |
$14,863 |
10/31/2018 |
$14,652 |
$14,283 |
$13,768 |
11/30/2018 |
$15,001 |
$14,507 |
$14,044 |
12/31/2018 |
$13,169 |
$12,812 |
$12,737 |
1/31/2019 |
$14,829 |
$14,291 |
$13,830 |
2/28/2019 |
$15,473 |
$15,214 |
$14,316 |
3/31/2019 |
$15,181 |
$15,008 |
$14,526 |
4/30/2019 |
$15,744 |
$15,465 |
$15,106 |
5/31/2019 |
$14,571 |
$14,318 |
$14,128 |
6/30/2019 |
$15,678 |
$15,421 |
$15,120 |
7/31/2019 |
$15,700 |
$15,571 |
$15,345 |
8/31/2019 |
$14,798 |
$14,900 |
$15,032 |
9/30/2019 |
$14,943 |
$14,777 |
$15,296 |
10/31/2019 |
$15,156 |
$15,198 |
$15,625 |
11/30/2019 |
$16,308 |
$16,092 |
$16,219 |
12/31/2019 |
$16,655 |
$16,461 |
$16,688 |
1/31/2020 |
$16,492 |
$16,280 |
$16,669 |
2/29/2020 |
$15,284 |
$15,104 |
$15,305 |
3/31/2020 |
$12,012 |
$12,220 |
$13,200 |
4/30/2020 |
$13,995 |
$14,040 |
$14,948 |
5/31/2020 |
$15,164 |
$15,367 |
$15,748 |
6/30/2020 |
$15,543 |
$15,957 |
$16,108 |
7/31/2020 |
$16,333 |
$16,505 |
$17,022 |
8/31/2020 |
$17,322 |
$17,474 |
$18,255 |
9/30/2020 |
$16,904 |
$17,099 |
$17,591 |
10/31/2020 |
$17,153 |
$17,229 |
$17,211 |
11/30/2020 |
$19,521 |
$20,267 |
$19,305 |
12/31/2020 |
$21,448 |
$22,162 |
$20,173 |
1/31/2021 |
$21,722 |
$23,230 |
$20,084 |
2/28/2021 |
$22,543 |
$23,997 |
$20,711 |
3/31/2021 |
$22,570 |
$23,242 |
$21,454 |
4/30/2021 |
$23,820 |
$23,749 |
$22,560 |
5/31/2021 |
$23,412 |
$23,071 |
$22,663 |
6/30/2021 |
$24,066 |
$24,153 |
$23,222 |
7/31/2021 |
$23,830 |
$23,273 |
$23,614 |
8/31/2021 |
$24,367 |
$23,696 |
$24,288 |
9/30/2021 |
$23,422 |
$22,787 |
$23,198 |
10/31/2021 |
$24,596 |
$23,855 |
$24,767 |
11/30/2021 |
$23,540 |
$22,689 |
$24,390 |
12/31/2021 |
$24,793 |
$22,790 |
$25,350 |
1/31/2022 |
$22,047 |
$19,736 |
$23,859 |
2/28/2022 |
$22,020 |
$19,822 |
$23,258 |
3/31/2022 |
$21,933 |
$19,912 |
$24,012 |
4/30/2022 |
$19,933 |
$17,469 |
$21,857 |
5/31/2022 |
$19,592 |
$17,139 |
$21,828 |
6/30/2022 |
$18,603 |
$16,078 |
$20,002 |
7/31/2022 |
$20,349 |
$17,878 |
$21,878 |
8/31/2022 |
$19,706 |
$17,710 |
$21,062 |
9/30/2022 |
$17,987 |
$16,117 |
$19,109 |
10/31/2022 |
$19,290 |
$17,647 |
$20,676 |
11/30/2022 |
$19,544 |
$17,934 |
$21,755 |
12/31/2022 |
$18,774 |
$16,783 |
$20,481 |
1/31/2023 |
$20,620 |
$18,453 |
$21,892 |
2/28/2023 |
$20,656 |
$18,253 |
$21,380 |
3/31/2023 |
$20,101 |
$17,802 |
$21,952 |
4/30/2023 |
$19,771 |
$17,596 |
$22,186 |
5/31/2023 |
$19,623 |
$17,599 |
$22,272 |
6/30/2023 |
$21,145 |
$19,058 |
$23,793 |
7/31/2023 |
$21,918 |
$19,949 |
$24,646 |
8/31/2023 |
$21,252 |
$18,910 |
$24,170 |
9/30/2023 |
$19,901 |
$17,663 |
$23,019 |
10/31/2023 |
$18,490 |
$16,301 |
$22,408 |
11/30/2023 |
$20,024 |
$17,785 |
$24,498 |
12/31/2023 |
$22,173 |
$19,915 |
$25,797 |
1/31/2024 |
$21,875 |
$19,276 |
$26,083 |
2/29/2024 |
$23,620 |
$20,842 |
$27,495 |
3/31/2024 |
$24,073 |
$21,425 |
$28,382 |
4/30/2024 |
$22,421 |
$19,775 |
$27,133 |
5/31/2024 |
$23,253 |
$20,834 |
$28,415 |
6/30/2024 |
$23,477 |
$20,799 |
$29,295 |
7/31/2024 |
$24,527 |
$22,502 |
$29,839 |
8/31/2024 |
$24,483 |
$22,253 |
$30,489 |
9/30/2024 |
$24,347 |
$22,548 |
$31,120 |
10/31/2024 |
$23,564 |
$22,249 |
$30,891 |
11/30/2024 |
$25,583 |
$24,977 |
$32,946 |
12/31/2024 |
$23,964 |
$22,933 |
$31,939 |
1/31/2025 |
$25,050 |
$23,658 |
$32,947 |
2/28/2025 |
$23,129 |
$22,056 |
$32,316 |
3/31/2025 |
$21,472 |
$20,383 |
$30,431 |
4/30/2025 |
$21,061 |
$20,253 |
$30,227 |
5/31/2025 |
$22,711 |
$21,553 |
$32,143 |
6/30/2025 |
$23,901 |
$22,822 |
$33,776 |
7/31/2025 |
$24,236 |
$23,211 |
$34,520 |
8/31/2025 |
$25,141 |
$24,584 |
$35,318 |
9/30/2025 |
$25,134 |
$25,605 |
$36,537 |
10/31/2025 |
$25,551 |
$26,434 |
$37,320 |
11/30/2025 |
$25,990 |
$26,253 |
$37,423 |
12/31/2025 |
$26,007 |
$25,917 |
$37,415 |
1/31/2026 |
$26,390 |
$26,947 |
$37,996 |
2/28/2026 |
$26,604 |
$26,882 |
$37,815 |
3/31/2026 |
$24,729 |
$25,189 |
$35,935 |
4/30/2026 |
$27,194 |
$28,889 |
$39,601 |
|
| Average Annual Return [Table Text Block] |
|
|
Table Summary
AATR |
1 Year |
5 Years |
10 Years |
Institutional Class |
29.12 |
2.68 |
10.52 |
Russell 2000® Growth Index |
42.64 |
4.00 |
11.19 |
Russell 3000® Index |
31.01 |
11.91 |
14.75 | |
| No Deduction of Taxes [Text Block] |
|
|
do not reflect taxes that a shareholder may pay on an investment in a fund.
|
| AssetsNet |
|
|
$ 515,413,913
|
| Holdings Count | Holding |
|
|
125
|
| Advisory Fees Paid, Amount |
[32] |
|
$ 4,039,027
|
| InvestmentCompanyPortfolioTurnover |
|
|
53.00%
|
| Additional Fund Statistics [Text Block] |
|
|
Table Summary
Total net assets |
$515,413,913 |
# of portfolio holdings |
125 |
Portfolio turnover rate |
53% |
Total advisory fees paid |
$4,039,027Footnote Reference* |
| Footnote |
Description |
Footnote* |
Includes the fees charged by the Manager for providing advisory services to the Master Portfolio in which the Fund invests substantially all of its assets. | |
| Holdings [Text Block] |
|
|
SECTOR ALLOCATION (% OF LONG-TERM INVESTMENTS)
Table Summary
Industrials |
29.3 |
Information technology |
22.3 |
Health care |
19.6 |
Financials |
11.2 |
Consumer discretionary |
9.6 |
Energy |
3.3 |
Materials |
2.7 |
Consumer staples |
1.4 |
Communication services |
0.6 | |
| Largest Holdings [Text Block] |
|
|
TOP TEN HOLDINGS (% OF NET ASSETS)
Table Summary
Advanced Energy Industries, Inc. |
1.8 |
TechnipFMC PLC |
1.8 |
Element Solutions, Inc. |
1.6 |
SPX Technologies, Inc. |
1.6 |
MACOM Technology Solutions Holdings, Inc. |
1.5 |
Modine Manufacturing Co. |
1.5 |
Legence Corp. Class A |
1.5 |
ESCO Technologies, Inc. |
1.4 |
MYR Group, Inc. |
1.3 |
Viavi Solutions, Inc. |
1.3 | |
| Material Fund Change [Text Block] |
|
|
|
| C000020236 |
|
|
|
| Shareholder Report [Line Items] |
|
|
|
| Fund Name |
|
|
Small Company Value Fund
|
| Class Name |
|
|
Class A
|
| Trading Symbol |
|
|
SCVAX
|
| Annual or Semi-Annual Statement [Text Block] |
|
|
This annual shareholder report contains important information about Small Company Value Fund for the period from May 1, 2025 to April 30, 2026.
|
| Additional Information [Text Block] |
|
|
You can find additional information about the Fund at allspringglobal.com. You can also request this information by contacting us at 1-800-222-8222.
|
| Material Fund Change Notice [Text Block] |
|
|
This report describes changes to the Fund that occurred either during or after the reporting period.
|
| Additional Information Phone Number |
|
|
<span style="white-space: nowrap; box-sizing: border-box; color: rgb(0, 0, 0); display: inline; flex-wrap: nowrap; font-size: 12px; font-weight: 400; grid-area: auto; line-height: 18px; margin: 0px; overflow: visible; text-align: left; text-align-last: auto;"> 1-800-222-8222.</span>
|
| Additional Information Website |
|
|
<span style="box-sizing: border-box; color: rgb(0, 0, 0); display: inline; flex-wrap: nowrap; font-size: 12px; font-weight: 400; grid-area: auto; line-height: 18px; margin: 0px; overflow: visible; text-align: left; text-align-last: auto; white-space-collapse: preserve-breaks;">allspringglobal.com</span>
|
| Expenses [Text Block] |
|
|
What were the Fund costs for the past year?The table explains the costs you would have paid within the reporting period based on a hypothetical $10,000 investment.
Table Summary
CLASS NAME |
COSTS OF A $10,000 INVESTMENT |
COSTS PAID AS A % OF A $10,000 INVESTMENT |
Class A |
$130 |
1.12%Footnote Reference1 |
| Footnote |
Description |
Footnote1 |
Includes the fees charged by the Manager for providing advisory services to the Master Portfolio in which the Fund invests substantially all of its assets. | The manager has contractually committed to waive fees and/or reimburse certain expenses to the extent necessary to cap the Fund's total annual fund operating expense ratio at a specific amount. Without this cap, the costs shown above may have been higher. Please see the prospectus for the amount and the expiration date of the cap. Prior to or after the commitment expiration date, the cap may be increased or the commitment to maintain the cap may be terminated only with the approval of the Board of Trustees. |
| Expenses Paid, Amount |
|
|
$ 130
|
| Expense Ratio, Percent |
[33] |
|
1.12%
|
| Expenses Represent Both Master and Feeder [Text] |
|
|
Includes the fees charged by the Manager for providing advisory services to the Master Portfolio in which the Fund invests substantially all of its assets.
|
| Factors Affecting Performance [Text Block] |
|
|
How did the Fund perform last year and what affected its performance?The Fund underperformed its benchmark for the period. Over the past 12 months, U.S. equity leadership broadened beyond large-cap growth as improving expectations for monetary easing and domestic growth renewed interest in small-cap equities following early 2025 volatility and tariff uncertainty. Within small caps, performance was led by lower-quality companies as risk appetite rebounded, creating a headwind for quality oriented managers. As 2025 progressed, leadership broadened and fundamentals became more influential. Small-cap value benefited from attractive valuations, improving earnings trends, and domestic sensitivity. Consistent with its philosophy, the Fund remained focused on higher-quality businesses, which lagged through much of the period but became better aligned as investors refocused on quality factors. Our underweight positions in the lagging real estate and utilities sectors contributed to relative performance while the information technology and health care sectors were the largest detractors. |
| Performance Past Does Not Indicate Future [Text] |
|
|
Figures quoted represent past performance, which is no guarantee of future results,
|
| Line Graph [Table Text Block] |
|
|
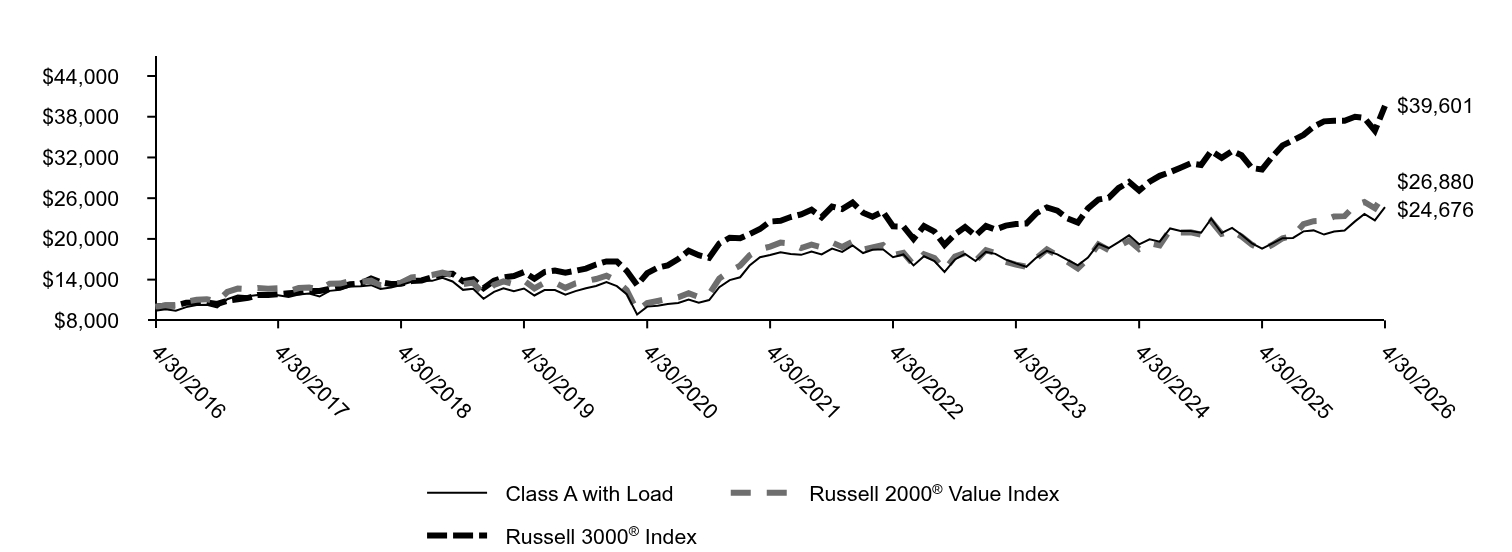
Table Summary
|
Class A with Load |
Russell 2000® Value Index |
Russell 3000® Index |
4/30/2016 |
$9,425 |
$10,000 |
$10,000 |
5/31/2016 |
$9,635 |
$10,183 |
$10,179 |
6/30/2016 |
$9,406 |
$10,214 |
$10,200 |
7/31/2016 |
$9,949 |
$10,765 |
$10,605 |
8/31/2016 |
$10,269 |
$11,033 |
$10,632 |
9/30/2016 |
$10,283 |
$11,120 |
$10,648 |
10/31/2016 |
$9,902 |
$10,754 |
$10,418 |
11/30/2016 |
$11,113 |
$12,182 |
$10,884 |
12/31/2016 |
$11,666 |
$12,685 |
$11,097 |
1/31/2017 |
$11,542 |
$12,594 |
$11,305 |
2/28/2017 |
$11,742 |
$12,777 |
$11,726 |
3/31/2017 |
$11,685 |
$12,668 |
$11,734 |
4/30/2017 |
$11,709 |
$12,718 |
$11,858 |
5/31/2017 |
$11,452 |
$12,322 |
$11,980 |
6/30/2017 |
$11,804 |
$12,753 |
$12,088 |
7/31/2017 |
$11,957 |
$12,834 |
$12,316 |
8/31/2017 |
$11,514 |
$12,518 |
$12,339 |
9/30/2017 |
$12,343 |
$13,405 |
$12,640 |
10/31/2017 |
$12,515 |
$13,422 |
$12,916 |
11/30/2017 |
$13,002 |
$13,811 |
$13,308 |
12/31/2017 |
$13,017 |
$13,679 |
$13,441 |
1/31/2018 |
$13,185 |
$13,848 |
$14,150 |
2/28/2018 |
$12,606 |
$13,155 |
$13,628 |
3/31/2018 |
$12,831 |
$13,318 |
$13,355 |
4/30/2018 |
$13,194 |
$13,549 |
$13,406 |
5/31/2018 |
$13,682 |
$14,337 |
$13,784 |
6/30/2018 |
$13,835 |
$14,424 |
$13,874 |
7/31/2018 |
$13,821 |
$14,678 |
$14,335 |
8/31/2018 |
$14,256 |
$15,028 |
$14,838 |
9/30/2018 |
$13,730 |
$14,655 |
$14,863 |
10/31/2018 |
$12,496 |
$13,343 |
$13,768 |
11/30/2018 |
$12,658 |
$13,558 |
$14,044 |
12/31/2018 |
$11,171 |
$11,919 |
$12,737 |
1/31/2019 |
$12,202 |
$13,223 |
$13,830 |
2/28/2019 |
$12,732 |
$13,737 |
$14,316 |
3/31/2019 |
$12,308 |
$13,341 |
$14,526 |
4/30/2019 |
$12,694 |
$13,846 |
$15,106 |
5/31/2019 |
$11,668 |
$12,715 |
$14,128 |
6/30/2019 |
$12,467 |
$13,524 |
$15,120 |
7/31/2019 |
$12,462 |
$13,546 |
$15,345 |
8/31/2019 |
$11,793 |
$12,790 |
$15,032 |
9/30/2019 |
$12,313 |
$13,447 |
$15,296 |
10/31/2019 |
$12,727 |
$13,773 |
$15,625 |
11/30/2019 |
$13,074 |
$14,095 |
$16,219 |
12/31/2019 |
$13,651 |
$14,589 |
$16,688 |
1/31/2020 |
$13,046 |
$13,802 |
$16,669 |
2/29/2020 |
$11,860 |
$12,461 |
$15,305 |
3/31/2020 |
$8,858 |
$9,386 |
$13,200 |
4/30/2020 |
$10,025 |
$10,544 |
$14,948 |
5/31/2020 |
$10,146 |
$10,847 |
$15,748 |
6/30/2020 |
$10,393 |
$11,161 |
$16,108 |
7/31/2020 |
$10,548 |
$11,391 |
$17,022 |
8/31/2020 |
$11,066 |
$12,005 |
$18,255 |
9/30/2020 |
$10,596 |
$11,446 |
$17,591 |
10/31/2020 |
$10,998 |
$11,855 |
$17,211 |
11/30/2020 |
$12,886 |
$14,144 |
$19,305 |
12/31/2020 |
$13,923 |
$15,265 |
$20,173 |
1/31/2021 |
$14,351 |
$16,068 |
$20,084 |
2/28/2021 |
$16,076 |
$17,577 |
$20,711 |
3/31/2021 |
$17,301 |
$18,496 |
$21,454 |
4/30/2021 |
$17,631 |
$18,870 |
$22,560 |
5/31/2021 |
$18,040 |
$19,457 |
$22,663 |
6/30/2021 |
$17,772 |
$19,339 |
$23,222 |
7/31/2021 |
$17,651 |
$18,647 |
$23,614 |
8/31/2021 |
$18,151 |
$19,146 |
$24,288 |
9/30/2021 |
$17,704 |
$18,763 |
$23,198 |
10/31/2021 |
$18,565 |
$19,478 |
$24,767 |
11/30/2021 |
$18,093 |
$18,813 |
$24,390 |
12/31/2021 |
$19,053 |
$19,580 |
$25,350 |
1/31/2022 |
$17,921 |
$18,438 |
$23,859 |
2/28/2022 |
$18,402 |
$18,744 |
$23,258 |
3/31/2022 |
$18,469 |
$19,110 |
$24,012 |
4/30/2022 |
$17,302 |
$17,627 |
$21,857 |
5/31/2022 |
$17,715 |
$17,966 |
$21,828 |
6/30/2022 |
$16,088 |
$16,191 |
$20,002 |
7/31/2022 |
$17,446 |
$17,758 |
$21,878 |
8/31/2022 |
$16,749 |
$17,197 |
$21,062 |
9/30/2022 |
$15,138 |
$15,444 |
$19,109 |
10/31/2022 |
$16,971 |
$17,389 |
$20,676 |
11/30/2022 |
$17,777 |
$17,920 |
$21,755 |
12/31/2022 |
$16,739 |
$16,744 |
$20,481 |
1/31/2023 |
$18,111 |
$18,342 |
$21,892 |
2/28/2023 |
$17,799 |
$17,919 |
$21,380 |
3/31/2023 |
$16,944 |
$16,634 |
$21,952 |
4/30/2023 |
$16,395 |
$16,219 |
$22,186 |
5/31/2023 |
$15,889 |
$15,900 |
$22,272 |
6/30/2023 |
$17,251 |
$17,163 |
$23,793 |
7/31/2023 |
$18,257 |
$18,459 |
$24,646 |
8/31/2023 |
$17,719 |
$17,571 |
$24,170 |
9/30/2023 |
$16,922 |
$16,656 |
$23,019 |
10/31/2023 |
$16,110 |
$15,662 |
$22,408 |
11/30/2023 |
$17,261 |
$17,072 |
$24,498 |
12/31/2023 |
$19,282 |
$19,197 |
$25,797 |
1/31/2024 |
$18,631 |
$18,325 |
$26,083 |
2/29/2024 |
$19,515 |
$18,924 |
$27,495 |
3/31/2024 |
$20,529 |
$19,754 |
$28,382 |
4/30/2024 |
$19,201 |
$18,495 |
$27,133 |
5/31/2024 |
$19,938 |
$19,360 |
$28,415 |
6/30/2024 |
$19,602 |
$19,034 |
$29,295 |
7/31/2024 |
$21,538 |
$21,353 |
$29,839 |
8/31/2024 |
$21,174 |
$20,952 |
$30,489 |
9/30/2024 |
$21,174 |
$20,966 |
$31,120 |
10/31/2024 |
$20,909 |
$20,638 |
$30,891 |
11/30/2024 |
$22,969 |
$22,628 |
$32,946 |
12/31/2024 |
$20,869 |
$20,743 |
$31,939 |
1/31/2025 |
$21,623 |
$21,169 |
$32,947 |
2/28/2025 |
$20,617 |
$20,359 |
$32,316 |
3/31/2025 |
$19,349 |
$19,137 |
$30,431 |
4/30/2025 |
$18,560 |
$18,368 |
$30,227 |
5/31/2025 |
$19,355 |
$19,140 |
$32,143 |
6/30/2025 |
$20,103 |
$20,087 |
$33,776 |
7/31/2025 |
$20,150 |
$20,442 |
$34,520 |
8/31/2025 |
$21,109 |
$22,173 |
$35,318 |
9/30/2025 |
$21,255 |
$22,619 |
$36,537 |
10/31/2025 |
$20,641 |
$22,676 |
$37,320 |
11/30/2025 |
$21,097 |
$23,313 |
$37,423 |
12/31/2025 |
$21,238 |
$23,355 |
$37,415 |
1/31/2026 |
$22,580 |
$24,957 |
$37,996 |
2/28/2026 |
$23,675 |
$25,438 |
$37,815 |
3/31/2026 |
$22,722 |
$24,513 |
$35,935 |
4/30/2026 |
$24,676 |
$26,880 |
$39,601 |
|
| Average Annual Return [Table Text Block] |
|
|
Table Summary
AATR |
1 Year |
5 Years |
10 Years |
Class A |
32.92 |
6.95 |
10.10 |
Class A with Load |
25.31 |
5.70 |
9.45 |
Russell 2000® Value Index |
46.34 |
7.33 |
10.39 |
Russell 3000® Index |
31.01 |
11.91 |
14.75 | |
| No Deduction of Taxes [Text Block] |
|
|
do not reflect taxes that a shareholder may pay on an investment in a fund.
|
| Material Change Date |
|
May 01, 2025
|
|
| AssetsNet |
|
|
$ 584,190,271
|
| Holdings Count | Holding |
|
|
156
|
| Advisory Fees Paid, Amount |
[34] |
|
$ 3,636,140
|
| InvestmentCompanyPortfolioTurnover |
|
|
209.00%
|
| Additional Fund Statistics [Text Block] |
|
|
Table Summary
Total net assets |
$584,190,271 |
# of portfolio holdings |
156 |
Portfolio turnover rate |
209% |
Total advisory fees paid |
$3,636,140Footnote Reference* |
| Footnote |
Description |
Footnote* |
Includes the fees charged by the Manager for providing advisory services to the Master Portfolio in which the Fund invests substantially all of its assets. | |
| Holdings [Text Block] |
|
|
SECTOR ALLOCATION (% OF LONG-TERM INVESTMENTS)
Table Summary
Industrials |
22.6 |
Financials |
20.7 |
Information technology |
12.6 |
Consumer discretionary |
10.6 |
Materials |
8.4 |
Energy |
7.0 |
Consumer staples |
4.3 |
Real estate |
3.9 |
Health care |
3.8 |
Utilities |
2.8 |
Investment companies |
1.8 |
Communication services |
1.5 | |
| Largest Holdings [Text Block] |
|
|
TOP TEN HOLDINGS (% OF NET ASSETS)
Table Summary
Patterson-UTI Energy, Inc. |
1.3 |
Kaiser Aluminum Corp. |
1.3 |
NWPX Infrastructure, Inc. |
1.2 |
IDACORP, Inc. |
1.2 |
Permian Resources Corp. Class A |
1.2 |
Pinnacle West Capital Corp. |
1.2 |
Adeia, Inc. |
1.2 |
Sanmina Corp. |
1.2 |
Matador Resources Co. |
1.2 |
Atkore, Inc. |
1.1 | |
| Material Fund Change [Text Block] |
|
|
This is a summary of certain changes and planned changes to the Fund since May 1, 2025. Effective June 30, 2026, Jeff Goverman will no longer serve as a portfolio manager of the Fund. |
| Summary of Change Legend [Text Block] |
|
|
This is a summary of certain changes and planned changes to the Fund since May 1, 2025.
|
| C000176624 |
|
|
|
| Shareholder Report [Line Items] |
|
|
|
| Fund Name |
|
|
Small Company Value Fund
|
| Class Name |
|
|
Class R6
|
| Trading Symbol |
|
|
SCVJX
|
| Annual or Semi-Annual Statement [Text Block] |
|
|
This annual shareholder report contains important information about Small Company Value Fund for the period from May 1, 2025 to April 30, 2026.
|
| Additional Information [Text Block] |
|
|
You can find additional information about the Fund at allspringglobal.com. You can also request this information by contacting us at 1-800-222-8222.
|
| Material Fund Change Notice [Text Block] |
|
|
This report describes changes to the Fund that occurred either during or after the reporting period.
|
| Additional Information Phone Number |
|
|
<span style="white-space: nowrap; box-sizing: border-box; color: rgb(0, 0, 0); display: inline; flex-wrap: nowrap; font-size: 12px; font-weight: 400; grid-area: auto; line-height: 18px; margin: 0px; overflow: visible; text-align: left; text-align-last: auto;"> 1-800-222-8222.</span>
|
| Additional Information Website |
|
|
<span style="box-sizing: border-box; color: rgb(0, 0, 0); display: inline; flex-wrap: nowrap; font-size: 12px; font-weight: 400; grid-area: auto; line-height: 18px; margin: 0px; overflow: visible; text-align: left; text-align-last: auto; white-space-collapse: preserve-breaks;">allspringglobal.com</span>
|
| Expenses [Text Block] |
|
|
What were the Fund costs for the past year?The table explains the costs you would have paid within the reporting period based on a hypothetical $10,000 investment.
Table Summary
CLASS NAME |
COSTS OF A $10,000 INVESTMENT |
COSTS PAID AS A % OF A $10,000 INVESTMENT |
Class R6 |
$88 |
0.75%Footnote Reference1 |
| Footnote |
Description |
Footnote1 |
Includes the fees charged by the Manager for providing advisory services to the Master Portfolio in which the Fund invests substantially all of its assets. | The manager has contractually committed to waive fees and/or reimburse certain expenses to the extent necessary to cap the Fund's total annual fund operating expense ratio at a specific amount. Without this cap, the costs shown above may have been higher. Please see the prospectus for the amount and the expiration date of the cap. Prior to or after the commitment expiration date, the cap may be increased or the commitment to maintain the cap may be terminated only with the approval of the Board of Trustees. |
| Expenses Paid, Amount |
|
|
$ 88
|
| Expense Ratio, Percent |
[35] |
|
0.75%
|
| Expenses Represent Both Master and Feeder [Text] |
|
|
Includes the fees charged by the Manager for providing advisory services to the Master Portfolio in which the Fund invests substantially all of its assets.
|
| Factors Affecting Performance [Text Block] |
|
|
How did the Fund perform last year and what affected its performance?The Fund underperformed its benchmark for the period. Over the past 12 months, U.S. equity leadership broadened beyond large-cap growth as improving expectations for monetary easing and domestic growth renewed interest in small-cap equities following early 2025 volatility and tariff uncertainty. Within small caps, performance was led by lower-quality companies as risk appetite rebounded, creating a headwind for quality oriented managers. As 2025 progressed, leadership broadened and fundamentals became more influential. Small-cap value benefited from attractive valuations, improving earnings trends, and domestic sensitivity. Consistent with its philosophy, the Fund remained focused on higher-quality businesses, which lagged through much of the period but became better aligned as investors refocused on quality factors. Our underweight positions in the lagging real estate and utilities sectors contributed to relative performance while the information technology and health care sectors were the largest detractors. |
| Performance Past Does Not Indicate Future [Text] |
|
|
Figures quoted represent past performance, which is no guarantee of future results,
|
| Line Graph [Table Text Block] |
|
|
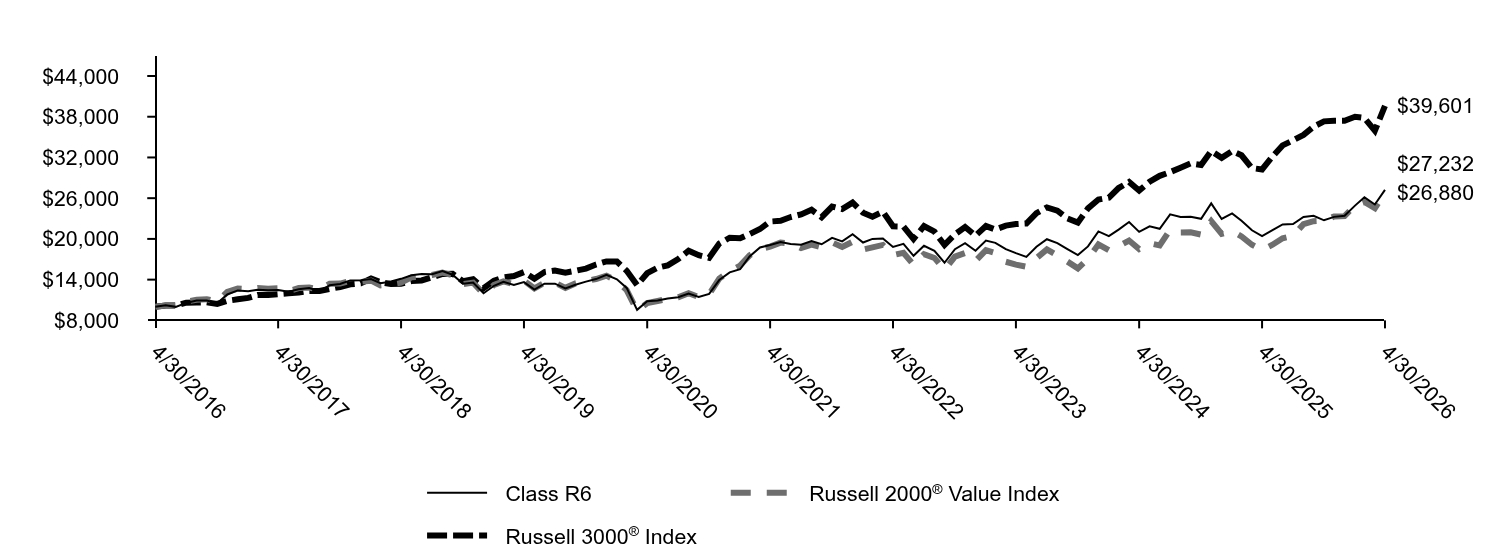
Table Summary
|
Class R6 |
Russell 2000® Value Index |
Russell 3000® Index |
4/30/2016 |
$10,000 |
$10,000 |
$10,000 |
5/31/2016 |
$10,232 |
$10,183 |
$10,179 |
6/30/2016 |
$9,990 |
$10,214 |
$10,200 |
7/31/2016 |
$10,567 |
$10,765 |
$10,605 |
8/31/2016 |
$10,911 |
$11,033 |
$10,632 |
9/30/2016 |
$10,931 |
$11,120 |
$10,648 |
10/31/2016 |
$10,527 |
$10,754 |
$10,418 |
11/30/2016 |
$11,818 |
$12,182 |
$10,884 |
12/31/2016 |
$12,409 |
$12,685 |
$11,097 |
1/31/2017 |
$12,285 |
$12,594 |
$11,305 |
2/28/2017 |
$12,503 |
$12,777 |
$11,726 |
3/31/2017 |
$12,443 |
$12,668 |
$11,734 |
4/30/2017 |
$12,473 |
$12,718 |
$11,858 |
5/31/2017 |
$12,206 |
$12,322 |
$11,980 |
6/30/2017 |
$12,587 |
$12,753 |
$12,088 |
7/31/2017 |
$12,755 |
$12,834 |
$12,316 |
8/31/2017 |
$12,285 |
$12,518 |
$12,339 |
9/30/2017 |
$13,175 |
$13,405 |
$12,640 |
10/31/2017 |
$13,363 |
$13,422 |
$12,916 |
11/30/2017 |
$13,887 |
$13,811 |
$13,308 |
12/31/2017 |
$13,909 |
$13,679 |
$13,441 |
1/31/2018 |
$14,093 |
$13,848 |
$14,150 |
2/28/2018 |
$13,476 |
$13,155 |
$13,628 |
3/31/2018 |
$13,725 |
$13,318 |
$13,355 |
4/30/2018 |
$14,118 |
$13,549 |
$13,406 |
5/31/2018 |
$14,651 |
$14,337 |
$13,784 |
6/30/2018 |
$14,815 |
$14,424 |
$13,874 |
7/31/2018 |
$14,805 |
$14,678 |
$14,335 |
8/31/2018 |
$15,278 |
$15,028 |
$14,838 |
9/30/2018 |
$14,720 |
$14,655 |
$14,863 |
10/31/2018 |
$13,402 |
$13,343 |
$13,768 |
11/30/2018 |
$13,576 |
$13,558 |
$14,044 |
12/31/2018 |
$11,986 |
$11,919 |
$12,737 |
1/31/2019 |
$13,098 |
$13,223 |
$13,830 |
2/28/2019 |
$13,672 |
$13,737 |
$14,316 |
3/31/2019 |
$13,219 |
$13,341 |
$14,526 |
4/30/2019 |
$13,637 |
$13,846 |
$15,106 |
5/31/2019 |
$12,544 |
$12,715 |
$14,128 |
6/30/2019 |
$13,400 |
$13,524 |
$15,120 |
7/31/2019 |
$13,405 |
$13,546 |
$15,345 |
8/31/2019 |
$12,690 |
$12,790 |
$15,032 |
9/30/2019 |
$13,254 |
$13,447 |
$15,296 |
10/31/2019 |
$13,702 |
$13,773 |
$15,625 |
11/30/2019 |
$14,080 |
$14,095 |
$16,219 |
12/31/2019 |
$14,704 |
$14,589 |
$16,688 |
1/31/2020 |
$14,056 |
$13,802 |
$16,669 |
2/29/2020 |
$12,780 |
$12,461 |
$15,305 |
3/31/2020 |
$9,550 |
$9,386 |
$13,200 |
4/30/2020 |
$10,811 |
$10,544 |
$14,948 |
5/31/2020 |
$10,942 |
$10,847 |
$15,748 |
6/30/2020 |
$11,216 |
$11,161 |
$16,108 |
7/31/2020 |
$11,398 |
$11,391 |
$17,022 |
8/31/2020 |
$11,960 |
$12,005 |
$18,255 |
9/30/2020 |
$11,454 |
$11,446 |
$17,591 |
10/31/2020 |
$11,889 |
$11,855 |
$17,211 |
11/30/2020 |
$13,940 |
$14,144 |
$19,305 |
12/31/2020 |
$15,064 |
$15,265 |
$20,173 |
1/31/2021 |
$15,528 |
$16,068 |
$20,084 |
2/28/2021 |
$17,405 |
$17,577 |
$20,711 |
3/31/2021 |
$18,736 |
$18,496 |
$21,454 |
4/30/2021 |
$19,098 |
$18,870 |
$22,560 |
5/31/2021 |
$19,546 |
$19,457 |
$22,663 |
6/30/2021 |
$19,266 |
$19,339 |
$23,222 |
7/31/2021 |
$19,139 |
$18,647 |
$23,614 |
8/31/2021 |
$19,689 |
$19,146 |
$24,288 |
9/30/2021 |
$19,210 |
$18,763 |
$23,198 |
10/31/2021 |
$20,148 |
$19,478 |
$24,767 |
11/30/2021 |
$19,643 |
$18,813 |
$24,390 |
12/31/2021 |
$20,689 |
$19,580 |
$25,350 |
1/31/2022 |
$19,472 |
$18,438 |
$23,859 |
2/28/2022 |
$19,999 |
$18,744 |
$23,258 |
3/31/2022 |
$20,075 |
$19,110 |
$24,012 |
4/30/2022 |
$18,814 |
$17,627 |
$21,857 |
5/31/2022 |
$19,270 |
$17,966 |
$21,828 |
6/30/2022 |
$17,510 |
$16,191 |
$20,002 |
7/31/2022 |
$18,988 |
$17,758 |
$21,878 |
8/31/2022 |
$18,238 |
$17,197 |
$21,062 |
9/30/2022 |
$16,488 |
$15,444 |
$19,109 |
10/31/2022 |
$18,488 |
$17,389 |
$20,676 |
11/30/2022 |
$19,374 |
$17,920 |
$21,755 |
12/31/2022 |
$18,252 |
$16,744 |
$20,481 |
1/31/2023 |
$19,757 |
$18,342 |
$21,892 |
2/28/2023 |
$19,417 |
$17,919 |
$21,380 |
3/31/2023 |
$18,490 |
$16,634 |
$21,952 |
4/30/2023 |
$17,896 |
$16,219 |
$22,186 |
5/31/2023 |
$17,353 |
$15,900 |
$22,272 |
6/30/2023 |
$18,846 |
$17,163 |
$23,793 |
7/31/2023 |
$19,955 |
$18,459 |
$24,646 |
8/31/2023 |
$19,372 |
$17,571 |
$24,170 |
9/30/2023 |
$18,507 |
$16,656 |
$23,019 |
10/31/2023 |
$17,624 |
$15,662 |
$22,408 |
11/30/2023 |
$18,891 |
$17,072 |
$24,498 |
12/31/2023 |
$21,108 |
$19,197 |
$25,797 |
1/31/2024 |
$20,400 |
$18,325 |
$26,083 |
2/29/2024 |
$21,377 |
$18,924 |
$27,495 |
3/31/2024 |
$22,491 |
$19,754 |
$28,382 |
4/30/2024 |
$21,040 |
$18,495 |
$27,133 |
5/31/2024 |
$21,857 |
$19,360 |
$28,415 |
6/30/2024 |
$21,491 |
$19,034 |
$29,295 |
7/31/2024 |
$23,623 |
$21,353 |
$29,839 |
8/31/2024 |
$23,235 |
$20,952 |
$30,489 |
9/30/2024 |
$23,246 |
$20,966 |
$31,120 |
10/31/2024 |
$22,954 |
$20,638 |
$30,891 |
11/30/2024 |
$25,229 |
$22,628 |
$32,946 |
12/31/2024 |
$22,934 |
$20,743 |
$31,939 |
1/31/2025 |
$23,766 |
$21,169 |
$32,947 |
2/28/2025 |
$22,662 |
$20,359 |
$32,316 |
3/31/2025 |
$21,268 |
$19,137 |
$30,431 |
4/30/2025 |
$20,411 |
$18,368 |
$30,227 |
5/31/2025 |
$21,293 |
$19,140 |
$32,143 |
6/30/2025 |
$22,125 |
$20,087 |
$33,776 |
7/31/2025 |
$22,181 |
$20,442 |
$34,520 |
8/31/2025 |
$23,242 |
$22,173 |
$35,318 |
9/30/2025 |
$23,415 |
$22,619 |
$36,537 |
10/31/2025 |
$22,742 |
$22,676 |
$37,320 |
11/30/2025 |
$23,248 |
$23,313 |
$37,423 |
12/31/2025 |
$23,414 |
$23,355 |
$37,415 |
1/31/2026 |
$24,905 |
$24,957 |
$37,996 |
2/28/2026 |
$26,121 |
$25,438 |
$37,815 |
3/31/2026 |
$25,075 |
$24,513 |
$35,935 |
4/30/2026 |
$27,232 |
$26,880 |
$39,601 |
|
| Average Annual Return [Table Text Block] |
|
|
Table Summary
AATR |
1 Year |
5 Years |
10 Years |
Class R6Footnote Reference* |
33.42 |
7.35 |
10.54 |
Russell 2000® Value Index |
46.34 |
7.33 |
10.39 |
Russell 3000® Index |
31.01 |
11.91 |
14.75 | |
| No Deduction of Taxes [Text Block] |
|
|
do not reflect taxes that a shareholder may pay on an investment in a fund.
|
| Material Change Date |
|
May 01, 2025
|
|
| AssetsNet |
|
|
$ 584,190,271
|
| Holdings Count | Holding |
|
|
156
|
| Advisory Fees Paid, Amount |
[36] |
|
$ 3,636,140
|
| InvestmentCompanyPortfolioTurnover |
|
|
209.00%
|
| Additional Fund Statistics [Text Block] |
|
|
Table Summary
Total net assets |
$584,190,271 |
# of portfolio holdings |
156 |
Portfolio turnover rate |
209% |
Total advisory fees paid |
$3,636,140Footnote Reference* |
| Footnote |
Description |
Footnote* |
Includes the fees charged by the Manager for providing advisory services to the Master Portfolio in which the Fund invests substantially all of its assets. | |
| Holdings [Text Block] |
|
|
SECTOR ALLOCATION (% OF LONG-TERM INVESTMENTS)
Table Summary
Industrials |
22.6 |
Financials |
20.7 |
Information technology |
12.6 |
Consumer discretionary |
10.6 |
Materials |
8.4 |
Energy |
7.0 |
Consumer staples |
4.3 |
Real estate |
3.9 |
Health care |
3.8 |
Utilities |
2.8 |
Investment companies |
1.8 |
Communication services |
1.5 | |
| Largest Holdings [Text Block] |
|
|
TOP TEN HOLDINGS (% OF NET ASSETS)
Table Summary
Patterson-UTI Energy, Inc. |
1.3 |
Kaiser Aluminum Corp. |
1.3 |
NWPX Infrastructure, Inc. |
1.2 |
IDACORP, Inc. |
1.2 |
Permian Resources Corp. Class A |
1.2 |
Pinnacle West Capital Corp. |
1.2 |
Adeia, Inc. |
1.2 |
Sanmina Corp. |
1.2 |
Matador Resources Co. |
1.2 |
Atkore, Inc. |
1.1 | |
| Material Fund Change [Text Block] |
|
|
This is a summary of certain changes and planned changes to the Fund since May 1, 2025. Effective June 30, 2026, Jeff Goverman will no longer serve as a portfolio manager of the Fund. |
| Summary of Change Legend [Text Block] |
|
|
This is a summary of certain changes and planned changes to the Fund since May 1, 2025.
|
| C000092788 |
|
|
|
| Shareholder Report [Line Items] |
|
|
|
| Fund Name |
|
|
Small Company Value Fund
|
| Class Name |
|
|
Institutional Class
|
| Trading Symbol |
|
|
SCVNX
|
| Annual or Semi-Annual Statement [Text Block] |
|
|
This annual shareholder report contains important information about Small Company Value Fund for the period from May 1, 2025 to April 30, 2026.
|
| Additional Information [Text Block] |
|
|
You can find additional information about the Fund at allspringglobal.com. You can also request this information by contacting us at 1-800-222-8222.
|
| Material Fund Change Notice [Text Block] |
|
|
This report describes changes to the Fund that occurred either during or after the reporting period.
|
| Additional Information Phone Number |
|
|
<span style="white-space: nowrap; box-sizing: border-box; color: rgb(0, 0, 0); display: inline; flex-wrap: nowrap; font-size: 12px; font-weight: 400; grid-area: auto; line-height: 18px; margin: 0px; overflow: visible; text-align: left; text-align-last: auto;"> 1-800-222-8222.</span>
|
| Additional Information Website |
|
|
<span style="box-sizing: border-box; color: rgb(0, 0, 0); display: inline; flex-wrap: nowrap; font-size: 12px; font-weight: 400; grid-area: auto; line-height: 18px; margin: 0px; overflow: visible; text-align: left; text-align-last: auto; white-space-collapse: preserve-breaks;">allspringglobal.com</span>
|
| Expenses [Text Block] |
|
|
What were the Fund costs for the past year?The table explains the costs you would have paid within the reporting period based on a hypothetical $10,000 investment.
Table Summary
CLASS NAME |
COSTS OF A $10,000 INVESTMENT |
COSTS PAID AS A % OF A $10,000 INVESTMENT |
Institutional Class |
$99 |
0.85%Footnote Reference1 |
| Footnote |
Description |
Footnote1 |
Includes the fees charged by the Manager for providing advisory services to the Master Portfolio in which the Fund invests substantially all of its assets. | The manager has contractually committed to waive fees and/or reimburse certain expenses to the extent necessary to cap the Fund's total annual fund operating expense ratio at a specific amount. Without this cap, the costs shown above may have been higher. Please see the prospectus for the amount and the expiration date of the cap. Prior to or after the commitment expiration date, the cap may be increased or the commitment to maintain the cap may be terminated only with the approval of the Board of Trustees. |
| Expenses Paid, Amount |
|
|
$ 99
|
| Expense Ratio, Percent |
[37] |
|
0.85%
|
| Expenses Represent Both Master and Feeder [Text] |
|
|
Includes the fees charged by the Manager for providing advisory services to the Master Portfolio in which the Fund invests substantially all of its assets.
|
| Factors Affecting Performance [Text Block] |
|
|
How did the Fund perform last year and what affected its performance?The Fund underperformed its benchmark for the period. Over the past 12 months, U.S. equity leadership broadened beyond large-cap growth as improving expectations for monetary easing and domestic growth renewed interest in small-cap equities following early 2025 volatility and tariff uncertainty. Within small caps, performance was led by lower-quality companies as risk appetite rebounded, creating a headwind for quality oriented managers. As 2025 progressed, leadership broadened and fundamentals became more influential. Small-cap value benefited from attractive valuations, improving earnings trends, and domestic sensitivity. Consistent with its philosophy, the Fund remained focused on higher-quality businesses, which lagged through much of the period but became better aligned as investors refocused on quality factors. Our underweight positions in the lagging real estate and utilities sectors contributed to relative performance while the information technology and health care sectors were the largest detractors. |
| Performance Past Does Not Indicate Future [Text] |
|
|
Figures quoted represent past performance, which is no guarantee of future results,
|
| Line Graph [Table Text Block] |
|
|

Table Summary
|
Institutional Class |
Russell 2000® Value Index |
Russell 3000® Index |
4/30/2016 |
$10,000 |
$10,000 |
$10,000 |
5/31/2016 |
$10,232 |
$10,183 |
$10,179 |
6/30/2016 |
$9,990 |
$10,214 |
$10,200 |
7/31/2016 |
$10,567 |
$10,765 |
$10,605 |
8/31/2016 |
$10,911 |
$11,033 |
$10,632 |
9/30/2016 |
$10,931 |
$11,120 |
$10,648 |
10/31/2016 |
$10,527 |
$10,754 |
$10,418 |
11/30/2016 |
$11,823 |
$12,182 |
$10,884 |
12/31/2016 |
$12,410 |
$12,685 |
$11,097 |
1/31/2017 |
$12,286 |
$12,594 |
$11,305 |
2/28/2017 |
$12,499 |
$12,777 |
$11,726 |
3/31/2017 |
$12,445 |
$12,668 |
$11,734 |
4/30/2017 |
$12,469 |
$12,718 |
$11,858 |
5/31/2017 |
$12,202 |
$12,322 |
$11,980 |
6/30/2017 |
$12,583 |
$12,753 |
$12,088 |
7/31/2017 |
$12,746 |
$12,834 |
$12,316 |
8/31/2017 |
$12,276 |
$12,518 |
$12,339 |
9/30/2017 |
$13,166 |
$13,405 |
$12,640 |
10/31/2017 |
$13,354 |
$13,422 |
$12,916 |
11/30/2017 |
$13,873 |
$13,811 |
$13,308 |
12/31/2017 |
$13,899 |
$13,679 |
$13,441 |
1/31/2018 |
$14,078 |
$13,848 |
$14,150 |
2/28/2018 |
$13,466 |
$13,155 |
$13,628 |
3/31/2018 |
$13,710 |
$13,318 |
$13,355 |
4/30/2018 |
$14,103 |
$13,549 |
$13,406 |
5/31/2018 |
$14,630 |
$14,337 |
$13,784 |
6/30/2018 |
$14,794 |
$14,424 |
$13,874 |
7/31/2018 |
$14,784 |
$14,678 |
$14,335 |
8/31/2018 |
$15,252 |
$15,028 |
$14,838 |
9/30/2018 |
$14,695 |
$14,655 |
$14,863 |
10/31/2018 |
$13,381 |
$13,343 |
$13,768 |
11/30/2018 |
$13,555 |
$13,558 |
$14,044 |
12/31/2018 |
$11,966 |
$11,919 |
$12,737 |
1/31/2019 |
$13,073 |
$13,223 |
$13,830 |
2/28/2019 |
$13,647 |
$13,737 |
$14,316 |
3/31/2019 |
$13,194 |
$13,341 |
$14,526 |
4/30/2019 |
$13,612 |
$13,846 |
$15,106 |
5/31/2019 |
$12,514 |
$12,715 |
$14,128 |
6/30/2019 |
$13,370 |
$13,524 |
$15,120 |
7/31/2019 |
$13,375 |
$13,546 |
$15,345 |
8/31/2019 |
$12,660 |
$12,790 |
$15,032 |
9/30/2019 |
$13,219 |
$13,447 |
$15,296 |
10/31/2019 |
$13,667 |
$13,773 |
$15,625 |
11/30/2019 |
$14,045 |
$14,095 |
$16,219 |
12/31/2019 |
$14,663 |
$14,589 |
$16,688 |
1/31/2020 |
$14,019 |
$13,802 |
$16,669 |
2/29/2020 |
$12,746 |
$12,461 |
$15,305 |
3/31/2020 |
$9,525 |
$9,386 |
$13,200 |
4/30/2020 |
$10,783 |
$10,544 |
$14,948 |
5/31/2020 |
$10,910 |
$10,847 |
$15,748 |
6/30/2020 |
$11,184 |
$11,161 |
$16,108 |
7/31/2020 |
$11,356 |
$11,391 |
$17,022 |
8/31/2020 |
$11,914 |
$12,005 |
$18,255 |
9/30/2020 |
$11,412 |
$11,446 |
$17,591 |
10/31/2020 |
$11,843 |
$11,855 |
$17,211 |
11/30/2020 |
$13,887 |
$14,144 |
$19,305 |
12/31/2020 |
$15,006 |
$15,265 |
$20,173 |
1/31/2021 |
$15,465 |
$16,068 |
$20,084 |
2/28/2021 |
$17,333 |
$17,577 |
$20,711 |
3/31/2021 |
$18,655 |
$18,496 |
$21,454 |
4/30/2021 |
$19,013 |
$18,870 |
$22,560 |
5/31/2021 |
$19,462 |
$19,457 |
$22,663 |
6/30/2021 |
$19,181 |
$19,339 |
$23,222 |
7/31/2021 |
$19,054 |
$18,647 |
$23,614 |
8/31/2021 |
$19,600 |
$19,146 |
$24,288 |
9/30/2021 |
$19,120 |
$18,763 |
$23,198 |
10/31/2021 |
$20,054 |
$19,478 |
$24,767 |
11/30/2021 |
$19,549 |
$18,813 |
$24,390 |
12/31/2021 |
$20,586 |
$19,580 |
$25,350 |
1/31/2022 |
$19,376 |
$18,438 |
$23,859 |
2/28/2022 |
$19,897 |
$18,744 |
$23,258 |
3/31/2022 |
$19,973 |
$19,110 |
$24,012 |
4/30/2022 |
$18,719 |
$17,627 |
$21,857 |
5/31/2022 |
$19,164 |
$17,966 |
$21,828 |
6/30/2022 |
$17,416 |
$16,191 |
$20,002 |
7/31/2022 |
$18,882 |
$17,758 |
$21,878 |
8/31/2022 |
$18,138 |
$17,197 |
$21,062 |
9/30/2022 |
$16,395 |
$15,444 |
$19,109 |
10/31/2022 |
$18,382 |
$17,389 |
$20,676 |
11/30/2022 |
$19,262 |
$17,920 |
$21,755 |
12/31/2022 |
$18,141 |
$16,744 |
$20,481 |
1/31/2023 |
$19,633 |
$18,342 |
$21,892 |
2/28/2023 |
$19,299 |
$17,919 |
$21,380 |
3/31/2023 |
$18,378 |
$16,634 |
$21,952 |
4/30/2023 |
$17,785 |
$16,219 |
$22,186 |
5/31/2023 |
$17,242 |
$15,900 |
$22,272 |
6/30/2023 |
$18,728 |
$17,163 |
$23,793 |
7/31/2023 |
$19,819 |
$18,459 |
$24,646 |
8/31/2023 |
$19,243 |
$17,571 |
$24,170 |
9/30/2023 |
$18,384 |
$16,656 |
$23,019 |
10/31/2023 |
$17,502 |
$15,662 |
$22,408 |
11/30/2023 |
$18,762 |
$17,072 |
$24,498 |
12/31/2023 |
$20,957 |
$19,197 |
$25,797 |
1/31/2024 |
$20,255 |
$18,325 |
$26,083 |
2/29/2024 |
$21,226 |
$18,924 |
$27,495 |
3/31/2024 |
$22,334 |
$19,754 |
$28,382 |
4/30/2024 |
$20,889 |
$18,495 |
$27,133 |
5/31/2024 |
$21,700 |
$19,360 |
$28,415 |
6/30/2024 |
$21,334 |
$19,034 |
$29,295 |
7/31/2024 |
$23,447 |
$21,353 |
$29,839 |
8/31/2024 |
$23,059 |
$20,952 |
$30,489 |
9/30/2024 |
$23,065 |
$20,966 |
$31,120 |
10/31/2024 |
$22,779 |
$20,638 |
$30,891 |
11/30/2024 |
$25,029 |
$22,628 |
$32,946 |
12/31/2024 |
$22,748 |
$20,743 |
$31,939 |
1/31/2025 |
$23,574 |
$21,169 |
$32,947 |
2/28/2025 |
$22,483 |
$20,359 |
$32,316 |
3/31/2025 |
$21,097 |
$19,137 |
$30,431 |
4/30/2025 |
$20,241 |
$18,368 |
$30,227 |
5/31/2025 |
$21,116 |
$19,140 |
$32,143 |
6/30/2025 |
$21,935 |
$20,087 |
$33,776 |
7/31/2025 |
$21,997 |
$20,442 |
$34,520 |
8/31/2025 |
$23,044 |
$22,173 |
$35,318 |
9/30/2025 |
$23,210 |
$22,619 |
$36,537 |
10/31/2025 |
$22,545 |
$22,676 |
$37,320 |
11/30/2025 |
$23,044 |
$23,313 |
$37,423 |
12/31/2025 |
$23,200 |
$23,355 |
$37,415 |
1/31/2026 |
$24,681 |
$24,957 |
$37,996 |
2/28/2026 |
$25,882 |
$25,438 |
$37,815 |
3/31/2026 |
$24,838 |
$24,513 |
$35,935 |
4/30/2026 |
$26,984 |
$26,880 |
$39,601 |
|
| Average Annual Return [Table Text Block] |
|
|
Table Summary
AATR |
1 Year |
5 Years |
10 Years |
Institutional Class |
33.28 |
7.25 |
10.44 |
Russell 2000® Value Index |
46.34 |
7.33 |
10.39 |
Russell 3000® Index |
31.01 |
11.91 |
14.75 | |
| No Deduction of Taxes [Text Block] |
|
|
do not reflect taxes that a shareholder may pay on an investment in a fund.
|
| Material Change Date |
|
May 01, 2025
|
|
| AssetsNet |
|
|
$ 584,190,271
|
| Holdings Count | Holding |
|
|
156
|
| Advisory Fees Paid, Amount |
[38] |
|
$ 3,636,140
|
| InvestmentCompanyPortfolioTurnover |
|
|
209.00%
|
| Additional Fund Statistics [Text Block] |
|
|
Table Summary
Total net assets |
$584,190,271 |
# of portfolio holdings |
156 |
Portfolio turnover rate |
209% |
Total advisory fees paid |
$3,636,140Footnote Reference* |
| Footnote |
Description |
Footnote* |
Includes the fees charged by the Manager for providing advisory services to the Master Portfolio in which the Fund invests substantially all of its assets. | |
| Holdings [Text Block] |
|
|
SECTOR ALLOCATION (% OF LONG-TERM INVESTMENTS)
Table Summary
Industrials |
22.6 |
Financials |
20.7 |
Information technology |
12.6 |
Consumer discretionary |
10.6 |
Materials |
8.4 |
Energy |
7.0 |
Consumer staples |
4.3 |
Real estate |
3.9 |
Health care |
3.8 |
Utilities |
2.8 |
Investment companies |
1.8 |
Communication services |
1.5 | |
| Largest Holdings [Text Block] |
|
|
TOP TEN HOLDINGS (% OF NET ASSETS)
Table Summary
Patterson-UTI Energy, Inc. |
1.3 |
Kaiser Aluminum Corp. |
1.3 |
NWPX Infrastructure, Inc. |
1.2 |
IDACORP, Inc. |
1.2 |
Permian Resources Corp. Class A |
1.2 |
Pinnacle West Capital Corp. |
1.2 |
Adeia, Inc. |
1.2 |
Sanmina Corp. |
1.2 |
Matador Resources Co. |
1.2 |
Atkore, Inc. |
1.1 | |
| Material Fund Change [Text Block] |
|
|
This is a summary of certain changes and planned changes to the Fund since May 1, 2025. Effective June 30, 2026, Jeff Goverman will no longer serve as a portfolio manager of the Fund. |
| Summary of Change Legend [Text Block] |
|
|
This is a summary of certain changes and planned changes to the Fund since May 1, 2025.
|
| C000230176 |
|
|
|
| Shareholder Report [Line Items] |
|
|
|
| Fund Name |
|
|
Spectrum Aggressive Growth Fund
|
| Class Name |
|
|
Administrator Class
|
| Trading Symbol |
|
|
WEADX
|
| Annual or Semi-Annual Statement [Text Block] |
|
|
This annual shareholder report contains important information about Spectrum Aggressive Growth Fund for the period from May 1, 2025 to April 30, 2026.
|
| Additional Information [Text Block] |
|
|
You can find additional information about the Fund at allspringglobal.com. You can also request this information by contacting us at 1-800-222-8222.
|
| Additional Information Phone Number |
|
|
<span style="white-space: nowrap; box-sizing: border-box; color: rgb(0, 0, 0); display: inline; flex-wrap: nowrap; font-size: 12px; font-weight: 400; grid-area: auto; line-height: 18px; margin: 0px; overflow: visible; text-align: left; text-align-last: auto;"> 1-800-222-8222.</span>
|
| Additional Information Website |
|
|
<span style="box-sizing: border-box; color: rgb(0, 0, 0); display: inline; flex-wrap: nowrap; font-size: 12px; font-weight: 400; grid-area: auto; line-height: 18px; margin: 0px; overflow: visible; text-align: left; text-align-last: auto; white-space-collapse: preserve-breaks;">allspringglobal.com</span>
|
| Expenses [Text Block] |
|
|
What were the Fund costs for the past year?The table explains the costs you would have paid within the reporting period based on a hypothetical $10,000 investment.
Table Summary
CLASS NAME |
COSTS OF A $10,000 INVESTMENT |
COSTS PAID AS A % OF A $10,000 INVESTMENT |
Administrator Class |
$75 |
0.65% | The manager has contractually committed to waive fees and/or reimburse certain expenses to the extent necessary to cap the Fund's total annual fund operating expense ratio at a specific amount. Without this cap, the costs shown above may have been higher. Please see the prospectus for the amount and the expiration date of the cap. Prior to or after the commitment expiration date, the cap may be increased or the commitment to maintain the cap may be terminated only with the approval of the Board of Trustees. |
| Expenses Paid, Amount |
|
|
$ 75
|
| Expense Ratio, Percent |
|
|
0.65%
|
| Factors Affecting Performance [Text Block] |
|
|
How did the Fund perform last year and what affected its performance?The Fund underperformed its benchmark for the period. The past year saw a wide set of narratives drive the economy and financial markets. From an initial focus on the impact of tariffs, markets swiftly moved onto the opportunities within artificial intelligence (AI) followed by a U.S. government shutdown. While narratives shifted, domestic growth remained above trend, supported initially by AI-driven capital expenditures and resilient consumer spending. Outside the U.S., investment opportunities were divergent. Globally, expectations for earnings growth remain concentrated on a single theme: AI. There were limited portfolio changes over the past 12 months. In fixed income, we reduced U.S. Treasury bond exposure and added to our U.S. core bond allocation. Security selection added to performance in our inflation-protected, alternative risk premia, and developed international equity strategies. Underperformance from active large and small-cap growth and value strategies detracted from relative performance. |
| Performance Past Does Not Indicate Future [Text] |
|
|
Figures quoted represent past performance, which is no guarantee of future results,
|
| Line Graph [Table Text Block] |
|
|
Table Summary
|
Administrator Class |
Spectrum Aggressive Growth Blended Index |
Russell 3000® Index |
4/30/2016 |
$10,000 |
$10,000 |
$10,000 |
5/31/2016 |
$10,139 |
$10,075 |
$10,179 |
6/30/2016 |
$9,944 |
$10,043 |
$10,200 |
7/31/2016 |
$10,406 |
$10,471 |
$10,605 |
8/31/2016 |
$10,494 |
$10,509 |
$10,632 |
9/30/2016 |
$10,561 |
$10,560 |
$10,648 |
10/31/2016 |
$10,356 |
$10,354 |
$10,418 |
11/30/2016 |
$10,633 |
$10,607 |
$10,884 |
12/31/2016 |
$10,758 |
$10,833 |
$11,097 |
1/31/2017 |
$11,041 |
$11,091 |
$11,305 |
2/28/2017 |
$11,297 |
$11,433 |
$11,726 |
3/31/2017 |
$11,453 |
$11,525 |
$11,734 |
4/30/2017 |
$11,681 |
$11,685 |
$11,858 |
5/31/2017 |
$11,897 |
$11,882 |
$11,980 |
6/30/2017 |
$12,064 |
$11,968 |
$12,088 |
7/31/2017 |
$12,347 |
$12,259 |
$12,316 |
8/31/2017 |
$12,314 |
$12,294 |
$12,339 |
9/30/2017 |
$12,675 |
$12,573 |
$12,640 |
10/31/2017 |
$12,881 |
$12,836 |
$12,916 |
11/30/2017 |
$13,175 |
$13,140 |
$13,308 |
12/31/2017 |
$13,333 |
$13,320 |
$13,441 |
1/31/2018 |
$14,050 |
$14,034 |
$14,150 |
2/28/2018 |
$13,398 |
$13,473 |
$13,628 |
3/31/2018 |
$13,176 |
$13,213 |
$13,355 |
4/30/2018 |
$13,202 |
$13,311 |
$13,406 |
5/31/2018 |
$13,398 |
$13,482 |
$13,784 |
6/30/2018 |
$13,372 |
$13,468 |
$13,874 |
7/31/2018 |
$13,743 |
$13,877 |
$14,335 |
8/31/2018 |
$13,971 |
$14,131 |
$14,838 |
9/30/2018 |
$13,991 |
$14,167 |
$14,863 |
10/31/2018 |
$12,889 |
$13,091 |
$13,768 |
11/30/2018 |
$13,098 |
$13,312 |
$14,044 |
12/31/2018 |
$12,072 |
$12,264 |
$12,737 |
1/31/2019 |
$12,968 |
$13,279 |
$13,830 |
2/28/2019 |
$13,364 |
$13,683 |
$14,316 |
3/31/2019 |
$13,460 |
$13,848 |
$14,526 |
4/30/2019 |
$13,880 |
$14,344 |
$15,106 |
5/31/2019 |
$13,119 |
$13,464 |
$14,128 |
6/30/2019 |
$13,901 |
$14,369 |
$15,120 |
7/31/2019 |
$13,945 |
$14,466 |
$15,345 |
8/31/2019 |
$13,649 |
$14,126 |
$15,032 |
9/30/2019 |
$13,892 |
$14,408 |
$15,296 |
10/31/2019 |
$14,214 |
$14,776 |
$15,625 |
11/30/2019 |
$14,638 |
$15,209 |
$16,219 |
12/31/2019 |
$15,049 |
$15,713 |
$16,688 |
1/31/2020 |
$14,885 |
$15,575 |
$16,669 |
2/29/2020 |
$13,805 |
$14,313 |
$15,305 |
3/31/2020 |
$12,990 |
$12,313 |
$13,200 |
4/30/2020 |
$14,289 |
$13,735 |
$14,948 |
5/31/2020 |
$14,953 |
$14,384 |
$15,748 |
6/30/2020 |
$15,295 |
$14,809 |
$16,108 |
7/31/2020 |
$15,926 |
$15,596 |
$17,022 |
8/31/2020 |
$16,861 |
$16,587 |
$18,255 |
9/30/2020 |
$16,224 |
$16,042 |
$17,591 |
10/31/2020 |
$15,916 |
$15,696 |
$17,211 |
11/30/2020 |
$17,661 |
$17,666 |
$19,305 |
12/31/2020 |
$18,544 |
$18,509 |
$20,173 |
1/31/2021 |
$18,558 |
$18,463 |
$20,084 |
2/28/2021 |
$19,144 |
$18,977 |
$20,711 |
3/31/2021 |
$19,656 |
$19,525 |
$21,454 |
4/30/2021 |
$20,486 |
$20,402 |
$22,560 |
5/31/2021 |
$20,727 |
$20,659 |
$22,663 |
6/30/2021 |
$21,031 |
$20,975 |
$23,222 |
7/31/2021 |
$21,144 |
$21,120 |
$23,614 |
8/31/2021 |
$21,683 |
$21,662 |
$24,288 |
9/30/2021 |
$20,836 |
$20,773 |
$23,198 |
10/31/2021 |
$21,982 |
$21,905 |
$24,767 |
11/30/2021 |
$21,488 |
$21,376 |
$24,390 |
12/31/2021 |
$22,271 |
$22,230 |
$25,350 |
1/31/2022 |
$21,054 |
$21,069 |
$23,859 |
2/28/2022 |
$20,155 |
$20,572 |
$23,258 |
3/31/2022 |
$20,124 |
$21,049 |
$24,012 |
4/30/2022 |
$18,797 |
$19,331 |
$21,857 |
5/31/2022 |
$19,048 |
$19,354 |
$21,828 |
6/30/2022 |
$17,512 |
$17,721 |
$20,002 |
7/31/2022 |
$18,494 |
$19,067 |
$21,878 |
8/31/2022 |
$17,867 |
$18,385 |
$21,062 |
9/30/2022 |
$16,624 |
$16,640 |
$19,109 |
10/31/2022 |
$17,606 |
$17,745 |
$20,676 |
11/30/2022 |
$18,860 |
$19,021 |
$21,755 |
12/31/2022 |
$17,982 |
$18,199 |
$20,481 |
1/31/2023 |
$19,215 |
$19,519 |
$21,892 |
2/28/2023 |
$18,664 |
$18,994 |
$21,380 |
3/31/2023 |
$19,050 |
$19,489 |
$21,952 |
4/30/2023 |
$19,204 |
$19,736 |
$22,186 |
5/31/2023 |
$19,028 |
$19,575 |
$22,272 |
6/30/2023 |
$20,217 |
$20,774 |
$23,793 |
7/31/2023 |
$20,867 |
$21,548 |
$24,646 |
8/31/2023 |
$20,360 |
$20,965 |
$24,170 |
9/30/2023 |
$19,501 |
$20,068 |
$23,019 |
10/31/2023 |
$18,863 |
$19,447 |
$22,408 |
11/30/2023 |
$20,371 |
$21,241 |
$24,498 |
12/31/2023 |
$21,461 |
$22,350 |
$25,797 |
1/31/2024 |
$21,472 |
$22,457 |
$26,083 |
2/29/2024 |
$22,540 |
$23,479 |
$27,495 |
3/31/2024 |
$23,300 |
$24,229 |
$28,382 |
4/30/2024 |
$22,375 |
$23,352 |
$27,133 |
5/31/2024 |
$23,399 |
$24,328 |
$28,415 |
6/30/2024 |
$23,818 |
$24,848 |
$29,295 |
7/31/2024 |
$24,148 |
$25,344 |
$29,839 |
8/31/2024 |
$24,721 |
$25,947 |
$30,489 |
9/30/2024 |
$25,194 |
$26,532 |
$31,120 |
10/31/2024 |
$24,622 |
$26,005 |
$30,891 |
11/30/2024 |
$25,822 |
$27,145 |
$32,946 |
12/31/2024 |
$24,975 |
$26,406 |
$31,939 |
1/31/2025 |
$25,698 |
$27,309 |
$32,947 |
2/28/2025 |
$25,520 |
$27,056 |
$32,316 |
3/31/2025 |
$24,477 |
$25,933 |
$30,431 |
4/30/2025 |
$24,963 |
$26,092 |
$30,227 |
5/31/2025 |
$26,255 |
$27,609 |
$32,143 |
6/30/2025 |
$27,406 |
$28,871 |
$33,776 |
7/31/2025 |
$27,655 |
$29,292 |
$34,520 |
8/31/2025 |
$28,461 |
$30,071 |
$35,318 |
9/30/2025 |
$29,588 |
$31,123 |
$36,537 |
10/31/2025 |
$30,121 |
$31,778 |
$37,320 |
11/30/2025 |
$30,145 |
$31,837 |
$37,423 |
12/31/2025 |
$30,265 |
$32,119 |
$37,415 |
1/31/2026 |
$31,352 |
$33,044 |
$37,996 |
2/28/2026 |
$32,384 |
$33,432 |
$37,815 |
3/31/2026 |
$30,346 |
$31,186 |
$35,935 |
4/30/2026 |
$32,733 |
$34,316 |
$39,601 |
|
| Average Annual Return [Table Text Block] |
|
|
Table Summary
AATR |
1 Year |
5 Years |
10 Years |
Administrator ClassFootnote Reference* |
31.13 |
9.83 |
12.59 |
Spectrum Aggressive Growth Blended IndexFootnote Reference† |
31.52 |
10.96 |
13.12 |
Russell 3000® Index |
31.01 |
11.91 |
14.75 | |
| No Deduction of Taxes [Text Block] |
|
|
do not reflect taxes that a shareholder may pay on an investment in a fund.
|
| AssetsNet |
|
|
$ 554,334,151
|
| Holdings Count | Holding |
|
|
27
|
| Advisory Fees Paid, Amount |
|
|
$ 1,178,032
|
| InvestmentCompanyPortfolioTurnover |
|
|
46.00%
|
| Additional Fund Statistics [Text Block] |
|
|
Table Summary
Total net assets |
$554,334,151 |
# of portfolio holdings |
27 |
Portfolio turnover rate |
46% |
Total advisory fees paid |
$1,178,032 | |
| Holdings [Text Block] |
|
|
ALLOCATION (% OF TOTAL INVESTMENTS)
Table Summary
Fund |
Effective AllocationFootnote Reference1 |
U.S. large cap equities |
55.0 |
International developed equities |
22.9 |
Emerging markets equities |
15.1 |
U.S. small cap equities |
7.0 |
| Footnote |
Description |
Footnote1 |
Effective allocation is subject to change and may have changed since the date specified. Effective allocation excludes cash, and percent totals may not add to 100% due to rounding. | |
| Largest Holdings [Text Block] |
|
|
TOP TEN HOLDINGS (% OF NET ASSETS)
Table Summary
Allspring Disciplined Large Cap Portfolio |
31.2 |
Allspring Disciplined International Developed Markets Portfolio |
10.4 |
iShares Core MSCI EAFE ETF |
9.8 |
iShares Core S&P 500 ETF |
9.5 |
iShares Core MSCI Emerging Markets ETF |
6.8 |
Allspring Special Large Value ETF |
6.2 |
Allspring Emerging Markets Equity Fund Class R6 |
3.5 |
Allspring Premier Large Company Growth Fund Class R6 |
3.0 |
Allspring Large Cap Growth Fund Class R6 |
2.9 |
iShares MSCI South Korea ETF |
2.7 | |
| Material Fund Change [Text Block] |
|
|
|
| C000176113 |
|
|
|
| Shareholder Report [Line Items] |
|
|
|
| Fund Name |
|
|
Spectrum Aggressive Growth Fund
|
| Class Name |
|
|
Class A
|
| Trading Symbol |
|
|
WEAFX
|
| Annual or Semi-Annual Statement [Text Block] |
|
|
This annual shareholder report contains important information about Spectrum Aggressive Growth Fund for the period from May 1, 2025 to April 30, 2026.
|
| Additional Information [Text Block] |
|
|
You can find additional information about the Fund at allspringglobal.com. You can also request this information by contacting us at 1-800-222-8222.
|
| Additional Information Phone Number |
|
|
<span style="white-space: nowrap; box-sizing: border-box; color: rgb(0, 0, 0); display: inline; flex-wrap: nowrap; font-size: 12px; font-weight: 400; grid-area: auto; line-height: 18px; margin: 0px; overflow: visible; text-align: left; text-align-last: auto;"> 1-800-222-8222.</span>
|
| Additional Information Website |
|
|
<span style="box-sizing: border-box; color: rgb(0, 0, 0); display: inline; flex-wrap: nowrap; font-size: 12px; font-weight: 400; grid-area: auto; line-height: 18px; margin: 0px; overflow: visible; text-align: left; text-align-last: auto; white-space-collapse: preserve-breaks;">allspringglobal.com</span>
|
| Expenses [Text Block] |
|
|
What were the Fund costs for the past year?The table explains the costs you would have paid within the reporting period based on a hypothetical $10,000 investment.
Table Summary
CLASS NAME |
COSTS OF A $10,000 INVESTMENT |
COSTS PAID AS A % OF A $10,000 INVESTMENT |
Class A |
$83 |
0.72% | The manager has contractually committed to waive fees and/or reimburse certain expenses to the extent necessary to cap the Fund's total annual fund operating expense ratio at a specific amount. Without this cap, the costs shown above may have been higher. Please see the prospectus for the amount and the expiration date of the cap. Prior to or after the commitment expiration date, the cap may be increased or the commitment to maintain the cap may be terminated only with the approval of the Board of Trustees. |
| Expenses Paid, Amount |
|
|
$ 83
|
| Expense Ratio, Percent |
|
|
0.72%
|
| Factors Affecting Performance [Text Block] |
|
|
How did the Fund perform last year and what affected its performance?The Fund underperformed its benchmark for the period. The past year saw a wide set of narratives drive the economy and financial markets. From an initial focus on the impact of tariffs, markets swiftly moved onto the opportunities within artificial intelligence (AI) followed by a U.S. government shutdown. While narratives shifted, domestic growth remained above trend, supported initially by AI-driven capital expenditures and resilient consumer spending. Outside the U.S., investment opportunities were divergent. Globally, expectations for earnings growth remain concentrated on a single theme: AI. There were limited portfolio changes over the past 12 months. In fixed income, we reduced U.S. Treasury bond exposure and added to our U.S. core bond allocation. Security selection added to performance in our inflation-protected, alternative risk premia, and developed international equity strategies. Underperformance from active large and small-cap growth and value strategies detracted from relative performance. |
| Performance Past Does Not Indicate Future [Text] |
|
|
Figures quoted represent past performance, which is no guarantee of future results,
|
| Line Graph [Table Text Block] |
|
|
Table Summary
|
Class A with Load |
Spectrum Aggressive Growth Blended Index |
Russell 3000® Index |
4/30/2016 |
$9,425 |
$10,000 |
$10,000 |
5/31/2016 |
$9,556 |
$10,075 |
$10,179 |
6/30/2016 |
$9,373 |
$10,043 |
$10,200 |
7/31/2016 |
$9,807 |
$10,471 |
$10,605 |
8/31/2016 |
$9,891 |
$10,509 |
$10,632 |
9/30/2016 |
$9,954 |
$10,560 |
$10,648 |
10/31/2016 |
$9,760 |
$10,354 |
$10,418 |
11/30/2016 |
$10,022 |
$10,607 |
$10,884 |
12/31/2016 |
$10,139 |
$10,833 |
$11,097 |
1/31/2017 |
$10,407 |
$11,091 |
$11,305 |
2/28/2017 |
$10,647 |
$11,433 |
$11,726 |
3/31/2017 |
$10,794 |
$11,525 |
$11,734 |
4/30/2017 |
$11,009 |
$11,685 |
$11,858 |
5/31/2017 |
$11,213 |
$11,882 |
$11,980 |
6/30/2017 |
$11,370 |
$11,968 |
$12,088 |
7/31/2017 |
$11,637 |
$12,259 |
$12,316 |
8/31/2017 |
$11,606 |
$12,294 |
$12,339 |
9/30/2017 |
$11,946 |
$12,573 |
$12,640 |
10/31/2017 |
$12,140 |
$12,836 |
$12,916 |
11/30/2017 |
$12,418 |
$13,140 |
$13,308 |
12/31/2017 |
$12,566 |
$13,320 |
$13,441 |
1/31/2018 |
$13,242 |
$14,034 |
$14,150 |
2/28/2018 |
$12,627 |
$13,473 |
$13,628 |
3/31/2018 |
$12,418 |
$13,213 |
$13,355 |
4/30/2018 |
$12,443 |
$13,311 |
$13,406 |
5/31/2018 |
$12,627 |
$13,482 |
$13,784 |
6/30/2018 |
$12,603 |
$13,468 |
$13,874 |
7/31/2018 |
$12,953 |
$13,877 |
$14,335 |
8/31/2018 |
$13,162 |
$14,131 |
$14,838 |
9/30/2018 |
$13,174 |
$14,167 |
$14,863 |
10/31/2018 |
$12,130 |
$13,091 |
$13,768 |
11/30/2018 |
$12,326 |
$13,312 |
$14,044 |
12/31/2018 |
$11,360 |
$12,264 |
$12,737 |
1/31/2019 |
$12,203 |
$13,279 |
$13,830 |
2/28/2019 |
$12,569 |
$13,683 |
$14,316 |
3/31/2019 |
$12,658 |
$13,848 |
$14,526 |
4/30/2019 |
$13,054 |
$14,344 |
$15,106 |
5/31/2019 |
$12,330 |
$13,464 |
$14,128 |
6/30/2019 |
$13,069 |
$14,369 |
$15,120 |
7/31/2019 |
$13,106 |
$14,466 |
$15,345 |
8/31/2019 |
$12,830 |
$14,126 |
$15,032 |
9/30/2019 |
$13,054 |
$14,408 |
$15,296 |
10/31/2019 |
$13,360 |
$14,776 |
$15,625 |
11/30/2019 |
$13,748 |
$15,209 |
$16,219 |
12/31/2019 |
$14,143 |
$15,713 |
$16,688 |
1/31/2020 |
$13,984 |
$15,575 |
$16,669 |
2/29/2020 |
$12,972 |
$14,313 |
$15,305 |
3/31/2020 |
$12,201 |
$12,313 |
$13,200 |
4/30/2020 |
$13,418 |
$13,735 |
$14,948 |
5/31/2020 |
$14,045 |
$14,384 |
$15,748 |
6/30/2020 |
$14,362 |
$14,809 |
$16,108 |
7/31/2020 |
$14,951 |
$15,596 |
$17,022 |
8/31/2020 |
$15,828 |
$16,587 |
$18,255 |
9/30/2020 |
$15,238 |
$16,042 |
$17,591 |
10/31/2020 |
$14,944 |
$15,696 |
$17,211 |
11/30/2020 |
$16,583 |
$17,666 |
$19,305 |
12/31/2020 |
$17,409 |
$18,509 |
$20,173 |
1/31/2021 |
$17,418 |
$18,463 |
$20,084 |
2/28/2021 |
$17,972 |
$18,977 |
$20,711 |
3/31/2021 |
$18,450 |
$19,525 |
$21,454 |
4/30/2021 |
$19,225 |
$20,402 |
$22,560 |
5/31/2021 |
$19,456 |
$20,659 |
$22,663 |
6/30/2021 |
$19,737 |
$20,975 |
$23,222 |
7/31/2021 |
$19,839 |
$21,120 |
$23,614 |
8/31/2021 |
$20,342 |
$21,662 |
$24,288 |
9/30/2021 |
$19,549 |
$20,773 |
$23,198 |
10/31/2021 |
$20,624 |
$21,905 |
$24,767 |
11/30/2021 |
$20,163 |
$21,376 |
$24,390 |
12/31/2021 |
$20,894 |
$22,230 |
$25,350 |
1/31/2022 |
$19,744 |
$21,069 |
$23,859 |
2/28/2022 |
$18,899 |
$20,572 |
$23,258 |
3/31/2022 |
$18,879 |
$21,049 |
$24,012 |
4/30/2022 |
$17,631 |
$19,331 |
$21,857 |
5/31/2022 |
$17,857 |
$19,354 |
$21,828 |
6/30/2022 |
$16,412 |
$17,721 |
$20,002 |
7/31/2022 |
$17,346 |
$19,067 |
$21,878 |
8/31/2022 |
$16,747 |
$18,385 |
$21,062 |
9/30/2022 |
$15,587 |
$16,640 |
$19,109 |
10/31/2022 |
$16,501 |
$17,745 |
$20,676 |
11/30/2022 |
$17,680 |
$19,021 |
$21,755 |
12/31/2022 |
$16,859 |
$18,199 |
$20,481 |
1/31/2023 |
$18,018 |
$19,519 |
$21,892 |
2/28/2023 |
$17,490 |
$18,994 |
$21,380 |
3/31/2023 |
$17,853 |
$19,489 |
$21,952 |
4/30/2023 |
$17,997 |
$19,736 |
$22,186 |
5/31/2023 |
$17,822 |
$19,575 |
$22,272 |
6/30/2023 |
$18,950 |
$20,774 |
$23,793 |
7/31/2023 |
$19,550 |
$21,548 |
$24,646 |
8/31/2023 |
$19,074 |
$20,965 |
$24,170 |
9/30/2023 |
$18,267 |
$20,068 |
$23,019 |
10/31/2023 |
$17,666 |
$19,447 |
$22,408 |
11/30/2023 |
$19,084 |
$21,241 |
$24,498 |
12/31/2023 |
$20,098 |
$22,350 |
$25,797 |
1/31/2024 |
$20,109 |
$22,457 |
$26,083 |
2/29/2024 |
$21,102 |
$23,479 |
$27,495 |
3/31/2024 |
$21,816 |
$24,229 |
$28,382 |
4/30/2024 |
$20,947 |
$23,352 |
$27,133 |
5/31/2024 |
$21,910 |
$24,328 |
$28,415 |
6/30/2024 |
$22,303 |
$24,848 |
$29,295 |
7/31/2024 |
$22,613 |
$25,344 |
$29,839 |
8/31/2024 |
$23,141 |
$25,947 |
$30,489 |
9/30/2024 |
$23,586 |
$26,532 |
$31,120 |
10/31/2024 |
$23,048 |
$26,005 |
$30,891 |
11/30/2024 |
$24,166 |
$27,145 |
$32,946 |
12/31/2024 |
$23,375 |
$26,406 |
$31,939 |
1/31/2025 |
$24,054 |
$27,309 |
$32,947 |
2/28/2025 |
$23,887 |
$27,056 |
$32,316 |
3/31/2025 |
$22,907 |
$25,933 |
$30,431 |
4/30/2025 |
$23,364 |
$26,092 |
$30,227 |
5/31/2025 |
$24,567 |
$27,609 |
$32,143 |
6/30/2025 |
$25,637 |
$28,871 |
$33,776 |
7/31/2025 |
$25,870 |
$29,292 |
$34,520 |
8/31/2025 |
$26,628 |
$30,071 |
$35,318 |
9/30/2025 |
$27,675 |
$31,123 |
$36,537 |
10/31/2025 |
$28,177 |
$31,778 |
$37,320 |
11/30/2025 |
$28,199 |
$31,837 |
$37,423 |
12/31/2025 |
$28,305 |
$32,119 |
$37,415 |
1/31/2026 |
$29,325 |
$33,044 |
$37,996 |
2/28/2026 |
$30,295 |
$33,432 |
$37,815 |
3/31/2026 |
$28,380 |
$31,186 |
$35,935 |
4/30/2026 |
$30,610 |
$34,316 |
$39,601 |
|
| Average Annual Return [Table Text Block] |
|
|
Table Summary
AATR |
1 Year |
5 Years |
10 Years |
Class AFootnote Reference* |
31.02 |
9.75 |
12.50 |
Class A with LoadFootnote Reference* |
23.48 |
8.46 |
11.84 |
Spectrum Aggressive Growth Blended IndexFootnote Reference† |
31.52 |
10.96 |
13.12 |
Russell 3000® Index |
31.01 |
11.91 |
14.75 | |
| No Deduction of Taxes [Text Block] |
|
|
do not reflect taxes that a shareholder may pay on an investment in a fund.
|
| AssetsNet |
|
|
$ 554,334,151
|
| Holdings Count | Holding |
|
|
27
|
| Advisory Fees Paid, Amount |
|
|
$ 1,178,032
|
| InvestmentCompanyPortfolioTurnover |
|
|
46.00%
|
| Additional Fund Statistics [Text Block] |
|
|
Table Summary
Total net assets |
$554,334,151 |
# of portfolio holdings |
27 |
Portfolio turnover rate |
46% |
Total advisory fees paid |
$1,178,032 | |
| Holdings [Text Block] |
|
|
ALLOCATION (% OF TOTAL INVESTMENTS)
Table Summary
Fund |
Effective AllocationFootnote Reference1 |
U.S. large cap equities |
55.0 |
International developed equities |
22.9 |
Emerging markets equities |
15.1 |
U.S. small cap equities |
7.0 |
| Footnote |
Description |
Footnote1 |
Effective allocation is subject to change and may have changed since the date specified. Effective allocation excludes cash, and percent totals may not add to 100% due to rounding. | |
| Largest Holdings [Text Block] |
|
|
TOP TEN HOLDINGS (% OF NET ASSETS)
Table Summary
Allspring Disciplined Large Cap Portfolio |
31.2 |
Allspring Disciplined International Developed Markets Portfolio |
10.4 |
iShares Core MSCI EAFE ETF |
9.8 |
iShares Core S&P 500 ETF |
9.5 |
iShares Core MSCI Emerging Markets ETF |
6.8 |
Allspring Special Large Value ETF |
6.2 |
Allspring Emerging Markets Equity Fund Class R6 |
3.5 |
Allspring Premier Large Company Growth Fund Class R6 |
3.0 |
Allspring Large Cap Growth Fund Class R6 |
2.9 |
iShares MSCI South Korea ETF |
2.7 | |
| Material Fund Change [Text Block] |
|
|
|
| C000176114 |
|
|
|
| Shareholder Report [Line Items] |
|
|
|
| Fund Name |
|
|
Spectrum Aggressive Growth Fund
|
| Class Name |
|
|
Class C
|
| Trading Symbol |
|
|
WEACX
|
| Annual or Semi-Annual Statement [Text Block] |
|
|
This annual shareholder report contains important information about Spectrum Aggressive Growth Fund for the period from May 1, 2025 to April 30, 2026.
|
| Additional Information [Text Block] |
|
|
You can find additional information about the Fund at allspringglobal.com. You can also request this information by contacting us at 1-800-222-8222.
|
| Additional Information Phone Number |
|
|
<span style="white-space: nowrap; box-sizing: border-box; color: rgb(0, 0, 0); display: inline; flex-wrap: nowrap; font-size: 12px; font-weight: 400; grid-area: auto; line-height: 18px; margin: 0px; overflow: visible; text-align: left; text-align-last: auto;"> 1-800-222-8222.</span>
|
| Additional Information Website |
|
|
<span style="box-sizing: border-box; color: rgb(0, 0, 0); display: inline; flex-wrap: nowrap; font-size: 12px; font-weight: 400; grid-area: auto; line-height: 18px; margin: 0px; overflow: visible; text-align: left; text-align-last: auto; white-space-collapse: preserve-breaks;">allspringglobal.com</span>
|
| Expenses [Text Block] |
|
|
What were the Fund costs for the past year?The table explains the costs you would have paid within the reporting period based on a hypothetical $10,000 investment.
Table Summary
CLASS NAME |
COSTS OF A $10,000 INVESTMENT |
COSTS PAID AS A % OF A $10,000 INVESTMENT |
Class C |
$168 |
1.46% | The manager has contractually committed to waive fees and/or reimburse certain expenses to the extent necessary to cap the Fund's total annual fund operating expense ratio at a specific amount. Without this cap, the costs shown above may have been higher. Please see the prospectus for the amount and the expiration date of the cap. Prior to or after the commitment expiration date, the cap may be increased or the commitment to maintain the cap may be terminated only with the approval of the Board of Trustees. |
| Expenses Paid, Amount |
|
|
$ 168
|
| Expense Ratio, Percent |
|
|
1.46%
|
| Factors Affecting Performance [Text Block] |
|
|
How did the Fund perform last year and what affected its performance?The Fund underperformed its benchmark for the period. The past year saw a wide set of narratives drive the economy and financial markets. From an initial focus on the impact of tariffs, markets swiftly moved onto the opportunities within artificial intelligence (AI) followed by a U.S. government shutdown. While narratives shifted, domestic growth remained above trend, supported initially by AI-driven capital expenditures and resilient consumer spending. Outside the U.S., investment opportunities were divergent. Globally, expectations for earnings growth remain concentrated on a single theme: AI. There were limited portfolio changes over the past 12 months. In fixed income, we reduced U.S. Treasury bond exposure and added to our U.S. core bond allocation. Security selection added to performance in our inflation-protected, alternative risk premia, and developed international equity strategies. Underperformance from active large and small-cap growth and value strategies detracted from relative performance. |
| Performance Past Does Not Indicate Future [Text] |
|
|
Figures quoted represent past performance, which is no guarantee of future results,
|
| Line Graph [Table Text Block] |
|
|
Table Summary
|
Class C with Load |
Spectrum Aggressive Growth Blended Index |
Russell 3000® Index |
4/30/2016 |
$10,000 |
$10,000 |
$10,000 |
5/31/2016 |
$10,139 |
$10,075 |
$10,179 |
6/30/2016 |
$9,944 |
$10,043 |
$10,200 |
7/31/2016 |
$10,406 |
$10,471 |
$10,605 |
8/31/2016 |
$10,494 |
$10,509 |
$10,632 |
9/30/2016 |
$10,561 |
$10,560 |
$10,648 |
10/31/2016 |
$10,356 |
$10,354 |
$10,418 |
11/30/2016 |
$10,633 |
$10,607 |
$10,884 |
12/31/2016 |
$10,758 |
$10,833 |
$11,097 |
1/31/2017 |
$11,041 |
$11,091 |
$11,305 |
2/28/2017 |
$11,297 |
$11,433 |
$11,726 |
3/31/2017 |
$11,442 |
$11,525 |
$11,734 |
4/30/2017 |
$11,664 |
$11,685 |
$11,858 |
5/31/2017 |
$11,869 |
$11,882 |
$11,980 |
6/30/2017 |
$12,031 |
$11,968 |
$12,088 |
7/31/2017 |
$12,308 |
$12,259 |
$12,316 |
8/31/2017 |
$12,264 |
$12,294 |
$12,339 |
9/30/2017 |
$12,620 |
$12,573 |
$12,640 |
10/31/2017 |
$12,814 |
$12,836 |
$12,916 |
11/30/2017 |
$13,098 |
$13,140 |
$13,308 |
12/31/2017 |
$13,250 |
$13,320 |
$13,441 |
1/31/2018 |
$13,955 |
$14,034 |
$14,150 |
2/28/2018 |
$13,296 |
$13,473 |
$13,628 |
3/31/2018 |
$13,061 |
$13,213 |
$13,355 |
4/30/2018 |
$13,087 |
$13,311 |
$13,406 |
5/31/2018 |
$13,270 |
$13,482 |
$13,784 |
6/30/2018 |
$13,237 |
$13,468 |
$13,874 |
7/31/2018 |
$13,589 |
$13,877 |
$14,335 |
8/31/2018 |
$13,805 |
$14,131 |
$14,838 |
9/30/2018 |
$13,811 |
$14,167 |
$14,863 |
10/31/2018 |
$12,708 |
$13,091 |
$13,768 |
11/30/2018 |
$12,904 |
$13,312 |
$14,044 |
12/31/2018 |
$11,886 |
$12,264 |
$12,737 |
1/31/2019 |
$12,757 |
$13,279 |
$13,830 |
2/28/2019 |
$13,125 |
$13,683 |
$14,316 |
3/31/2019 |
$13,211 |
$13,848 |
$14,526 |
4/30/2019 |
$13,611 |
$14,344 |
$15,106 |
5/31/2019 |
$12,851 |
$13,464 |
$14,128 |
6/30/2019 |
$13,611 |
$14,369 |
$15,120 |
7/31/2019 |
$13,651 |
$14,466 |
$15,345 |
8/31/2019 |
$13,353 |
$14,126 |
$15,032 |
9/30/2019 |
$13,580 |
$14,408 |
$15,296 |
10/31/2019 |
$13,878 |
$14,776 |
$15,625 |
11/30/2019 |
$14,278 |
$15,209 |
$16,219 |
12/31/2019 |
$14,679 |
$15,713 |
$16,688 |
1/31/2020 |
$14,506 |
$15,575 |
$16,669 |
2/29/2020 |
$13,442 |
$14,313 |
$15,305 |
3/31/2020 |
$12,639 |
$12,313 |
$13,200 |
4/30/2020 |
$13,891 |
$13,735 |
$14,948 |
5/31/2020 |
$14,529 |
$14,384 |
$15,748 |
6/30/2020 |
$14,852 |
$14,809 |
$16,108 |
7/31/2020 |
$15,451 |
$15,596 |
$17,022 |
8/31/2020 |
$16,356 |
$16,587 |
$18,255 |
9/30/2020 |
$15,734 |
$16,042 |
$17,591 |
10/31/2020 |
$15,427 |
$15,696 |
$17,211 |
11/30/2020 |
$17,104 |
$17,666 |
$19,305 |
12/31/2020 |
$17,939 |
$18,509 |
$20,173 |
1/31/2021 |
$17,948 |
$18,463 |
$20,084 |
2/28/2021 |
$18,504 |
$18,977 |
$20,711 |
3/31/2021 |
$18,981 |
$19,525 |
$21,454 |
4/30/2021 |
$19,767 |
$20,402 |
$22,560 |
5/31/2021 |
$19,988 |
$20,659 |
$22,663 |
6/30/2021 |
$20,262 |
$20,975 |
$23,222 |
7/31/2021 |
$20,368 |
$21,120 |
$23,614 |
8/31/2021 |
$20,863 |
$21,662 |
$24,288 |
9/30/2021 |
$20,041 |
$20,773 |
$23,198 |
10/31/2021 |
$21,128 |
$21,905 |
$24,767 |
11/30/2021 |
$20,642 |
$21,376 |
$24,390 |
12/31/2021 |
$21,373 |
$22,230 |
$25,350 |
1/31/2022 |
$20,189 |
$21,069 |
$23,859 |
2/28/2022 |
$19,319 |
$20,572 |
$23,258 |
3/31/2022 |
$19,278 |
$21,049 |
$24,012 |
4/30/2022 |
$17,993 |
$19,331 |
$21,857 |
5/31/2022 |
$18,216 |
$19,354 |
$21,828 |
6/30/2022 |
$16,738 |
$17,721 |
$20,002 |
7/31/2022 |
$17,669 |
$19,067 |
$21,878 |
8/31/2022 |
$17,052 |
$18,385 |
$21,062 |
9/30/2022 |
$15,858 |
$16,640 |
$19,109 |
10/31/2022 |
$16,779 |
$17,745 |
$20,676 |
11/30/2022 |
$17,963 |
$19,021 |
$21,755 |
12/31/2022 |
$17,122 |
$18,199 |
$20,481 |
1/31/2023 |
$18,284 |
$19,519 |
$21,892 |
2/28/2023 |
$17,735 |
$18,994 |
$21,380 |
3/31/2023 |
$18,094 |
$19,489 |
$21,952 |
4/30/2023 |
$18,231 |
$19,736 |
$22,186 |
5/31/2023 |
$18,041 |
$19,575 |
$22,272 |
6/30/2023 |
$19,161 |
$20,774 |
$23,793 |
7/31/2023 |
$19,774 |
$21,548 |
$24,646 |
8/31/2023 |
$19,267 |
$20,965 |
$24,170 |
9/30/2023 |
$18,453 |
$20,068 |
$23,019 |
10/31/2023 |
$17,830 |
$19,447 |
$22,408 |
11/30/2023 |
$19,246 |
$21,241 |
$24,498 |
12/31/2023 |
$20,261 |
$22,350 |
$25,797 |
1/31/2024 |
$20,261 |
$22,457 |
$26,083 |
2/29/2024 |
$21,243 |
$23,479 |
$27,495 |
3/31/2024 |
$21,952 |
$24,229 |
$28,382 |
4/30/2024 |
$21,064 |
$23,352 |
$27,133 |
5/31/2024 |
$22,032 |
$24,328 |
$28,415 |
6/30/2024 |
$22,427 |
$24,848 |
$29,295 |
7/31/2024 |
$22,739 |
$25,344 |
$29,839 |
8/31/2024 |
$23,270 |
$25,947 |
$30,489 |
9/30/2024 |
$23,718 |
$26,532 |
$31,120 |
10/31/2024 |
$23,176 |
$26,005 |
$30,891 |
11/30/2024 |
$24,300 |
$27,145 |
$32,946 |
12/31/2024 |
$23,505 |
$26,406 |
$31,939 |
1/31/2025 |
$24,189 |
$27,309 |
$32,947 |
2/28/2025 |
$24,020 |
$27,056 |
$32,316 |
3/31/2025 |
$23,035 |
$25,933 |
$30,431 |
4/30/2025 |
$23,494 |
$26,092 |
$30,227 |
5/31/2025 |
$24,704 |
$27,609 |
$32,143 |
6/30/2025 |
$25,779 |
$28,871 |
$33,776 |
7/31/2025 |
$26,015 |
$29,292 |
$34,520 |
8/31/2025 |
$26,777 |
$30,071 |
$35,318 |
9/30/2025 |
$27,830 |
$31,123 |
$36,537 |
10/31/2025 |
$28,334 |
$31,778 |
$37,320 |
11/30/2025 |
$28,356 |
$31,837 |
$37,423 |
12/31/2025 |
$28,463 |
$32,119 |
$37,415 |
1/31/2026 |
$29,489 |
$33,044 |
$37,996 |
2/28/2026 |
$30,464 |
$33,432 |
$37,815 |
3/31/2026 |
$28,539 |
$31,186 |
$35,935 |
4/30/2026 |
$30,781 |
$34,316 |
$39,601 |
|
| Average Annual Return [Table Text Block] |
|
|
Table Summary
AATR |
1 Year |
5 Years |
10 Years |
Class CFootnote Reference* |
30.09 |
8.93 |
11.90 |
Class C with LoadFootnote Reference* |
29.09 |
8.93 |
11.90 |
Spectrum Aggressive Growth Blended IndexFootnote Reference† |
31.52 |
10.96 |
13.12 |
Russell 3000® Index |
31.01 |
11.91 |
14.75 | |
| No Deduction of Taxes [Text Block] |
|
|
do not reflect taxes that a shareholder may pay on an investment in a fund.
|
| AssetsNet |
|
|
$ 554,334,151
|
| Holdings Count | Holding |
|
|
27
|
| Advisory Fees Paid, Amount |
|
|
$ 1,178,032
|
| InvestmentCompanyPortfolioTurnover |
|
|
46.00%
|
| Additional Fund Statistics [Text Block] |
|
|
Table Summary
Total net assets |
$554,334,151 |
# of portfolio holdings |
27 |
Portfolio turnover rate |
46% |
Total advisory fees paid |
$1,178,032 | |
| Holdings [Text Block] |
|
|
ALLOCATION (% OF TOTAL INVESTMENTS)
Table Summary
Fund |
Effective AllocationFootnote Reference1 |
U.S. large cap equities |
55.0 |
International developed equities |
22.9 |
Emerging markets equities |
15.1 |
U.S. small cap equities |
7.0 |
| Footnote |
Description |
Footnote1 |
Effective allocation is subject to change and may have changed since the date specified. Effective allocation excludes cash, and percent totals may not add to 100% due to rounding. | |
| Largest Holdings [Text Block] |
|
|
TOP TEN HOLDINGS (% OF NET ASSETS)
Table Summary
Allspring Disciplined Large Cap Portfolio |
31.2 |
Allspring Disciplined International Developed Markets Portfolio |
10.4 |
iShares Core MSCI EAFE ETF |
9.8 |
iShares Core S&P 500 ETF |
9.5 |
iShares Core MSCI Emerging Markets ETF |
6.8 |
Allspring Special Large Value ETF |
6.2 |
Allspring Emerging Markets Equity Fund Class R6 |
3.5 |
Allspring Premier Large Company Growth Fund Class R6 |
3.0 |
Allspring Large Cap Growth Fund Class R6 |
2.9 |
iShares MSCI South Korea ETF |
2.7 | |
| Material Fund Change [Text Block] |
|
|
|
| C000205242 |
|
|
|
| Shareholder Report [Line Items] |
|
|
|
| Fund Name |
|
|
Spectrum Aggressive Growth Fund
|
| Class Name |
|
|
Institutional Class
|
| Trading Symbol |
|
|
WEAYX
|
| Annual or Semi-Annual Statement [Text Block] |
|
|
This annual shareholder report contains important information about Spectrum Aggressive Growth Fund for the period from May 1, 2025 to April 30, 2026.
|
| Additional Information [Text Block] |
|
|
You can find additional information about the Fund at allspringglobal.com. You can also request this information by contacting us at 1-800-222-8222.
|
| Additional Information Phone Number |
|
|
<span style="white-space: nowrap; box-sizing: border-box; color: rgb(0, 0, 0); display: inline; flex-wrap: nowrap; font-size: 12px; font-weight: 400; grid-area: auto; line-height: 18px; margin: 0px; overflow: visible; text-align: left; text-align-last: auto;"> 1-800-222-8222.</span>
|
| Additional Information Website |
|
|
<span style="box-sizing: border-box; color: rgb(0, 0, 0); display: inline; flex-wrap: nowrap; font-size: 12px; font-weight: 400; grid-area: auto; line-height: 18px; margin: 0px; overflow: visible; text-align: left; text-align-last: auto; white-space-collapse: preserve-breaks;">allspringglobal.com</span>
|
| Expenses [Text Block] |
|
|
What were the Fund costs for the past year?The table explains the costs you would have paid within the reporting period based on a hypothetical $10,000 investment.
Table Summary
CLASS NAME |
COSTS OF A $10,000 INVESTMENT |
COSTS PAID AS A % OF A $10,000 INVESTMENT |
Institutional Class |
$46 |
0.40% | The manager has contractually committed to waive fees and/or reimburse certain expenses to the extent necessary to cap the Fund's total annual fund operating expense ratio at a specific amount. Without this cap, the costs shown above may have been higher. Please see the prospectus for the amount and the expiration date of the cap. Prior to or after the commitment expiration date, the cap may be increased or the commitment to maintain the cap may be terminated only with the approval of the Board of Trustees. |
| Expenses Paid, Amount |
|
|
$ 46
|
| Expense Ratio, Percent |
|
|
0.40%
|
| Factors Affecting Performance [Text Block] |
|
|
How did the Fund perform last year and what affected its performance?The Fund underperformed its benchmark for the period. The past year saw a wide set of narratives drive the economy and financial markets. From an initial focus on the impact of tariffs, markets swiftly moved onto the opportunities within artificial intelligence (AI) followed by a U.S. government shutdown. While narratives shifted, domestic growth remained above trend, supported initially by AI-driven capital expenditures and resilient consumer spending. Outside the U.S., investment opportunities were divergent. Globally, expectations for earnings growth remain concentrated on a single theme: AI. There were limited portfolio changes over the past 12 months. In fixed income, we reduced U.S. Treasury bond exposure and added to our U.S. core bond allocation. Security selection added to performance in our inflation-protected, alternative risk premia, and developed international equity strategies. Underperformance from active large and small-cap growth and value strategies detracted from relative performance. |
| Performance Past Does Not Indicate Future [Text] |
|
|
Figures quoted represent past performance, which is no guarantee of future results,
|
| Line Graph [Table Text Block] |
|
|
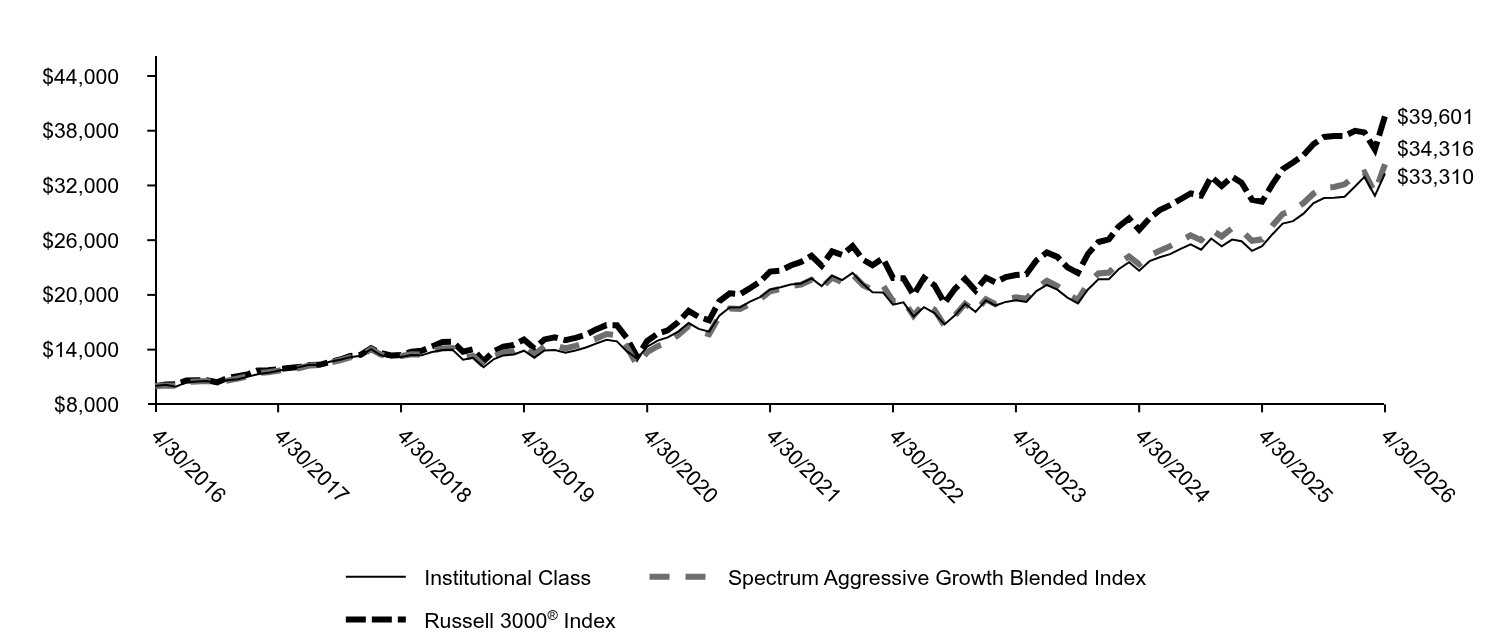
Table Summary
|
Institutional Class |
Spectrum Aggressive Growth Blended Index |
Russell 3000® Index |
4/30/2016 |
$10,000 |
$10,000 |
$10,000 |
5/31/2016 |
$10,139 |
$10,075 |
$10,179 |
6/30/2016 |
$9,944 |
$10,043 |
$10,200 |
7/31/2016 |
$10,406 |
$10,471 |
$10,605 |
8/31/2016 |
$10,494 |
$10,509 |
$10,632 |
9/30/2016 |
$10,561 |
$10,560 |
$10,648 |
10/31/2016 |
$10,356 |
$10,354 |
$10,418 |
11/30/2016 |
$10,633 |
$10,607 |
$10,884 |
12/31/2016 |
$10,758 |
$10,833 |
$11,097 |
1/31/2017 |
$11,041 |
$11,091 |
$11,305 |
2/28/2017 |
$11,297 |
$11,433 |
$11,726 |
3/31/2017 |
$11,453 |
$11,525 |
$11,734 |
4/30/2017 |
$11,681 |
$11,685 |
$11,858 |
5/31/2017 |
$11,897 |
$11,882 |
$11,980 |
6/30/2017 |
$12,064 |
$11,968 |
$12,088 |
7/31/2017 |
$12,347 |
$12,259 |
$12,316 |
8/31/2017 |
$12,314 |
$12,294 |
$12,339 |
9/30/2017 |
$12,675 |
$12,573 |
$12,640 |
10/31/2017 |
$12,881 |
$12,836 |
$12,916 |
11/30/2017 |
$13,175 |
$13,140 |
$13,308 |
12/31/2017 |
$13,333 |
$13,320 |
$13,441 |
1/31/2018 |
$14,050 |
$14,034 |
$14,150 |
2/28/2018 |
$13,398 |
$13,473 |
$13,628 |
3/31/2018 |
$13,176 |
$13,213 |
$13,355 |
4/30/2018 |
$13,202 |
$13,311 |
$13,406 |
5/31/2018 |
$13,398 |
$13,482 |
$13,784 |
6/30/2018 |
$13,372 |
$13,468 |
$13,874 |
7/31/2018 |
$13,743 |
$13,877 |
$14,335 |
8/31/2018 |
$13,971 |
$14,131 |
$14,838 |
9/30/2018 |
$13,991 |
$14,167 |
$14,863 |
10/31/2018 |
$12,889 |
$13,091 |
$13,768 |
11/30/2018 |
$13,098 |
$13,312 |
$14,044 |
12/31/2018 |
$12,072 |
$12,264 |
$12,737 |
1/31/2019 |
$12,968 |
$13,279 |
$13,830 |
2/28/2019 |
$13,364 |
$13,683 |
$14,316 |
3/31/2019 |
$13,460 |
$13,848 |
$14,526 |
4/30/2019 |
$13,880 |
$14,344 |
$15,106 |
5/31/2019 |
$13,119 |
$13,464 |
$14,128 |
6/30/2019 |
$13,904 |
$14,369 |
$15,120 |
7/31/2019 |
$13,951 |
$14,466 |
$15,345 |
8/31/2019 |
$13,658 |
$14,126 |
$15,032 |
9/30/2019 |
$13,904 |
$14,408 |
$15,296 |
10/31/2019 |
$14,229 |
$14,776 |
$15,625 |
11/30/2019 |
$14,657 |
$15,209 |
$16,219 |
12/31/2019 |
$15,071 |
$15,713 |
$16,688 |
1/31/2020 |
$14,909 |
$15,575 |
$16,669 |
2/29/2020 |
$13,831 |
$14,313 |
$15,305 |
3/31/2020 |
$13,018 |
$12,313 |
$13,200 |
4/30/2020 |
$14,322 |
$13,735 |
$14,948 |
5/31/2020 |
$14,990 |
$14,384 |
$15,748 |
6/30/2020 |
$15,336 |
$14,809 |
$16,108 |
7/31/2020 |
$15,972 |
$15,596 |
$17,022 |
8/31/2020 |
$16,914 |
$16,587 |
$18,255 |
9/30/2020 |
$16,278 |
$16,042 |
$17,591 |
10/31/2020 |
$15,972 |
$15,696 |
$17,211 |
11/30/2020 |
$17,727 |
$17,666 |
$19,305 |
12/31/2020 |
$18,617 |
$18,509 |
$20,173 |
1/31/2021 |
$18,636 |
$18,463 |
$20,084 |
2/28/2021 |
$19,228 |
$18,977 |
$20,711 |
3/31/2021 |
$19,747 |
$19,525 |
$21,454 |
4/30/2021 |
$20,585 |
$20,402 |
$22,560 |
5/31/2021 |
$20,831 |
$20,659 |
$22,663 |
6/30/2021 |
$21,140 |
$20,975 |
$23,222 |
7/31/2021 |
$21,259 |
$21,120 |
$23,614 |
8/31/2021 |
$21,805 |
$21,662 |
$24,288 |
9/30/2021 |
$20,958 |
$20,773 |
$23,198 |
10/31/2021 |
$22,115 |
$21,905 |
$24,767 |
11/30/2021 |
$21,623 |
$21,376 |
$24,390 |
12/31/2021 |
$22,416 |
$22,230 |
$25,350 |
1/31/2022 |
$21,195 |
$21,069 |
$23,859 |
2/28/2022 |
$20,291 |
$20,572 |
$23,258 |
3/31/2022 |
$20,270 |
$21,049 |
$24,012 |
4/30/2022 |
$18,934 |
$19,331 |
$21,857 |
5/31/2022 |
$19,186 |
$19,354 |
$21,828 |
6/30/2022 |
$17,640 |
$17,721 |
$20,002 |
7/31/2022 |
$18,650 |
$19,067 |
$21,878 |
8/31/2022 |
$18,008 |
$18,385 |
$21,062 |
9/30/2022 |
$16,767 |
$16,640 |
$19,109 |
10/31/2022 |
$17,756 |
$17,745 |
$20,676 |
11/30/2022 |
$19,029 |
$19,021 |
$21,755 |
12/31/2022 |
$18,144 |
$18,199 |
$20,481 |
1/31/2023 |
$19,400 |
$19,519 |
$21,892 |
2/28/2023 |
$18,833 |
$18,994 |
$21,380 |
3/31/2023 |
$19,233 |
$19,489 |
$21,952 |
4/30/2023 |
$19,400 |
$19,736 |
$22,186 |
5/31/2023 |
$19,222 |
$19,575 |
$22,272 |
6/30/2023 |
$20,422 |
$20,774 |
$23,793 |
7/31/2023 |
$21,088 |
$21,548 |
$24,646 |
8/31/2023 |
$20,577 |
$20,965 |
$24,170 |
9/30/2023 |
$19,711 |
$20,068 |
$23,019 |
10/31/2023 |
$19,077 |
$19,447 |
$22,408 |
11/30/2023 |
$20,600 |
$21,241 |
$24,498 |
12/31/2023 |
$21,711 |
$22,350 |
$25,797 |
1/31/2024 |
$21,722 |
$22,457 |
$26,083 |
2/29/2024 |
$22,811 |
$23,479 |
$27,495 |
3/31/2024 |
$23,577 |
$24,229 |
$28,382 |
4/30/2024 |
$22,655 |
$23,352 |
$27,133 |
5/31/2024 |
$23,700 |
$24,328 |
$28,415 |
6/30/2024 |
$24,133 |
$24,848 |
$29,295 |
7/31/2024 |
$24,466 |
$25,344 |
$29,839 |
8/31/2024 |
$25,055 |
$25,947 |
$30,489 |
9/30/2024 |
$25,544 |
$26,532 |
$31,120 |
10/31/2024 |
$24,955 |
$26,005 |
$30,891 |
11/30/2024 |
$26,177 |
$27,145 |
$32,946 |
12/31/2024 |
$25,326 |
$26,406 |
$31,939 |
1/31/2025 |
$26,070 |
$27,309 |
$32,947 |
2/28/2025 |
$25,890 |
$27,056 |
$32,316 |
3/31/2025 |
$24,835 |
$25,933 |
$30,431 |
4/30/2025 |
$25,338 |
$26,092 |
$30,227 |
5/31/2025 |
$26,657 |
$27,609 |
$32,143 |
6/30/2025 |
$27,821 |
$28,871 |
$33,776 |
7/31/2025 |
$28,084 |
$29,292 |
$34,520 |
8/31/2025 |
$28,912 |
$30,071 |
$35,318 |
9/30/2025 |
$30,063 |
$31,123 |
$36,537 |
10/31/2025 |
$30,615 |
$31,778 |
$37,320 |
11/30/2025 |
$30,639 |
$31,837 |
$37,423 |
12/31/2025 |
$30,769 |
$32,119 |
$37,415 |
1/31/2026 |
$31,883 |
$33,044 |
$37,996 |
2/28/2026 |
$32,943 |
$33,432 |
$37,815 |
3/31/2026 |
$30,864 |
$31,186 |
$35,935 |
4/30/2026 |
$33,310 |
$34,316 |
$39,601 |
|
| Average Annual Return [Table Text Block] |
|
|
Table Summary
AATR |
1 Year |
5 Years |
10 Years |
Institutional ClassFootnote Reference* |
31.46 |
10.10 |
12.79 |
Spectrum Aggressive Growth Blended IndexFootnote Reference† |
31.52 |
10.96 |
13.12 |
Russell 3000® Index |
31.01 |
11.91 |
14.75 | |
| No Deduction of Taxes [Text Block] |
|
|
do not reflect taxes that a shareholder may pay on an investment in a fund.
|
| AssetsNet |
|
|
$ 554,334,151
|
| Holdings Count | Holding |
|
|
27
|
| Advisory Fees Paid, Amount |
|
|
$ 1,178,032
|
| InvestmentCompanyPortfolioTurnover |
|
|
46.00%
|
| Additional Fund Statistics [Text Block] |
|
|
Table Summary
Total net assets |
$554,334,151 |
# of portfolio holdings |
27 |
Portfolio turnover rate |
46% |
Total advisory fees paid |
$1,178,032 | |
| Holdings [Text Block] |
|
|
ALLOCATION (% OF TOTAL INVESTMENTS)
Table Summary
Fund |
Effective AllocationFootnote Reference1 |
U.S. large cap equities |
55.0 |
International developed equities |
22.9 |
Emerging markets equities |
15.1 |
U.S. small cap equities |
7.0 |
| Footnote |
Description |
Footnote1 |
Effective allocation is subject to change and may have changed since the date specified. Effective allocation excludes cash, and percent totals may not add to 100% due to rounding. | |
| Largest Holdings [Text Block] |
|
|
TOP TEN HOLDINGS (% OF NET ASSETS)
Table Summary
Allspring Disciplined Large Cap Portfolio |
31.2 |
Allspring Disciplined International Developed Markets Portfolio |
10.4 |
iShares Core MSCI EAFE ETF |
9.8 |
iShares Core S&P 500 ETF |
9.5 |
iShares Core MSCI Emerging Markets ETF |
6.8 |
Allspring Special Large Value ETF |
6.2 |
Allspring Emerging Markets Equity Fund Class R6 |
3.5 |
Allspring Premier Large Company Growth Fund Class R6 |
3.0 |
Allspring Large Cap Growth Fund Class R6 |
2.9 |
iShares MSCI South Korea ETF |
2.7 | |
| Material Fund Change [Text Block] |
|
|
|
| C000176111 |
|
|
|
| Shareholder Report [Line Items] |
|
|
|
| Fund Name |
|
|
Spectrum Conservative Growth Fund
|
| Class Name |
|
|
Class A
|
| Trading Symbol |
|
|
WMBGX
|
| Annual or Semi-Annual Statement [Text Block] |
|
|
This annual shareholder report contains important information about Spectrum Conservative Growth Fund for the period from May 1, 2025 to April 30, 2026.
|
| Additional Information [Text Block] |
|
|
You can find additional information about the Fund at allspringglobal.com. You can also request this information by contacting us at 1-800-222-8222.
|
| Additional Information Phone Number |
|
|
<span style="white-space: nowrap; box-sizing: border-box; color: rgb(0, 0, 0); display: inline; flex-wrap: nowrap; font-size: 12px; font-weight: 400; grid-area: auto; line-height: 18px; margin: 0px; overflow: visible; text-align: left; text-align-last: auto;"> 1-800-222-8222.</span>
|
| Additional Information Website |
|
|
<span style="box-sizing: border-box; color: rgb(0, 0, 0); display: inline; flex-wrap: nowrap; font-size: 12px; font-weight: 400; grid-area: auto; line-height: 18px; margin: 0px; overflow: visible; text-align: left; text-align-last: auto; white-space-collapse: preserve-breaks;">allspringglobal.com</span>
|
| Expenses [Text Block] |
|
|
What were the Fund costs for the past year?The table explains the costs you would have paid within the reporting period based on a hypothetical $10,000 investment.
Table Summary
CLASS NAME |
COSTS OF A $10,000 INVESTMENT |
COSTS PAID AS A % OF A $10,000 INVESTMENT |
Class A |
$78 |
0.72% | The manager has contractually committed to waive fees and/or reimburse certain expenses to the extent necessary to cap the Fund's total annual fund operating expense ratio at a specific amount. Without this cap, the costs shown above may have been higher. Please see the prospectus for the amount and the expiration date of the cap. Prior to or after the commitment expiration date, the cap may be increased or the commitment to maintain the cap may be terminated only with the approval of the Board of Trustees. |
| Expenses Paid, Amount |
|
|
$ 78
|
| Expense Ratio, Percent |
|
|
0.72%
|
| Factors Affecting Performance [Text Block] |
|
|
How did the Fund perform last year and what affected its performance?The past year saw a wide set of narratives drive the economy and financial markets. From an initial focus on the impact of tariffs, markets swiftly moved onto the opportunities within artificial intelligence (AI) followed by a U.S. government shutdown. While narratives shifted, domestic growth remained above trend, supported initially by AI-driven capital expenditures and resilient consumer spending. Outside the U.S., investment opportunities were divergent. Globally, expectations for earnings growth remain concentrated on a single theme: AI. There were limited portfolio changes over the past 12 months. In fixed income, we reduced U.S. Treasury bond exposure and added to our U.S. core bond allocation. Security selection added to performance in our inflation-protected, alternative risk premia, and developed international equity strategies. Underperformance from active large and small-cap growth and value strategies detracted from relative performance. |
| Performance Past Does Not Indicate Future [Text] |
|
|
Figures quoted represent past performance, which is no guarantee of future results,
|
| Line Graph [Table Text Block] |
|
|
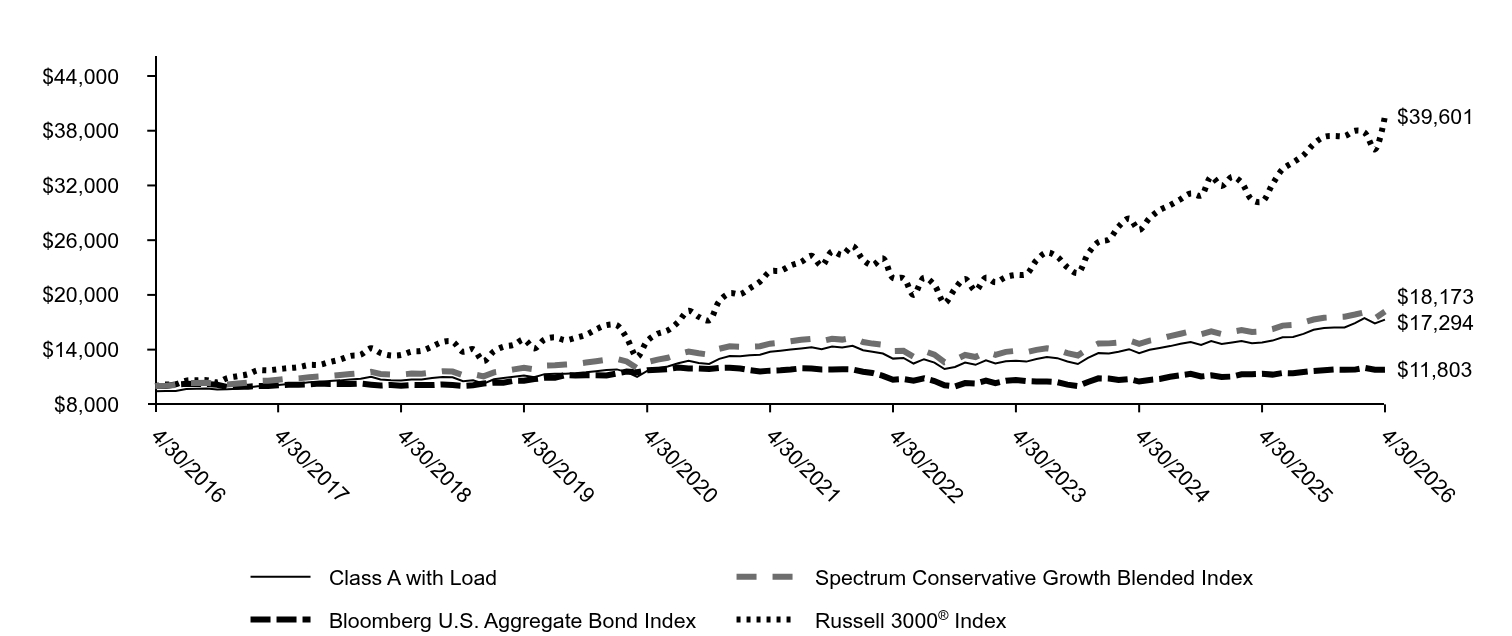
Table Summary
|
Class A with Load |
Spectrum Conservative Growth Blended Index |
Bloomberg U.S. Aggregate Bond Index |
Russell 3000® Index |
4/30/2016 |
$9,425 |
$10,000 |
$10,000 |
$10,000 |
5/31/2016 |
$9,467 |
$10,031 |
$10,003 |
$10,179 |
6/30/2016 |
$9,465 |
$10,127 |
$10,182 |
$10,200 |
7/31/2016 |
$9,673 |
$10,338 |
$10,247 |
$10,605 |
8/31/2016 |
$9,706 |
$10,346 |
$10,235 |
$10,632 |
9/30/2016 |
$9,746 |
$10,362 |
$10,229 |
$10,648 |
10/31/2016 |
$9,621 |
$10,234 |
$10,151 |
$10,418 |
11/30/2016 |
$9,646 |
$10,189 |
$9,911 |
$10,884 |
12/31/2016 |
$9,717 |
$10,284 |
$9,925 |
$11,097 |
1/31/2017 |
$9,838 |
$10,394 |
$9,944 |
$11,305 |
2/28/2017 |
$9,975 |
$10,564 |
$10,011 |
$11,726 |
3/31/2017 |
$10,019 |
$10,595 |
$10,006 |
$11,734 |
4/30/2017 |
$10,132 |
$10,703 |
$10,083 |
$11,858 |
5/31/2017 |
$10,227 |
$10,825 |
$10,160 |
$11,980 |
6/30/2017 |
$10,291 |
$10,849 |
$10,150 |
$12,088 |
7/31/2017 |
$10,422 |
$10,983 |
$10,194 |
$12,316 |
8/31/2017 |
$10,439 |
$11,055 |
$10,285 |
$12,339 |
9/30/2017 |
$10,552 |
$11,123 |
$10,236 |
$12,640 |
10/31/2017 |
$10,630 |
$11,220 |
$10,242 |
$12,916 |
11/30/2017 |
$10,735 |
$11,318 |
$10,229 |
$13,308 |
12/31/2017 |
$10,810 |
$11,411 |
$10,276 |
$13,441 |
1/31/2018 |
$11,023 |
$11,577 |
$10,158 |
$14,150 |
2/28/2018 |
$10,733 |
$11,326 |
$10,061 |
$13,628 |
3/31/2018 |
$10,646 |
$11,282 |
$10,126 |
$13,355 |
4/30/2018 |
$10,626 |
$11,265 |
$10,051 |
$13,406 |
5/31/2018 |
$10,725 |
$11,371 |
$10,122 |
$13,784 |
6/30/2018 |
$10,725 |
$11,358 |
$10,110 |
$13,874 |
7/31/2018 |
$10,882 |
$11,498 |
$10,112 |
$14,335 |
8/31/2018 |
$11,000 |
$11,626 |
$10,177 |
$14,838 |
9/30/2018 |
$10,977 |
$11,593 |
$10,112 |
$14,863 |
10/31/2018 |
$10,531 |
$11,186 |
$10,032 |
$13,768 |
11/30/2018 |
$10,630 |
$11,302 |
$10,092 |
$14,044 |
12/31/2018 |
$10,266 |
$11,070 |
$10,277 |
$12,737 |
1/31/2019 |
$10,744 |
$11,507 |
$10,386 |
$13,830 |
2/28/2019 |
$10,893 |
$11,644 |
$10,380 |
$14,316 |
3/31/2019 |
$11,014 |
$11,834 |
$10,580 |
$14,526 |
4/30/2019 |
$11,153 |
$12,005 |
$10,582 |
$15,106 |
5/31/2019 |
$10,982 |
$11,838 |
$10,770 |
$14,128 |
6/30/2019 |
$11,313 |
$12,246 |
$10,906 |
$15,120 |
7/31/2019 |
$11,345 |
$12,295 |
$10,930 |
$15,345 |
8/31/2019 |
$11,366 |
$12,371 |
$11,213 |
$15,032 |
9/30/2019 |
$11,423 |
$12,430 |
$11,153 |
$15,296 |
10/31/2019 |
$11,509 |
$12,580 |
$11,187 |
$15,625 |
11/30/2019 |
$11,639 |
$12,723 |
$11,181 |
$16,219 |
12/31/2019 |
$11,757 |
$12,887 |
$11,173 |
$16,688 |
1/31/2020 |
$11,833 |
$12,990 |
$11,388 |
$16,669 |
2/29/2020 |
$11,538 |
$12,709 |
$11,593 |
$15,305 |
3/31/2020 |
$11,023 |
$11,954 |
$11,525 |
$13,200 |
4/30/2020 |
$11,658 |
$12,634 |
$11,730 |
$14,948 |
5/31/2020 |
$11,965 |
$12,908 |
$11,784 |
$15,748 |
6/30/2020 |
$12,151 |
$13,109 |
$11,859 |
$16,108 |
7/31/2020 |
$12,513 |
$13,505 |
$12,036 |
$17,022 |
8/31/2020 |
$12,787 |
$13,783 |
$11,939 |
$18,255 |
9/30/2020 |
$12,541 |
$13,597 |
$11,932 |
$17,591 |
10/31/2020 |
$12,431 |
$13,444 |
$11,879 |
$17,211 |
11/30/2020 |
$12,993 |
$14,091 |
$11,995 |
$19,305 |
12/31/2020 |
$13,292 |
$14,359 |
$12,012 |
$20,173 |
1/31/2021 |
$13,281 |
$14,322 |
$11,926 |
$20,084 |
2/28/2021 |
$13,387 |
$14,325 |
$11,753 |
$20,711 |
3/31/2021 |
$13,434 |
$14,371 |
$11,607 |
$21,454 |
4/30/2021 |
$13,766 |
$14,657 |
$11,698 |
$22,560 |
5/31/2021 |
$13,884 |
$14,764 |
$11,737 |
$22,663 |
6/30/2021 |
$14,008 |
$14,915 |
$11,819 |
$23,222 |
7/31/2021 |
$14,128 |
$15,079 |
$11,951 |
$23,614 |
8/31/2021 |
$14,247 |
$15,187 |
$11,929 |
$24,288 |
9/30/2021 |
$14,056 |
$14,938 |
$11,825 |
$23,198 |
10/31/2021 |
$14,333 |
$15,192 |
$11,822 |
$24,767 |
11/30/2021 |
$14,225 |
$15,099 |
$11,857 |
$24,390 |
12/31/2021 |
$14,427 |
$15,308 |
$11,827 |
$25,350 |
1/31/2022 |
$13,930 |
$14,833 |
$11,572 |
$23,859 |
2/28/2022 |
$13,760 |
$14,663 |
$11,443 |
$23,258 |
3/31/2022 |
$13,567 |
$14,532 |
$11,125 |
$24,012 |
4/30/2022 |
$13,015 |
$13,839 |
$10,703 |
$21,857 |
5/31/2022 |
$13,094 |
$13,865 |
$10,772 |
$21,828 |
6/30/2022 |
$12,475 |
$13,229 |
$10,603 |
$20,002 |
7/31/2022 |
$12,952 |
$13,857 |
$10,862 |
$21,878 |
8/31/2022 |
$12,581 |
$13,448 |
$10,555 |
$21,062 |
9/30/2022 |
$11,871 |
$12,624 |
$10,099 |
$19,109 |
10/31/2022 |
$12,100 |
$12,876 |
$9,968 |
$20,676 |
11/30/2022 |
$12,584 |
$13,412 |
$10,335 |
$21,755 |
12/31/2022 |
$12,335 |
$13,186 |
$10,288 |
$20,481 |
1/31/2023 |
$12,823 |
$13,744 |
$10,604 |
$21,892 |
2/28/2023 |
$12,474 |
$13,436 |
$10,330 |
$21,380 |
3/31/2023 |
$12,715 |
$13,758 |
$10,593 |
$21,952 |
4/30/2023 |
$12,785 |
$13,865 |
$10,657 |
$22,186 |
5/31/2023 |
$12,687 |
$13,724 |
$10,541 |
$22,272 |
6/30/2023 |
$12,969 |
$13,973 |
$10,503 |
$23,793 |
7/31/2023 |
$13,180 |
$14,153 |
$10,496 |
$24,646 |
8/31/2023 |
$13,067 |
$13,991 |
$10,429 |
$24,170 |
9/30/2023 |
$12,696 |
$13,609 |
$10,164 |
$23,019 |
10/31/2023 |
$12,425 |
$13,358 |
$10,003 |
$22,408 |
11/30/2023 |
$13,095 |
$14,109 |
$10,456 |
$24,498 |
12/31/2023 |
$13,617 |
$14,679 |
$10,857 |
$25,797 |
1/31/2024 |
$13,588 |
$14,686 |
$10,827 |
$26,083 |
2/29/2024 |
$13,761 |
$14,777 |
$10,674 |
$27,495 |
3/31/2024 |
$14,050 |
$15,014 |
$10,773 |
$28,382 |
4/30/2024 |
$13,615 |
$14,642 |
$10,500 |
$27,133 |
5/31/2024 |
$13,977 |
$14,983 |
$10,678 |
$28,415 |
6/30/2024 |
$14,182 |
$15,172 |
$10,780 |
$29,295 |
7/31/2024 |
$14,387 |
$15,490 |
$11,031 |
$29,839 |
8/31/2024 |
$14,635 |
$15,744 |
$11,190 |
$30,489 |
9/30/2024 |
$14,838 |
$16,008 |
$11,340 |
$31,120 |
10/31/2024 |
$14,514 |
$15,694 |
$11,058 |
$30,891 |
11/30/2024 |
$14,941 |
$15,997 |
$11,175 |
$32,946 |
12/31/2024 |
$14,614 |
$15,715 |
$10,992 |
$31,939 |
1/31/2025 |
$14,792 |
$15,969 |
$11,051 |
$32,947 |
2/28/2025 |
$14,956 |
$16,139 |
$11,294 |
$32,316 |
3/31/2025 |
$14,706 |
$15,940 |
$11,298 |
$30,431 |
4/30/2025 |
$14,781 |
$15,999 |
$11,343 |
$30,227 |
5/31/2025 |
$14,990 |
$16,247 |
$11,261 |
$32,143 |
6/30/2025 |
$15,362 |
$16,633 |
$11,435 |
$33,776 |
7/31/2025 |
$15,392 |
$16,697 |
$11,404 |
$34,520 |
8/31/2025 |
$15,723 |
$16,977 |
$11,541 |
$35,318 |
9/30/2025 |
$16,179 |
$17,299 |
$11,667 |
$36,537 |
10/31/2025 |
$16,361 |
$17,493 |
$11,740 |
$37,320 |
11/30/2025 |
$16,421 |
$17,557 |
$11,813 |
$37,423 |
12/31/2025 |
$16,427 |
$17,616 |
$11,795 |
$37,415 |
1/31/2026 |
$16,903 |
$17,848 |
$11,808 |
$37,996 |
2/28/2026 |
$17,456 |
$18,085 |
$12,001 |
$37,815 |
3/31/2026 |
$16,879 |
$17,425 |
$11,789 |
$35,935 |
4/30/2026 |
$17,294 |
$18,173 |
$11,803 |
$39,601 |
|
| Average Annual Return [Table Text Block] |
|
|
Table Summary
AATR |
1 Year |
5 Years |
10 Years |
Class AFootnote Reference* |
17.00 |
4.67 |
6.26 |
Class A with LoadFootnote Reference* |
10.27 |
3.44 |
5.63 |
Spectrum Conservative Growth Blended IndexFootnote Reference† |
13.59 |
4.39 |
6.16 |
Bloomberg U.S. Aggregate Bond Index |
4.06 |
0.18 |
1.67 |
Russell 3000® Index |
31.01 |
11.91 |
14.75 | |
| No Deduction of Taxes [Text Block] |
|
|
do not reflect taxes that a shareholder may pay on an investment in a fund.
|
| AssetsNet |
|
|
$ 196,256,078
|
| Holdings Count | Holding |
|
|
33
|
| Advisory Fees Paid, Amount |
|
|
$ 357,345
|
| InvestmentCompanyPortfolioTurnover |
|
|
41.00%
|
| Additional Fund Statistics [Text Block] |
|
|
Table Summary
Total net assets |
$196,256,078 |
# of portfolio holdings |
33 |
Portfolio turnover rate |
41% |
Total advisory fees paid |
$357,345 | |
| Holdings [Text Block] |
|
|
ALLOCATION (% OF TOTAL INVESTMENTS)
Table Summary
Fund |
Effective AllocationFootnote Reference1 |
Bonds |
44.3 |
Stocks |
35.7 |
Inflation sensitive investments |
15.4 |
Alternative investments |
4.6 |
| Footnote |
Description |
Footnote1 |
Effective allocation is subject to change and may have changed since the date specified. Effective allocation excludes cash, and percent totals may not add to 100% due to rounding. | |
| Largest Holdings [Text Block] |
|
|
TOP TEN HOLDINGS (% OF NET ASSETS)
Table Summary
Allspring Real Return Portfolio |
14.4 |
Allspring Disciplined Large Cap Portfolio |
12.9 |
Allspring Income Plus ETF |
10.7 |
iShares Core U.S. Aggregate Bond ETF |
8.7 |
Allspring Broad Market Core Bond ETF |
6.8 |
Allspring High Yield Bond Fund Institutional Class |
5.2 |
Allspring Diversified Income Builder Fund Class R6 |
5.2 |
Allspring Core Plus ETF |
4.9 |
Allspring Disciplined International Developed Markets Portfolio |
4.7 |
Allspring Alternative Risk Premia Fund Class R6 |
4.2 | |
| Material Fund Change [Text Block] |
|
|
|
| C000176112 |
|
|
|
| Shareholder Report [Line Items] |
|
|
|
| Fund Name |
|
|
Spectrum Conservative Growth Fund
|
| Class Name |
|
|
Class C
|
| Trading Symbol |
|
|
WMBFX
|
| Annual or Semi-Annual Statement [Text Block] |
|
|
This annual shareholder report contains important information about Spectrum Conservative Growth Fund for the period from May 1, 2025 to April 30, 2026.
|
| Additional Information [Text Block] |
|
|
You can find additional information about the Fund at allspringglobal.com. You can also request this information by contacting us at 1-800-222-8222.
|
| Additional Information Phone Number |
|
|
<span style="white-space: nowrap; box-sizing: border-box; color: rgb(0, 0, 0); display: inline; flex-wrap: nowrap; font-size: 12px; font-weight: 400; grid-area: auto; line-height: 18px; margin: 0px; overflow: visible; text-align: left; text-align-last: auto;"> 1-800-222-8222.</span>
|
| Additional Information Website |
|
|
<span style="box-sizing: border-box; color: rgb(0, 0, 0); display: inline; flex-wrap: nowrap; font-size: 12px; font-weight: 400; grid-area: auto; line-height: 18px; margin: 0px; overflow: visible; text-align: left; text-align-last: auto; white-space-collapse: preserve-breaks;">allspringglobal.com</span>
|
| Expenses [Text Block] |
|
|
What were the Fund costs for the past year?The table explains the costs you would have paid within the reporting period based on a hypothetical $10,000 investment.
Table Summary
CLASS NAME |
COSTS OF A $10,000 INVESTMENT |
COSTS PAID AS A % OF A $10,000 INVESTMENT |
Class C |
$158 |
1.46% | The manager has contractually committed to waive fees and/or reimburse certain expenses to the extent necessary to cap the Fund's total annual fund operating expense ratio at a specific amount. Without this cap, the costs shown above may have been higher. Please see the prospectus for the amount and the expiration date of the cap. Prior to or after the commitment expiration date, the cap may be increased or the commitment to maintain the cap may be terminated only with the approval of the Board of Trustees. |
| Expenses Paid, Amount |
|
|
$ 158
|
| Expense Ratio, Percent |
|
|
1.46%
|
| Factors Affecting Performance [Text Block] |
|
|
How did the Fund perform last year and what affected its performance?The past year saw a wide set of narratives drive the economy and financial markets. From an initial focus on the impact of tariffs, markets swiftly moved onto the opportunities within artificial intelligence (AI) followed by a U.S. government shutdown. While narratives shifted, domestic growth remained above trend, supported initially by AI-driven capital expenditures and resilient consumer spending. Outside the U.S., investment opportunities were divergent. Globally, expectations for earnings growth remain concentrated on a single theme: AI. There were limited portfolio changes over the past 12 months. In fixed income, we reduced U.S. Treasury bond exposure and added to our U.S. core bond allocation. Security selection added to performance in our inflation-protected, alternative risk premia, and developed international equity strategies. Underperformance from active large and small-cap growth and value strategies detracted from relative performance. |
| Performance Past Does Not Indicate Future [Text] |
|
|
Figures quoted represent past performance, which is no guarantee of future results,
|
| Line Graph [Table Text Block] |
|
|

Table Summary
|
Class C with Load |
Spectrum Conservative Growth Blended Index |
Bloomberg U.S. Aggregate Bond Index |
Russell 3000® Index |
4/30/2016 |
$10,000 |
$10,000 |
$10,000 |
$10,000 |
5/31/2016 |
$10,044 |
$10,031 |
$10,003 |
$10,179 |
6/30/2016 |
$10,043 |
$10,127 |
$10,182 |
$10,200 |
7/31/2016 |
$10,263 |
$10,338 |
$10,247 |
$10,605 |
8/31/2016 |
$10,299 |
$10,346 |
$10,235 |
$10,632 |
9/30/2016 |
$10,340 |
$10,362 |
$10,229 |
$10,648 |
10/31/2016 |
$10,208 |
$10,234 |
$10,151 |
$10,418 |
11/30/2016 |
$10,234 |
$10,189 |
$9,911 |
$10,884 |
12/31/2016 |
$10,310 |
$10,284 |
$9,925 |
$11,097 |
1/31/2017 |
$10,438 |
$10,394 |
$9,944 |
$11,305 |
2/28/2017 |
$10,574 |
$10,564 |
$10,011 |
$11,726 |
3/31/2017 |
$10,612 |
$10,595 |
$10,006 |
$11,734 |
4/30/2017 |
$10,722 |
$10,703 |
$10,083 |
$11,858 |
5/31/2017 |
$10,822 |
$10,825 |
$10,160 |
$11,980 |
6/30/2017 |
$10,874 |
$10,849 |
$10,150 |
$12,088 |
7/31/2017 |
$11,020 |
$10,983 |
$10,194 |
$12,316 |
8/31/2017 |
$11,020 |
$11,055 |
$10,285 |
$12,339 |
9/30/2017 |
$11,141 |
$11,123 |
$10,236 |
$12,640 |
10/31/2017 |
$11,215 |
$11,220 |
$10,242 |
$12,916 |
11/30/2017 |
$11,315 |
$11,318 |
$10,229 |
$13,308 |
12/31/2017 |
$11,385 |
$11,411 |
$10,276 |
$13,441 |
1/31/2018 |
$11,605 |
$11,577 |
$10,158 |
$14,150 |
2/28/2018 |
$11,295 |
$11,326 |
$10,061 |
$13,628 |
3/31/2018 |
$11,187 |
$11,282 |
$10,126 |
$13,355 |
4/30/2018 |
$11,166 |
$11,265 |
$10,051 |
$13,406 |
5/31/2018 |
$11,268 |
$11,371 |
$10,122 |
$13,784 |
6/30/2018 |
$11,258 |
$11,358 |
$10,110 |
$13,874 |
7/31/2018 |
$11,420 |
$11,498 |
$10,112 |
$14,335 |
8/31/2018 |
$11,522 |
$11,626 |
$10,177 |
$14,838 |
9/30/2018 |
$11,506 |
$11,593 |
$10,112 |
$14,863 |
10/31/2018 |
$11,027 |
$11,186 |
$10,032 |
$13,768 |
11/30/2018 |
$11,119 |
$11,302 |
$10,092 |
$14,044 |
12/31/2018 |
$10,739 |
$11,070 |
$10,277 |
$12,737 |
1/31/2019 |
$11,228 |
$11,507 |
$10,386 |
$13,830 |
2/28/2019 |
$11,369 |
$11,644 |
$10,380 |
$14,316 |
3/31/2019 |
$11,490 |
$11,834 |
$10,580 |
$14,526 |
4/30/2019 |
$11,642 |
$12,005 |
$10,582 |
$15,106 |
5/31/2019 |
$11,446 |
$11,838 |
$10,770 |
$14,128 |
6/30/2019 |
$11,784 |
$12,246 |
$10,906 |
$15,120 |
7/31/2019 |
$11,817 |
$12,295 |
$10,930 |
$15,345 |
8/31/2019 |
$11,817 |
$12,371 |
$11,213 |
$15,032 |
9/30/2019 |
$11,867 |
$12,430 |
$11,153 |
$15,296 |
10/31/2019 |
$11,966 |
$12,580 |
$11,187 |
$15,625 |
11/30/2019 |
$12,097 |
$12,723 |
$11,181 |
$16,219 |
12/31/2019 |
$12,212 |
$12,887 |
$11,173 |
$16,688 |
1/31/2020 |
$12,289 |
$12,990 |
$11,388 |
$16,669 |
2/29/2020 |
$11,967 |
$12,709 |
$11,593 |
$15,305 |
3/31/2020 |
$11,433 |
$11,954 |
$11,525 |
$13,200 |
4/30/2020 |
$12,078 |
$12,634 |
$11,730 |
$14,948 |
5/31/2020 |
$12,389 |
$12,908 |
$11,784 |
$15,748 |
6/30/2020 |
$12,567 |
$13,109 |
$11,859 |
$16,108 |
7/31/2020 |
$12,934 |
$13,505 |
$12,036 |
$17,022 |
8/31/2020 |
$13,224 |
$13,783 |
$11,939 |
$18,255 |
9/30/2020 |
$12,959 |
$13,597 |
$11,932 |
$17,591 |
10/31/2020 |
$12,836 |
$13,444 |
$11,879 |
$17,211 |
11/30/2020 |
$13,404 |
$14,091 |
$11,995 |
$19,305 |
12/31/2020 |
$13,710 |
$14,359 |
$12,012 |
$20,173 |
1/31/2021 |
$13,686 |
$14,322 |
$11,926 |
$20,084 |
2/28/2021 |
$13,793 |
$14,325 |
$11,753 |
$20,711 |
3/31/2021 |
$13,829 |
$14,371 |
$11,607 |
$21,454 |
4/30/2021 |
$14,162 |
$14,657 |
$11,698 |
$22,560 |
5/31/2021 |
$14,270 |
$14,764 |
$11,737 |
$22,663 |
6/30/2021 |
$14,391 |
$14,915 |
$11,819 |
$23,222 |
7/31/2021 |
$14,511 |
$15,079 |
$11,951 |
$23,614 |
8/31/2021 |
$14,619 |
$15,187 |
$11,929 |
$24,288 |
9/30/2021 |
$14,411 |
$14,938 |
$11,825 |
$23,198 |
10/31/2021 |
$14,688 |
$15,192 |
$11,822 |
$24,767 |
11/30/2021 |
$14,567 |
$15,099 |
$11,857 |
$24,390 |
12/31/2021 |
$14,761 |
$15,308 |
$11,827 |
$25,350 |
1/31/2022 |
$14,240 |
$14,833 |
$11,572 |
$23,859 |
2/28/2022 |
$14,058 |
$14,663 |
$11,443 |
$23,258 |
3/31/2022 |
$13,856 |
$14,532 |
$11,125 |
$24,012 |
4/30/2022 |
$13,281 |
$13,839 |
$10,703 |
$21,857 |
5/31/2022 |
$13,360 |
$13,865 |
$10,772 |
$21,828 |
6/30/2022 |
$12,718 |
$13,229 |
$10,603 |
$20,002 |
7/31/2022 |
$13,191 |
$13,857 |
$10,862 |
$21,878 |
8/31/2022 |
$12,810 |
$13,448 |
$10,555 |
$21,062 |
9/30/2022 |
$12,067 |
$12,624 |
$10,099 |
$19,109 |
10/31/2022 |
$12,306 |
$12,876 |
$9,968 |
$20,676 |
11/30/2022 |
$12,798 |
$13,412 |
$10,335 |
$21,755 |
12/31/2022 |
$12,537 |
$13,186 |
$10,288 |
$20,481 |
1/31/2023 |
$13,018 |
$13,744 |
$10,604 |
$21,892 |
2/28/2023 |
$12,647 |
$13,436 |
$10,330 |
$21,380 |
3/31/2023 |
$12,890 |
$13,758 |
$10,593 |
$21,952 |
4/30/2023 |
$12,959 |
$13,865 |
$10,657 |
$22,186 |
5/31/2023 |
$12,849 |
$13,724 |
$10,541 |
$22,272 |
6/30/2023 |
$13,130 |
$13,973 |
$10,503 |
$23,793 |
7/31/2023 |
$13,323 |
$14,153 |
$10,496 |
$24,646 |
8/31/2023 |
$13,199 |
$13,991 |
$10,429 |
$24,170 |
9/30/2023 |
$12,821 |
$13,609 |
$10,164 |
$23,019 |
10/31/2023 |
$12,542 |
$13,358 |
$10,003 |
$22,408 |
11/30/2023 |
$13,212 |
$14,109 |
$10,456 |
$24,498 |
12/31/2023 |
$13,722 |
$14,679 |
$10,857 |
$25,797 |
1/31/2024 |
$13,694 |
$14,686 |
$10,827 |
$26,083 |
2/29/2024 |
$13,864 |
$14,777 |
$10,674 |
$27,495 |
3/31/2024 |
$14,135 |
$15,014 |
$10,773 |
$28,382 |
4/30/2024 |
$13,697 |
$14,642 |
$10,500 |
$27,133 |
5/31/2024 |
$14,061 |
$14,983 |
$10,678 |
$28,415 |
6/30/2024 |
$14,267 |
$15,172 |
$10,780 |
$29,295 |
7/31/2024 |
$14,473 |
$15,490 |
$11,031 |
$29,839 |
8/31/2024 |
$14,723 |
$15,744 |
$11,190 |
$30,489 |
9/30/2024 |
$14,927 |
$16,008 |
$11,340 |
$31,120 |
10/31/2024 |
$14,601 |
$15,694 |
$11,058 |
$30,891 |
11/30/2024 |
$15,030 |
$15,997 |
$11,175 |
$32,946 |
12/31/2024 |
$14,701 |
$15,715 |
$10,992 |
$31,939 |
1/31/2025 |
$14,881 |
$15,969 |
$11,051 |
$32,947 |
2/28/2025 |
$15,045 |
$16,139 |
$11,294 |
$32,316 |
3/31/2025 |
$14,794 |
$15,940 |
$11,298 |
$30,431 |
4/30/2025 |
$14,870 |
$15,999 |
$11,343 |
$30,227 |
5/31/2025 |
$15,080 |
$16,247 |
$11,261 |
$32,143 |
6/30/2025 |
$15,455 |
$16,633 |
$11,435 |
$33,776 |
7/31/2025 |
$15,485 |
$16,697 |
$11,404 |
$34,520 |
8/31/2025 |
$15,817 |
$16,977 |
$11,541 |
$35,318 |
9/30/2025 |
$16,276 |
$17,299 |
$11,667 |
$36,537 |
10/31/2025 |
$16,459 |
$17,493 |
$11,740 |
$37,320 |
11/30/2025 |
$16,520 |
$17,557 |
$11,813 |
$37,423 |
12/31/2025 |
$16,525 |
$17,616 |
$11,795 |
$37,415 |
1/31/2026 |
$17,005 |
$17,848 |
$11,808 |
$37,996 |
2/28/2026 |
$17,561 |
$18,085 |
$12,001 |
$37,815 |
3/31/2026 |
$16,980 |
$17,425 |
$11,789 |
$35,935 |
4/30/2026 |
$17,397 |
$18,173 |
$11,803 |
$39,601 |
|
| Average Annual Return [Table Text Block] |
|
|
Table Summary
AATR |
1 Year |
5 Years |
10 Years |
Class CFootnote Reference* |
16.12 |
3.92 |
5.69 |
Class C with LoadFootnote Reference* |
15.12 |
3.92 |
5.69 |
Spectrum Conservative Growth Blended IndexFootnote Reference† |
13.59 |
4.39 |
6.16 |
Bloomberg U.S. Aggregate Bond Index |
4.06 |
0.18 |
1.67 |
Russell 3000® Index |
31.01 |
11.91 |
14.75 | |
| No Deduction of Taxes [Text Block] |
|
|
do not reflect taxes that a shareholder may pay on an investment in a fund.
|
| AssetsNet |
|
|
$ 196,256,078
|
| Holdings Count | Holding |
|
|
33
|
| Advisory Fees Paid, Amount |
|
|
$ 357,345
|
| InvestmentCompanyPortfolioTurnover |
|
|
41.00%
|
| Additional Fund Statistics [Text Block] |
|
|
Table Summary
Total net assets |
$196,256,078 |
# of portfolio holdings |
33 |
Portfolio turnover rate |
41% |
Total advisory fees paid |
$357,345 | |
| Holdings [Text Block] |
|
|
ALLOCATION (% OF TOTAL INVESTMENTS)
Table Summary
Fund |
Effective AllocationFootnote Reference1 |
Bonds |
44.3 |
Stocks |
35.7 |
Inflation sensitive investments |
15.4 |
Alternative investments |
4.6 |
| Footnote |
Description |
Footnote1 |
Effective allocation is subject to change and may have changed since the date specified. Effective allocation excludes cash, and percent totals may not add to 100% due to rounding. | |
| Largest Holdings [Text Block] |
|
|
TOP TEN HOLDINGS (% OF NET ASSETS)
Table Summary
Allspring Real Return Portfolio |
14.4 |
Allspring Disciplined Large Cap Portfolio |
12.9 |
Allspring Income Plus ETF |
10.7 |
iShares Core U.S. Aggregate Bond ETF |
8.7 |
Allspring Broad Market Core Bond ETF |
6.8 |
Allspring High Yield Bond Fund Institutional Class |
5.2 |
Allspring Diversified Income Builder Fund Class R6 |
5.2 |
Allspring Core Plus ETF |
4.9 |
Allspring Disciplined International Developed Markets Portfolio |
4.7 |
Allspring Alternative Risk Premia Fund Class R6 |
4.2 | |
| Material Fund Change [Text Block] |
|
|
|
| C000205241 |
|
|
|
| Shareholder Report [Line Items] |
|
|
|
| Fund Name |
|
|
Spectrum Conservative Growth Fund
|
| Class Name |
|
|
Institutional Class
|
| Trading Symbol |
|
|
WMBZX
|
| Annual or Semi-Annual Statement [Text Block] |
|
|
This annual shareholder report contains important information about Spectrum Conservative Growth Fund for the period from May 1, 2025 to April 30, 2026.
|
| Additional Information [Text Block] |
|
|
You can find additional information about the Fund at allspringglobal.com. You can also request this information by contacting us at 1-800-222-8222.
|
| Additional Information Phone Number |
|
|
<span style="white-space: nowrap; box-sizing: border-box; color: rgb(0, 0, 0); display: inline; flex-wrap: nowrap; font-size: 12px; font-weight: 400; grid-area: auto; line-height: 18px; margin: 0px; overflow: visible; text-align: left; text-align-last: auto;"> 1-800-222-8222.</span>
|
| Additional Information Website |
|
|
<span style="box-sizing: border-box; color: rgb(0, 0, 0); display: inline; flex-wrap: nowrap; font-size: 12px; font-weight: 400; grid-area: auto; line-height: 18px; margin: 0px; overflow: visible; text-align: left; text-align-last: auto; white-space-collapse: preserve-breaks;">allspringglobal.com</span>
|
| Expenses [Text Block] |
|
|
What were the Fund costs for the past year?The table explains the costs you would have paid within the reporting period based on a hypothetical $10,000 investment.
Table Summary
CLASS NAME |
COSTS OF A $10,000 INVESTMENT |
COSTS PAID AS A % OF A $10,000 INVESTMENT |
Institutional Class |
$43 |
0.40% | The manager has contractually committed to waive fees and/or reimburse certain expenses to the extent necessary to cap the Fund's total annual fund operating expense ratio at a specific amount. Without this cap, the costs shown above may have been higher. Please see the prospectus for the amount and the expiration date of the cap. Prior to or after the commitment expiration date, the cap may be increased or the commitment to maintain the cap may be terminated only with the approval of the Board of Trustees. |
| Expenses Paid, Amount |
|
|
$ 43
|
| Expense Ratio, Percent |
|
|
0.40%
|
| Factors Affecting Performance [Text Block] |
|
|
How did the Fund perform last year and what affected its performance?The past year saw a wide set of narratives drive the economy and financial markets. From an initial focus on the impact of tariffs, markets swiftly moved onto the opportunities within artificial intelligence (AI) followed by a U.S. government shutdown. While narratives shifted, domestic growth remained above trend, supported initially by AI-driven capital expenditures and resilient consumer spending. Outside the U.S., investment opportunities were divergent. Globally, expectations for earnings growth remain concentrated on a single theme: AI. There were limited portfolio changes over the past 12 months. In fixed income, we reduced U.S. Treasury bond exposure and added to our U.S. core bond allocation. Security selection added to performance in our inflation-protected, alternative risk premia, and developed international equity strategies. Underperformance from active large and small-cap growth and value strategies detracted from relative performance. |
| Performance Past Does Not Indicate Future [Text] |
|
|
Figures quoted represent past performance, which is no guarantee of future results,
|
| Line Graph [Table Text Block] |
|
|
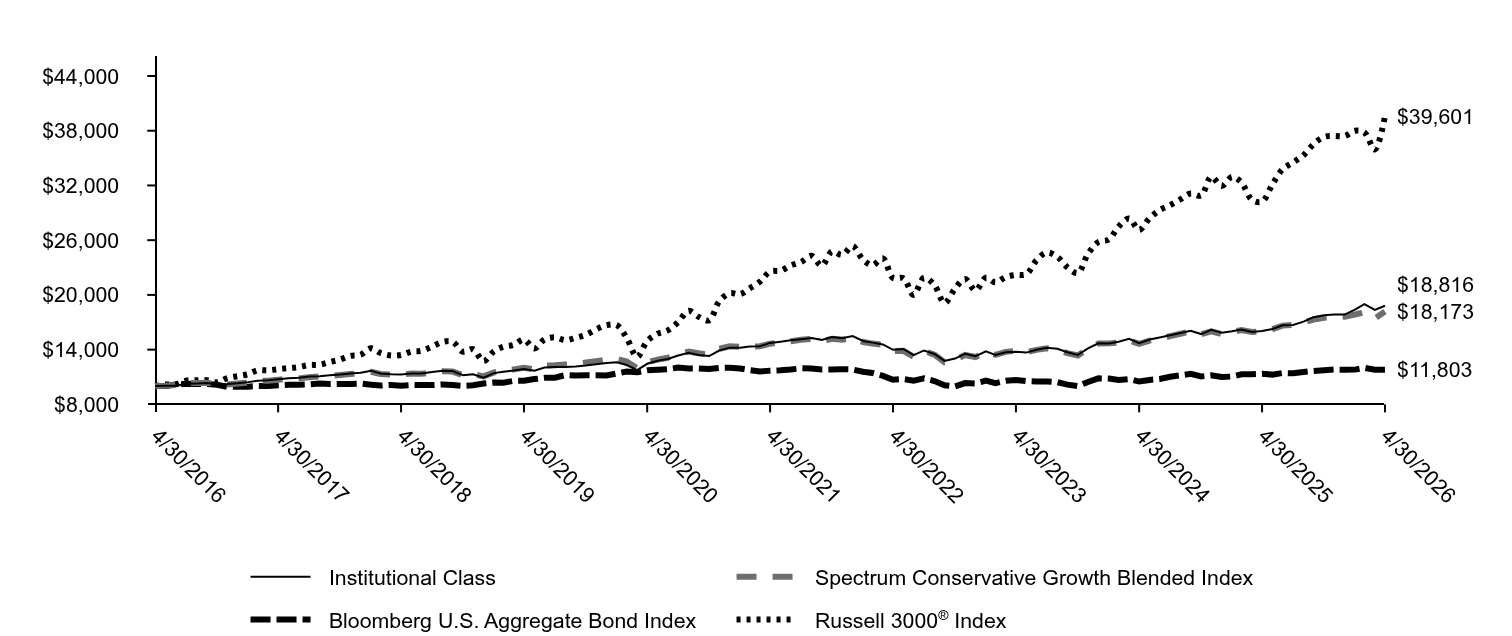
Table Summary
|
Institutional Class |
Spectrum Conservative Growth Blended Index |
Bloomberg U.S. Aggregate Bond Index |
Russell 3000® Index |
4/30/2016 |
$10,000 |
$10,000 |
$10,000 |
$10,000 |
5/31/2016 |
$10,044 |
$10,031 |
$10,003 |
$10,179 |
6/30/2016 |
$10,043 |
$10,127 |
$10,182 |
$10,200 |
7/31/2016 |
$10,263 |
$10,338 |
$10,247 |
$10,605 |
8/31/2016 |
$10,299 |
$10,346 |
$10,235 |
$10,632 |
9/30/2016 |
$10,340 |
$10,362 |
$10,229 |
$10,648 |
10/31/2016 |
$10,208 |
$10,234 |
$10,151 |
$10,418 |
11/30/2016 |
$10,234 |
$10,189 |
$9,911 |
$10,884 |
12/31/2016 |
$10,310 |
$10,284 |
$9,925 |
$11,097 |
1/31/2017 |
$10,438 |
$10,394 |
$9,944 |
$11,305 |
2/28/2017 |
$10,584 |
$10,564 |
$10,011 |
$11,726 |
3/31/2017 |
$10,631 |
$10,595 |
$10,006 |
$11,734 |
4/30/2017 |
$10,750 |
$10,703 |
$10,083 |
$11,858 |
5/31/2017 |
$10,851 |
$10,825 |
$10,160 |
$11,980 |
6/30/2017 |
$10,919 |
$10,849 |
$10,150 |
$12,088 |
7/31/2017 |
$11,057 |
$10,983 |
$10,194 |
$12,316 |
8/31/2017 |
$11,076 |
$11,055 |
$10,285 |
$12,339 |
9/30/2017 |
$11,196 |
$11,123 |
$10,236 |
$12,640 |
10/31/2017 |
$11,279 |
$11,220 |
$10,242 |
$12,916 |
11/30/2017 |
$11,390 |
$11,318 |
$10,229 |
$13,308 |
12/31/2017 |
$11,470 |
$11,411 |
$10,276 |
$13,441 |
1/31/2018 |
$11,695 |
$11,577 |
$10,158 |
$14,150 |
2/28/2018 |
$11,388 |
$11,326 |
$10,061 |
$13,628 |
3/31/2018 |
$11,296 |
$11,282 |
$10,126 |
$13,355 |
4/30/2018 |
$11,275 |
$11,265 |
$10,051 |
$13,406 |
5/31/2018 |
$11,379 |
$11,371 |
$10,122 |
$13,784 |
6/30/2018 |
$11,379 |
$11,358 |
$10,110 |
$13,874 |
7/31/2018 |
$11,546 |
$11,498 |
$10,112 |
$14,335 |
8/31/2018 |
$11,671 |
$11,626 |
$10,177 |
$14,838 |
9/30/2018 |
$11,658 |
$11,593 |
$10,112 |
$14,863 |
10/31/2018 |
$11,185 |
$11,186 |
$10,032 |
$13,768 |
11/30/2018 |
$11,290 |
$11,302 |
$10,092 |
$14,044 |
12/31/2018 |
$10,916 |
$11,070 |
$10,277 |
$12,737 |
1/31/2019 |
$11,424 |
$11,507 |
$10,386 |
$13,830 |
2/28/2019 |
$11,582 |
$11,644 |
$10,380 |
$14,316 |
3/31/2019 |
$11,716 |
$11,834 |
$10,580 |
$14,526 |
4/30/2019 |
$11,875 |
$12,005 |
$10,582 |
$15,106 |
5/31/2019 |
$11,694 |
$11,838 |
$10,770 |
$14,128 |
6/30/2019 |
$12,045 |
$12,246 |
$10,906 |
$15,120 |
7/31/2019 |
$12,090 |
$12,295 |
$10,930 |
$15,345 |
8/31/2019 |
$12,102 |
$12,371 |
$11,213 |
$15,032 |
9/30/2019 |
$12,164 |
$12,430 |
$11,153 |
$15,296 |
10/31/2019 |
$12,267 |
$12,580 |
$11,187 |
$15,625 |
11/30/2019 |
$12,405 |
$12,723 |
$11,181 |
$16,219 |
12/31/2019 |
$12,543 |
$12,887 |
$11,173 |
$16,688 |
1/31/2020 |
$12,624 |
$12,990 |
$11,388 |
$16,669 |
2/29/2020 |
$12,309 |
$12,709 |
$11,593 |
$15,305 |
3/31/2020 |
$11,760 |
$11,954 |
$11,525 |
$13,200 |
4/30/2020 |
$12,449 |
$12,634 |
$11,730 |
$14,948 |
5/31/2020 |
$12,776 |
$12,908 |
$11,784 |
$15,748 |
6/30/2020 |
$12,975 |
$13,109 |
$11,859 |
$16,108 |
7/31/2020 |
$13,360 |
$13,505 |
$12,036 |
$17,022 |
8/31/2020 |
$13,664 |
$13,783 |
$11,939 |
$18,255 |
9/30/2020 |
$13,405 |
$13,597 |
$11,932 |
$17,591 |
10/31/2020 |
$13,299 |
$13,444 |
$11,879 |
$17,211 |
11/30/2020 |
$13,899 |
$14,091 |
$11,995 |
$19,305 |
12/31/2020 |
$14,219 |
$14,359 |
$12,012 |
$20,173 |
1/31/2021 |
$14,219 |
$14,322 |
$11,926 |
$20,084 |
2/28/2021 |
$14,333 |
$14,325 |
$11,753 |
$20,711 |
3/31/2021 |
$14,383 |
$14,371 |
$11,607 |
$21,454 |
4/30/2021 |
$14,737 |
$14,657 |
$11,698 |
$22,560 |
5/31/2021 |
$14,876 |
$14,764 |
$11,737 |
$22,663 |
6/30/2021 |
$15,018 |
$14,915 |
$11,819 |
$23,222 |
7/31/2021 |
$15,146 |
$15,079 |
$11,951 |
$23,614 |
8/31/2021 |
$15,274 |
$15,187 |
$11,929 |
$24,288 |
9/30/2021 |
$15,072 |
$14,938 |
$11,825 |
$23,198 |
10/31/2021 |
$15,381 |
$15,192 |
$11,822 |
$24,767 |
11/30/2021 |
$15,252 |
$15,099 |
$11,857 |
$24,390 |
12/31/2021 |
$15,483 |
$15,308 |
$11,827 |
$25,350 |
1/31/2022 |
$14,951 |
$14,833 |
$11,572 |
$23,859 |
2/28/2022 |
$14,769 |
$14,663 |
$11,443 |
$23,258 |
3/31/2022 |
$14,571 |
$14,532 |
$11,125 |
$24,012 |
4/30/2022 |
$13,980 |
$13,839 |
$10,703 |
$21,857 |
5/31/2022 |
$14,078 |
$13,865 |
$10,772 |
$21,828 |
6/30/2022 |
$13,398 |
$13,229 |
$10,603 |
$20,002 |
7/31/2022 |
$13,910 |
$13,857 |
$10,862 |
$21,878 |
8/31/2022 |
$13,526 |
$13,448 |
$10,555 |
$21,062 |
9/30/2022 |
$12,762 |
$12,624 |
$10,099 |
$19,109 |
10/31/2022 |
$13,022 |
$12,876 |
$9,968 |
$20,676 |
11/30/2022 |
$13,541 |
$13,412 |
$10,335 |
$21,755 |
12/31/2022 |
$13,287 |
$13,186 |
$10,288 |
$20,481 |
1/31/2023 |
$13,812 |
$13,744 |
$10,604 |
$21,892 |
2/28/2023 |
$13,422 |
$13,436 |
$10,330 |
$21,380 |
3/31/2023 |
$13,705 |
$13,758 |
$10,593 |
$21,952 |
4/30/2023 |
$13,781 |
$13,865 |
$10,657 |
$22,186 |
5/31/2023 |
$13,675 |
$13,724 |
$10,541 |
$22,272 |
6/30/2023 |
$13,990 |
$13,973 |
$10,503 |
$23,793 |
7/31/2023 |
$14,201 |
$14,153 |
$10,496 |
$24,646 |
8/31/2023 |
$14,095 |
$13,991 |
$10,429 |
$24,170 |
9/30/2023 |
$13,707 |
$13,609 |
$10,164 |
$23,019 |
10/31/2023 |
$13,416 |
$13,358 |
$10,003 |
$22,408 |
11/30/2023 |
$14,137 |
$14,109 |
$10,456 |
$24,498 |
12/31/2023 |
$14,696 |
$14,679 |
$10,857 |
$25,797 |
1/31/2024 |
$14,681 |
$14,686 |
$10,827 |
$26,083 |
2/29/2024 |
$14,868 |
$14,777 |
$10,674 |
$27,495 |
3/31/2024 |
$15,183 |
$15,014 |
$10,773 |
$28,382 |
4/30/2024 |
$14,715 |
$14,642 |
$10,500 |
$27,133 |
5/31/2024 |
$15,105 |
$14,983 |
$10,678 |
$28,415 |
6/30/2024 |
$15,335 |
$15,172 |
$10,780 |
$29,295 |
7/31/2024 |
$15,572 |
$15,490 |
$11,031 |
$29,839 |
8/31/2024 |
$15,824 |
$15,744 |
$11,190 |
$30,489 |
9/30/2024 |
$16,072 |
$16,008 |
$11,340 |
$31,120 |
10/31/2024 |
$15,707 |
$15,694 |
$11,058 |
$30,891 |
11/30/2024 |
$16,183 |
$15,997 |
$11,175 |
$32,946 |
12/31/2024 |
$15,844 |
$15,715 |
$10,992 |
$31,939 |
1/31/2025 |
$16,021 |
$15,969 |
$11,051 |
$32,947 |
2/28/2025 |
$16,214 |
$16,139 |
$11,294 |
$32,316 |
3/31/2025 |
$15,940 |
$15,940 |
$11,298 |
$30,431 |
4/30/2025 |
$16,037 |
$15,999 |
$11,343 |
$30,227 |
5/31/2025 |
$16,263 |
$16,247 |
$11,261 |
$32,143 |
6/30/2025 |
$16,662 |
$16,633 |
$11,435 |
$33,776 |
7/31/2025 |
$16,711 |
$16,697 |
$11,404 |
$34,520 |
8/31/2025 |
$17,069 |
$16,977 |
$11,541 |
$35,318 |
9/30/2025 |
$17,561 |
$17,299 |
$11,667 |
$36,537 |
10/31/2025 |
$17,774 |
$17,493 |
$11,740 |
$37,320 |
11/30/2025 |
$17,856 |
$17,557 |
$11,813 |
$37,423 |
12/31/2025 |
$17,846 |
$17,616 |
$11,795 |
$37,415 |
1/31/2026 |
$18,379 |
$17,848 |
$11,808 |
$37,996 |
2/28/2026 |
$18,979 |
$18,085 |
$12,001 |
$37,815 |
3/31/2026 |
$18,349 |
$17,425 |
$11,789 |
$35,935 |
4/30/2026 |
$18,816 |
$18,173 |
$11,803 |
$39,601 |
|
| Average Annual Return [Table Text Block] |
|
|
Table Summary
AATR |
1 Year |
5 Years |
10 Years |
Institutional ClassFootnote Reference* |
17.33 |
5.01 |
6.53 |
Spectrum Conservative Growth Blended IndexFootnote Reference† |
13.59 |
4.39 |
6.16 |
Bloomberg U.S. Aggregate Bond Index |
4.06 |
0.18 |
1.67 |
Russell 3000® Index |
31.01 |
11.91 |
14.75 | |
| No Deduction of Taxes [Text Block] |
|
|
do not reflect taxes that a shareholder may pay on an investment in a fund.
|
| AssetsNet |
|
|
$ 196,256,078
|
| Holdings Count | Holding |
|
|
33
|
| Advisory Fees Paid, Amount |
|
|
$ 357,345
|
| InvestmentCompanyPortfolioTurnover |
|
|
41.00%
|
| Additional Fund Statistics [Text Block] |
|
|
Table Summary
Total net assets |
$196,256,078 |
# of portfolio holdings |
33 |
Portfolio turnover rate |
41% |
Total advisory fees paid |
$357,345 | |
| Holdings [Text Block] |
|
|
ALLOCATION (% OF TOTAL INVESTMENTS)
Table Summary
Fund |
Effective AllocationFootnote Reference1 |
Bonds |
44.3 |
Stocks |
35.7 |
Inflation sensitive investments |
15.4 |
Alternative investments |
4.6 |
| Footnote |
Description |
Footnote1 |
Effective allocation is subject to change and may have changed since the date specified. Effective allocation excludes cash, and percent totals may not add to 100% due to rounding. | |
| Largest Holdings [Text Block] |
|
|
TOP TEN HOLDINGS (% OF NET ASSETS)
Table Summary
Allspring Real Return Portfolio |
14.4 |
Allspring Disciplined Large Cap Portfolio |
12.9 |
Allspring Income Plus ETF |
10.7 |
iShares Core U.S. Aggregate Bond ETF |
8.7 |
Allspring Broad Market Core Bond ETF |
6.8 |
Allspring High Yield Bond Fund Institutional Class |
5.2 |
Allspring Diversified Income Builder Fund Class R6 |
5.2 |
Allspring Core Plus ETF |
4.9 |
Allspring Disciplined International Developed Markets Portfolio |
4.7 |
Allspring Alternative Risk Premia Fund Class R6 |
4.2 | |
| Material Fund Change [Text Block] |
|
|
|
| C000176107 |
|
|
|
| Shareholder Report [Line Items] |
|
|
|
| Fund Name |
|
|
Spectrum Growth Fund
|
| Class Name |
|
|
Class A
|
| Trading Symbol |
|
|
WGAFX
|
| Annual or Semi-Annual Statement [Text Block] |
|
|
This annual shareholder report contains important information about Spectrum Growth Fund for the period from May 1, 2025 to April 30, 2026.
|
| Additional Information [Text Block] |
|
|
You can find additional information about the Fund at allspringglobal.com. You can also request this information by contacting us at 1-800-222-8222.
|
| Additional Information Phone Number |
|
|
<span style="white-space: nowrap; box-sizing: border-box; color: rgb(0, 0, 0); display: inline; flex-wrap: nowrap; font-size: 12px; font-weight: 400; grid-area: auto; line-height: 18px; margin: 0px; overflow: visible; text-align: left; text-align-last: auto;"> 1-800-222-8222.</span>
|
| Additional Information Website |
|
|
<span style="box-sizing: border-box; color: rgb(0, 0, 0); display: inline; flex-wrap: nowrap; font-size: 12px; font-weight: 400; grid-area: auto; line-height: 18px; margin: 0px; overflow: visible; text-align: left; text-align-last: auto; white-space-collapse: preserve-breaks;">allspringglobal.com</span>
|
| Expenses [Text Block] |
|
|
What were the Fund costs for the past year?The table explains the costs you would have paid within the reporting period based on a hypothetical $10,000 investment.
Table Summary
CLASS NAME |
COSTS OF A $10,000 INVESTMENT |
COSTS PAID AS A % OF A $10,000 INVESTMENT |
Class A |
$80 |
0.72% | The manager has contractually committed to waive fees and/or reimburse certain expenses to the extent necessary to cap the Fund's total annual fund operating expense ratio at a specific amount. Without this cap, the costs shown above may have been higher. Please see the prospectus for the amount and the expiration date of the cap. Prior to or after the commitment expiration date, the cap may be increased or the commitment to maintain the cap may be terminated only with the approval of the Board of Trustees. |
| Expenses Paid, Amount |
|
|
$ 80
|
| Expense Ratio, Percent |
|
|
0.72%
|
| Factors Affecting Performance [Text Block] |
|
|
How did the Fund perform last year and what affected its performance?The past year saw a wide set of narratives drive the economy and financial markets. From an initial focus on the impact of tariffs, markets swiftly moved onto the opportunities within artificial intelligence (AI) followed by a U.S. government shutdown. While narratives shifted, domestic growth remained above trend, supported initially by AI-driven capital expenditures and resilient consumer spending. Outside the U.S., investment opportunities were divergent. Globally, expectations for earnings growth remain concentrated on a single theme: AI. There were limited portfolio changes over the past 12 months. In fixed income, we reduced U.S. Treasury bond exposure and added to our U.S. core bond allocation. Security selection added to performance in our inflation-protected, alternative risk premia, and developed international equity strategies. Underperformance from active large and small-cap growth and value strategies detracted from relative performance. |
| Performance Past Does Not Indicate Future [Text] |
|
|
Figures quoted represent past performance, which is no guarantee of future results,
|
| Line Graph [Table Text Block] |
|
|

Table Summary
|
Class A with Load |
Spectrum Growth Blended Index |
Bloomberg U.S. Aggregate Bond Index |
Russell 3000® Index |
4/30/2016 |
$9,425 |
$10,000 |
$10,000 |
$10,000 |
5/31/2016 |
$9,525 |
$10,060 |
$10,003 |
$10,179 |
6/30/2016 |
$9,404 |
$10,071 |
$10,182 |
$10,200 |
7/31/2016 |
$9,759 |
$10,427 |
$10,247 |
$10,605 |
8/31/2016 |
$9,823 |
$10,455 |
$10,235 |
$10,632 |
9/30/2016 |
$9,887 |
$10,494 |
$10,229 |
$10,648 |
10/31/2016 |
$9,710 |
$10,315 |
$10,151 |
$10,418 |
11/30/2016 |
$9,909 |
$10,467 |
$9,911 |
$10,884 |
12/31/2016 |
$10,021 |
$10,649 |
$9,925 |
$11,097 |
1/31/2017 |
$10,237 |
$10,856 |
$9,944 |
$11,305 |
2/28/2017 |
$10,446 |
$11,138 |
$10,011 |
$11,726 |
3/31/2017 |
$10,550 |
$11,209 |
$10,006 |
$11,734 |
4/30/2017 |
$10,721 |
$11,350 |
$10,083 |
$11,858 |
5/31/2017 |
$10,878 |
$11,521 |
$10,160 |
$11,980 |
6/30/2017 |
$11,004 |
$11,586 |
$10,150 |
$12,088 |
7/31/2017 |
$11,235 |
$11,821 |
$10,194 |
$12,316 |
8/31/2017 |
$11,213 |
$11,869 |
$10,285 |
$12,339 |
9/30/2017 |
$11,481 |
$12,073 |
$10,236 |
$12,640 |
10/31/2017 |
$11,645 |
$12,277 |
$10,242 |
$12,916 |
11/30/2017 |
$11,854 |
$12,506 |
$10,229 |
$13,308 |
12/31/2017 |
$11,984 |
$12,655 |
$10,276 |
$13,441 |
1/31/2018 |
$12,512 |
$13,168 |
$10,158 |
$14,150 |
2/28/2018 |
$12,001 |
$12,722 |
$10,061 |
$13,628 |
3/31/2018 |
$11,811 |
$12,542 |
$10,126 |
$13,355 |
4/30/2018 |
$11,837 |
$12,598 |
$10,051 |
$13,406 |
5/31/2018 |
$12,001 |
$12,745 |
$10,122 |
$13,784 |
6/30/2018 |
$11,993 |
$12,731 |
$10,110 |
$13,874 |
7/31/2018 |
$12,278 |
$13,042 |
$10,112 |
$14,335 |
8/31/2018 |
$12,468 |
$13,249 |
$10,177 |
$14,838 |
9/30/2018 |
$12,477 |
$13,259 |
$10,112 |
$14,863 |
10/31/2018 |
$11,647 |
$12,433 |
$10,032 |
$13,768 |
11/30/2018 |
$11,820 |
$12,615 |
$10,092 |
$14,044 |
12/31/2018 |
$11,026 |
$11,867 |
$10,277 |
$12,737 |
1/31/2019 |
$11,780 |
$12,678 |
$10,386 |
$13,830 |
2/28/2019 |
$12,080 |
$12,985 |
$10,380 |
$14,316 |
3/31/2019 |
$12,173 |
$13,160 |
$10,580 |
$14,526 |
4/30/2019 |
$12,483 |
$13,538 |
$10,582 |
$15,106 |
5/31/2019 |
$11,956 |
$12,921 |
$10,770 |
$14,128 |
6/30/2019 |
$12,534 |
$13,649 |
$10,906 |
$15,120 |
7/31/2019 |
$12,576 |
$13,729 |
$10,930 |
$15,345 |
8/31/2019 |
$12,400 |
$13,542 |
$11,213 |
$15,032 |
9/30/2019 |
$12,565 |
$13,744 |
$11,153 |
$15,296 |
10/31/2019 |
$12,772 |
$14,033 |
$11,187 |
$15,625 |
11/30/2019 |
$13,051 |
$14,360 |
$11,181 |
$16,219 |
12/31/2019 |
$13,332 |
$14,739 |
$11,173 |
$16,688 |
1/31/2020 |
$13,269 |
$14,692 |
$11,388 |
$16,669 |
2/29/2020 |
$12,493 |
$13,793 |
$11,593 |
$15,305 |
3/31/2020 |
$11,760 |
$12,235 |
$11,525 |
$13,200 |
4/30/2020 |
$12,797 |
$13,408 |
$11,730 |
$14,948 |
5/31/2020 |
$13,311 |
$13,928 |
$11,784 |
$15,748 |
6/30/2020 |
$13,583 |
$14,275 |
$11,859 |
$16,108 |
7/31/2020 |
$14,097 |
$14,924 |
$12,036 |
$17,022 |
8/31/2020 |
$14,747 |
$15,658 |
$11,939 |
$18,255 |
9/30/2020 |
$14,286 |
$15,245 |
$11,932 |
$17,591 |
10/31/2020 |
$14,076 |
$14,969 |
$11,879 |
$17,211 |
11/30/2020 |
$15,124 |
$16,169 |
$11,995 |
$19,305 |
12/31/2020 |
$15,667 |
$16,681 |
$12,012 |
$20,173 |
1/31/2021 |
$15,679 |
$16,656 |
$11,926 |
$20,084 |
2/28/2021 |
$16,008 |
$16,855 |
$11,753 |
$20,711 |
3/31/2021 |
$16,256 |
$17,101 |
$11,607 |
$21,454 |
4/30/2021 |
$16,821 |
$17,619 |
$11,698 |
$22,560 |
5/31/2021 |
$17,021 |
$17,791 |
$11,737 |
$22,663 |
6/30/2021 |
$17,221 |
$18,014 |
$11,819 |
$23,222 |
7/31/2021 |
$17,362 |
$18,192 |
$11,951 |
$23,614 |
8/31/2021 |
$17,645 |
$18,462 |
$11,929 |
$24,288 |
9/30/2021 |
$17,221 |
$17,989 |
$11,825 |
$23,198 |
10/31/2021 |
$17,857 |
$18,572 |
$11,822 |
$24,767 |
11/30/2021 |
$17,574 |
$18,321 |
$11,857 |
$24,390 |
12/31/2021 |
$18,055 |
$18,788 |
$11,827 |
$25,350 |
1/31/2022 |
$17,339 |
$18,042 |
$11,572 |
$23,859 |
2/28/2022 |
$16,866 |
$17,768 |
$11,443 |
$23,258 |
3/31/2022 |
$16,785 |
$17,861 |
$11,125 |
$24,012 |
4/30/2022 |
$15,894 |
$16,785 |
$10,703 |
$21,857 |
5/31/2022 |
$16,029 |
$16,795 |
$10,772 |
$21,828 |
6/30/2022 |
$14,935 |
$15,713 |
$10,603 |
$20,002 |
7/31/2022 |
$15,678 |
$16,680 |
$10,862 |
$21,878 |
8/31/2022 |
$15,192 |
$16,151 |
$10,555 |
$21,062 |
9/30/2022 |
$14,206 |
$14,933 |
$10,099 |
$19,109 |
10/31/2022 |
$14,746 |
$15,555 |
$9,968 |
$20,676 |
11/30/2022 |
$15,516 |
$16,358 |
$10,335 |
$21,755 |
12/31/2022 |
$15,026 |
$15,903 |
$10,288 |
$20,481 |
1/31/2023 |
$15,798 |
$16,761 |
$10,604 |
$21,892 |
2/28/2023 |
$15,332 |
$16,377 |
$10,330 |
$21,380 |
3/31/2023 |
$15,653 |
$16,775 |
$10,593 |
$21,952 |
4/30/2023 |
$15,755 |
$16,936 |
$10,657 |
$22,186 |
5/31/2023 |
$15,623 |
$16,779 |
$10,541 |
$22,272 |
6/30/2023 |
$16,265 |
$17,387 |
$10,503 |
$23,793 |
7/31/2023 |
$16,644 |
$17,792 |
$10,496 |
$24,646 |
8/31/2023 |
$16,396 |
$17,487 |
$10,429 |
$24,170 |
9/30/2023 |
$15,857 |
$16,919 |
$10,164 |
$23,019 |
10/31/2023 |
$15,434 |
$16,534 |
$10,003 |
$22,408 |
11/30/2023 |
$16,469 |
$17,684 |
$10,456 |
$24,498 |
12/31/2023 |
$17,226 |
$18,470 |
$10,857 |
$25,797 |
1/31/2024 |
$17,212 |
$18,518 |
$10,827 |
$26,083 |
2/29/2024 |
$17,725 |
$18,940 |
$10,674 |
$27,495 |
3/31/2024 |
$18,209 |
$19,364 |
$10,773 |
$28,382 |
4/30/2024 |
$17,564 |
$18,818 |
$10,500 |
$27,133 |
5/31/2024 |
$18,179 |
$19,390 |
$10,678 |
$28,415 |
6/30/2024 |
$18,473 |
$19,702 |
$10,780 |
$29,295 |
7/31/2024 |
$18,751 |
$20,098 |
$11,031 |
$29,839 |
8/31/2024 |
$19,118 |
$20,481 |
$11,190 |
$30,489 |
9/30/2024 |
$19,426 |
$20,875 |
$11,340 |
$31,120 |
10/31/2024 |
$19,000 |
$20,493 |
$11,058 |
$30,891 |
11/30/2024 |
$19,719 |
$21,086 |
$11,175 |
$32,946 |
12/31/2024 |
$19,197 |
$20,648 |
$10,992 |
$31,939 |
1/31/2025 |
$19,574 |
$21,144 |
$11,051 |
$32,947 |
2/28/2025 |
$19,652 |
$21,185 |
$11,294 |
$32,316 |
3/31/2025 |
$19,103 |
$20,671 |
$11,298 |
$30,431 |
4/30/2025 |
$19,338 |
$20,758 |
$11,343 |
$30,227 |
5/31/2025 |
$19,919 |
$21,455 |
$11,261 |
$32,143 |
6/30/2025 |
$20,563 |
$22,149 |
$11,435 |
$33,776 |
7/31/2025 |
$20,657 |
$22,341 |
$11,404 |
$34,520 |
8/31/2025 |
$21,159 |
$22,806 |
$11,541 |
$35,318 |
9/30/2025 |
$21,850 |
$23,386 |
$11,667 |
$36,537 |
10/31/2025 |
$22,211 |
$23,742 |
$11,740 |
$37,320 |
11/30/2025 |
$22,242 |
$23,811 |
$11,813 |
$37,423 |
12/31/2025 |
$22,286 |
$23,937 |
$11,795 |
$37,415 |
1/31/2026 |
$23,075 |
$24,396 |
$11,808 |
$37,996 |
2/28/2026 |
$23,898 |
$24,690 |
$12,001 |
$37,815 |
3/31/2026 |
$22,869 |
$23,494 |
$11,789 |
$35,935 |
4/30/2026 |
$23,898 |
$25,060 |
$11,803 |
$39,601 |
|
| Average Annual Return [Table Text Block] |
|
|
Table Summary
AATR |
1 Year |
5 Years |
10 Years |
Class AFootnote Reference* |
23.58 |
7.28 |
9.75 |
Class A with LoadFootnote Reference* |
16.47 |
6.01 |
9.10 |
Spectrum Growth Blended IndexFootnote Reference† |
20.72 |
7.30 |
9.62 |
Bloomberg U.S. Aggregate Bond Index |
4.06 |
0.18 |
1.67 |
Russell 3000® Index |
31.01 |
11.91 |
14.75 | |
| No Deduction of Taxes [Text Block] |
|
|
do not reflect taxes that a shareholder may pay on an investment in a fund.
|
| AssetsNet |
|
|
$ 206,490,008
|
| Holdings Count | Holding |
|
|
37
|
| Advisory Fees Paid, Amount |
|
|
$ 364,887
|
| InvestmentCompanyPortfolioTurnover |
|
|
52.00%
|
| Additional Fund Statistics [Text Block] |
|
|
Table Summary
Total net assets |
$206,490,008 |
# of portfolio holdings |
37 |
Portfolio turnover rate |
52% |
Total advisory fees paid |
$364,887 | |
| Holdings [Text Block] |
|
|
ALLOCATION (% OF TOTAL INVESTMENTS)
Table Summary
Fund |
Effective AllocationFootnote Reference1 |
Stocks |
62.8 |
Bonds |
20.9 |
Inflation sensitive investments |
13.6 |
Alternative investments |
2.7 |
| Footnote |
Description |
Footnote1 |
Effective allocation is subject to change and may have changed since the date specified. Effective allocation excludes cash, and percent totals may not add to 100% due to rounding. | |
| Largest Holdings [Text Block] |
|
|
TOP TEN HOLDINGS (% OF NET ASSETS)
Table Summary
Allspring Disciplined Large Cap Portfolio |
19.7 |
Allspring Real Return Portfolio |
13.0 |
Allspring Disciplined International Developed Markets Portfolio |
6.6 |
Allspring Diversified Income Builder Fund Class R6 |
5.9 |
iShares Core MSCI Emerging Markets ETF |
4.8 |
iShares Core MSCI EAFE ETF |
4.8 |
Allspring Special Large Value ETF |
4.3 |
iShares Core S&P 500 ETF |
3.7 |
Allspring Core Plus ETF |
3.6 |
Allspring Income Plus ETF |
3.6 | |
| Material Fund Change [Text Block] |
|
|
|
| C000176108 |
|
|
|
| Shareholder Report [Line Items] |
|
|
|
| Fund Name |
|
|
Spectrum Growth Fund
|
| Class Name |
|
|
Class C
|
| Trading Symbol |
|
|
WGCFX
|
| Annual or Semi-Annual Statement [Text Block] |
|
|
This annual shareholder report contains important information about Spectrum Growth Fund for the period from May 1, 2025 to April 30, 2026.
|
| Additional Information [Text Block] |
|
|
You can find additional information about the Fund at allspringglobal.com. You can also request this information by contacting us at 1-800-222-8222.
|
| Additional Information Phone Number |
|
|
<span style="white-space: nowrap; box-sizing: border-box; color: rgb(0, 0, 0); display: inline; flex-wrap: nowrap; font-size: 12px; font-weight: 400; grid-area: auto; line-height: 18px; margin: 0px; overflow: visible; text-align: left; text-align-last: auto;"> 1-800-222-8222.</span>
|
| Additional Information Website |
|
|
<span style="box-sizing: border-box; color: rgb(0, 0, 0); display: inline; flex-wrap: nowrap; font-size: 12px; font-weight: 400; grid-area: auto; line-height: 18px; margin: 0px; overflow: visible; text-align: left; text-align-last: auto; white-space-collapse: preserve-breaks;">allspringglobal.com</span>
|
| Expenses [Text Block] |
|
|
What were the Fund costs for the past year?The table explains the costs you would have paid within the reporting period based on a hypothetical $10,000 investment.
Table Summary
CLASS NAME |
COSTS OF A $10,000 INVESTMENT |
COSTS PAID AS A % OF A $10,000 INVESTMENT |
Class C |
$164 |
1.47% | The manager has contractually committed to waive fees and/or reimburse certain expenses to the extent necessary to cap the Fund's total annual fund operating expense ratio at a specific amount. Without this cap, the costs shown above may have been higher. Please see the prospectus for the amount and the expiration date of the cap. Prior to or after the commitment expiration date, the cap may be increased or the commitment to maintain the cap may be terminated only with the approval of the Board of Trustees. |
| Expenses Paid, Amount |
|
|
$ 164
|
| Expense Ratio, Percent |
|
|
1.47%
|
| Factors Affecting Performance [Text Block] |
|
|
How did the Fund perform last year and what affected its performance?The past year saw a wide set of narratives drive the economy and financial markets. From an initial focus on the impact of tariffs, markets swiftly moved onto the opportunities within artificial intelligence (AI) followed by a U.S. government shutdown. While narratives shifted, domestic growth remained above trend, supported initially by AI-driven capital expenditures and resilient consumer spending. Outside the U.S., investment opportunities were divergent. Globally, expectations for earnings growth remain concentrated on a single theme: AI. There were limited portfolio changes over the past 12 months. In fixed income, we reduced U.S. Treasury bond exposure and added to our U.S. core bond allocation. Security selection added to performance in our inflation-protected, alternative risk premia, and developed international equity strategies. Underperformance from active large and small-cap growth and value strategies detracted from relative performance. |
| Performance Past Does Not Indicate Future [Text] |
|
|
Figures quoted represent past performance, which is no guarantee of future results,
|
| Line Graph [Table Text Block] |
|
|

Table Summary
|
Class C with Load |
Spectrum Growth Blended Index |
Bloomberg U.S. Aggregate Bond Index |
Russell 3000® Index |
4/30/2016 |
$10,000 |
$10,000 |
$10,000 |
$10,000 |
5/31/2016 |
$10,106 |
$10,060 |
$10,003 |
$10,179 |
6/30/2016 |
$9,977 |
$10,071 |
$10,182 |
$10,200 |
7/31/2016 |
$10,355 |
$10,427 |
$10,247 |
$10,605 |
8/31/2016 |
$10,423 |
$10,455 |
$10,235 |
$10,632 |
9/30/2016 |
$10,491 |
$10,494 |
$10,229 |
$10,648 |
10/31/2016 |
$10,302 |
$10,315 |
$10,151 |
$10,418 |
11/30/2016 |
$10,513 |
$10,467 |
$9,911 |
$10,884 |
12/31/2016 |
$10,632 |
$10,649 |
$9,925 |
$11,097 |
1/31/2017 |
$10,862 |
$10,856 |
$9,944 |
$11,305 |
2/28/2017 |
$11,083 |
$11,138 |
$10,011 |
$11,726 |
3/31/2017 |
$11,186 |
$11,209 |
$10,006 |
$11,734 |
4/30/2017 |
$11,360 |
$11,350 |
$10,083 |
$11,858 |
5/31/2017 |
$11,526 |
$11,521 |
$10,160 |
$11,980 |
6/30/2017 |
$11,652 |
$11,586 |
$10,150 |
$12,088 |
7/31/2017 |
$11,881 |
$11,821 |
$10,194 |
$12,316 |
8/31/2017 |
$11,850 |
$11,869 |
$10,285 |
$12,339 |
9/30/2017 |
$12,126 |
$12,073 |
$10,236 |
$12,640 |
10/31/2017 |
$12,292 |
$12,277 |
$10,242 |
$12,916 |
11/30/2017 |
$12,506 |
$12,506 |
$10,229 |
$13,308 |
12/31/2017 |
$12,633 |
$12,655 |
$10,276 |
$13,441 |
1/31/2018 |
$13,182 |
$13,168 |
$10,158 |
$14,150 |
2/28/2018 |
$12,642 |
$12,722 |
$10,061 |
$13,628 |
3/31/2018 |
$12,435 |
$12,542 |
$10,126 |
$13,355 |
4/30/2018 |
$12,444 |
$12,598 |
$10,051 |
$13,406 |
5/31/2018 |
$12,615 |
$12,745 |
$10,122 |
$13,784 |
6/30/2018 |
$12,597 |
$12,731 |
$10,110 |
$13,874 |
7/31/2018 |
$12,894 |
$13,042 |
$10,112 |
$14,335 |
8/31/2018 |
$13,083 |
$13,249 |
$10,177 |
$14,838 |
9/30/2018 |
$13,083 |
$13,259 |
$10,112 |
$14,863 |
10/31/2018 |
$12,210 |
$12,433 |
$10,032 |
$13,768 |
11/30/2018 |
$12,381 |
$12,615 |
$10,092 |
$14,044 |
12/31/2018 |
$11,531 |
$11,867 |
$10,277 |
$12,737 |
1/31/2019 |
$12,325 |
$12,678 |
$10,386 |
$13,830 |
2/28/2019 |
$12,622 |
$12,985 |
$10,380 |
$14,316 |
3/31/2019 |
$12,717 |
$13,160 |
$10,580 |
$14,526 |
4/30/2019 |
$13,024 |
$13,538 |
$10,582 |
$15,106 |
5/31/2019 |
$12,474 |
$12,921 |
$10,770 |
$14,128 |
6/30/2019 |
$13,067 |
$13,649 |
$10,906 |
$15,120 |
7/31/2019 |
$13,109 |
$13,729 |
$10,930 |
$15,345 |
8/31/2019 |
$12,908 |
$13,542 |
$11,213 |
$15,032 |
9/30/2019 |
$13,077 |
$13,744 |
$11,153 |
$15,296 |
10/31/2019 |
$13,289 |
$14,033 |
$11,187 |
$15,625 |
11/30/2019 |
$13,586 |
$14,360 |
$11,181 |
$16,219 |
12/31/2019 |
$13,869 |
$14,739 |
$11,173 |
$16,688 |
1/31/2020 |
$13,795 |
$14,692 |
$11,388 |
$16,669 |
2/29/2020 |
$12,974 |
$13,793 |
$11,593 |
$15,305 |
3/31/2020 |
$12,207 |
$12,235 |
$11,525 |
$13,200 |
4/30/2020 |
$13,273 |
$13,408 |
$11,730 |
$14,948 |
5/31/2020 |
$13,805 |
$13,928 |
$11,784 |
$15,748 |
6/30/2020 |
$14,071 |
$14,275 |
$11,859 |
$16,108 |
7/31/2020 |
$14,604 |
$14,924 |
$12,036 |
$17,022 |
8/31/2020 |
$15,275 |
$15,658 |
$11,939 |
$18,255 |
9/30/2020 |
$14,775 |
$15,245 |
$11,932 |
$17,591 |
10/31/2020 |
$14,551 |
$14,969 |
$11,879 |
$17,211 |
11/30/2020 |
$15,627 |
$16,169 |
$11,995 |
$19,305 |
12/31/2020 |
$16,175 |
$16,681 |
$12,012 |
$20,173 |
1/31/2021 |
$16,175 |
$16,656 |
$11,926 |
$20,084 |
2/28/2021 |
$16,507 |
$16,855 |
$11,753 |
$20,711 |
3/31/2021 |
$16,755 |
$17,101 |
$11,607 |
$21,454 |
4/30/2021 |
$17,324 |
$17,619 |
$11,698 |
$22,560 |
5/31/2021 |
$17,514 |
$17,791 |
$11,737 |
$22,663 |
6/30/2021 |
$17,715 |
$18,014 |
$11,819 |
$23,222 |
7/31/2021 |
$17,846 |
$18,192 |
$11,951 |
$23,614 |
8/31/2021 |
$18,130 |
$18,462 |
$11,929 |
$24,288 |
9/30/2021 |
$17,680 |
$17,989 |
$11,825 |
$23,198 |
10/31/2021 |
$18,320 |
$18,572 |
$11,822 |
$24,767 |
11/30/2021 |
$18,023 |
$18,321 |
$11,857 |
$24,390 |
12/31/2021 |
$18,496 |
$18,788 |
$11,827 |
$25,350 |
1/31/2022 |
$17,769 |
$18,042 |
$11,572 |
$23,859 |
2/28/2022 |
$17,271 |
$17,768 |
$11,443 |
$23,258 |
3/31/2022 |
$17,177 |
$17,861 |
$11,125 |
$24,012 |
4/30/2022 |
$16,249 |
$16,785 |
$10,703 |
$21,857 |
5/31/2022 |
$16,370 |
$16,795 |
$10,772 |
$21,828 |
6/30/2022 |
$15,254 |
$15,713 |
$10,603 |
$20,002 |
7/31/2022 |
$16,007 |
$16,680 |
$10,862 |
$21,878 |
8/31/2022 |
$15,496 |
$16,151 |
$10,555 |
$21,062 |
9/30/2022 |
$14,474 |
$14,933 |
$10,099 |
$19,109 |
10/31/2022 |
$15,025 |
$15,555 |
$9,968 |
$20,676 |
11/30/2022 |
$15,792 |
$16,358 |
$10,335 |
$21,755 |
12/31/2022 |
$15,282 |
$15,903 |
$10,288 |
$20,481 |
1/31/2023 |
$16,058 |
$16,761 |
$10,604 |
$21,892 |
2/28/2023 |
$15,584 |
$16,377 |
$10,330 |
$21,380 |
3/31/2023 |
$15,886 |
$16,775 |
$10,593 |
$21,952 |
4/30/2023 |
$15,986 |
$16,936 |
$10,657 |
$22,186 |
5/31/2023 |
$15,843 |
$16,779 |
$10,541 |
$22,272 |
6/30/2023 |
$16,475 |
$17,387 |
$10,503 |
$23,793 |
7/31/2023 |
$16,862 |
$17,792 |
$10,496 |
$24,646 |
8/31/2023 |
$16,590 |
$17,487 |
$10,429 |
$24,170 |
9/30/2023 |
$16,029 |
$16,919 |
$10,164 |
$23,019 |
10/31/2023 |
$15,613 |
$16,534 |
$10,003 |
$22,408 |
11/30/2023 |
$16,633 |
$17,684 |
$10,456 |
$24,498 |
12/31/2023 |
$17,395 |
$18,470 |
$10,857 |
$25,797 |
1/31/2024 |
$17,366 |
$18,518 |
$10,827 |
$26,083 |
2/29/2024 |
$17,870 |
$18,940 |
$10,674 |
$27,495 |
3/31/2024 |
$18,345 |
$19,364 |
$10,773 |
$28,382 |
4/30/2024 |
$17,683 |
$18,818 |
$10,500 |
$27,133 |
5/31/2024 |
$18,303 |
$19,390 |
$10,678 |
$28,415 |
6/30/2024 |
$18,598 |
$19,702 |
$10,780 |
$29,295 |
7/31/2024 |
$18,878 |
$20,098 |
$11,031 |
$29,839 |
8/31/2024 |
$19,247 |
$20,481 |
$11,190 |
$30,489 |
9/30/2024 |
$19,557 |
$20,875 |
$11,340 |
$31,120 |
10/31/2024 |
$19,129 |
$20,493 |
$11,058 |
$30,891 |
11/30/2024 |
$19,853 |
$21,086 |
$11,175 |
$32,946 |
12/31/2024 |
$19,327 |
$20,648 |
$10,992 |
$31,939 |
1/31/2025 |
$19,707 |
$21,144 |
$11,051 |
$32,947 |
2/28/2025 |
$19,786 |
$21,185 |
$11,294 |
$32,316 |
3/31/2025 |
$19,233 |
$20,671 |
$11,298 |
$30,431 |
4/30/2025 |
$19,470 |
$20,758 |
$11,343 |
$30,227 |
5/31/2025 |
$20,054 |
$21,455 |
$11,261 |
$32,143 |
6/30/2025 |
$20,702 |
$22,149 |
$11,435 |
$33,776 |
7/31/2025 |
$20,797 |
$22,341 |
$11,404 |
$34,520 |
8/31/2025 |
$21,303 |
$22,806 |
$11,541 |
$35,318 |
9/30/2025 |
$21,998 |
$23,386 |
$11,667 |
$36,537 |
10/31/2025 |
$22,362 |
$23,742 |
$11,740 |
$37,320 |
11/30/2025 |
$22,393 |
$23,811 |
$11,813 |
$37,423 |
12/31/2025 |
$22,437 |
$23,937 |
$11,795 |
$37,415 |
1/31/2026 |
$23,231 |
$24,396 |
$11,808 |
$37,996 |
2/28/2026 |
$24,060 |
$24,690 |
$12,001 |
$37,815 |
3/31/2026 |
$23,024 |
$23,494 |
$11,789 |
$35,935 |
4/30/2026 |
$24,060 |
$25,060 |
$11,803 |
$39,601 |
|
| Average Annual Return [Table Text Block] |
|
|
Table Summary
AATR |
1 Year |
5 Years |
10 Years |
Class CFootnote Reference* |
22.66 |
6.46 |
9.18 |
Class C with LoadFootnote Reference* |
21.66 |
6.46 |
9.18 |
Spectrum Growth Blended IndexFootnote Reference† |
20.72 |
7.30 |
9.62 |
Bloomberg U.S. Aggregate Bond Index |
4.06 |
0.18 |
1.67 |
Russell 3000® Index |
31.01 |
11.91 |
14.75 | |
| No Deduction of Taxes [Text Block] |
|
|
do not reflect taxes that a shareholder may pay on an investment in a fund.
|
| AssetsNet |
|
|
$ 206,490,008
|
| Holdings Count | Holding |
|
|
37
|
| Advisory Fees Paid, Amount |
|
|
$ 364,887
|
| InvestmentCompanyPortfolioTurnover |
|
|
52.00%
|
| Additional Fund Statistics [Text Block] |
|
|
Table Summary
Total net assets |
$206,490,008 |
# of portfolio holdings |
37 |
Portfolio turnover rate |
52% |
Total advisory fees paid |
$364,887 | |
| Holdings [Text Block] |
|
|
ALLOCATION (% OF TOTAL INVESTMENTS)
Table Summary
Fund |
Effective AllocationFootnote Reference1 |
Stocks |
62.8 |
Bonds |
20.9 |
Inflation sensitive investments |
13.6 |
Alternative investments |
2.7 |
| Footnote |
Description |
Footnote1 |
Effective allocation is subject to change and may have changed since the date specified. Effective allocation excludes cash, and percent totals may not add to 100% due to rounding. | |
| Largest Holdings [Text Block] |
|
|
TOP TEN HOLDINGS (% OF NET ASSETS)
Table Summary
Allspring Disciplined Large Cap Portfolio |
19.7 |
Allspring Real Return Portfolio |
13.0 |
Allspring Disciplined International Developed Markets Portfolio |
6.6 |
Allspring Diversified Income Builder Fund Class R6 |
5.9 |
iShares Core MSCI Emerging Markets ETF |
4.8 |
iShares Core MSCI EAFE ETF |
4.8 |
Allspring Special Large Value ETF |
4.3 |
iShares Core S&P 500 ETF |
3.7 |
Allspring Core Plus ETF |
3.6 |
Allspring Income Plus ETF |
3.6 | |
| Material Fund Change [Text Block] |
|
|
|
| C000205239 |
|
|
|
| Shareholder Report [Line Items] |
|
|
|
| Fund Name |
|
|
Spectrum Growth Fund
|
| Class Name |
|
|
Institutional Class
|
| Trading Symbol |
|
|
WGAYX
|
| Annual or Semi-Annual Statement [Text Block] |
|
|
This annual shareholder report contains important information about Spectrum Growth Fund for the period from May 1, 2025 to April 30, 2026.
|
| Additional Information [Text Block] |
|
|
You can find additional information about the Fund at allspringglobal.com. You can also request this information by contacting us at 1-800-222-8222.
|
| Additional Information Phone Number |
|
|
<span style="white-space: nowrap; box-sizing: border-box; color: rgb(0, 0, 0); display: inline; flex-wrap: nowrap; font-size: 12px; font-weight: 400; grid-area: auto; line-height: 18px; margin: 0px; overflow: visible; text-align: left; text-align-last: auto;"> 1-800-222-8222.</span>
|
| Additional Information Website |
|
|
<span style="box-sizing: border-box; color: rgb(0, 0, 0); display: inline; flex-wrap: nowrap; font-size: 12px; font-weight: 400; grid-area: auto; line-height: 18px; margin: 0px; overflow: visible; text-align: left; text-align-last: auto; white-space-collapse: preserve-breaks;">allspringglobal.com</span>
|
| Expenses [Text Block] |
|
|
What were the Fund costs for the past year?The table explains the costs you would have paid within the reporting period based on a hypothetical $10,000 investment.
Table Summary
CLASS NAME |
COSTS OF A $10,000 INVESTMENT |
COSTS PAID AS A % OF A $10,000 INVESTMENT |
Institutional Class |
$45 |
0.40% | The manager has contractually committed to waive fees and/or reimburse certain expenses to the extent necessary to cap the Fund's total annual fund operating expense ratio at a specific amount. Without this cap, the costs shown above may have been higher. Please see the prospectus for the amount and the expiration date of the cap. Prior to or after the commitment expiration date, the cap may be increased or the commitment to maintain the cap may be terminated only with the approval of the Board of Trustees. |
| Expenses Paid, Amount |
|
|
$ 45
|
| Expense Ratio, Percent |
|
|
0.40%
|
| Factors Affecting Performance [Text Block] |
|
|
How did the Fund perform last year and what affected its performance?The past year saw a wide set of narratives drive the economy and financial markets. From an initial focus on the impact of tariffs, markets swiftly moved onto the opportunities within artificial intelligence (AI) followed by a U.S. government shutdown. While narratives shifted, domestic growth remained above trend, supported initially by AI-driven capital expenditures and resilient consumer spending. Outside the U.S., investment opportunities were divergent. Globally, expectations for earnings growth remain concentrated on a single theme: AI. There were limited portfolio changes over the past 12 months. In fixed income, we reduced U.S. Treasury bond exposure and added to our U.S. core bond allocation. Security selection added to performance in our inflation-protected, alternative risk premia, and developed international equity strategies. Underperformance from active large and small-cap growth and value strategies detracted from relative performance. |
| Performance Past Does Not Indicate Future [Text] |
|
|
Figures quoted represent past performance, which is no guarantee of future results,
|
| Line Graph [Table Text Block] |
|
|
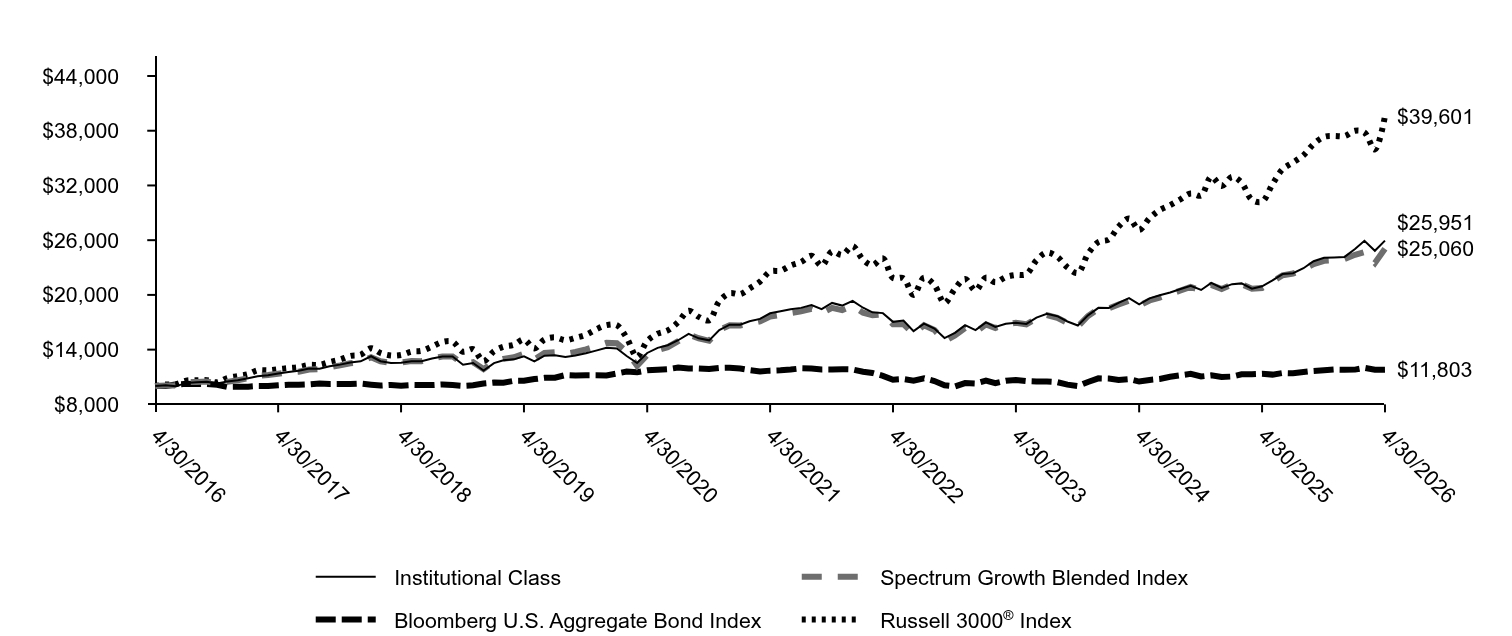
Table Summary
|
Institutional Class |
Spectrum Growth Blended Index |
Bloomberg U.S. Aggregate Bond Index |
Russell 3000® Index |
4/30/2016 |
$10,000 |
$10,000 |
$10,000 |
$10,000 |
5/31/2016 |
$10,106 |
$10,060 |
$10,003 |
$10,179 |
6/30/2016 |
$9,977 |
$10,071 |
$10,182 |
$10,200 |
7/31/2016 |
$10,355 |
$10,427 |
$10,247 |
$10,605 |
8/31/2016 |
$10,423 |
$10,455 |
$10,235 |
$10,632 |
9/30/2016 |
$10,491 |
$10,494 |
$10,229 |
$10,648 |
10/31/2016 |
$10,302 |
$10,315 |
$10,151 |
$10,418 |
11/30/2016 |
$10,513 |
$10,467 |
$9,911 |
$10,884 |
12/31/2016 |
$10,632 |
$10,649 |
$9,925 |
$11,097 |
1/31/2017 |
$10,862 |
$10,856 |
$9,944 |
$11,305 |
2/28/2017 |
$11,083 |
$11,138 |
$10,011 |
$11,726 |
3/31/2017 |
$11,194 |
$11,209 |
$10,006 |
$11,734 |
4/30/2017 |
$11,375 |
$11,350 |
$10,083 |
$11,858 |
5/31/2017 |
$11,541 |
$11,521 |
$10,160 |
$11,980 |
6/30/2017 |
$11,676 |
$11,586 |
$10,150 |
$12,088 |
7/31/2017 |
$11,921 |
$11,821 |
$10,194 |
$12,316 |
8/31/2017 |
$11,897 |
$11,869 |
$10,285 |
$12,339 |
9/30/2017 |
$12,182 |
$12,073 |
$10,236 |
$12,640 |
10/31/2017 |
$12,356 |
$12,277 |
$10,242 |
$12,916 |
11/30/2017 |
$12,577 |
$12,506 |
$10,229 |
$13,308 |
12/31/2017 |
$12,715 |
$12,655 |
$10,276 |
$13,441 |
1/31/2018 |
$13,275 |
$13,168 |
$10,158 |
$14,150 |
2/28/2018 |
$12,734 |
$12,722 |
$10,061 |
$13,628 |
3/31/2018 |
$12,532 |
$12,542 |
$10,126 |
$13,355 |
4/30/2018 |
$12,559 |
$12,598 |
$10,051 |
$13,406 |
5/31/2018 |
$12,734 |
$12,745 |
$10,122 |
$13,784 |
6/30/2018 |
$12,724 |
$12,731 |
$10,110 |
$13,874 |
7/31/2018 |
$13,027 |
$13,042 |
$10,112 |
$14,335 |
8/31/2018 |
$13,238 |
$13,249 |
$10,177 |
$14,838 |
9/30/2018 |
$13,247 |
$13,259 |
$10,112 |
$14,863 |
10/31/2018 |
$12,348 |
$12,433 |
$10,032 |
$13,768 |
11/30/2018 |
$12,532 |
$12,615 |
$10,092 |
$14,044 |
12/31/2018 |
$11,706 |
$11,867 |
$10,277 |
$12,737 |
1/31/2019 |
$12,518 |
$12,678 |
$10,386 |
$13,830 |
2/28/2019 |
$12,826 |
$12,985 |
$10,380 |
$14,316 |
3/31/2019 |
$12,935 |
$13,160 |
$10,580 |
$14,526 |
4/30/2019 |
$13,265 |
$13,538 |
$10,582 |
$15,106 |
5/31/2019 |
$12,705 |
$12,921 |
$10,770 |
$14,128 |
6/30/2019 |
$13,331 |
$13,649 |
$10,906 |
$15,120 |
7/31/2019 |
$13,386 |
$13,729 |
$10,930 |
$15,345 |
8/31/2019 |
$13,188 |
$13,542 |
$11,213 |
$15,032 |
9/30/2019 |
$13,364 |
$13,744 |
$11,153 |
$15,296 |
10/31/2019 |
$13,594 |
$14,033 |
$11,187 |
$15,625 |
11/30/2019 |
$13,891 |
$14,360 |
$11,181 |
$16,219 |
12/31/2019 |
$14,193 |
$14,739 |
$11,173 |
$16,688 |
1/31/2020 |
$14,126 |
$14,692 |
$11,388 |
$16,669 |
2/29/2020 |
$13,299 |
$13,793 |
$11,593 |
$15,305 |
3/31/2020 |
$12,528 |
$12,235 |
$11,525 |
$13,200 |
4/30/2020 |
$13,634 |
$13,408 |
$11,730 |
$14,948 |
5/31/2020 |
$14,193 |
$13,928 |
$11,784 |
$15,748 |
6/30/2020 |
$14,483 |
$14,275 |
$11,859 |
$16,108 |
7/31/2020 |
$15,031 |
$14,924 |
$12,036 |
$17,022 |
8/31/2020 |
$15,735 |
$15,658 |
$11,939 |
$18,255 |
9/30/2020 |
$15,243 |
$15,245 |
$11,932 |
$17,591 |
10/31/2020 |
$15,020 |
$14,969 |
$11,879 |
$17,211 |
11/30/2020 |
$16,148 |
$16,169 |
$11,995 |
$19,305 |
12/31/2020 |
$16,741 |
$16,681 |
$12,012 |
$20,173 |
1/31/2021 |
$16,741 |
$16,656 |
$11,926 |
$20,084 |
2/28/2021 |
$17,106 |
$16,855 |
$11,753 |
$20,711 |
3/31/2021 |
$17,371 |
$17,101 |
$11,607 |
$21,454 |
4/30/2021 |
$17,988 |
$17,619 |
$11,698 |
$22,560 |
5/31/2021 |
$18,202 |
$17,791 |
$11,737 |
$22,663 |
6/30/2021 |
$18,416 |
$18,014 |
$11,819 |
$23,222 |
7/31/2021 |
$18,579 |
$18,192 |
$11,951 |
$23,614 |
8/31/2021 |
$18,881 |
$18,462 |
$11,929 |
$24,288 |
9/30/2021 |
$18,441 |
$17,989 |
$11,825 |
$23,198 |
10/31/2021 |
$19,120 |
$18,572 |
$11,822 |
$24,767 |
11/30/2021 |
$18,831 |
$18,321 |
$11,857 |
$24,390 |
12/31/2021 |
$19,350 |
$18,788 |
$11,827 |
$25,350 |
1/31/2022 |
$18,596 |
$18,042 |
$11,572 |
$23,859 |
2/28/2022 |
$18,089 |
$17,768 |
$11,443 |
$23,258 |
3/31/2022 |
$18,003 |
$17,861 |
$11,125 |
$24,012 |
4/30/2022 |
$17,047 |
$16,785 |
$10,703 |
$21,857 |
5/31/2022 |
$17,192 |
$16,795 |
$10,772 |
$21,828 |
6/30/2022 |
$16,033 |
$15,713 |
$10,603 |
$20,002 |
7/31/2022 |
$16,844 |
$16,680 |
$10,862 |
$21,878 |
8/31/2022 |
$16,308 |
$16,151 |
$10,555 |
$21,062 |
9/30/2022 |
$15,265 |
$14,933 |
$10,099 |
$19,109 |
10/31/2022 |
$15,845 |
$15,555 |
$9,968 |
$20,676 |
11/30/2022 |
$16,685 |
$16,358 |
$10,335 |
$21,755 |
12/31/2022 |
$16,143 |
$15,903 |
$10,288 |
$20,481 |
1/31/2023 |
$16,990 |
$16,761 |
$10,604 |
$21,892 |
2/28/2023 |
$16,488 |
$16,377 |
$10,330 |
$21,380 |
3/31/2023 |
$16,834 |
$16,775 |
$10,593 |
$21,952 |
4/30/2023 |
$16,943 |
$16,936 |
$10,657 |
$22,186 |
5/31/2023 |
$16,818 |
$16,779 |
$10,541 |
$22,272 |
6/30/2023 |
$17,508 |
$17,387 |
$10,503 |
$23,793 |
7/31/2023 |
$17,932 |
$17,792 |
$10,496 |
$24,646 |
8/31/2023 |
$17,665 |
$17,487 |
$10,429 |
$24,170 |
9/30/2023 |
$17,085 |
$16,919 |
$10,164 |
$23,019 |
10/31/2023 |
$16,645 |
$16,534 |
$10,003 |
$22,408 |
11/30/2023 |
$17,759 |
$17,684 |
$10,456 |
$24,498 |
12/31/2023 |
$18,582 |
$18,470 |
$10,857 |
$25,797 |
1/31/2024 |
$18,566 |
$18,518 |
$10,827 |
$26,083 |
2/29/2024 |
$19,119 |
$18,940 |
$10,674 |
$27,495 |
3/31/2024 |
$19,656 |
$19,364 |
$10,773 |
$28,382 |
4/30/2024 |
$18,961 |
$18,818 |
$10,500 |
$27,133 |
5/31/2024 |
$19,625 |
$19,390 |
$10,678 |
$28,415 |
6/30/2024 |
$19,956 |
$19,702 |
$10,780 |
$29,295 |
7/31/2024 |
$20,257 |
$20,098 |
$11,031 |
$29,839 |
8/31/2024 |
$20,652 |
$20,481 |
$11,190 |
$30,489 |
9/30/2024 |
$20,999 |
$20,875 |
$11,340 |
$31,120 |
10/31/2024 |
$20,541 |
$20,493 |
$11,058 |
$30,891 |
11/30/2024 |
$21,315 |
$21,086 |
$11,175 |
$32,946 |
12/31/2024 |
$20,771 |
$20,648 |
$10,992 |
$31,939 |
1/31/2025 |
$21,179 |
$21,144 |
$11,051 |
$32,947 |
2/28/2025 |
$21,263 |
$21,185 |
$11,294 |
$32,316 |
3/31/2025 |
$20,686 |
$20,671 |
$11,298 |
$30,431 |
4/30/2025 |
$20,941 |
$20,758 |
$11,343 |
$30,227 |
5/31/2025 |
$21,586 |
$21,455 |
$11,261 |
$32,143 |
6/30/2025 |
$22,282 |
$22,149 |
$11,435 |
$33,776 |
7/31/2025 |
$22,383 |
$22,341 |
$11,404 |
$34,520 |
8/31/2025 |
$22,926 |
$22,806 |
$11,541 |
$35,318 |
9/30/2025 |
$23,690 |
$23,386 |
$11,667 |
$36,537 |
10/31/2025 |
$24,080 |
$23,742 |
$11,740 |
$37,320 |
11/30/2025 |
$24,114 |
$23,811 |
$11,813 |
$37,423 |
12/31/2025 |
$24,165 |
$23,937 |
$11,795 |
$37,415 |
1/31/2026 |
$25,039 |
$24,396 |
$11,808 |
$37,996 |
2/28/2026 |
$25,932 |
$24,690 |
$12,001 |
$37,815 |
3/31/2026 |
$24,835 |
$23,494 |
$11,789 |
$35,935 |
4/30/2026 |
$25,951 |
$25,060 |
$11,803 |
$39,601 |
|
| Average Annual Return [Table Text Block] |
|
|
Table Summary
AATR |
1 Year |
5 Years |
10 Years |
Institutional ClassFootnote Reference* |
23.92 |
7.61 |
10.01 |
Spectrum Growth Blended IndexFootnote Reference† |
20.72 |
7.30 |
9.62 |
Bloomberg U.S. Aggregate Bond Index |
4.06 |
0.18 |
1.67 |
Russell 3000® Index |
31.01 |
11.91 |
14.75 | |
| No Deduction of Taxes [Text Block] |
|
|
do not reflect taxes that a shareholder may pay on an investment in a fund.
|
| AssetsNet |
|
|
$ 206,490,008
|
| Holdings Count | Holding |
|
|
37
|
| Advisory Fees Paid, Amount |
|
|
$ 364,887
|
| InvestmentCompanyPortfolioTurnover |
|
|
52.00%
|
| Additional Fund Statistics [Text Block] |
|
|
Table Summary
Total net assets |
$206,490,008 |
# of portfolio holdings |
37 |
Portfolio turnover rate |
52% |
Total advisory fees paid |
$364,887 | |
| Holdings [Text Block] |
|
|
ALLOCATION (% OF TOTAL INVESTMENTS)
Table Summary
Fund |
Effective AllocationFootnote Reference1 |
Stocks |
62.8 |
Bonds |
20.9 |
Inflation sensitive investments |
13.6 |
Alternative investments |
2.7 |
| Footnote |
Description |
Footnote1 |
Effective allocation is subject to change and may have changed since the date specified. Effective allocation excludes cash, and percent totals may not add to 100% due to rounding. | |
| Largest Holdings [Text Block] |
|
|
TOP TEN HOLDINGS (% OF NET ASSETS)
Table Summary
Allspring Disciplined Large Cap Portfolio |
19.7 |
Allspring Real Return Portfolio |
13.0 |
Allspring Disciplined International Developed Markets Portfolio |
6.6 |
Allspring Diversified Income Builder Fund Class R6 |
5.9 |
iShares Core MSCI Emerging Markets ETF |
4.8 |
iShares Core MSCI EAFE ETF |
4.8 |
Allspring Special Large Value ETF |
4.3 |
iShares Core S&P 500 ETF |
3.7 |
Allspring Core Plus ETF |
3.6 |
Allspring Income Plus ETF |
3.6 | |
| Material Fund Change [Text Block] |
|
|
|
| C000176116 |
|
|
|
| Shareholder Report [Line Items] |
|
|
|
| Fund Name |
|
|
Spectrum Income Allocation Fund
|
| Class Name |
|
|
Class A
|
| Trading Symbol |
|
|
WCAFX
|
| Annual or Semi-Annual Statement [Text Block] |
|
|
This annual shareholder report contains important information about Spectrum Income Allocation Fund for the period from May 1, 2025 to April 30, 2026.
|
| Additional Information [Text Block] |
|
|
You can find additional information about the Fund at allspringglobal.com. You can also request this information by contacting us at 1-800-222-8222.
|
| Additional Information Phone Number |
|
|
<span style="white-space: nowrap; box-sizing: border-box; color: rgb(0, 0, 0); display: inline; flex-wrap: nowrap; font-size: 12px; font-weight: 400; grid-area: auto; line-height: 18px; margin: 0px; overflow: visible; text-align: left; text-align-last: auto;"> 1-800-222-8222.</span>
|
| Additional Information Website |
|
|
<span style="box-sizing: border-box; color: rgb(0, 0, 0); display: inline; flex-wrap: nowrap; font-size: 12px; font-weight: 400; grid-area: auto; line-height: 18px; margin: 0px; overflow: visible; text-align: left; text-align-last: auto; white-space-collapse: preserve-breaks;">allspringglobal.com</span>
|
| Expenses [Text Block] |
|
|
What were the Fund costs for the past year?The table explains the costs you would have paid within the reporting period based on a hypothetical $10,000 investment.
Table Summary
CLASS NAME |
COSTS OF A $10,000 INVESTMENT |
COSTS PAID AS A % OF A $10,000 INVESTMENT |
Class A |
$76 |
0.72% | The manager has contractually committed to waive fees and/or reimburse certain expenses to the extent necessary to cap the Fund's total annual fund operating expense ratio at a specific amount. Without this cap, the costs shown above may have been higher. Please see the prospectus for the amount and the expiration date of the cap. Prior to or after the commitment expiration date, the cap may be increased or the commitment to maintain the cap may be terminated only with the approval of the Board of Trustees. |
| Expenses Paid, Amount |
|
|
$ 76
|
| Expense Ratio, Percent |
|
|
0.72%
|
| Factors Affecting Performance [Text Block] |
|
|
How did the Fund perform last year and what affected its performance?The past year saw a wide set of narratives drive the economy and financial markets. From an initial focus on the impact of tariffs, markets swiftly moved onto the opportunities within artificial intelligence (AI) followed by a U.S. government shutdown. While narratives shifted, domestic growth remained above trend, supported initially by AI-driven capital expenditures and resilient consumer spending. Outside the U.S., investment opportunities were divergent. Globally, expectations for earnings growth remain concentrated on a single theme: AI. There were limited portfolio changes over the past 12 months. In fixed income, we reduced U.S. Treasury bond exposure and added to our U.S. core bond allocation. Security selection added to performance in our inflation-protected, alternative risk premia, and developed international equity strategies. |
| Performance Past Does Not Indicate Future [Text] |
|
|
Figures quoted represent past performance, which is no guarantee of future results,
|
| Line Graph [Table Text Block] |
|
|
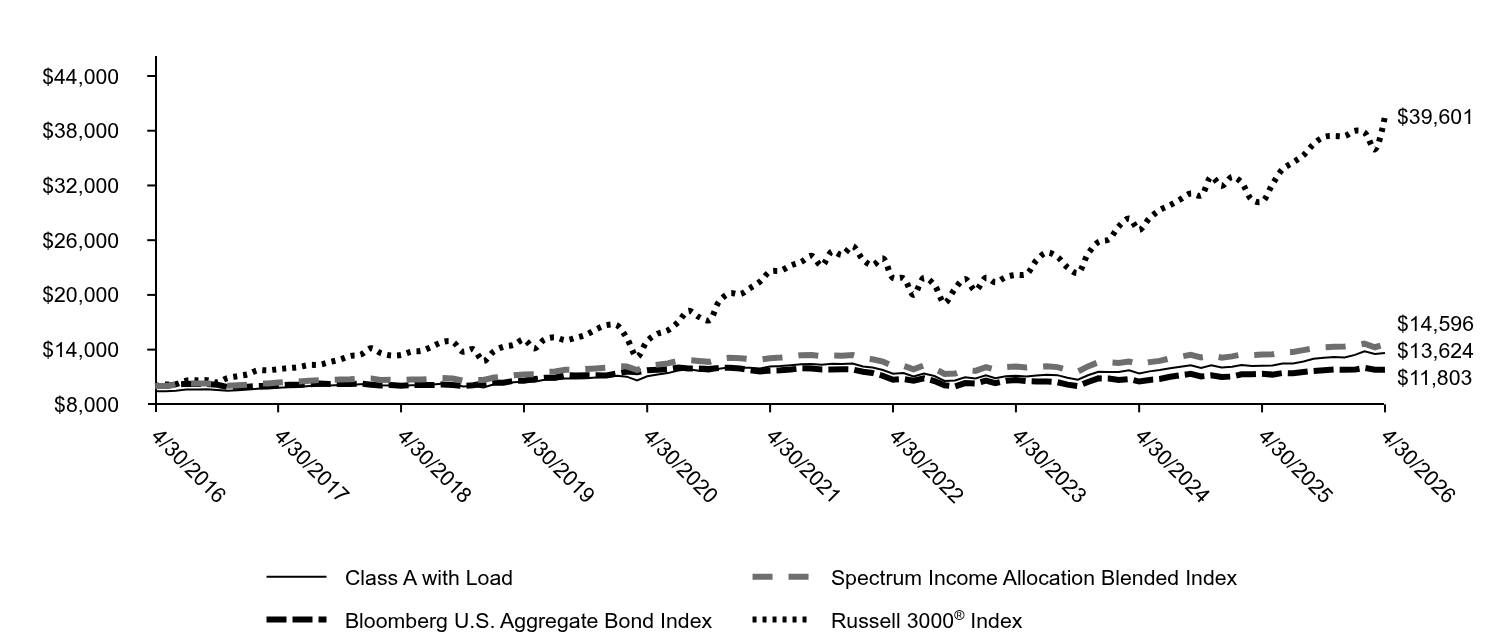
Table Summary
|
Class A with Load |
Spectrum Income Allocation Blended Index |
Bloomberg U.S. Aggregate Bond Index |
Russell 3000® Index |
4/30/2016 |
$9,425 |
$10,000 |
$10,000 |
$10,000 |
5/31/2016 |
$9,438 |
$10,017 |
$10,003 |
$10,179 |
6/30/2016 |
$9,497 |
$10,155 |
$10,182 |
$10,200 |
7/31/2016 |
$9,631 |
$10,293 |
$10,247 |
$10,605 |
8/31/2016 |
$9,642 |
$10,291 |
$10,235 |
$10,632 |
9/30/2016 |
$9,664 |
$10,296 |
$10,229 |
$10,648 |
10/31/2016 |
$9,571 |
$10,193 |
$10,151 |
$10,418 |
11/30/2016 |
$9,499 |
$10,050 |
$9,911 |
$10,884 |
12/31/2016 |
$9,546 |
$10,104 |
$9,925 |
$11,097 |
1/31/2017 |
$9,623 |
$10,168 |
$9,944 |
$11,305 |
2/28/2017 |
$9,719 |
$10,285 |
$10,011 |
$11,726 |
3/31/2017 |
$9,727 |
$10,297 |
$10,006 |
$11,734 |
4/30/2017 |
$9,811 |
$10,389 |
$10,083 |
$11,858 |
5/31/2017 |
$9,887 |
$10,489 |
$10,160 |
$11,980 |
6/30/2017 |
$9,910 |
$10,495 |
$10,150 |
$12,088 |
7/31/2017 |
$10,003 |
$10,582 |
$10,194 |
$12,316 |
8/31/2017 |
$10,030 |
$10,664 |
$10,285 |
$12,339 |
9/30/2017 |
$10,077 |
$10,672 |
$10,236 |
$12,640 |
10/31/2017 |
$10,112 |
$10,722 |
$10,242 |
$12,916 |
11/30/2017 |
$10,160 |
$10,762 |
$10,229 |
$13,308 |
12/31/2017 |
$10,214 |
$10,831 |
$10,276 |
$13,441 |
1/31/2018 |
$10,293 |
$10,847 |
$10,158 |
$14,150 |
2/28/2018 |
$10,104 |
$10,678 |
$10,061 |
$13,628 |
3/31/2018 |
$10,058 |
$10,691 |
$10,126 |
$13,355 |
4/30/2018 |
$10,021 |
$10,644 |
$10,051 |
$13,406 |
5/31/2018 |
$10,089 |
$10,732 |
$10,122 |
$13,784 |
6/30/2018 |
$10,089 |
$10,719 |
$10,110 |
$13,874 |
7/31/2018 |
$10,189 |
$10,786 |
$10,112 |
$14,335 |
8/31/2018 |
$10,271 |
$10,881 |
$10,177 |
$14,838 |
9/30/2018 |
$10,250 |
$10,831 |
$10,112 |
$14,863 |
10/31/2018 |
$9,965 |
$10,598 |
$10,032 |
$13,768 |
11/30/2018 |
$10,021 |
$10,684 |
$10,092 |
$14,044 |
12/31/2018 |
$9,852 |
$10,673 |
$10,277 |
$12,737 |
1/31/2019 |
$10,203 |
$10,940 |
$10,386 |
$13,830 |
2/28/2019 |
$10,302 |
$11,002 |
$10,380 |
$14,316 |
3/31/2019 |
$10,427 |
$11,197 |
$10,580 |
$14,526 |
4/30/2019 |
$10,507 |
$11,280 |
$10,582 |
$15,106 |
5/31/2019 |
$10,476 |
$11,301 |
$10,770 |
$14,128 |
6/30/2019 |
$10,701 |
$11,567 |
$10,906 |
$15,120 |
7/31/2019 |
$10,733 |
$11,603 |
$10,930 |
$15,345 |
8/31/2019 |
$10,829 |
$11,789 |
$11,213 |
$15,032 |
9/30/2019 |
$10,832 |
$11,786 |
$11,153 |
$15,296 |
10/31/2019 |
$10,873 |
$11,874 |
$11,187 |
$15,625 |
11/30/2019 |
$10,947 |
$11,939 |
$11,181 |
$16,219 |
12/31/2019 |
$10,992 |
$12,012 |
$11,173 |
$16,688 |
1/31/2020 |
$11,133 |
$12,175 |
$11,388 |
$16,669 |
2/29/2020 |
$11,035 |
$12,153 |
$11,593 |
$15,305 |
3/31/2020 |
$10,634 |
$11,757 |
$11,525 |
$13,200 |
4/30/2020 |
$11,078 |
$12,195 |
$11,730 |
$14,948 |
5/31/2020 |
$11,285 |
$12,356 |
$11,784 |
$15,748 |
6/30/2020 |
$11,426 |
$12,491 |
$11,859 |
$16,108 |
7/31/2020 |
$11,719 |
$12,773 |
$12,036 |
$17,022 |
8/31/2020 |
$11,835 |
$12,853 |
$11,939 |
$18,255 |
9/30/2020 |
$11,681 |
$12,763 |
$11,932 |
$17,591 |
10/31/2020 |
$11,617 |
$12,662 |
$11,879 |
$17,211 |
11/30/2020 |
$11,901 |
$12,992 |
$11,995 |
$19,305 |
12/31/2020 |
$12,056 |
$13,118 |
$12,012 |
$20,173 |
1/31/2021 |
$12,021 |
$13,066 |
$11,926 |
$20,084 |
2/28/2021 |
$12,010 |
$12,965 |
$11,753 |
$20,711 |
3/31/2021 |
$11,940 |
$12,898 |
$11,607 |
$21,454 |
4/30/2021 |
$12,138 |
$13,062 |
$11,698 |
$22,560 |
5/31/2021 |
$12,196 |
$13,127 |
$11,737 |
$22,663 |
6/30/2021 |
$12,293 |
$13,242 |
$11,819 |
$23,222 |
7/31/2021 |
$12,385 |
$13,390 |
$11,951 |
$23,614 |
8/31/2021 |
$12,419 |
$13,416 |
$11,929 |
$24,288 |
9/30/2021 |
$12,342 |
$13,277 |
$11,825 |
$23,198 |
10/31/2021 |
$12,446 |
$13,358 |
$11,822 |
$24,767 |
11/30/2021 |
$12,413 |
$13,343 |
$11,857 |
$24,390 |
12/31/2021 |
$12,469 |
$13,416 |
$11,827 |
$25,350 |
1/31/2022 |
$12,146 |
$13,076 |
$11,572 |
$23,859 |
2/28/2022 |
$12,034 |
$12,944 |
$11,443 |
$23,258 |
3/31/2022 |
$11,761 |
$12,698 |
$11,125 |
$24,012 |
4/30/2022 |
$11,354 |
$12,186 |
$10,703 |
$21,857 |
5/31/2022 |
$11,430 |
$12,231 |
$10,772 |
$21,828 |
6/30/2022 |
$11,061 |
$11,839 |
$10,603 |
$20,002 |
7/31/2022 |
$11,387 |
$12,276 |
$10,862 |
$21,878 |
8/31/2022 |
$11,111 |
$11,930 |
$10,555 |
$21,062 |
9/30/2022 |
$10,566 |
$11,331 |
$10,099 |
$19,109 |
10/31/2022 |
$10,621 |
$11,373 |
$9,968 |
$20,676 |
11/30/2022 |
$10,969 |
$11,779 |
$10,335 |
$21,755 |
12/31/2022 |
$10,844 |
$11,668 |
$10,288 |
$20,481 |
1/31/2023 |
$11,181 |
$12,076 |
$10,604 |
$21,892 |
2/28/2023 |
$10,870 |
$11,801 |
$10,330 |
$21,380 |
3/31/2023 |
$11,090 |
$12,080 |
$10,593 |
$21,952 |
4/30/2023 |
$11,147 |
$12,162 |
$10,657 |
$22,186 |
5/31/2023 |
$11,051 |
$12,034 |
$10,541 |
$22,272 |
6/30/2023 |
$11,154 |
$12,105 |
$10,503 |
$23,793 |
7/31/2023 |
$11,250 |
$12,172 |
$10,496 |
$24,646 |
8/31/2023 |
$11,202 |
$12,084 |
$10,429 |
$24,170 |
9/30/2023 |
$10,928 |
$11,789 |
$10,164 |
$23,019 |
10/31/2023 |
$10,708 |
$11,601 |
$10,003 |
$22,408 |
11/30/2023 |
$11,190 |
$12,160 |
$10,456 |
$24,498 |
12/31/2023 |
$11,577 |
$12,626 |
$10,857 |
$25,797 |
1/31/2024 |
$11,537 |
$12,612 |
$10,827 |
$26,083 |
2/29/2024 |
$11,547 |
$12,546 |
$10,674 |
$27,495 |
3/31/2024 |
$11,725 |
$12,694 |
$10,773 |
$28,382 |
4/30/2024 |
$11,387 |
$12,399 |
$10,500 |
$27,133 |
5/31/2024 |
$11,617 |
$12,630 |
$10,678 |
$28,415 |
6/30/2024 |
$11,773 |
$12,763 |
$10,780 |
$29,295 |
7/31/2024 |
$11,965 |
$13,042 |
$11,031 |
$29,839 |
8/31/2024 |
$12,132 |
$13,237 |
$11,190 |
$30,489 |
9/30/2024 |
$12,297 |
$13,434 |
$11,340 |
$31,120 |
10/31/2024 |
$12,000 |
$13,156 |
$11,058 |
$30,891 |
11/30/2024 |
$12,284 |
$13,333 |
$11,175 |
$32,946 |
12/31/2024 |
$12,042 |
$13,125 |
$10,992 |
$31,939 |
1/31/2025 |
$12,116 |
$13,259 |
$11,051 |
$32,947 |
2/28/2025 |
$12,326 |
$13,478 |
$11,294 |
$32,316 |
3/31/2025 |
$12,208 |
$13,413 |
$11,298 |
$30,431 |
4/30/2025 |
$12,237 |
$13,457 |
$11,343 |
$30,227 |
5/31/2025 |
$12,262 |
$13,498 |
$11,261 |
$32,143 |
6/30/2025 |
$12,483 |
$13,745 |
$11,435 |
$33,776 |
7/31/2025 |
$12,486 |
$13,752 |
$11,404 |
$34,520 |
8/31/2025 |
$12,703 |
$13,942 |
$11,541 |
$35,318 |
9/30/2025 |
$12,991 |
$14,139 |
$11,667 |
$36,537 |
10/31/2025 |
$13,122 |
$14,253 |
$11,740 |
$37,320 |
11/30/2025 |
$13,179 |
$14,318 |
$11,813 |
$37,423 |
12/31/2025 |
$13,138 |
$14,339 |
$11,795 |
$37,415 |
1/31/2026 |
$13,425 |
$14,449 |
$11,808 |
$37,996 |
2/28/2026 |
$13,827 |
$14,650 |
$12,001 |
$37,815 |
3/31/2026 |
$13,525 |
$14,263 |
$11,789 |
$35,935 |
4/30/2026 |
$13,624 |
$14,596 |
$11,803 |
$39,601 |
|
| Average Annual Return [Table Text Block] |
|
|
Table Summary
AATR |
1 Year |
5 Years |
10 Years |
Class AFootnote Reference* |
11.34 |
2.34 |
3.75 |
Class A with LoadFootnote Reference* |
4.94 |
1.13 |
3.14 |
Spectrum Income Allocation Blended IndexFootnote Reference† |
8.47 |
2.25 |
3.85 |
Bloomberg U.S. Aggregate Bond Index |
4.06 |
0.18 |
1.67 |
Russell 3000® Index |
31.01 |
11.91 |
14.75 | |
| No Deduction of Taxes [Text Block] |
|
|
do not reflect taxes that a shareholder may pay on an investment in a fund.
|
| AssetsNet |
|
|
$ 83,648,540
|
| Holdings Count | Holding |
|
|
29
|
| Advisory Fees Paid, Amount |
|
|
$ 59,422
|
| InvestmentCompanyPortfolioTurnover |
|
|
84.00%
|
| Additional Fund Statistics [Text Block] |
|
|
Table Summary
Total net assets |
$83,648,540 |
# of portfolio holdings |
29 |
Portfolio turnover rate |
84% |
Total advisory fees paid |
$59,422 | |
| Holdings [Text Block] |
|
|
ALLOCATION (% OF TOTAL INVESTMENTS)
Table Summary
Fund |
Effective AllocationFootnote Reference1 |
Bonds |
68.6 |
Inflation sensitive investments |
15.5 |
Stocks |
11.8 |
Alternative investments |
4.1 |
| Footnote |
Description |
Footnote1 |
Effective allocation is subject to change and may have changed since the date specified. Effective allocation excludes cash, and percent totals may not add to 100% due to rounding. | |
| Largest Holdings [Text Block] |
|
|
TOP TEN HOLDINGS (% OF NET ASSETS)
Table Summary
Allspring Real Return Portfolio |
14.8 |
Allspring Broad Market Core Bond ETF |
11.6 |
iShares Core U.S. Aggregate Bond ETF |
11.2 |
Allspring Core Bond Portfolio |
10.5 |
Allspring Core Plus ETF |
10.4 |
Allspring Income Plus ETF |
10.4 |
Allspring High Yield Bond Fund Institutional Class |
6.7 |
Allspring Diversified Income Builder Fund Class R6 |
5.0 |
Allspring Alternative Risk Premia Fund Class R6 |
4.0 |
Allspring Disciplined International Developed Markets Portfolio |
2.5 | |
| Material Fund Change [Text Block] |
|
|
|
| C000176115 |
|
|
|
| Shareholder Report [Line Items] |
|
|
|
| Fund Name |
|
|
Spectrum Income Allocation Fund
|
| Class Name |
|
|
Class C
|
| Trading Symbol |
|
|
WCCFX
|
| Annual or Semi-Annual Statement [Text Block] |
|
|
This annual shareholder report contains important information about Spectrum Income Allocation Fund for the period from May 1, 2025 to April 30, 2026.
|
| Additional Information [Text Block] |
|
|
You can find additional information about the Fund at allspringglobal.com. You can also request this information by contacting us at 1-800-222-8222.
|
| Additional Information Phone Number |
|
|
<span style="white-space: nowrap; box-sizing: border-box; color: rgb(0, 0, 0); display: inline; flex-wrap: nowrap; font-size: 12px; font-weight: 400; grid-area: auto; line-height: 18px; margin: 0px; overflow: visible; text-align: left; text-align-last: auto;"> 1-800-222-8222.</span>
|
| Additional Information Website |
|
|
<span style="box-sizing: border-box; color: rgb(0, 0, 0); display: inline; flex-wrap: nowrap; font-size: 12px; font-weight: 400; grid-area: auto; line-height: 18px; margin: 0px; overflow: visible; text-align: left; text-align-last: auto; white-space-collapse: preserve-breaks;">allspringglobal.com</span>
|
| Expenses [Text Block] |
|
|
What were the Fund costs for the past year?The table explains the costs you would have paid within the reporting period based on a hypothetical $10,000 investment.
Table Summary
CLASS NAME |
COSTS OF A $10,000 INVESTMENT |
COSTS PAID AS A % OF A $10,000 INVESTMENT |
Class C |
$154 |
1.46% | The manager has contractually committed to waive fees and/or reimburse certain expenses to the extent necessary to cap the Fund's total annual fund operating expense ratio at a specific amount. Without this cap, the costs shown above may have been higher. Please see the prospectus for the amount and the expiration date of the cap. Prior to or after the commitment expiration date, the cap may be increased or the commitment to maintain the cap may be terminated only with the approval of the Board of Trustees. |
| Expenses Paid, Amount |
|
|
$ 154
|
| Expense Ratio, Percent |
|
|
1.46%
|
| Factors Affecting Performance [Text Block] |
|
|
How did the Fund perform last year and what affected its performance?The past year saw a wide set of narratives drive the economy and financial markets. From an initial focus on the impact of tariffs, markets swiftly moved onto the opportunities within artificial intelligence (AI) followed by a U.S. government shutdown. While narratives shifted, domestic growth remained above trend, supported initially by AI-driven capital expenditures and resilient consumer spending. Outside the U.S., investment opportunities were divergent. Globally, expectations for earnings growth remain concentrated on a single theme: AI. There were limited portfolio changes over the past 12 months. In fixed income, we reduced U.S. Treasury bond exposure and added to our U.S. core bond allocation. Security selection added to performance in our inflation-protected, alternative risk premia, and developed international equity strategies. |
| Performance Past Does Not Indicate Future [Text] |
|
|
Figures quoted represent past performance, which is no guarantee of future results,
|
| Line Graph [Table Text Block] |
|
|

Table Summary
|
Class C with Load |
Spectrum Income Allocation Blended Index |
Bloomberg U.S. Aggregate Bond Index |
Russell 3000® Index |
4/30/2016 |
$10,000 |
$10,000 |
$10,000 |
$10,000 |
5/31/2016 |
$10,013 |
$10,017 |
$10,003 |
$10,179 |
6/30/2016 |
$10,076 |
$10,155 |
$10,182 |
$10,200 |
7/31/2016 |
$10,218 |
$10,293 |
$10,247 |
$10,605 |
8/31/2016 |
$10,230 |
$10,291 |
$10,235 |
$10,632 |
9/30/2016 |
$10,254 |
$10,296 |
$10,229 |
$10,648 |
10/31/2016 |
$10,155 |
$10,193 |
$10,151 |
$10,418 |
11/30/2016 |
$10,079 |
$10,050 |
$9,911 |
$10,884 |
12/31/2016 |
$10,129 |
$10,104 |
$9,925 |
$11,097 |
1/31/2017 |
$10,210 |
$10,168 |
$9,944 |
$11,305 |
2/28/2017 |
$10,303 |
$10,285 |
$10,011 |
$11,726 |
3/31/2017 |
$10,306 |
$10,297 |
$10,006 |
$11,734 |
4/30/2017 |
$10,386 |
$10,389 |
$10,083 |
$11,858 |
5/31/2017 |
$10,456 |
$10,489 |
$10,160 |
$11,980 |
6/30/2017 |
$10,472 |
$10,495 |
$10,150 |
$12,088 |
7/31/2017 |
$10,572 |
$10,582 |
$10,194 |
$12,316 |
8/31/2017 |
$10,595 |
$10,664 |
$10,285 |
$12,339 |
9/30/2017 |
$10,627 |
$10,672 |
$10,236 |
$12,640 |
10/31/2017 |
$10,665 |
$10,722 |
$10,242 |
$12,916 |
11/30/2017 |
$10,710 |
$10,762 |
$10,229 |
$13,308 |
12/31/2017 |
$10,763 |
$10,831 |
$10,276 |
$13,441 |
1/31/2018 |
$10,837 |
$10,847 |
$10,158 |
$14,150 |
2/28/2018 |
$10,627 |
$10,678 |
$10,061 |
$13,628 |
3/31/2018 |
$10,571 |
$10,691 |
$10,126 |
$13,355 |
4/30/2018 |
$10,524 |
$10,644 |
$10,051 |
$13,406 |
5/31/2018 |
$10,599 |
$10,732 |
$10,122 |
$13,784 |
6/30/2018 |
$10,593 |
$10,719 |
$10,110 |
$13,874 |
7/31/2018 |
$10,688 |
$10,786 |
$10,112 |
$14,335 |
8/31/2018 |
$10,766 |
$10,881 |
$10,177 |
$14,838 |
9/30/2018 |
$10,736 |
$10,831 |
$10,112 |
$14,863 |
10/31/2018 |
$10,430 |
$10,598 |
$10,032 |
$13,768 |
11/30/2018 |
$10,481 |
$10,684 |
$10,092 |
$14,044 |
12/31/2018 |
$10,295 |
$10,673 |
$10,277 |
$12,737 |
1/31/2019 |
$10,659 |
$10,940 |
$10,386 |
$13,830 |
2/28/2019 |
$10,733 |
$11,002 |
$10,380 |
$14,316 |
3/31/2019 |
$10,860 |
$11,197 |
$10,580 |
$14,526 |
4/30/2019 |
$10,944 |
$11,280 |
$10,582 |
$15,106 |
5/31/2019 |
$10,905 |
$11,301 |
$10,770 |
$14,128 |
6/30/2019 |
$11,122 |
$11,567 |
$10,906 |
$15,120 |
7/31/2019 |
$11,158 |
$11,603 |
$10,930 |
$15,345 |
8/31/2019 |
$11,251 |
$11,789 |
$11,213 |
$15,032 |
9/30/2019 |
$11,247 |
$11,786 |
$11,153 |
$15,296 |
10/31/2019 |
$11,282 |
$11,874 |
$11,187 |
$15,625 |
11/30/2019 |
$11,342 |
$11,939 |
$11,181 |
$16,219 |
12/31/2019 |
$11,398 |
$12,012 |
$11,173 |
$16,688 |
1/31/2020 |
$11,522 |
$12,175 |
$11,388 |
$16,669 |
2/29/2020 |
$11,421 |
$12,153 |
$11,593 |
$15,305 |
3/31/2020 |
$10,993 |
$11,757 |
$11,525 |
$13,200 |
4/30/2020 |
$11,455 |
$12,195 |
$11,730 |
$14,948 |
5/31/2020 |
$11,657 |
$12,356 |
$11,784 |
$15,748 |
6/30/2020 |
$11,803 |
$12,491 |
$11,859 |
$16,108 |
7/31/2020 |
$12,085 |
$12,773 |
$12,036 |
$17,022 |
8/31/2020 |
$12,202 |
$12,853 |
$11,939 |
$18,255 |
9/30/2020 |
$12,036 |
$12,763 |
$11,932 |
$17,591 |
10/31/2020 |
$11,962 |
$12,662 |
$11,879 |
$17,211 |
11/30/2020 |
$12,248 |
$12,992 |
$11,995 |
$19,305 |
12/31/2020 |
$12,395 |
$13,118 |
$12,012 |
$20,173 |
1/31/2021 |
$12,359 |
$13,066 |
$11,926 |
$20,084 |
2/28/2021 |
$12,335 |
$12,965 |
$11,753 |
$20,711 |
3/31/2021 |
$12,252 |
$12,898 |
$11,607 |
$21,454 |
4/30/2021 |
$12,443 |
$13,062 |
$11,698 |
$22,560 |
5/31/2021 |
$12,503 |
$13,127 |
$11,737 |
$22,663 |
6/30/2021 |
$12,595 |
$13,242 |
$11,819 |
$23,222 |
7/31/2021 |
$12,681 |
$13,390 |
$11,951 |
$23,614 |
8/31/2021 |
$12,708 |
$13,416 |
$11,929 |
$24,288 |
9/30/2021 |
$12,621 |
$13,277 |
$11,825 |
$23,198 |
10/31/2021 |
$12,719 |
$13,358 |
$11,822 |
$24,767 |
11/30/2021 |
$12,678 |
$13,343 |
$11,857 |
$24,390 |
12/31/2021 |
$12,722 |
$13,416 |
$11,827 |
$25,350 |
1/31/2022 |
$12,393 |
$13,076 |
$11,572 |
$23,859 |
2/28/2022 |
$12,266 |
$12,944 |
$11,443 |
$23,258 |
3/31/2022 |
$11,987 |
$12,698 |
$11,125 |
$24,012 |
4/30/2022 |
$11,569 |
$12,186 |
$10,703 |
$21,857 |
5/31/2022 |
$11,639 |
$12,231 |
$10,772 |
$21,828 |
6/30/2022 |
$11,256 |
$11,839 |
$10,603 |
$20,002 |
7/31/2022 |
$11,575 |
$12,276 |
$10,862 |
$21,878 |
8/31/2022 |
$11,281 |
$11,930 |
$10,555 |
$21,062 |
9/30/2022 |
$10,730 |
$11,331 |
$10,099 |
$19,109 |
10/31/2022 |
$10,779 |
$11,373 |
$9,968 |
$20,676 |
11/30/2022 |
$11,126 |
$11,779 |
$10,335 |
$21,755 |
12/31/2022 |
$10,987 |
$11,668 |
$10,288 |
$20,481 |
1/31/2023 |
$11,329 |
$12,076 |
$10,604 |
$21,892 |
2/28/2023 |
$11,000 |
$11,801 |
$10,330 |
$21,380 |
3/31/2023 |
$11,224 |
$12,080 |
$10,593 |
$21,952 |
4/30/2023 |
$11,256 |
$12,162 |
$10,657 |
$22,186 |
5/31/2023 |
$11,166 |
$12,034 |
$10,541 |
$22,272 |
6/30/2023 |
$11,264 |
$12,105 |
$10,503 |
$23,793 |
7/31/2023 |
$11,353 |
$12,172 |
$10,496 |
$24,646 |
8/31/2023 |
$11,296 |
$12,084 |
$10,429 |
$24,170 |
9/30/2023 |
$10,999 |
$11,789 |
$10,164 |
$23,019 |
10/31/2023 |
$10,785 |
$11,601 |
$10,003 |
$22,408 |
11/30/2023 |
$11,263 |
$12,160 |
$10,456 |
$24,498 |
12/31/2023 |
$11,642 |
$12,626 |
$10,857 |
$25,797 |
1/31/2024 |
$11,601 |
$12,612 |
$10,827 |
$26,083 |
2/29/2024 |
$11,594 |
$12,546 |
$10,674 |
$27,495 |
3/31/2024 |
$11,764 |
$12,694 |
$10,773 |
$28,382 |
4/30/2024 |
$11,431 |
$12,399 |
$10,500 |
$27,133 |
5/31/2024 |
$11,662 |
$12,630 |
$10,678 |
$28,415 |
6/30/2024 |
$11,819 |
$12,763 |
$10,780 |
$29,295 |
7/31/2024 |
$12,011 |
$13,042 |
$11,031 |
$29,839 |
8/31/2024 |
$12,179 |
$13,237 |
$11,190 |
$30,489 |
9/30/2024 |
$12,345 |
$13,434 |
$11,340 |
$31,120 |
10/31/2024 |
$12,046 |
$13,156 |
$11,058 |
$30,891 |
11/30/2024 |
$12,331 |
$13,333 |
$11,175 |
$32,946 |
12/31/2024 |
$12,089 |
$13,125 |
$10,992 |
$31,939 |
1/31/2025 |
$12,163 |
$13,259 |
$11,051 |
$32,947 |
2/28/2025 |
$12,373 |
$13,478 |
$11,294 |
$32,316 |
3/31/2025 |
$12,255 |
$13,413 |
$11,298 |
$30,431 |
4/30/2025 |
$12,284 |
$13,457 |
$11,343 |
$30,227 |
5/31/2025 |
$12,310 |
$13,498 |
$11,261 |
$32,143 |
6/30/2025 |
$12,531 |
$13,745 |
$11,435 |
$33,776 |
7/31/2025 |
$12,535 |
$13,752 |
$11,404 |
$34,520 |
8/31/2025 |
$12,752 |
$13,942 |
$11,541 |
$35,318 |
9/30/2025 |
$13,041 |
$14,139 |
$11,667 |
$36,537 |
10/31/2025 |
$13,172 |
$14,253 |
$11,740 |
$37,320 |
11/30/2025 |
$13,230 |
$14,318 |
$11,813 |
$37,423 |
12/31/2025 |
$13,189 |
$14,339 |
$11,795 |
$37,415 |
1/31/2026 |
$13,477 |
$14,449 |
$11,808 |
$37,996 |
2/28/2026 |
$13,881 |
$14,650 |
$12,001 |
$37,815 |
3/31/2026 |
$13,577 |
$14,263 |
$11,789 |
$35,935 |
4/30/2026 |
$13,677 |
$14,596 |
$11,803 |
$39,601 |
|
| Average Annual Return [Table Text Block] |
|
|
Table Summary
AATR |
1 Year |
5 Years |
10 Years |
Class CFootnote Reference* |
10.50 |
1.58 |
3.18 |
Class C with LoadFootnote Reference* |
9.50 |
1.58 |
3.18 |
Spectrum Income Allocation Blended IndexFootnote Reference† |
8.47 |
2.25 |
3.85 |
Bloomberg U.S. Aggregate Bond Index |
4.06 |
0.18 |
1.67 |
Russell 3000® Index |
31.01 |
11.91 |
14.75 | |
| No Deduction of Taxes [Text Block] |
|
|
do not reflect taxes that a shareholder may pay on an investment in a fund.
|
| AssetsNet |
|
|
$ 83,648,540
|
| Holdings Count | Holding |
|
|
29
|
| Advisory Fees Paid, Amount |
|
|
$ 59,422
|
| InvestmentCompanyPortfolioTurnover |
|
|
84.00%
|
| Additional Fund Statistics [Text Block] |
|
|
Table Summary
Total net assets |
$83,648,540 |
# of portfolio holdings |
29 |
Portfolio turnover rate |
84% |
Total advisory fees paid |
$59,422 | |
| Holdings [Text Block] |
|
|
ALLOCATION (% OF TOTAL INVESTMENTS)
Table Summary
Fund |
Effective AllocationFootnote Reference1 |
Bonds |
68.6 |
Inflation sensitive investments |
15.5 |
Stocks |
11.8 |
Alternative investments |
4.1 |
| Footnote |
Description |
Footnote1 |
Effective allocation is subject to change and may have changed since the date specified. Effective allocation excludes cash, and percent totals may not add to 100% due to rounding. | |
| Largest Holdings [Text Block] |
|
|
TOP TEN HOLDINGS (% OF NET ASSETS)
Table Summary
Allspring Real Return Portfolio |
14.8 |
Allspring Broad Market Core Bond ETF |
11.6 |
iShares Core U.S. Aggregate Bond ETF |
11.2 |
Allspring Core Bond Portfolio |
10.5 |
Allspring Core Plus ETF |
10.4 |
Allspring Income Plus ETF |
10.4 |
Allspring High Yield Bond Fund Institutional Class |
6.7 |
Allspring Diversified Income Builder Fund Class R6 |
5.0 |
Allspring Alternative Risk Premia Fund Class R6 |
4.0 |
Allspring Disciplined International Developed Markets Portfolio |
2.5 | |
| Material Fund Change [Text Block] |
|
|
|
| C000205245 |
|
|
|
| Shareholder Report [Line Items] |
|
|
|
| Fund Name |
|
|
Spectrum Income Allocation Fund
|
| Class Name |
|
|
Institutional Class
|
| Trading Symbol |
|
|
WCYFX
|
| Annual or Semi-Annual Statement [Text Block] |
|
|
This annual shareholder report contains important information about Spectrum Income Allocation Fund for the period from May 1, 2025 to April 30, 2026.
|
| Additional Information [Text Block] |
|
|
You can find additional information about the Fund at allspringglobal.com. You can also request this information by contacting us at 1-800-222-8222.
|
| Additional Information Phone Number |
|
|
<span style="white-space: nowrap; box-sizing: border-box; color: rgb(0, 0, 0); display: inline; flex-wrap: nowrap; font-size: 12px; font-weight: 400; grid-area: auto; line-height: 18px; margin: 0px; overflow: visible; text-align: left; text-align-last: auto;"> 1-800-222-8222.</span>
|
| Additional Information Website |
|
|
<span style="box-sizing: border-box; color: rgb(0, 0, 0); display: inline; flex-wrap: nowrap; font-size: 12px; font-weight: 400; grid-area: auto; line-height: 18px; margin: 0px; overflow: visible; text-align: left; text-align-last: auto; white-space-collapse: preserve-breaks;">allspringglobal.com</span>
|
| Expenses [Text Block] |
|
|
What were the Fund costs for the past year?The table explains the costs you would have paid within the reporting period based on a hypothetical $10,000 investment.
Table Summary
CLASS NAME |
COSTS OF A $10,000 INVESTMENT |
COSTS PAID AS A % OF A $10,000 INVESTMENT |
Institutional Class |
$42 |
0.40% | The manager has contractually committed to waive fees and/or reimburse certain expenses to the extent necessary to cap the Fund's total annual fund operating expense ratio at a specific amount. Without this cap, the costs shown above may have been higher. Please see the prospectus for the amount and the expiration date of the cap. Prior to or after the commitment expiration date, the cap may be increased or the commitment to maintain the cap may be terminated only with the approval of the Board of Trustees. |
| Expenses Paid, Amount |
|
|
$ 42
|
| Expense Ratio, Percent |
|
|
0.40%
|
| Factors Affecting Performance [Text Block] |
|
|
How did the Fund perform last year and what affected its performance?The past year saw a wide set of narratives drive the economy and financial markets. From an initial focus on the impact of tariffs, markets swiftly moved onto the opportunities within artificial intelligence (AI) followed by a U.S. government shutdown. While narratives shifted, domestic growth remained above trend, supported initially by AI-driven capital expenditures and resilient consumer spending. Outside the U.S., investment opportunities were divergent. Globally, expectations for earnings growth remain concentrated on a single theme: AI. There were limited portfolio changes over the past 12 months. In fixed income, we reduced U.S. Treasury bond exposure and added to our U.S. core bond allocation. Security selection added to performance in our inflation-protected, alternative risk premia, and developed international equity strategies. |
| Performance Past Does Not Indicate Future [Text] |
|
|
Figures quoted represent past performance, which is no guarantee of future results,
|
| Line Graph [Table Text Block] |
|
|

Table Summary
|
Institutional Class |
Spectrum Income Allocation Blended Index |
Bloomberg U.S. Aggregate Bond Index |
Russell 3000® Index |
4/30/2016 |
$10,000 |
$10,000 |
$10,000 |
$10,000 |
5/31/2016 |
$10,013 |
$10,017 |
$10,003 |
$10,179 |
6/30/2016 |
$10,076 |
$10,155 |
$10,182 |
$10,200 |
7/31/2016 |
$10,218 |
$10,293 |
$10,247 |
$10,605 |
8/31/2016 |
$10,230 |
$10,291 |
$10,235 |
$10,632 |
9/30/2016 |
$10,254 |
$10,296 |
$10,229 |
$10,648 |
10/31/2016 |
$10,155 |
$10,193 |
$10,151 |
$10,418 |
11/30/2016 |
$10,079 |
$10,050 |
$9,911 |
$10,884 |
12/31/2016 |
$10,129 |
$10,104 |
$9,925 |
$11,097 |
1/31/2017 |
$10,210 |
$10,168 |
$9,944 |
$11,305 |
2/28/2017 |
$10,312 |
$10,285 |
$10,011 |
$11,726 |
3/31/2017 |
$10,321 |
$10,297 |
$10,006 |
$11,734 |
4/30/2017 |
$10,410 |
$10,389 |
$10,083 |
$11,858 |
5/31/2017 |
$10,490 |
$10,489 |
$10,160 |
$11,980 |
6/30/2017 |
$10,515 |
$10,495 |
$10,150 |
$12,088 |
7/31/2017 |
$10,613 |
$10,582 |
$10,194 |
$12,316 |
8/31/2017 |
$10,642 |
$10,664 |
$10,285 |
$12,339 |
9/30/2017 |
$10,692 |
$10,672 |
$10,236 |
$12,640 |
10/31/2017 |
$10,729 |
$10,722 |
$10,242 |
$12,916 |
11/30/2017 |
$10,780 |
$10,762 |
$10,229 |
$13,308 |
12/31/2017 |
$10,837 |
$10,831 |
$10,276 |
$13,441 |
1/31/2018 |
$10,921 |
$10,847 |
$10,158 |
$14,150 |
2/28/2018 |
$10,720 |
$10,678 |
$10,061 |
$13,628 |
3/31/2018 |
$10,672 |
$10,691 |
$10,126 |
$13,355 |
4/30/2018 |
$10,633 |
$10,644 |
$10,051 |
$13,406 |
5/31/2018 |
$10,704 |
$10,732 |
$10,122 |
$13,784 |
6/30/2018 |
$10,704 |
$10,719 |
$10,110 |
$13,874 |
7/31/2018 |
$10,811 |
$10,786 |
$10,112 |
$14,335 |
8/31/2018 |
$10,897 |
$10,881 |
$10,177 |
$14,838 |
9/30/2018 |
$10,876 |
$10,831 |
$10,112 |
$14,863 |
10/31/2018 |
$10,577 |
$10,598 |
$10,032 |
$13,768 |
11/30/2018 |
$10,639 |
$10,684 |
$10,092 |
$14,044 |
12/31/2018 |
$10,465 |
$10,673 |
$10,277 |
$12,737 |
1/31/2019 |
$10,828 |
$10,940 |
$10,386 |
$13,830 |
2/28/2019 |
$10,925 |
$11,002 |
$10,380 |
$14,316 |
3/31/2019 |
$11,059 |
$11,197 |
$10,580 |
$14,526 |
4/30/2019 |
$11,148 |
$11,280 |
$10,582 |
$15,106 |
5/31/2019 |
$11,130 |
$11,301 |
$10,770 |
$14,128 |
6/30/2019 |
$11,362 |
$11,567 |
$10,906 |
$15,120 |
7/31/2019 |
$11,410 |
$11,603 |
$10,930 |
$15,345 |
8/31/2019 |
$11,516 |
$11,789 |
$11,213 |
$15,032 |
9/30/2019 |
$11,521 |
$11,786 |
$11,153 |
$15,296 |
10/31/2019 |
$11,580 |
$11,874 |
$11,187 |
$15,625 |
11/30/2019 |
$11,651 |
$11,939 |
$11,181 |
$16,219 |
12/31/2019 |
$11,703 |
$12,012 |
$11,173 |
$16,688 |
1/31/2020 |
$11,854 |
$12,175 |
$11,388 |
$16,669 |
2/29/2020 |
$11,750 |
$12,153 |
$11,593 |
$15,305 |
3/31/2020 |
$11,333 |
$11,757 |
$11,525 |
$13,200 |
4/30/2020 |
$11,808 |
$12,195 |
$11,730 |
$14,948 |
5/31/2020 |
$12,028 |
$12,356 |
$11,784 |
$15,748 |
6/30/2020 |
$12,190 |
$12,491 |
$11,859 |
$16,108 |
7/31/2020 |
$12,491 |
$12,773 |
$12,036 |
$17,022 |
8/31/2020 |
$12,625 |
$12,853 |
$11,939 |
$18,255 |
9/30/2020 |
$12,464 |
$12,763 |
$11,932 |
$17,591 |
10/31/2020 |
$12,399 |
$12,662 |
$11,879 |
$17,211 |
11/30/2020 |
$12,706 |
$12,992 |
$11,995 |
$19,305 |
12/31/2020 |
$12,877 |
$13,118 |
$12,012 |
$20,173 |
1/31/2021 |
$12,840 |
$13,066 |
$11,926 |
$20,084 |
2/28/2021 |
$12,828 |
$12,965 |
$11,753 |
$20,711 |
3/31/2021 |
$12,765 |
$12,898 |
$11,607 |
$21,454 |
4/30/2021 |
$12,977 |
$13,062 |
$11,698 |
$22,560 |
5/31/2021 |
$13,051 |
$13,127 |
$11,737 |
$22,663 |
6/30/2021 |
$13,151 |
$13,242 |
$11,819 |
$23,222 |
7/31/2021 |
$13,266 |
$13,390 |
$11,951 |
$23,614 |
8/31/2021 |
$13,293 |
$13,416 |
$11,929 |
$24,288 |
9/30/2021 |
$13,215 |
$13,277 |
$11,825 |
$23,198 |
10/31/2021 |
$13,330 |
$13,358 |
$11,822 |
$24,767 |
11/30/2021 |
$13,298 |
$13,343 |
$11,857 |
$24,390 |
12/31/2021 |
$13,364 |
$13,416 |
$11,827 |
$25,350 |
1/31/2022 |
$13,018 |
$13,076 |
$11,572 |
$23,859 |
2/28/2022 |
$12,898 |
$12,944 |
$11,443 |
$23,258 |
3/31/2022 |
$12,618 |
$12,698 |
$11,125 |
$24,012 |
4/30/2022 |
$12,191 |
$12,186 |
$10,703 |
$21,857 |
5/31/2022 |
$12,277 |
$12,231 |
$10,772 |
$21,828 |
6/30/2022 |
$11,883 |
$11,839 |
$10,603 |
$20,002 |
7/31/2022 |
$12,220 |
$12,276 |
$10,862 |
$21,878 |
8/31/2022 |
$11,937 |
$11,930 |
$10,555 |
$21,062 |
9/30/2022 |
$11,348 |
$11,331 |
$10,099 |
$19,109 |
10/31/2022 |
$11,410 |
$11,373 |
$9,968 |
$20,676 |
11/30/2022 |
$11,802 |
$11,779 |
$10,335 |
$21,755 |
12/31/2022 |
$11,658 |
$11,668 |
$10,288 |
$20,481 |
1/31/2023 |
$12,036 |
$12,076 |
$10,604 |
$21,892 |
2/28/2023 |
$11,700 |
$11,801 |
$10,330 |
$21,380 |
3/31/2023 |
$11,938 |
$12,080 |
$10,593 |
$21,952 |
4/30/2023 |
$11,997 |
$12,162 |
$10,657 |
$22,186 |
5/31/2023 |
$11,910 |
$12,034 |
$10,541 |
$22,272 |
6/30/2023 |
$12,012 |
$12,105 |
$10,503 |
$23,793 |
7/31/2023 |
$12,119 |
$12,172 |
$10,496 |
$24,646 |
8/31/2023 |
$12,069 |
$12,084 |
$10,429 |
$24,170 |
9/30/2023 |
$11,777 |
$11,789 |
$10,164 |
$23,019 |
10/31/2023 |
$11,557 |
$11,601 |
$10,003 |
$22,408 |
11/30/2023 |
$12,066 |
$12,160 |
$10,456 |
$24,498 |
12/31/2023 |
$12,489 |
$12,626 |
$10,857 |
$25,797 |
1/31/2024 |
$12,461 |
$12,612 |
$10,827 |
$26,083 |
2/29/2024 |
$12,460 |
$12,546 |
$10,674 |
$27,495 |
3/31/2024 |
$12,669 |
$12,694 |
$10,773 |
$28,382 |
4/30/2024 |
$12,307 |
$12,399 |
$10,500 |
$27,133 |
5/31/2024 |
$12,546 |
$12,630 |
$10,678 |
$28,415 |
6/30/2024 |
$12,703 |
$12,763 |
$10,780 |
$29,295 |
7/31/2024 |
$12,914 |
$13,042 |
$11,031 |
$29,839 |
8/31/2024 |
$13,114 |
$13,237 |
$11,190 |
$30,489 |
9/30/2024 |
$13,296 |
$13,434 |
$11,340 |
$31,120 |
10/31/2024 |
$12,978 |
$13,156 |
$11,058 |
$30,891 |
11/30/2024 |
$13,289 |
$13,333 |
$11,175 |
$32,946 |
12/31/2024 |
$13,031 |
$13,125 |
$10,992 |
$31,939 |
1/31/2025 |
$13,114 |
$13,259 |
$11,051 |
$32,947 |
2/28/2025 |
$13,345 |
$13,478 |
$11,294 |
$32,316 |
3/31/2025 |
$13,221 |
$13,413 |
$11,298 |
$30,431 |
4/30/2025 |
$13,256 |
$13,457 |
$11,343 |
$30,227 |
5/31/2025 |
$13,287 |
$13,498 |
$11,261 |
$32,143 |
6/30/2025 |
$13,529 |
$13,745 |
$11,435 |
$33,776 |
7/31/2025 |
$13,538 |
$13,752 |
$11,404 |
$34,520 |
8/31/2025 |
$13,777 |
$13,942 |
$11,541 |
$35,318 |
9/30/2025 |
$14,093 |
$14,139 |
$11,667 |
$36,537 |
10/31/2025 |
$14,240 |
$14,253 |
$11,740 |
$37,320 |
11/30/2025 |
$14,291 |
$14,318 |
$11,813 |
$37,423 |
12/31/2025 |
$14,267 |
$14,339 |
$11,795 |
$37,415 |
1/31/2026 |
$14,579 |
$14,449 |
$11,808 |
$37,996 |
2/28/2026 |
$15,023 |
$14,650 |
$12,001 |
$37,815 |
3/31/2026 |
$14,682 |
$14,263 |
$11,789 |
$35,935 |
4/30/2026 |
$14,795 |
$14,596 |
$11,803 |
$39,601 |
|
| Average Annual Return [Table Text Block] |
|
|
Table Summary
AATR |
1 Year |
5 Years |
10 Years |
Institutional ClassFootnote Reference* |
11.61 |
2.66 |
3.99 |
Spectrum Income Allocation Blended IndexFootnote Reference† |
8.47 |
2.25 |
3.85 |
Bloomberg U.S. Aggregate Bond Index |
4.06 |
0.18 |
1.67 |
Russell 3000® Index |
31.01 |
11.91 |
14.75 | |
| No Deduction of Taxes [Text Block] |
|
|
do not reflect taxes that a shareholder may pay on an investment in a fund.
|
| AssetsNet |
|
|
$ 83,648,540
|
| Holdings Count | Holding |
|
|
29
|
| Advisory Fees Paid, Amount |
|
|
$ 59,422
|
| InvestmentCompanyPortfolioTurnover |
|
|
84.00%
|
| Additional Fund Statistics [Text Block] |
|
|
Table Summary
Total net assets |
$83,648,540 |
# of portfolio holdings |
29 |
Portfolio turnover rate |
84% |
Total advisory fees paid |
$59,422 | |
| Holdings [Text Block] |
|
|
ALLOCATION (% OF TOTAL INVESTMENTS)
Table Summary
Fund |
Effective AllocationFootnote Reference1 |
Bonds |
68.6 |
Inflation sensitive investments |
15.5 |
Stocks |
11.8 |
Alternative investments |
4.1 |
| Footnote |
Description |
Footnote1 |
Effective allocation is subject to change and may have changed since the date specified. Effective allocation excludes cash, and percent totals may not add to 100% due to rounding. | |
| Largest Holdings [Text Block] |
|
|
TOP TEN HOLDINGS (% OF NET ASSETS)
Table Summary
Allspring Real Return Portfolio |
14.8 |
Allspring Broad Market Core Bond ETF |
11.6 |
iShares Core U.S. Aggregate Bond ETF |
11.2 |
Allspring Core Bond Portfolio |
10.5 |
Allspring Core Plus ETF |
10.4 |
Allspring Income Plus ETF |
10.4 |
Allspring High Yield Bond Fund Institutional Class |
6.7 |
Allspring Diversified Income Builder Fund Class R6 |
5.0 |
Allspring Alternative Risk Premia Fund Class R6 |
4.0 |
Allspring Disciplined International Developed Markets Portfolio |
2.5 | |
| Material Fund Change [Text Block] |
|
|
|
| C000176109 |
|
|
|
| Shareholder Report [Line Items] |
|
|
|
| Fund Name |
|
|
Spectrum Moderate Growth Fund
|
| Class Name |
|
|
Class A
|
| Trading Symbol |
|
|
WGBAX
|
| Annual or Semi-Annual Statement [Text Block] |
|
|
This annual shareholder report contains important information about Spectrum Moderate Growth Fund for the period from May 1, 2025 to April 30, 2026.
|
| Additional Information [Text Block] |
|
|
You can find additional information about the Fund at allspringglobal.com. You can also request this information by contacting us at 1-800-222-8222.
|
| Additional Information Phone Number |
|
|
<span style="white-space: nowrap; box-sizing: border-box; color: rgb(0, 0, 0); display: inline; flex-wrap: nowrap; font-size: 12px; font-weight: 400; grid-area: auto; line-height: 18px; margin: 0px; overflow: visible; text-align: left; text-align-last: auto;"> 1-800-222-8222.</span>
|
| Additional Information Website |
|
|
<span style="box-sizing: border-box; color: rgb(0, 0, 0); display: inline; flex-wrap: nowrap; font-size: 12px; font-weight: 400; grid-area: auto; line-height: 18px; margin: 0px; overflow: visible; text-align: left; text-align-last: auto; white-space-collapse: preserve-breaks;">allspringglobal.com</span>
|
| Expenses [Text Block] |
|
|
What were the Fund costs for the past year?The table explains the costs you would have paid within the reporting period based on a hypothetical $10,000 investment.
Table Summary
CLASS NAME |
COSTS OF A $10,000 INVESTMENT |
COSTS PAID AS A % OF A $10,000 INVESTMENT |
Class A |
$77 |
0.70% | The manager has contractually committed to waive fees and/or reimburse certain expenses to the extent necessary to cap the Fund's total annual fund operating expense ratio at a specific amount. Without this cap, the costs shown above may have been higher. Please see the prospectus for the amount and the expiration date of the cap. Prior to or after the commitment expiration date, the cap may be increased or the commitment to maintain the cap may be terminated only with the approval of the Board of Trustees. |
| Expenses Paid, Amount |
|
|
$ 77
|
| Expense Ratio, Percent |
|
|
0.70%
|
| Factors Affecting Performance [Text Block] |
|
|
How did the Fund perform last year and what affected its performance?The Fund outperformed its benchmark for the period. The past year saw a wide set of narratives drive the economy and financial markets. From an initial focus on the impact of tariffs, markets swiftly moved onto the opportunities within artificial intelligence (AI) followed by a U.S. government shutdown. While narratives shifted, domestic growth remained above trend, supported initially by AI-driven capital expenditures and resilient consumer spending. Outside the U.S., investment opportunities were divergent. Globally, expectations for earnings growth remain concentrated on a single theme: AI. There were limited portfolio changes over the past 12 months. In fixed income, we reduced U.S. Treasury bond exposure and added to our U.S. core bond allocation. Security selection added to performance in our inflation-protected, alternative risk premia, and developed international equity strategies. Underperformance from active large and small-cap growth and value strategies detracted from relative performance. |
| Performance Past Does Not Indicate Future [Text] |
|
|
Figures quoted represent past performance, which is no guarantee of future results,
|
| Line Graph [Table Text Block] |
|
|
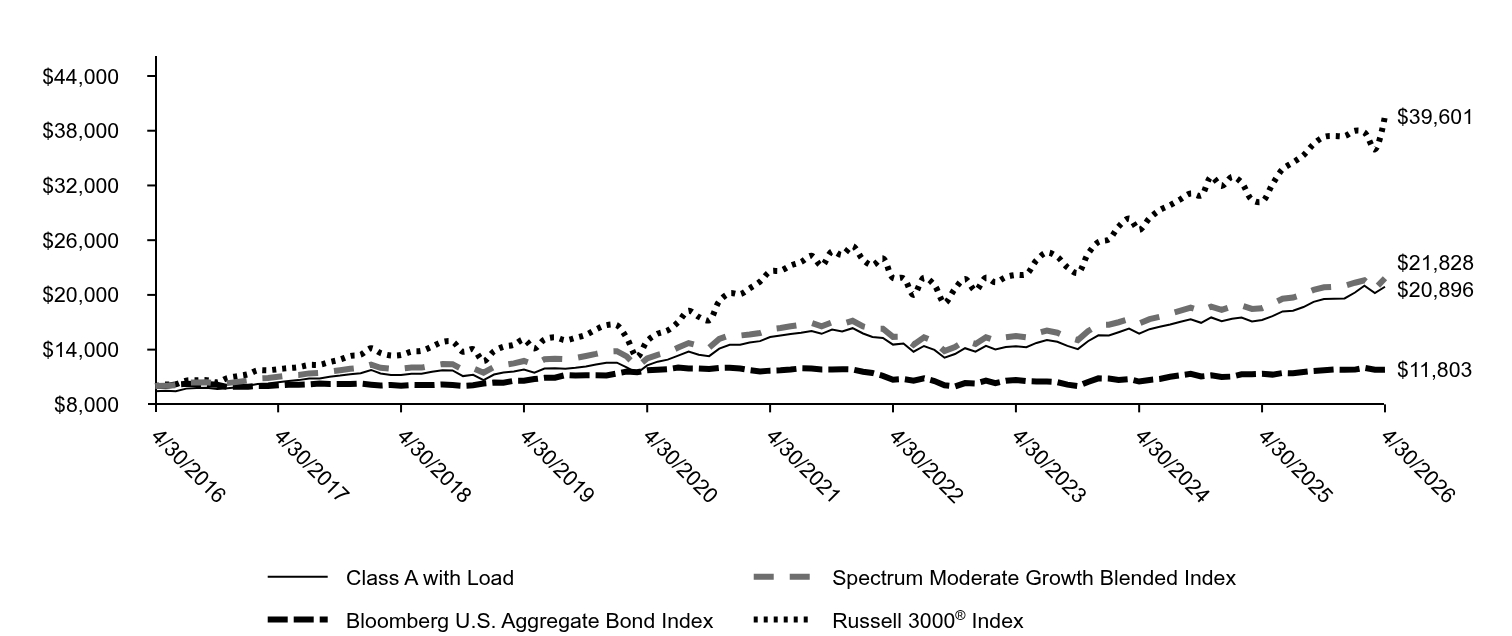
Table Summary
|
Class A with Load |
Spectrum Moderate Growth Blended Index |
Bloomberg U.S. Aggregate Bond Index |
Russell 3000® Index |
4/30/2016 |
$9,425 |
$10,000 |
$10,000 |
$10,000 |
5/31/2016 |
$9,489 |
$10,046 |
$10,003 |
$10,179 |
6/30/2016 |
$9,432 |
$10,099 |
$10,182 |
$10,200 |
7/31/2016 |
$9,725 |
$10,383 |
$10,247 |
$10,605 |
8/31/2016 |
$9,782 |
$10,401 |
$10,235 |
$10,632 |
9/30/2016 |
$9,825 |
$10,428 |
$10,229 |
$10,648 |
10/31/2016 |
$9,675 |
$10,275 |
$10,151 |
$10,418 |
11/30/2016 |
$9,775 |
$10,328 |
$9,911 |
$10,884 |
12/31/2016 |
$9,871 |
$10,466 |
$9,925 |
$11,097 |
1/31/2017 |
$10,042 |
$10,624 |
$9,944 |
$11,305 |
2/28/2017 |
$10,220 |
$10,849 |
$10,011 |
$11,726 |
3/31/2017 |
$10,294 |
$10,899 |
$10,006 |
$11,734 |
4/30/2017 |
$10,436 |
$11,023 |
$10,083 |
$11,858 |
5/31/2017 |
$10,569 |
$11,169 |
$10,160 |
$11,980 |
6/30/2017 |
$10,658 |
$11,213 |
$10,150 |
$12,088 |
7/31/2017 |
$10,844 |
$11,395 |
$10,194 |
$12,316 |
8/31/2017 |
$10,844 |
$11,456 |
$10,285 |
$12,339 |
9/30/2017 |
$11,037 |
$11,590 |
$10,236 |
$12,640 |
10/31/2017 |
$11,155 |
$11,738 |
$10,242 |
$12,916 |
11/30/2017 |
$11,311 |
$11,899 |
$10,229 |
$13,308 |
12/31/2017 |
$11,414 |
$12,019 |
$10,276 |
$13,441 |
1/31/2018 |
$11,774 |
$12,350 |
$10,158 |
$14,150 |
2/28/2018 |
$11,380 |
$12,007 |
$10,061 |
$13,628 |
3/31/2018 |
$11,226 |
$11,899 |
$10,126 |
$13,355 |
4/30/2018 |
$11,226 |
$11,916 |
$10,051 |
$13,406 |
5/31/2018 |
$11,363 |
$12,042 |
$10,122 |
$13,784 |
6/30/2018 |
$11,354 |
$12,029 |
$10,110 |
$13,874 |
7/31/2018 |
$11,577 |
$12,249 |
$10,112 |
$14,335 |
8/31/2018 |
$11,731 |
$12,415 |
$10,177 |
$14,838 |
9/30/2018 |
$11,723 |
$12,402 |
$10,112 |
$14,863 |
10/31/2018 |
$11,098 |
$11,798 |
$10,032 |
$13,768 |
11/30/2018 |
$11,235 |
$11,945 |
$10,092 |
$14,044 |
12/31/2018 |
$10,660 |
$11,469 |
$10,277 |
$12,737 |
1/31/2019 |
$11,272 |
$12,087 |
$10,386 |
$13,830 |
2/28/2019 |
$11,489 |
$12,305 |
$10,380 |
$14,316 |
3/31/2019 |
$11,597 |
$12,488 |
$10,580 |
$14,526 |
4/30/2019 |
$11,824 |
$12,758 |
$10,582 |
$15,106 |
5/31/2019 |
$11,479 |
$12,379 |
$10,770 |
$14,128 |
6/30/2019 |
$11,933 |
$12,940 |
$10,906 |
$15,120 |
7/31/2019 |
$11,972 |
$13,004 |
$10,930 |
$15,345 |
8/31/2019 |
$11,893 |
$12,956 |
$11,213 |
$15,032 |
9/30/2019 |
$12,002 |
$13,084 |
$11,153 |
$15,296 |
10/31/2019 |
$12,159 |
$13,300 |
$11,187 |
$15,625 |
11/30/2019 |
$12,366 |
$13,530 |
$11,181 |
$16,219 |
12/31/2019 |
$12,563 |
$13,796 |
$11,173 |
$16,688 |
1/31/2020 |
$12,573 |
$13,829 |
$11,388 |
$16,669 |
2/29/2020 |
$12,051 |
$13,257 |
$11,593 |
$15,305 |
3/31/2020 |
$11,439 |
$12,114 |
$11,525 |
$13,200 |
4/30/2020 |
$12,272 |
$13,040 |
$11,730 |
$14,948 |
5/31/2020 |
$12,683 |
$13,434 |
$11,784 |
$15,748 |
6/30/2020 |
$12,904 |
$13,706 |
$11,859 |
$16,108 |
7/31/2020 |
$13,346 |
$14,224 |
$12,036 |
$17,022 |
8/31/2020 |
$13,797 |
$14,721 |
$11,939 |
$18,255 |
9/30/2020 |
$13,446 |
$14,427 |
$11,932 |
$17,591 |
10/31/2020 |
$13,285 |
$14,215 |
$11,879 |
$17,211 |
11/30/2020 |
$14,108 |
$15,174 |
$11,995 |
$19,305 |
12/31/2020 |
$14,539 |
$15,578 |
$12,012 |
$20,173 |
1/31/2021 |
$14,539 |
$15,547 |
$11,926 |
$20,084 |
2/28/2021 |
$14,774 |
$15,660 |
$11,753 |
$20,711 |
3/31/2021 |
$14,930 |
$15,816 |
$11,607 |
$21,454 |
4/30/2021 |
$15,388 |
$16,230 |
$11,698 |
$22,560 |
5/31/2021 |
$15,544 |
$16,373 |
$11,737 |
$22,663 |
6/30/2021 |
$15,712 |
$16,562 |
$11,819 |
$23,222 |
7/31/2021 |
$15,846 |
$16,731 |
$11,951 |
$23,614 |
8/31/2021 |
$16,047 |
$16,929 |
$11,929 |
$24,288 |
9/30/2021 |
$15,734 |
$16,556 |
$11,825 |
$23,198 |
10/31/2021 |
$16,203 |
$16,990 |
$11,822 |
$24,767 |
11/30/2021 |
$16,002 |
$16,810 |
$11,857 |
$24,390 |
12/31/2021 |
$16,353 |
$17,160 |
$11,827 |
$25,350 |
1/31/2022 |
$15,773 |
$16,538 |
$11,572 |
$23,859 |
2/28/2022 |
$15,395 |
$16,310 |
$11,443 |
$23,258 |
3/31/2022 |
$15,281 |
$16,301 |
$11,125 |
$24,012 |
4/30/2022 |
$14,550 |
$15,400 |
$10,703 |
$21,857 |
5/31/2022 |
$14,664 |
$15,418 |
$10,772 |
$21,828 |
6/30/2022 |
$13,768 |
$14,541 |
$10,603 |
$20,002 |
7/31/2022 |
$14,399 |
$15,351 |
$10,862 |
$21,878 |
8/31/2022 |
$13,970 |
$14,877 |
$10,555 |
$21,062 |
9/30/2022 |
$13,113 |
$13,839 |
$10,099 |
$19,109 |
10/31/2022 |
$13,516 |
$14,293 |
$9,968 |
$20,676 |
11/30/2022 |
$14,159 |
$14,978 |
$10,335 |
$21,755 |
12/31/2022 |
$13,784 |
$14,627 |
$10,288 |
$20,481 |
1/31/2023 |
$14,408 |
$15,350 |
$10,604 |
$21,892 |
2/28/2023 |
$14,014 |
$15,000 |
$10,330 |
$21,380 |
3/31/2023 |
$14,286 |
$15,363 |
$10,593 |
$21,952 |
4/30/2023 |
$14,367 |
$15,500 |
$10,657 |
$22,186 |
5/31/2023 |
$14,259 |
$15,350 |
$10,541 |
$22,272 |
6/30/2023 |
$14,733 |
$15,795 |
$10,503 |
$23,793 |
7/31/2023 |
$15,045 |
$16,098 |
$10,496 |
$24,646 |
8/31/2023 |
$14,855 |
$15,856 |
$10,429 |
$24,170 |
9/30/2023 |
$14,408 |
$15,373 |
$10,164 |
$23,019 |
10/31/2023 |
$14,055 |
$15,048 |
$10,003 |
$22,408 |
11/30/2023 |
$14,923 |
$16,017 |
$10,456 |
$24,498 |
12/31/2023 |
$15,563 |
$16,704 |
$10,857 |
$25,797 |
1/31/2024 |
$15,550 |
$16,733 |
$10,827 |
$26,083 |
2/29/2024 |
$15,904 |
$17,002 |
$10,674 |
$27,495 |
3/31/2024 |
$16,300 |
$17,341 |
$10,773 |
$28,382 |
4/30/2024 |
$15,754 |
$16,874 |
$10,500 |
$27,133 |
5/31/2024 |
$16,245 |
$17,339 |
$10,678 |
$28,415 |
6/30/2024 |
$16,504 |
$17,594 |
$10,780 |
$29,295 |
7/31/2024 |
$16,750 |
$17,955 |
$11,031 |
$29,839 |
8/31/2024 |
$17,050 |
$18,278 |
$11,190 |
$30,489 |
9/30/2024 |
$17,323 |
$18,612 |
$11,340 |
$31,120 |
10/31/2024 |
$16,941 |
$18,259 |
$11,058 |
$30,891 |
11/30/2024 |
$17,527 |
$18,717 |
$11,175 |
$32,946 |
12/31/2024 |
$17,112 |
$18,351 |
$10,992 |
$31,939 |
1/31/2025 |
$17,395 |
$18,733 |
$11,051 |
$32,947 |
2/28/2025 |
$17,522 |
$18,836 |
$11,294 |
$32,316 |
3/31/2025 |
$17,098 |
$18,469 |
$11,298 |
$30,431 |
4/30/2025 |
$17,254 |
$18,545 |
$11,343 |
$30,227 |
5/31/2025 |
$17,678 |
$19,034 |
$11,261 |
$32,143 |
6/30/2025 |
$18,187 |
$19,585 |
$11,435 |
$33,776 |
7/31/2025 |
$18,258 |
$19,716 |
$11,404 |
$34,520 |
8/31/2025 |
$18,668 |
$20,095 |
$11,541 |
$35,318 |
9/30/2025 |
$19,234 |
$20,552 |
$11,667 |
$36,537 |
10/31/2025 |
$19,545 |
$20,829 |
$11,740 |
$37,320 |
11/30/2025 |
$19,587 |
$20,899 |
$11,813 |
$37,423 |
12/31/2025 |
$19,617 |
$20,991 |
$11,795 |
$37,415 |
1/31/2026 |
$20,264 |
$21,334 |
$11,808 |
$37,996 |
2/28/2026 |
$21,004 |
$21,600 |
$12,001 |
$37,815 |
3/31/2026 |
$20,202 |
$20,669 |
$11,789 |
$35,935 |
4/30/2026 |
$20,896 |
$21,828 |
$11,803 |
$39,601 |
|
| Average Annual Return [Table Text Block] |
|
|
Table Summary
AATR |
1 Year |
5 Years |
10 Years |
Class AFootnote Reference* |
21.11 |
6.31 |
8.29 |
Class A with LoadFootnote Reference* |
14.15 |
5.06 |
7.65 |
Spectrum Moderate Growth Blended IndexFootnote Reference† |
17.70 |
6.11 |
8.12 |
Bloomberg U.S. Aggregate Bond Index |
4.06 |
0.18 |
1.67 |
Russell 3000® Index |
31.01 |
11.91 |
14.75 | |
| No Deduction of Taxes [Text Block] |
|
|
do not reflect taxes that a shareholder may pay on an investment in a fund.
|
| AssetsNet |
|
|
$ 434,581,543
|
| Holdings Count | Holding |
|
|
36
|
| Advisory Fees Paid, Amount |
|
|
$ 837,849
|
| InvestmentCompanyPortfolioTurnover |
|
|
47.00%
|
| Additional Fund Statistics [Text Block] |
|
|
Table Summary
Total net assets |
$434,581,543 |
# of portfolio holdings |
36 |
Portfolio turnover rate |
47% |
Total advisory fees paid |
$837,849 | |
| Holdings [Text Block] |
|
|
ALLOCATION (% OF TOTAL INVESTMENTS)
Table Summary
Fund |
Effective AllocationFootnote Reference1 |
Stocks |
50.9 |
Bonds |
30.9 |
Inflation sensitive investments |
13.7 |
Alternative investments |
4.5 |
| Footnote |
Description |
Footnote1 |
Effective allocation is subject to change and may have changed since the date specified. Effective allocation excludes cash, and percent totals may not add to 100% due to rounding. | |
| Largest Holdings [Text Block] |
|
|
TOP TEN HOLDINGS (% OF NET ASSETS)
Table Summary
Allspring Disciplined Large Cap Portfolio |
19.2 |
Allspring Real Return Portfolio |
13.0 |
Allspring Income Plus ETF |
8.4 |
Allspring Broad Market Core Bond ETF |
6.1 |
Allspring Disciplined International Developed Markets Portfolio |
5.7 |
Allspring Diversified Income Builder Fund Class R6 |
5.3 |
Allspring Core Plus ETF |
4.6 |
iShares Core MSCI EAFE ETF |
4.5 |
Allspring Alternative Risk Premia Fund Class R6 |
4.3 |
Allspring High Yield Bond Fund Institutional Class |
4.0 | |
| Material Fund Change [Text Block] |
|
|
|
| C000176110 |
|
|
|
| Shareholder Report [Line Items] |
|
|
|
| Fund Name |
|
|
Spectrum Moderate Growth Fund
|
| Class Name |
|
|
Class C
|
| Trading Symbol |
|
|
WGBFX
|
| Annual or Semi-Annual Statement [Text Block] |
|
|
This annual shareholder report contains important information about Spectrum Moderate Growth Fund for the period from May 1, 2025 to April 30, 2026.
|
| Additional Information [Text Block] |
|
|
You can find additional information about the Fund at allspringglobal.com. You can also request this information by contacting us at 1-800-222-8222.
|
| Additional Information Phone Number |
|
|
<span style="white-space: nowrap; box-sizing: border-box; color: rgb(0, 0, 0); display: inline; flex-wrap: nowrap; font-size: 12px; font-weight: 400; grid-area: auto; line-height: 18px; margin: 0px; overflow: visible; text-align: left; text-align-last: auto;"> 1-800-222-8222.</span>
|
| Additional Information Website |
|
|
<span style="box-sizing: border-box; color: rgb(0, 0, 0); display: inline; flex-wrap: nowrap; font-size: 12px; font-weight: 400; grid-area: auto; line-height: 18px; margin: 0px; overflow: visible; text-align: left; text-align-last: auto; white-space-collapse: preserve-breaks;">allspringglobal.com</span>
|
| Expenses [Text Block] |
|
|
What were the Fund costs for the past year?The table explains the costs you would have paid within the reporting period based on a hypothetical $10,000 investment.
Table Summary
CLASS NAME |
COSTS OF A $10,000 INVESTMENT |
COSTS PAID AS A % OF A $10,000 INVESTMENT |
Class C |
$159 |
1.44% | The manager has contractually committed to waive fees and/or reimburse certain expenses to the extent necessary to cap the Fund's total annual fund operating expense ratio at a specific amount. Without this cap, the costs shown above may have been higher. Please see the prospectus for the amount and the expiration date of the cap. Prior to or after the commitment expiration date, the cap may be increased or the commitment to maintain the cap may be terminated only with the approval of the Board of Trustees. |
| Expenses Paid, Amount |
|
|
$ 159
|
| Expense Ratio, Percent |
|
|
1.44%
|
| Factors Affecting Performance [Text Block] |
|
|
How did the Fund perform last year and what affected its performance?The Fund outperformed its benchmark for the period. The past year saw a wide set of narratives drive the economy and financial markets. From an initial focus on the impact of tariffs, markets swiftly moved onto the opportunities within artificial intelligence (AI) followed by a U.S. government shutdown. While narratives shifted, domestic growth remained above trend, supported initially by AI-driven capital expenditures and resilient consumer spending. Outside the U.S., investment opportunities were divergent. Globally, expectations for earnings growth remain concentrated on a single theme: AI. There were limited portfolio changes over the past 12 months. In fixed income, we reduced U.S. Treasury bond exposure and added to our U.S. core bond allocation. Security selection added to performance in our inflation-protected, alternative risk premia, and developed international equity strategies. Underperformance from active large and small-cap growth and value strategies detracted from relative performance. |
| Performance Past Does Not Indicate Future [Text] |
|
|
Figures quoted represent past performance, which is no guarantee of future results,
|
| Line Graph [Table Text Block] |
|
|
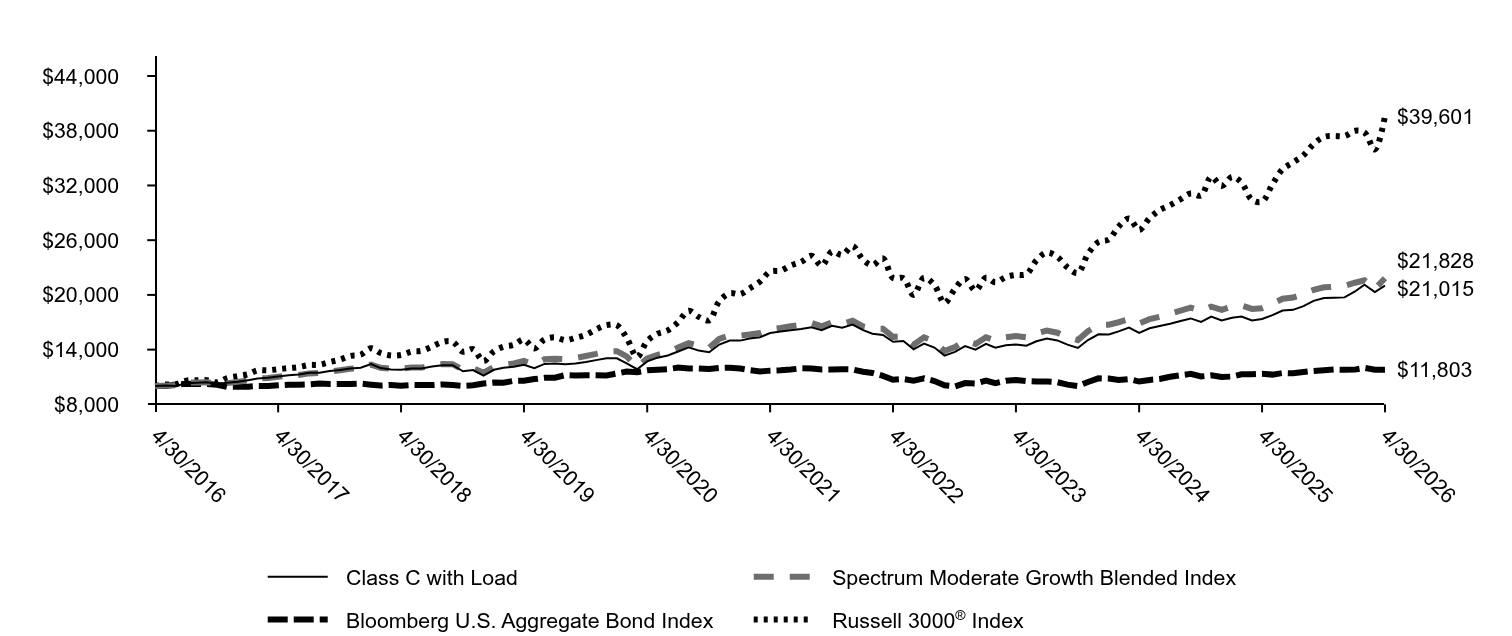
Table Summary
|
Class C with Load |
Spectrum Moderate Growth Blended Index |
Bloomberg U.S. Aggregate Bond Index |
Russell 3000® Index |
4/30/2016 |
$10,000 |
$10,000 |
$10,000 |
$10,000 |
5/31/2016 |
$10,068 |
$10,046 |
$10,003 |
$10,179 |
6/30/2016 |
$10,008 |
$10,099 |
$10,182 |
$10,200 |
7/31/2016 |
$10,318 |
$10,383 |
$10,247 |
$10,605 |
8/31/2016 |
$10,379 |
$10,401 |
$10,235 |
$10,632 |
9/30/2016 |
$10,424 |
$10,428 |
$10,229 |
$10,648 |
10/31/2016 |
$10,265 |
$10,275 |
$10,151 |
$10,418 |
11/30/2016 |
$10,371 |
$10,328 |
$9,911 |
$10,884 |
12/31/2016 |
$10,474 |
$10,466 |
$9,925 |
$11,097 |
1/31/2017 |
$10,655 |
$10,624 |
$9,944 |
$11,305 |
2/28/2017 |
$10,836 |
$10,849 |
$10,011 |
$11,726 |
3/31/2017 |
$10,907 |
$10,899 |
$10,006 |
$11,734 |
4/30/2017 |
$11,049 |
$11,023 |
$10,083 |
$11,858 |
5/31/2017 |
$11,190 |
$11,169 |
$10,160 |
$11,980 |
6/30/2017 |
$11,277 |
$11,213 |
$10,150 |
$12,088 |
7/31/2017 |
$11,466 |
$11,395 |
$10,194 |
$12,316 |
8/31/2017 |
$11,458 |
$11,456 |
$10,285 |
$12,339 |
9/30/2017 |
$11,655 |
$11,590 |
$10,236 |
$12,640 |
10/31/2017 |
$11,773 |
$11,738 |
$10,242 |
$12,916 |
11/30/2017 |
$11,931 |
$11,899 |
$10,229 |
$13,308 |
12/31/2017 |
$12,024 |
$12,019 |
$10,276 |
$13,441 |
1/31/2018 |
$12,407 |
$12,350 |
$10,158 |
$14,150 |
2/28/2018 |
$11,979 |
$12,007 |
$10,061 |
$13,628 |
3/31/2018 |
$11,810 |
$11,899 |
$10,126 |
$13,355 |
4/30/2018 |
$11,801 |
$11,916 |
$10,051 |
$13,406 |
5/31/2018 |
$11,935 |
$12,042 |
$10,122 |
$13,784 |
6/30/2018 |
$11,926 |
$12,029 |
$10,110 |
$13,874 |
7/31/2018 |
$12,149 |
$12,249 |
$10,112 |
$14,335 |
8/31/2018 |
$12,300 |
$12,415 |
$10,177 |
$14,838 |
9/30/2018 |
$12,291 |
$12,402 |
$10,112 |
$14,863 |
10/31/2018 |
$11,623 |
$11,798 |
$10,032 |
$13,768 |
11/30/2018 |
$11,757 |
$11,945 |
$10,092 |
$14,044 |
12/31/2018 |
$11,154 |
$11,469 |
$10,277 |
$12,737 |
1/31/2019 |
$11,790 |
$12,087 |
$10,386 |
$13,830 |
2/28/2019 |
$12,013 |
$12,305 |
$10,380 |
$14,316 |
3/31/2019 |
$12,114 |
$12,488 |
$10,580 |
$14,526 |
4/30/2019 |
$12,336 |
$12,758 |
$10,582 |
$15,106 |
5/31/2019 |
$11,972 |
$12,379 |
$10,770 |
$14,128 |
6/30/2019 |
$12,437 |
$12,940 |
$10,906 |
$15,120 |
7/31/2019 |
$12,477 |
$13,004 |
$10,930 |
$15,345 |
8/31/2019 |
$12,387 |
$12,956 |
$11,213 |
$15,032 |
9/30/2019 |
$12,488 |
$13,084 |
$11,153 |
$15,296 |
10/31/2019 |
$12,639 |
$13,300 |
$11,187 |
$15,625 |
11/30/2019 |
$12,851 |
$13,530 |
$11,181 |
$16,219 |
12/31/2019 |
$13,047 |
$13,796 |
$11,173 |
$16,688 |
1/31/2020 |
$13,047 |
$13,829 |
$11,388 |
$16,669 |
2/29/2020 |
$12,497 |
$13,257 |
$11,593 |
$15,305 |
3/31/2020 |
$11,855 |
$12,114 |
$11,525 |
$13,200 |
4/30/2020 |
$12,711 |
$13,040 |
$11,730 |
$14,948 |
5/31/2020 |
$13,119 |
$13,434 |
$11,784 |
$15,748 |
6/30/2020 |
$13,353 |
$13,706 |
$11,859 |
$16,108 |
7/31/2020 |
$13,791 |
$14,224 |
$12,036 |
$17,022 |
8/31/2020 |
$14,260 |
$14,721 |
$11,939 |
$18,255 |
9/30/2020 |
$13,893 |
$14,427 |
$11,932 |
$17,591 |
10/31/2020 |
$13,720 |
$14,215 |
$11,879 |
$17,211 |
11/30/2020 |
$14,556 |
$15,174 |
$11,995 |
$19,305 |
12/31/2020 |
$14,989 |
$15,578 |
$12,012 |
$20,173 |
1/31/2021 |
$14,989 |
$15,547 |
$11,926 |
$20,084 |
2/28/2021 |
$15,214 |
$15,660 |
$11,753 |
$20,711 |
3/31/2021 |
$15,360 |
$15,816 |
$11,607 |
$21,454 |
4/30/2021 |
$15,820 |
$16,230 |
$11,698 |
$22,560 |
5/31/2021 |
$15,978 |
$16,373 |
$11,737 |
$22,663 |
6/30/2021 |
$16,135 |
$16,562 |
$11,819 |
$23,222 |
7/31/2021 |
$16,259 |
$16,731 |
$11,951 |
$23,614 |
8/31/2021 |
$16,461 |
$16,929 |
$11,929 |
$24,288 |
9/30/2021 |
$16,135 |
$16,556 |
$11,825 |
$23,198 |
10/31/2021 |
$16,607 |
$16,990 |
$11,822 |
$24,767 |
11/30/2021 |
$16,394 |
$16,810 |
$11,857 |
$24,390 |
12/31/2021 |
$16,739 |
$17,160 |
$11,827 |
$25,350 |
1/31/2022 |
$16,137 |
$16,538 |
$11,572 |
$23,859 |
2/28/2022 |
$15,747 |
$16,310 |
$11,443 |
$23,258 |
3/31/2022 |
$15,609 |
$16,301 |
$11,125 |
$24,012 |
4/30/2022 |
$14,856 |
$15,400 |
$10,703 |
$21,857 |
5/31/2022 |
$14,956 |
$15,418 |
$10,772 |
$21,828 |
6/30/2022 |
$14,039 |
$14,541 |
$10,603 |
$20,002 |
7/31/2022 |
$14,667 |
$15,351 |
$10,862 |
$21,878 |
8/31/2022 |
$14,228 |
$14,877 |
$10,555 |
$21,062 |
9/30/2022 |
$13,349 |
$13,839 |
$10,099 |
$19,109 |
10/31/2022 |
$13,751 |
$14,293 |
$9,968 |
$20,676 |
11/30/2022 |
$14,391 |
$14,978 |
$10,335 |
$21,755 |
12/31/2022 |
$13,997 |
$14,627 |
$10,288 |
$20,481 |
1/31/2023 |
$14,626 |
$15,350 |
$10,604 |
$21,892 |
2/28/2023 |
$14,211 |
$15,000 |
$10,330 |
$21,380 |
3/31/2023 |
$14,479 |
$15,363 |
$10,593 |
$21,952 |
4/30/2023 |
$14,559 |
$15,500 |
$10,657 |
$22,186 |
5/31/2023 |
$14,439 |
$15,350 |
$10,541 |
$22,272 |
6/30/2023 |
$14,920 |
$15,795 |
$10,503 |
$23,793 |
7/31/2023 |
$15,214 |
$16,098 |
$10,496 |
$24,646 |
8/31/2023 |
$15,013 |
$15,856 |
$10,429 |
$24,170 |
9/30/2023 |
$14,546 |
$15,373 |
$10,164 |
$23,019 |
10/31/2023 |
$14,185 |
$15,048 |
$10,003 |
$22,408 |
11/30/2023 |
$15,054 |
$16,017 |
$10,456 |
$24,498 |
12/31/2023 |
$15,684 |
$16,704 |
$10,857 |
$25,797 |
1/31/2024 |
$15,657 |
$16,733 |
$10,827 |
$26,083 |
2/29/2024 |
$16,005 |
$17,002 |
$10,674 |
$27,495 |
3/31/2024 |
$16,407 |
$17,341 |
$10,773 |
$28,382 |
4/30/2024 |
$15,844 |
$16,874 |
$10,500 |
$27,133 |
5/31/2024 |
$16,338 |
$17,339 |
$10,678 |
$28,415 |
6/30/2024 |
$16,599 |
$17,594 |
$10,780 |
$29,295 |
7/31/2024 |
$16,846 |
$17,955 |
$11,031 |
$29,839 |
8/31/2024 |
$17,148 |
$18,278 |
$11,190 |
$30,489 |
9/30/2024 |
$17,422 |
$18,612 |
$11,340 |
$31,120 |
10/31/2024 |
$17,038 |
$18,259 |
$11,058 |
$30,891 |
11/30/2024 |
$17,628 |
$18,717 |
$11,175 |
$32,946 |
12/31/2024 |
$17,210 |
$18,351 |
$10,992 |
$31,939 |
1/31/2025 |
$17,495 |
$18,733 |
$11,051 |
$32,947 |
2/28/2025 |
$17,623 |
$18,836 |
$11,294 |
$32,316 |
3/31/2025 |
$17,196 |
$18,469 |
$11,298 |
$30,431 |
4/30/2025 |
$17,352 |
$18,545 |
$11,343 |
$30,227 |
5/31/2025 |
$17,779 |
$19,034 |
$11,261 |
$32,143 |
6/30/2025 |
$18,291 |
$19,585 |
$11,435 |
$33,776 |
7/31/2025 |
$18,362 |
$19,716 |
$11,404 |
$34,520 |
8/31/2025 |
$18,775 |
$20,095 |
$11,541 |
$35,318 |
9/30/2025 |
$19,344 |
$20,552 |
$11,667 |
$36,537 |
10/31/2025 |
$19,657 |
$20,829 |
$11,740 |
$37,320 |
11/30/2025 |
$19,699 |
$20,899 |
$11,813 |
$37,423 |
12/31/2025 |
$19,729 |
$20,991 |
$11,795 |
$37,415 |
1/31/2026 |
$20,380 |
$21,334 |
$11,808 |
$37,996 |
2/28/2026 |
$21,124 |
$21,600 |
$12,001 |
$37,815 |
3/31/2026 |
$20,318 |
$20,669 |
$11,789 |
$35,935 |
4/30/2026 |
$21,015 |
$21,828 |
$11,803 |
$39,601 |
|
| Average Annual Return [Table Text Block] |
|
|
Table Summary
AATR |
1 Year |
5 Years |
10 Years |
Class CFootnote Reference* |
20.19 |
5.53 |
7.71 |
Class C with LoadFootnote Reference* |
19.19 |
5.53 |
7.71 |
Spectrum Moderate Growth Blended IndexFootnote Reference† |
17.70 |
6.11 |
8.12 |
Bloomberg U.S. Aggregate Bond Index |
4.06 |
0.18 |
1.67 |
Russell 3000® Index |
31.01 |
11.91 |
14.75 | |
| No Deduction of Taxes [Text Block] |
|
|
do not reflect taxes that a shareholder may pay on an investment in a fund.
|
| AssetsNet |
|
|
$ 434,581,543
|
| Holdings Count | Holding |
|
|
36
|
| Advisory Fees Paid, Amount |
|
|
$ 837,849
|
| InvestmentCompanyPortfolioTurnover |
|
|
47.00%
|
| Additional Fund Statistics [Text Block] |
|
|
Table Summary
Total net assets |
$434,581,543 |
# of portfolio holdings |
36 |
Portfolio turnover rate |
47% |
Total advisory fees paid |
$837,849 | |
| Holdings [Text Block] |
|
|
ALLOCATION (% OF TOTAL INVESTMENTS)
Table Summary
Fund |
Effective AllocationFootnote Reference1 |
Stocks |
50.9 |
Bonds |
30.9 |
Inflation sensitive investments |
13.7 |
Alternative investments |
4.5 |
| Footnote |
Description |
Footnote1 |
Effective allocation is subject to change and may have changed since the date specified. Effective allocation excludes cash, and percent totals may not add to 100% due to rounding. | |
| Largest Holdings [Text Block] |
|
|
TOP TEN HOLDINGS (% OF NET ASSETS)
Table Summary
Allspring Disciplined Large Cap Portfolio |
19.2 |
Allspring Real Return Portfolio |
13.0 |
Allspring Income Plus ETF |
8.4 |
Allspring Broad Market Core Bond ETF |
6.1 |
Allspring Disciplined International Developed Markets Portfolio |
5.7 |
Allspring Diversified Income Builder Fund Class R6 |
5.3 |
Allspring Core Plus ETF |
4.6 |
iShares Core MSCI EAFE ETF |
4.5 |
Allspring Alternative Risk Premia Fund Class R6 |
4.3 |
Allspring High Yield Bond Fund Institutional Class |
4.0 | |
| Material Fund Change [Text Block] |
|
|
|
| C000205240 |
|
|
|
| Shareholder Report [Line Items] |
|
|
|
| Fund Name |
|
|
Spectrum Moderate Growth Fund
|
| Class Name |
|
|
Institutional Class
|
| Trading Symbol |
|
|
WGBIX
|
| Annual or Semi-Annual Statement [Text Block] |
|
|
This annual shareholder report contains important information about Spectrum Moderate Growth Fund for the period from May 1, 2025 to April 30, 2026.
|
| Additional Information [Text Block] |
|
|
You can find additional information about the Fund at allspringglobal.com. You can also request this information by contacting us at 1-800-222-8222.
|
| Additional Information Phone Number |
|
|
<span style="white-space: nowrap; box-sizing: border-box; color: rgb(0, 0, 0); display: inline; flex-wrap: nowrap; font-size: 12px; font-weight: 400; grid-area: auto; line-height: 18px; margin: 0px; overflow: visible; text-align: left; text-align-last: auto;"> 1-800-222-8222.</span>
|
| Additional Information Website |
|
|
<span style="box-sizing: border-box; color: rgb(0, 0, 0); display: inline; flex-wrap: nowrap; font-size: 12px; font-weight: 400; grid-area: auto; line-height: 18px; margin: 0px; overflow: visible; text-align: left; text-align-last: auto; white-space-collapse: preserve-breaks;">allspringglobal.com</span>
|
| Expenses [Text Block] |
|
|
What were the Fund costs for the past year?The table explains the costs you would have paid within the reporting period based on a hypothetical $10,000 investment.
Table Summary
CLASS NAME |
COSTS OF A $10,000 INVESTMENT |
COSTS PAID AS A % OF A $10,000 INVESTMENT |
Institutional Class |
$42 |
0.38% | The manager has contractually committed to waive fees and/or reimburse certain expenses to the extent necessary to cap the Fund's total annual fund operating expense ratio at a specific amount. Without this cap, the costs shown above may have been higher. Please see the prospectus for the amount and the expiration date of the cap. Prior to or after the commitment expiration date, the cap may be increased or the commitment to maintain the cap may be terminated only with the approval of the Board of Trustees. |
| Expenses Paid, Amount |
|
|
$ 42
|
| Expense Ratio, Percent |
|
|
0.38%
|
| Factors Affecting Performance [Text Block] |
|
|
How did the Fund perform last year and what affected its performance?The Fund outperformed its benchmark for the period. The past year saw a wide set of narratives drive the economy and financial markets. From an initial focus on the impact of tariffs, markets swiftly moved onto the opportunities within artificial intelligence (AI) followed by a U.S. government shutdown. While narratives shifted, domestic growth remained above trend, supported initially by AI-driven capital expenditures and resilient consumer spending. Outside the U.S., investment opportunities were divergent. Globally, expectations for earnings growth remain concentrated on a single theme: AI. There were limited portfolio changes over the past 12 months. In fixed income, we reduced U.S. Treasury bond exposure and added to our U.S. core bond allocation. Security selection added to performance in our inflation-protected, alternative risk premia, and developed international equity strategies. Underperformance from active large and small-cap growth and value strategies detracted from relative performance. |
| Performance Past Does Not Indicate Future [Text] |
|
|
Figures quoted represent past performance, which is no guarantee of future results,
|
| Line Graph [Table Text Block] |
|
|
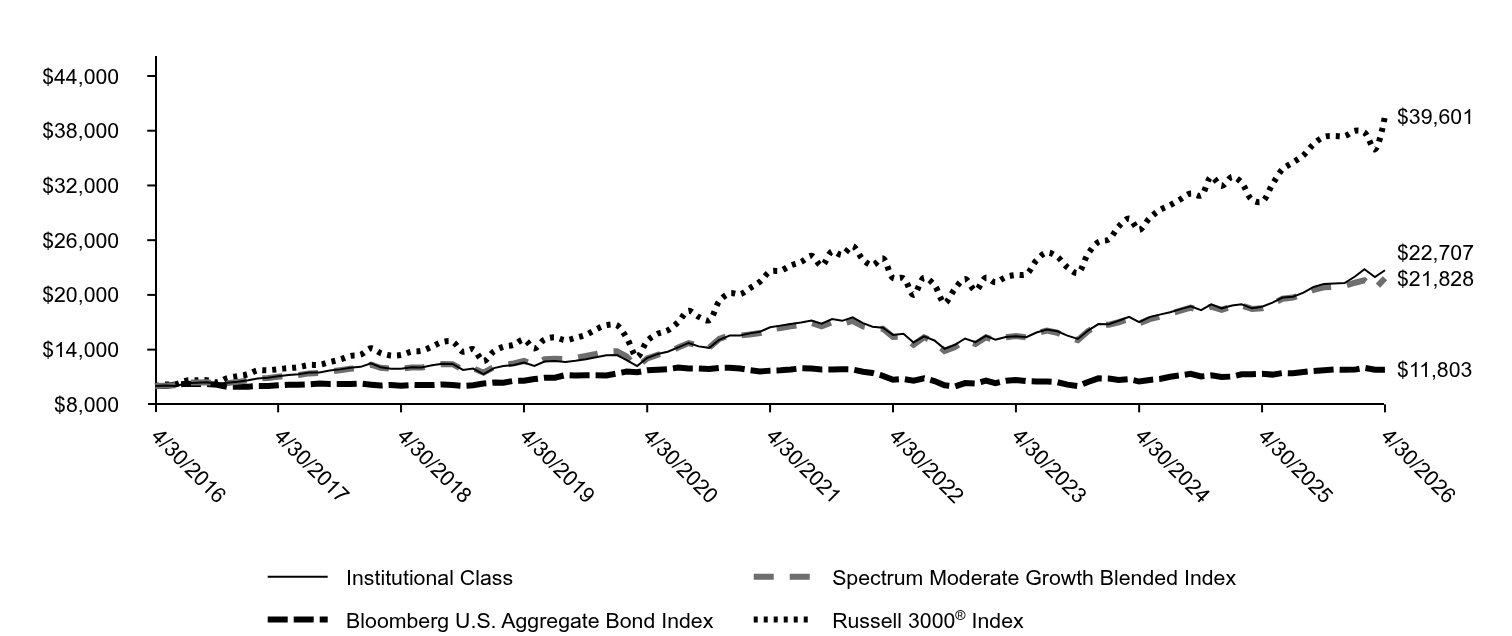
Table Summary
|
Institutional Class |
Spectrum Moderate Growth Blended Index |
Bloomberg U.S. Aggregate Bond Index |
Russell 3000® Index |
4/30/2016 |
$10,000 |
$10,000 |
$10,000 |
$10,000 |
5/31/2016 |
$10,068 |
$10,046 |
$10,003 |
$10,179 |
6/30/2016 |
$10,008 |
$10,099 |
$10,182 |
$10,200 |
7/31/2016 |
$10,318 |
$10,383 |
$10,247 |
$10,605 |
8/31/2016 |
$10,379 |
$10,401 |
$10,235 |
$10,632 |
9/30/2016 |
$10,424 |
$10,428 |
$10,229 |
$10,648 |
10/31/2016 |
$10,265 |
$10,275 |
$10,151 |
$10,418 |
11/30/2016 |
$10,371 |
$10,328 |
$9,911 |
$10,884 |
12/31/2016 |
$10,474 |
$10,466 |
$9,925 |
$11,097 |
1/31/2017 |
$10,655 |
$10,624 |
$9,944 |
$11,305 |
2/28/2017 |
$10,844 |
$10,849 |
$10,011 |
$11,726 |
3/31/2017 |
$10,923 |
$10,899 |
$10,006 |
$11,734 |
4/30/2017 |
$11,072 |
$11,023 |
$10,083 |
$11,858 |
5/31/2017 |
$11,214 |
$11,169 |
$10,160 |
$11,980 |
6/30/2017 |
$11,308 |
$11,213 |
$10,150 |
$12,088 |
7/31/2017 |
$11,505 |
$11,395 |
$10,194 |
$12,316 |
8/31/2017 |
$11,505 |
$11,456 |
$10,285 |
$12,339 |
9/30/2017 |
$11,710 |
$11,590 |
$10,236 |
$12,640 |
10/31/2017 |
$11,836 |
$11,738 |
$10,242 |
$12,916 |
11/30/2017 |
$12,001 |
$11,899 |
$10,229 |
$13,308 |
12/31/2017 |
$12,111 |
$12,019 |
$10,276 |
$13,441 |
1/31/2018 |
$12,492 |
$12,350 |
$10,158 |
$14,150 |
2/28/2018 |
$12,074 |
$12,007 |
$10,061 |
$13,628 |
3/31/2018 |
$11,911 |
$11,899 |
$10,126 |
$13,355 |
4/30/2018 |
$11,911 |
$11,916 |
$10,051 |
$13,406 |
5/31/2018 |
$12,056 |
$12,042 |
$10,122 |
$13,784 |
6/30/2018 |
$12,047 |
$12,029 |
$10,110 |
$13,874 |
7/31/2018 |
$12,283 |
$12,249 |
$10,112 |
$14,335 |
8/31/2018 |
$12,447 |
$12,415 |
$10,177 |
$14,838 |
9/30/2018 |
$12,438 |
$12,402 |
$10,112 |
$14,863 |
10/31/2018 |
$11,775 |
$11,798 |
$10,032 |
$13,768 |
11/30/2018 |
$11,920 |
$11,945 |
$10,092 |
$14,044 |
12/31/2018 |
$11,316 |
$11,469 |
$10,277 |
$12,737 |
1/31/2019 |
$11,976 |
$12,087 |
$10,386 |
$13,830 |
2/28/2019 |
$12,207 |
$12,305 |
$10,380 |
$14,316 |
3/31/2019 |
$12,322 |
$12,488 |
$10,580 |
$14,526 |
4/30/2019 |
$12,574 |
$12,758 |
$10,582 |
$15,106 |
5/31/2019 |
$12,207 |
$12,379 |
$10,770 |
$14,128 |
6/30/2019 |
$12,689 |
$12,940 |
$10,906 |
$15,120 |
7/31/2019 |
$12,741 |
$13,004 |
$10,930 |
$15,345 |
8/31/2019 |
$12,657 |
$12,956 |
$11,213 |
$15,032 |
9/30/2019 |
$12,783 |
$13,084 |
$11,153 |
$15,296 |
10/31/2019 |
$12,940 |
$13,300 |
$11,187 |
$15,625 |
11/30/2019 |
$13,171 |
$13,530 |
$11,181 |
$16,219 |
12/31/2019 |
$13,384 |
$13,796 |
$11,173 |
$16,688 |
1/31/2020 |
$13,406 |
$13,829 |
$11,388 |
$16,669 |
2/29/2020 |
$12,849 |
$13,257 |
$11,593 |
$15,305 |
3/31/2020 |
$12,197 |
$12,114 |
$11,525 |
$13,200 |
4/30/2020 |
$13,085 |
$13,040 |
$11,730 |
$14,948 |
5/31/2020 |
$13,523 |
$13,434 |
$11,784 |
$15,748 |
6/30/2020 |
$13,769 |
$13,706 |
$11,859 |
$16,108 |
7/31/2020 |
$14,240 |
$14,224 |
$12,036 |
$17,022 |
8/31/2020 |
$14,732 |
$14,721 |
$11,939 |
$18,255 |
9/30/2020 |
$14,358 |
$14,427 |
$11,932 |
$17,591 |
10/31/2020 |
$14,197 |
$14,215 |
$11,879 |
$17,211 |
11/30/2020 |
$15,075 |
$15,174 |
$11,995 |
$19,305 |
12/31/2020 |
$15,545 |
$15,578 |
$12,012 |
$20,173 |
1/31/2021 |
$15,545 |
$15,547 |
$11,926 |
$20,084 |
2/28/2021 |
$15,784 |
$15,660 |
$11,753 |
$20,711 |
3/31/2021 |
$15,963 |
$15,816 |
$11,607 |
$21,454 |
4/30/2021 |
$16,453 |
$16,230 |
$11,698 |
$22,560 |
5/31/2021 |
$16,632 |
$16,373 |
$11,737 |
$22,663 |
6/30/2021 |
$16,811 |
$16,562 |
$11,819 |
$23,222 |
7/31/2021 |
$16,966 |
$16,731 |
$11,951 |
$23,614 |
8/31/2021 |
$17,181 |
$16,929 |
$11,929 |
$24,288 |
9/30/2021 |
$16,847 |
$16,556 |
$11,825 |
$23,198 |
10/31/2021 |
$17,360 |
$16,990 |
$11,822 |
$24,767 |
11/30/2021 |
$17,157 |
$16,810 |
$11,857 |
$24,390 |
12/31/2021 |
$17,533 |
$17,160 |
$11,827 |
$25,350 |
1/31/2022 |
$16,910 |
$16,538 |
$11,572 |
$23,859 |
2/28/2022 |
$16,518 |
$16,310 |
$11,443 |
$23,258 |
3/31/2022 |
$16,396 |
$16,301 |
$11,125 |
$24,012 |
4/30/2022 |
$15,612 |
$15,400 |
$10,703 |
$21,857 |
5/31/2022 |
$15,733 |
$15,418 |
$10,772 |
$21,828 |
6/30/2022 |
$14,786 |
$14,541 |
$10,603 |
$20,002 |
7/31/2022 |
$15,463 |
$15,351 |
$10,862 |
$21,878 |
8/31/2022 |
$15,003 |
$14,877 |
$10,555 |
$21,062 |
9/30/2022 |
$14,096 |
$13,839 |
$10,099 |
$19,109 |
10/31/2022 |
$14,529 |
$14,293 |
$9,968 |
$20,676 |
11/30/2022 |
$15,219 |
$14,978 |
$10,335 |
$21,755 |
12/31/2022 |
$14,815 |
$14,627 |
$10,288 |
$20,481 |
1/31/2023 |
$15,502 |
$15,350 |
$10,604 |
$21,892 |
2/28/2023 |
$15,078 |
$15,000 |
$10,330 |
$21,380 |
3/31/2023 |
$15,385 |
$15,363 |
$10,593 |
$21,952 |
4/30/2023 |
$15,472 |
$15,500 |
$10,657 |
$22,186 |
5/31/2023 |
$15,355 |
$15,350 |
$10,541 |
$22,272 |
6/30/2023 |
$15,881 |
$15,795 |
$10,503 |
$23,793 |
7/31/2023 |
$16,203 |
$16,098 |
$10,496 |
$24,646 |
8/31/2023 |
$16,013 |
$15,856 |
$10,429 |
$24,170 |
9/30/2023 |
$15,531 |
$15,373 |
$10,164 |
$23,019 |
10/31/2023 |
$15,166 |
$15,048 |
$10,003 |
$22,408 |
11/30/2023 |
$16,086 |
$16,017 |
$10,456 |
$24,498 |
12/31/2023 |
$16,797 |
$16,704 |
$10,857 |
$25,797 |
1/31/2024 |
$16,782 |
$16,733 |
$10,827 |
$26,083 |
2/29/2024 |
$17,165 |
$17,002 |
$10,674 |
$27,495 |
3/31/2024 |
$17,606 |
$17,341 |
$10,773 |
$28,382 |
4/30/2024 |
$17,018 |
$16,874 |
$10,500 |
$27,133 |
5/31/2024 |
$17,562 |
$17,339 |
$10,678 |
$28,415 |
6/30/2024 |
$17,841 |
$17,594 |
$10,780 |
$29,295 |
7/31/2024 |
$18,106 |
$17,955 |
$11,031 |
$29,839 |
8/31/2024 |
$18,444 |
$18,278 |
$11,190 |
$30,489 |
9/30/2024 |
$18,739 |
$18,612 |
$11,340 |
$31,120 |
10/31/2024 |
$18,327 |
$18,259 |
$11,058 |
$30,891 |
11/30/2024 |
$18,974 |
$18,717 |
$11,175 |
$32,946 |
12/31/2024 |
$18,528 |
$18,351 |
$10,992 |
$31,939 |
1/31/2025 |
$18,834 |
$18,733 |
$11,051 |
$32,947 |
2/28/2025 |
$18,972 |
$18,836 |
$11,294 |
$32,316 |
3/31/2025 |
$18,528 |
$18,469 |
$11,298 |
$30,431 |
4/30/2025 |
$18,696 |
$18,545 |
$11,343 |
$30,227 |
5/31/2025 |
$19,155 |
$19,034 |
$11,261 |
$32,143 |
6/30/2025 |
$19,706 |
$19,585 |
$11,435 |
$33,776 |
7/31/2025 |
$19,798 |
$19,716 |
$11,404 |
$34,520 |
8/31/2025 |
$20,242 |
$20,095 |
$11,541 |
$35,318 |
9/30/2025 |
$20,869 |
$20,552 |
$11,667 |
$36,537 |
10/31/2025 |
$21,205 |
$20,829 |
$11,740 |
$37,320 |
11/30/2025 |
$21,251 |
$20,899 |
$11,813 |
$37,423 |
12/31/2025 |
$21,302 |
$20,991 |
$11,795 |
$37,415 |
1/31/2026 |
$22,021 |
$21,334 |
$11,808 |
$37,996 |
2/28/2026 |
$22,807 |
$21,600 |
$12,001 |
$37,815 |
3/31/2026 |
$21,954 |
$20,669 |
$11,789 |
$35,935 |
4/30/2026 |
$22,707 |
$21,828 |
$11,803 |
$39,601 |
|
| Average Annual Return [Table Text Block] |
|
|
Table Summary
AATR |
1 Year |
5 Years |
10 Years |
Institutional ClassFootnote Reference* |
21.45 |
6.66 |
8.55 |
Spectrum Moderate Growth Blended IndexFootnote Reference† |
17.70 |
6.11 |
8.12 |
Bloomberg U.S. Aggregate Bond Index |
4.06 |
0.18 |
1.67 |
Russell 3000® Index |
31.01 |
11.91 |
14.75 | |
| No Deduction of Taxes [Text Block] |
|
|
do not reflect taxes that a shareholder may pay on an investment in a fund.
|
| AssetsNet |
|
|
$ 434,581,543
|
| Holdings Count | Holding |
|
|
36
|
| Advisory Fees Paid, Amount |
|
|
$ 837,849
|
| InvestmentCompanyPortfolioTurnover |
|
|
47.00%
|
| Additional Fund Statistics [Text Block] |
|
|
Table Summary
Total net assets |
$434,581,543 |
# of portfolio holdings |
36 |
Portfolio turnover rate |
47% |
Total advisory fees paid |
$837,849 | |
| Holdings [Text Block] |
|
|
ALLOCATION (% OF TOTAL INVESTMENTS)
Table Summary
Fund |
Effective AllocationFootnote Reference1 |
Stocks |
50.9 |
Bonds |
30.9 |
Inflation sensitive investments |
13.7 |
Alternative investments |
4.5 |
| Footnote |
Description |
Footnote1 |
Effective allocation is subject to change and may have changed since the date specified. Effective allocation excludes cash, and percent totals may not add to 100% due to rounding. | |
| Largest Holdings [Text Block] |
|
|
TOP TEN HOLDINGS (% OF NET ASSETS)
Table Summary
Allspring Disciplined Large Cap Portfolio |
19.2 |
Allspring Real Return Portfolio |
13.0 |
Allspring Income Plus ETF |
8.4 |
Allspring Broad Market Core Bond ETF |
6.1 |
Allspring Disciplined International Developed Markets Portfolio |
5.7 |
Allspring Diversified Income Builder Fund Class R6 |
5.3 |
Allspring Core Plus ETF |
4.6 |
iShares Core MSCI EAFE ETF |
4.5 |
Allspring Alternative Risk Premia Fund Class R6 |
4.3 |
Allspring High Yield Bond Fund Institutional Class |
4.0 | |
| Material Fund Change [Text Block] |
|
|
|
| C000110554 |
|
|
|
| Shareholder Report [Line Items] |
|
|
|
| Fund Name |
|
|
Absolute Return Fund
|
| Class Name |
|
|
Class A
|
| Trading Symbol |
|
|
WARAX
|
| Annual or Semi-Annual Statement [Text Block] |
|
|
This annual shareholder report contains important information about Absolute Return Fund for the period from May 1, 2025 to April 30, 2026.
|
| Additional Information [Text Block] |
|
|
You can find additional information about the Fund at allspringglobal.com. You can also request this information by contacting us at 1-800-222-8222.
|
| Additional Information Phone Number |
|
|
<span style="white-space: nowrap; box-sizing: border-box; color: rgb(0, 0, 0); display: inline; flex-wrap: nowrap; font-size: 12px; font-weight: 400; grid-area: auto; line-height: 18px; margin: 0px; overflow: visible; text-align: left; text-align-last: auto;"> 1-800-222-8222.</span>
|
| Additional Information Website |
|
|
<span style="box-sizing: border-box; color: rgb(0, 0, 0); display: inline; flex-wrap: nowrap; font-size: 12px; font-weight: 400; grid-area: auto; line-height: 18px; margin: 0px; overflow: visible; text-align: left; text-align-last: auto; white-space-collapse: preserve-breaks;">allspringglobal.com</span>
|
| Expenses [Text Block] |
|
|
What were the Fund costs for the past year?The table explains the costs you would have paid within the reporting period based on a hypothetical $10,000 investment.
Table Summary
CLASS NAME |
COSTS OF A $10,000 INVESTMENT |
COSTS PAID AS A % OF A $10,000 INVESTMENT |
Class A |
$79 |
0.70% | The manager has contractually committed to waive fees and/or reimburse certain expenses to the extent necessary to cap the Fund's total annual fund operating expense ratio at a specific amount. Without this cap, the costs shown above may have been higher. Please see the prospectus for the amount and the expiration date of the cap. Prior to or after the commitment expiration date, the cap may be increased or the commitment to maintain the cap may be terminated only with the approval of the Board of Trustees. |
| Expenses Paid, Amount |
|
|
$ 79
|
| Expense Ratio, Percent |
|
|
0.70%
|
| Factors Affecting Performance [Text Block] |
|
|
How did the Fund perform last year and what affected its performance?The Fund outperformed its benchmark for the period. The past year saw a wide set of narratives drive the global economy and financial markets. From an initial focus on tariffs, markets swiftly moved onto opportunities within artificial intelligence (AI), followed by a U.S. government shutdown that led to a dearth of data. Geopolitical risk remained elevated. U.S. economic growth was above trend, supported initially by AI-driven capital expenditures and resilient consumer spending. Inflation remained above target. Outside the U.S., investment opportunities were divergent. Globally, expectations for earnings growth remain concentrated in a single theme: AI. We spent the bulk of the period with lower-than-benchmark exposure to U.S. assets, preferring emerging markets and developed ex U.S. equities. Early in 2026, we moderated this positioning slightly. We also increased the Fund's exposure to alternatives through the Alternative Risk Premia Strategy. That, along with tactical asset allocation, drove performance. No major portfolio components detracted significantly from the benchmark. |
| Performance Past Does Not Indicate Future [Text] |
|
|
Figures quoted represent past performance, which is no guarantee of future results,
|
| Line Graph [Table Text Block] |
|
|

Table Summary
|
Class A with Load |
Absolute Return Blended Index |
Bloomberg Global Aggregate Index Hedged (USD) |
MSCI ACWI Index (Net) |
4/30/2016 |
$9,421 |
$10,000 |
$10,000 |
$10,000 |
5/31/2016 |
$9,357 |
$9,992 |
$10,042 |
$10,013 |
6/30/2016 |
$9,393 |
$10,101 |
$10,233 |
$9,952 |
7/31/2016 |
$9,596 |
$10,302 |
$10,295 |
$10,381 |
8/31/2016 |
$9,642 |
$10,296 |
$10,289 |
$10,416 |
9/30/2016 |
$9,706 |
$10,338 |
$10,288 |
$10,480 |
10/31/2016 |
$9,632 |
$10,232 |
$10,188 |
$10,302 |
11/30/2016 |
$9,485 |
$10,140 |
$10,020 |
$10,380 |
12/31/2016 |
$9,576 |
$10,221 |
$10,048 |
$10,604 |
1/31/2017 |
$9,780 |
$10,338 |
$10,011 |
$10,894 |
2/28/2017 |
$9,919 |
$10,483 |
$10,097 |
$11,200 |
3/31/2017 |
$10,012 |
$10,524 |
$10,092 |
$11,337 |
4/30/2017 |
$10,095 |
$10,625 |
$10,160 |
$11,514 |
5/31/2017 |
$10,215 |
$10,724 |
$10,220 |
$11,768 |
6/30/2017 |
$10,262 |
$10,697 |
$10,191 |
$11,821 |
7/31/2017 |
$10,410 |
$10,829 |
$10,225 |
$12,152 |
8/31/2017 |
$10,493 |
$10,913 |
$10,318 |
$12,198 |
9/30/2017 |
$10,475 |
$10,947 |
$10,270 |
$12,434 |
10/31/2017 |
$10,632 |
$11,049 |
$10,313 |
$12,692 |
11/30/2017 |
$10,604 |
$11,134 |
$10,329 |
$12,938 |
12/31/2017 |
$10,737 |
$11,240 |
$10,353 |
$13,146 |
1/31/2018 |
$11,104 |
$11,404 |
$10,279 |
$13,888 |
2/28/2018 |
$10,859 |
$11,190 |
$10,255 |
$13,305 |
3/31/2018 |
$10,803 |
$11,175 |
$10,340 |
$13,020 |
4/30/2018 |
$10,746 |
$11,198 |
$10,302 |
$13,144 |
5/31/2018 |
$10,689 |
$11,232 |
$10,341 |
$13,161 |
6/30/2018 |
$10,539 |
$11,232 |
$10,360 |
$13,089 |
7/31/2018 |
$10,680 |
$11,333 |
$10,363 |
$13,484 |
8/31/2018 |
$10,548 |
$11,403 |
$10,394 |
$13,590 |
9/30/2018 |
$10,576 |
$11,365 |
$10,355 |
$13,649 |
10/31/2018 |
$10,190 |
$11,004 |
$10,334 |
$12,626 |
11/30/2018 |
$10,275 |
$11,095 |
$10,385 |
$12,811 |
12/31/2018 |
$10,114 |
$10,890 |
$10,535 |
$11,909 |
1/31/2019 |
$10,598 |
$11,277 |
$10,647 |
$12,849 |
2/28/2019 |
$10,627 |
$11,386 |
$10,659 |
$13,193 |
3/31/2019 |
$10,646 |
$11,571 |
$10,850 |
$13,359 |
4/30/2019 |
$10,791 |
$11,723 |
$10,857 |
$13,810 |
5/31/2019 |
$10,491 |
$11,598 |
$11,013 |
$12,990 |
6/30/2019 |
$10,791 |
$11,948 |
$11,167 |
$13,841 |
7/31/2019 |
$10,695 |
$12,003 |
$11,255 |
$13,882 |
8/31/2019 |
$10,482 |
$12,085 |
$11,511 |
$13,552 |
9/30/2019 |
$10,646 |
$12,100 |
$11,457 |
$13,837 |
10/31/2019 |
$10,811 |
$12,220 |
$11,437 |
$14,216 |
11/30/2019 |
$10,859 |
$12,327 |
$11,424 |
$14,563 |
12/31/2019 |
$11,199 |
$12,487 |
$11,401 |
$15,076 |
1/31/2020 |
$10,921 |
$12,598 |
$11,606 |
$14,910 |
2/29/2020 |
$10,573 |
$12,350 |
$11,748 |
$13,705 |
3/31/2020 |
$9,402 |
$11,632 |
$11,566 |
$11,855 |
4/30/2020 |
$10,037 |
$12,238 |
$11,753 |
$13,125 |
5/31/2020 |
$9,988 |
$12,448 |
$11,786 |
$13,696 |
6/30/2020 |
$10,107 |
$12,654 |
$11,845 |
$14,133 |
7/31/2020 |
$10,405 |
$13,032 |
$11,974 |
$14,881 |
8/31/2020 |
$10,405 |
$13,332 |
$11,888 |
$15,792 |
9/30/2020 |
$10,325 |
$13,179 |
$11,931 |
$15,283 |
10/31/2020 |
$10,315 |
$13,038 |
$11,932 |
$14,911 |
11/30/2020 |
$10,653 |
$13,674 |
$12,000 |
$16,749 |
12/31/2020 |
$10,835 |
$13,963 |
$12,037 |
$17,527 |
1/31/2021 |
$10,917 |
$13,935 |
$11,972 |
$17,447 |
2/28/2021 |
$11,061 |
$13,904 |
$11,786 |
$17,851 |
3/31/2021 |
$11,348 |
$14,009 |
$11,740 |
$18,328 |
4/30/2021 |
$11,358 |
$14,303 |
$11,770 |
$19,129 |
5/31/2021 |
$11,635 |
$14,451 |
$11,797 |
$19,427 |
6/30/2021 |
$11,389 |
$14,569 |
$11,854 |
$19,683 |
7/31/2021 |
$11,173 |
$14,794 |
$12,001 |
$19,819 |
8/31/2021 |
$11,204 |
$14,906 |
$11,977 |
$20,315 |
9/30/2021 |
$11,153 |
$14,611 |
$11,864 |
$19,475 |
10/31/2021 |
$10,989 |
$14,919 |
$11,833 |
$20,470 |
11/30/2021 |
$10,763 |
$14,872 |
$11,918 |
$19,977 |
12/31/2021 |
$11,078 |
$15,078 |
$11,869 |
$20,776 |
1/31/2022 |
$11,364 |
$14,641 |
$11,683 |
$19,755 |
2/28/2022 |
$11,099 |
$14,494 |
$11,527 |
$19,245 |
3/31/2022 |
$10,856 |
$14,416 |
$11,279 |
$19,662 |
4/30/2022 |
$10,803 |
$13,793 |
$10,976 |
$18,088 |
5/31/2022 |
$10,993 |
$13,745 |
$10,961 |
$18,109 |
6/30/2022 |
$10,443 |
$13,124 |
$10,794 |
$16,583 |
7/31/2022 |
$10,527 |
$13,745 |
$11,069 |
$17,741 |
8/31/2022 |
$10,443 |
$13,333 |
$10,780 |
$17,088 |
9/30/2022 |
$10,030 |
$12,449 |
$10,434 |
$15,452 |
10/31/2022 |
$10,210 |
$12,753 |
$10,399 |
$16,384 |
11/30/2022 |
$10,845 |
$13,278 |
$10,664 |
$17,655 |
12/31/2022 |
$10,775 |
$13,001 |
$10,538 |
$16,960 |
1/31/2023 |
$11,230 |
$13,500 |
$10,780 |
$18,176 |
2/28/2023 |
$11,078 |
$13,236 |
$10,608 |
$17,655 |
3/31/2023 |
$11,035 |
$13,600 |
$10,844 |
$18,200 |
4/30/2023 |
$11,187 |
$13,695 |
$10,900 |
$18,461 |
5/31/2023 |
$10,851 |
$13,570 |
$10,857 |
$18,263 |
6/30/2023 |
$11,263 |
$13,828 |
$10,850 |
$19,324 |
7/31/2023 |
$11,620 |
$14,012 |
$10,854 |
$20,031 |
8/31/2023 |
$11,436 |
$13,826 |
$10,840 |
$19,471 |
9/30/2023 |
$11,447 |
$13,465 |
$10,653 |
$18,666 |
10/31/2023 |
$11,176 |
$13,261 |
$10,577 |
$18,105 |
11/30/2023 |
$11,620 |
$13,951 |
$10,941 |
$19,776 |
12/31/2023 |
$12,124 |
$14,451 |
$11,291 |
$20,726 |
1/31/2024 |
$12,090 |
$14,481 |
$11,269 |
$20,847 |
2/29/2024 |
$12,157 |
$14,615 |
$11,191 |
$21,742 |
3/31/2024 |
$12,503 |
$14,857 |
$11,292 |
$22,425 |
4/30/2024 |
$12,113 |
$14,526 |
$11,110 |
$21,685 |
5/31/2024 |
$12,302 |
$14,858 |
$11,209 |
$22,566 |
6/30/2024 |
$12,480 |
$15,053 |
$11,306 |
$23,068 |
7/31/2024 |
$12,759 |
$15,320 |
$11,524 |
$23,440 |
8/31/2024 |
$12,904 |
$15,548 |
$11,651 |
$24,035 |
9/30/2024 |
$13,026 |
$15,810 |
$11,786 |
$24,594 |
10/31/2024 |
$12,714 |
$15,523 |
$11,626 |
$24,042 |
11/30/2024 |
$13,093 |
$15,808 |
$11,764 |
$24,941 |
12/31/2024 |
$12,851 |
$15,553 |
$11,674 |
$24,351 |
1/31/2025 |
$13,048 |
$15,824 |
$11,719 |
$25,168 |
2/28/2025 |
$13,271 |
$15,969 |
$11,861 |
$25,016 |
3/31/2025 |
$13,110 |
$15,764 |
$11,811 |
$24,028 |
4/30/2025 |
$12,826 |
$15,868 |
$11,927 |
$24,252 |
5/31/2025 |
$12,814 |
$16,139 |
$11,888 |
$25,646 |
6/30/2025 |
$12,863 |
$16,493 |
$12,002 |
$26,798 |
7/31/2025 |
$12,814 |
$16,574 |
$11,992 |
$27,161 |
8/31/2025 |
$13,086 |
$16,834 |
$12,058 |
$27,832 |
9/30/2025 |
$13,530 |
$17,110 |
$12,147 |
$28,840 |
10/31/2025 |
$13,790 |
$17,306 |
$12,243 |
$29,485 |
11/30/2025 |
$13,802 |
$17,327 |
$12,268 |
$29,482 |
12/31/2025 |
$13,890 |
$17,355 |
$12,242 |
$29,790 |
1/31/2026 |
$15,024 |
$17,567 |
$12,272 |
$30,673 |
2/28/2026 |
$15,768 |
$17,800 |
$12,444 |
$31,067 |
3/31/2026 |
$15,894 |
$17,175 |
$12,223 |
$28,836 |
4/30/2026 |
$16,108 |
$17,871 |
$12,260 |
$31,770 |
|
| Average Annual Return [Table Text Block] |
|
|
Table Summary
AATR |
1 Year |
5 Years |
10 Years |
Class A |
25.59 |
7.24 |
5.51 |
Class A with Load |
18.40 |
5.97 |
4.88 |
Absolute Return Blended IndexFootnote Reference* |
12.62 |
4.56 |
5.98 |
Bloomberg Global Aggregate Index Hedged (USD) |
2.79 |
0.82 |
2.06 |
MSCI ACWI Index (Net) |
31.00 |
10.68 |
12.25 | |
| No Deduction of Taxes [Text Block] |
|
|
do not reflect taxes that a shareholder may pay on an investment in a fund.
|
| AssetsNet |
|
|
$ 454,532,175
|
| Holdings Count | Holding |
|
|
9
|
| Advisory Fees Paid, Amount |
|
|
$ 1,014,911
|
| InvestmentCompanyPortfolioTurnover |
|
|
38.00%
|
| Additional Fund Statistics [Text Block] |
|
|
Table Summary
Total net assets |
$454,532,175 |
# of portfolio holdings |
9 |
Portfolio turnover rate |
38% |
Total advisory fees paid |
$1,014,911 | |
| Holdings [Text Block] |
|
|
PORTFOLIO COMPOSITION (% OF LONG-TERM INVESTMENTS)
Table Summary
Commodities |
21.8 |
Treasuries (Including inflation linked) |
20.7 |
Alternative investments |
17.3 |
Emerging markets equities |
13.5 |
U.S. equities |
12.9 |
Global credit |
7.3 |
International developed equities |
6.5 | |
| Largest Holdings [Text Block] |
|
|
TOP HOLDINGS (% OF NET ASSETS)
Table Summary
Allspring Macro Strategies Portfolio |
48.5 |
Allspring Alternative Risk Premia Fund Class R6 |
18.7 |
Allspring Income Plus ETF |
7.9 |
Allspring Disciplined Large Cap Portfolio |
5.7 |
Allspring Emerging Markets Equity Advantage Fund Class R6 |
5.4 |
Allspring Disciplined International Developed Markets Portfolio |
4.5 |
iShares MSCI South Korea ETF |
4.4 |
iShares MSCI Brazil ETF |
3.9 | |
| Material Fund Change [Text Block] |
|
|
|
| C000110555 |
|
|
|
| Shareholder Report [Line Items] |
|
|
|
| Fund Name |
|
|
Absolute Return Fund
|
| Class Name |
|
|
Class C
|
| Trading Symbol |
|
|
WARCX
|
| Annual or Semi-Annual Statement [Text Block] |
|
|
This annual shareholder report contains important information about Absolute Return Fund for the period from May 1, 2025 to April 30, 2026.
|
| Additional Information [Text Block] |
|
|
You can find additional information about the Fund at allspringglobal.com. You can also request this information by contacting us at 1-800-222-8222.
|
| Additional Information Phone Number |
|
|
<span style="white-space: nowrap; box-sizing: border-box; color: rgb(0, 0, 0); display: inline; flex-wrap: nowrap; font-size: 12px; font-weight: 400; grid-area: auto; line-height: 18px; margin: 0px; overflow: visible; text-align: left; text-align-last: auto;"> 1-800-222-8222.</span>
|
| Additional Information Website |
|
|
<span style="box-sizing: border-box; color: rgb(0, 0, 0); display: inline; flex-wrap: nowrap; font-size: 12px; font-weight: 400; grid-area: auto; line-height: 18px; margin: 0px; overflow: visible; text-align: left; text-align-last: auto; white-space-collapse: preserve-breaks;">allspringglobal.com</span>
|
| Expenses [Text Block] |
|
|
What were the Fund costs for the past year?The table explains the costs you would have paid within the reporting period based on a hypothetical $10,000 investment.
Table Summary
CLASS NAME |
COSTS OF A $10,000 INVESTMENT |
COSTS PAID AS A % OF A $10,000 INVESTMENT |
Class C |
$163 |
1.45% | The manager has contractually committed to waive fees and/or reimburse certain expenses to the extent necessary to cap the Fund's total annual fund operating expense ratio at a specific amount. Without this cap, the costs shown above may have been higher. Please see the prospectus for the amount and the expiration date of the cap. Prior to or after the commitment expiration date, the cap may be increased or the commitment to maintain the cap may be terminated only with the approval of the Board of Trustees. |
| Expenses Paid, Amount |
|
|
$ 163
|
| Expense Ratio, Percent |
|
|
1.45%
|
| Factors Affecting Performance [Text Block] |
|
|
How did the Fund perform last year and what affected its performance?The Fund outperformed its benchmark for the period. The past year saw a wide set of narratives drive the global economy and financial markets. From an initial focus on tariffs, markets swiftly moved onto opportunities within artificial intelligence (AI), followed by a U.S. government shutdown that led to a dearth of data. Geopolitical risk remained elevated. U.S. economic growth was above trend, supported initially by AI-driven capital expenditures and resilient consumer spending. Inflation remained above target. Outside the U.S., investment opportunities were divergent. Globally, expectations for earnings growth remain concentrated in a single theme: AI. We spent the bulk of the period with lower-than-benchmark exposure to U.S. assets, preferring emerging markets and developed ex U.S. equities. Early in 2026, we moderated this positioning slightly. We also increased the Fund's exposure to alternatives through the Alternative Risk Premia Strategy. That, along with tactical asset allocation, drove performance. No major portfolio components detracted significantly from the benchmark. |
| Performance Past Does Not Indicate Future [Text] |
|
|
Figures quoted represent past performance, which is no guarantee of future results,
|
| Line Graph [Table Text Block] |
|
|
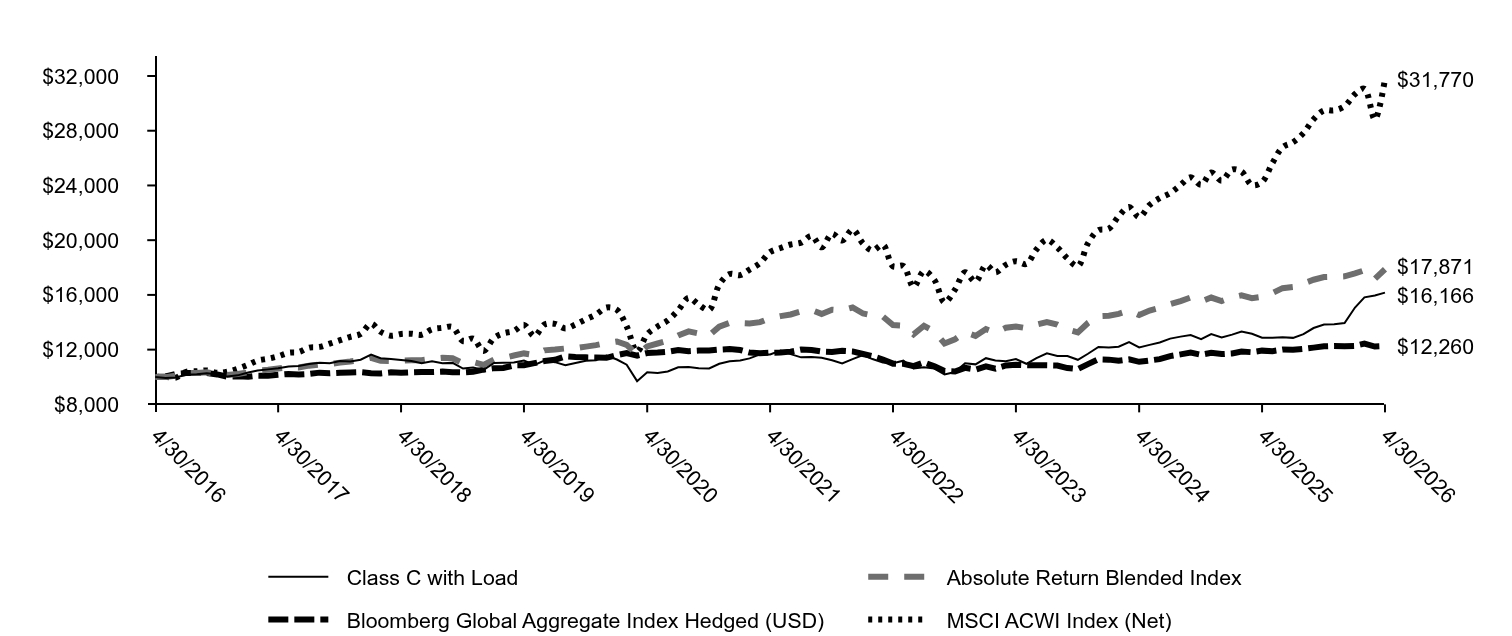
Table Summary
|
Class C with Load |
Absolute Return Blended Index |
Bloomberg Global Aggregate Index Hedged (USD) |
MSCI ACWI Index (Net) |
4/30/2016 |
$10,000 |
$10,000 |
$10,000 |
$10,000 |
5/31/2016 |
$9,930 |
$9,992 |
$10,042 |
$10,013 |
6/30/2016 |
$9,960 |
$10,101 |
$10,233 |
$9,952 |
7/31/2016 |
$10,169 |
$10,302 |
$10,295 |
$10,381 |
8/31/2016 |
$10,209 |
$10,296 |
$10,289 |
$10,416 |
9/30/2016 |
$10,279 |
$10,338 |
$10,288 |
$10,480 |
10/31/2016 |
$10,199 |
$10,232 |
$10,188 |
$10,302 |
11/30/2016 |
$10,030 |
$10,140 |
$10,020 |
$10,380 |
12/31/2016 |
$10,119 |
$10,221 |
$10,048 |
$10,604 |
1/31/2017 |
$10,328 |
$10,338 |
$10,011 |
$10,894 |
2/28/2017 |
$10,478 |
$10,483 |
$10,097 |
$11,200 |
3/31/2017 |
$10,557 |
$10,524 |
$10,092 |
$11,337 |
4/30/2017 |
$10,647 |
$10,625 |
$10,160 |
$11,514 |
5/31/2017 |
$10,766 |
$10,724 |
$10,220 |
$11,768 |
6/30/2017 |
$10,806 |
$10,697 |
$10,191 |
$11,821 |
7/31/2017 |
$10,955 |
$10,829 |
$10,225 |
$12,152 |
8/31/2017 |
$11,035 |
$10,913 |
$10,318 |
$12,198 |
9/30/2017 |
$11,005 |
$10,947 |
$10,270 |
$12,434 |
10/31/2017 |
$11,164 |
$11,049 |
$10,313 |
$12,692 |
11/30/2017 |
$11,134 |
$11,134 |
$10,329 |
$12,938 |
12/31/2017 |
$11,263 |
$11,240 |
$10,353 |
$13,146 |
1/31/2018 |
$11,644 |
$11,404 |
$10,279 |
$13,888 |
2/28/2018 |
$11,373 |
$11,190 |
$10,255 |
$13,305 |
3/31/2018 |
$11,313 |
$11,175 |
$10,340 |
$13,020 |
4/30/2018 |
$11,243 |
$11,198 |
$10,302 |
$13,144 |
5/31/2018 |
$11,172 |
$11,232 |
$10,341 |
$13,161 |
6/30/2018 |
$11,011 |
$11,232 |
$10,360 |
$13,089 |
7/31/2018 |
$11,152 |
$11,333 |
$10,363 |
$13,484 |
8/31/2018 |
$11,011 |
$11,403 |
$10,394 |
$13,590 |
9/30/2018 |
$11,032 |
$11,365 |
$10,355 |
$13,649 |
10/31/2018 |
$10,620 |
$11,004 |
$10,334 |
$12,626 |
11/30/2018 |
$10,700 |
$11,095 |
$10,385 |
$12,811 |
12/31/2018 |
$10,522 |
$10,890 |
$10,535 |
$11,909 |
1/31/2019 |
$11,023 |
$11,277 |
$10,647 |
$12,849 |
2/28/2019 |
$11,044 |
$11,386 |
$10,659 |
$13,193 |
3/31/2019 |
$11,054 |
$11,571 |
$10,850 |
$13,359 |
4/30/2019 |
$11,207 |
$11,723 |
$10,857 |
$13,810 |
5/31/2019 |
$10,890 |
$11,598 |
$11,013 |
$12,990 |
6/30/2019 |
$11,197 |
$11,948 |
$11,167 |
$13,841 |
7/31/2019 |
$11,085 |
$12,003 |
$11,255 |
$13,882 |
8/31/2019 |
$10,860 |
$12,085 |
$11,511 |
$13,552 |
9/30/2019 |
$11,023 |
$12,100 |
$11,457 |
$13,837 |
10/31/2019 |
$11,187 |
$12,220 |
$11,437 |
$14,216 |
11/30/2019 |
$11,228 |
$12,327 |
$11,424 |
$14,563 |
12/31/2019 |
$11,568 |
$12,487 |
$11,401 |
$15,076 |
1/31/2020 |
$11,277 |
$12,598 |
$11,606 |
$14,910 |
2/29/2020 |
$10,903 |
$12,350 |
$11,748 |
$13,705 |
3/31/2020 |
$9,697 |
$11,632 |
$11,566 |
$11,855 |
4/30/2020 |
$10,342 |
$12,238 |
$11,753 |
$13,125 |
5/31/2020 |
$10,290 |
$12,448 |
$11,786 |
$13,696 |
6/30/2020 |
$10,404 |
$12,654 |
$11,845 |
$14,133 |
7/31/2020 |
$10,705 |
$13,032 |
$11,974 |
$14,881 |
8/31/2020 |
$10,726 |
$13,332 |
$11,888 |
$15,792 |
9/30/2020 |
$10,633 |
$13,179 |
$11,931 |
$15,283 |
10/31/2020 |
$10,622 |
$13,038 |
$11,932 |
$14,911 |
11/30/2020 |
$10,965 |
$13,674 |
$12,000 |
$16,749 |
12/31/2020 |
$11,148 |
$13,963 |
$12,037 |
$17,527 |
1/31/2021 |
$11,212 |
$13,935 |
$11,972 |
$17,447 |
2/28/2021 |
$11,362 |
$13,904 |
$11,786 |
$17,851 |
3/31/2021 |
$11,651 |
$14,009 |
$11,740 |
$18,328 |
4/30/2021 |
$11,651 |
$14,303 |
$11,770 |
$19,129 |
5/31/2021 |
$11,929 |
$14,451 |
$11,797 |
$19,427 |
6/30/2021 |
$11,672 |
$14,569 |
$11,854 |
$19,683 |
7/31/2021 |
$11,437 |
$14,794 |
$12,001 |
$19,819 |
8/31/2021 |
$11,469 |
$14,906 |
$11,977 |
$20,315 |
9/30/2021 |
$11,405 |
$14,611 |
$11,864 |
$19,475 |
10/31/2021 |
$11,223 |
$14,919 |
$11,833 |
$20,470 |
11/30/2021 |
$10,988 |
$14,872 |
$11,918 |
$19,977 |
12/31/2021 |
$11,311 |
$15,078 |
$11,869 |
$20,776 |
1/31/2022 |
$11,602 |
$14,641 |
$11,683 |
$19,755 |
2/28/2022 |
$11,311 |
$14,494 |
$11,527 |
$19,245 |
3/31/2022 |
$11,053 |
$14,416 |
$11,279 |
$19,662 |
4/30/2022 |
$10,999 |
$13,793 |
$10,976 |
$18,088 |
5/31/2022 |
$11,193 |
$13,745 |
$10,961 |
$18,109 |
6/30/2022 |
$10,622 |
$13,124 |
$10,794 |
$16,583 |
7/31/2022 |
$10,708 |
$13,745 |
$11,069 |
$17,741 |
8/31/2022 |
$10,612 |
$13,333 |
$10,780 |
$17,088 |
9/30/2022 |
$10,181 |
$12,449 |
$10,434 |
$15,452 |
10/31/2022 |
$10,364 |
$12,753 |
$10,399 |
$16,384 |
11/30/2022 |
$10,999 |
$13,278 |
$10,664 |
$17,655 |
12/31/2022 |
$10,924 |
$13,001 |
$10,538 |
$16,960 |
1/31/2023 |
$11,376 |
$13,500 |
$10,780 |
$18,176 |
2/28/2023 |
$11,214 |
$13,236 |
$10,608 |
$17,655 |
3/31/2023 |
$11,160 |
$13,600 |
$10,844 |
$18,200 |
4/30/2023 |
$11,311 |
$13,695 |
$10,900 |
$18,461 |
5/31/2023 |
$10,967 |
$13,570 |
$10,857 |
$18,263 |
6/30/2023 |
$11,376 |
$13,828 |
$10,850 |
$19,324 |
7/31/2023 |
$11,731 |
$14,012 |
$10,854 |
$20,031 |
8/31/2023 |
$11,537 |
$13,826 |
$10,840 |
$19,471 |
9/30/2023 |
$11,537 |
$13,465 |
$10,653 |
$18,666 |
10/31/2023 |
$11,257 |
$13,261 |
$10,577 |
$18,105 |
11/30/2023 |
$11,699 |
$13,951 |
$10,941 |
$19,776 |
12/31/2023 |
$12,200 |
$14,451 |
$11,291 |
$20,726 |
1/31/2024 |
$12,156 |
$14,481 |
$11,269 |
$20,847 |
2/29/2024 |
$12,211 |
$14,615 |
$11,191 |
$21,742 |
3/31/2024 |
$12,548 |
$14,857 |
$11,292 |
$22,425 |
4/30/2024 |
$12,156 |
$14,526 |
$11,110 |
$21,685 |
5/31/2024 |
$12,346 |
$14,858 |
$11,209 |
$22,566 |
6/30/2024 |
$12,525 |
$15,053 |
$11,306 |
$23,068 |
7/31/2024 |
$12,805 |
$15,320 |
$11,524 |
$23,440 |
8/31/2024 |
$12,950 |
$15,548 |
$11,651 |
$24,035 |
9/30/2024 |
$13,073 |
$15,810 |
$11,786 |
$24,594 |
10/31/2024 |
$12,760 |
$15,523 |
$11,626 |
$24,042 |
11/30/2024 |
$13,140 |
$15,808 |
$11,764 |
$24,941 |
12/31/2024 |
$12,897 |
$15,553 |
$11,674 |
$24,351 |
1/31/2025 |
$13,095 |
$15,824 |
$11,719 |
$25,168 |
2/28/2025 |
$13,319 |
$15,969 |
$11,861 |
$25,016 |
3/31/2025 |
$13,157 |
$15,764 |
$11,811 |
$24,028 |
4/30/2025 |
$12,872 |
$15,868 |
$11,927 |
$24,252 |
5/31/2025 |
$12,860 |
$16,139 |
$11,888 |
$25,646 |
6/30/2025 |
$12,909 |
$16,493 |
$12,002 |
$26,798 |
7/31/2025 |
$12,860 |
$16,574 |
$11,992 |
$27,161 |
8/31/2025 |
$13,133 |
$16,834 |
$12,058 |
$27,832 |
9/30/2025 |
$13,579 |
$17,110 |
$12,147 |
$28,840 |
10/31/2025 |
$13,839 |
$17,306 |
$12,243 |
$29,485 |
11/30/2025 |
$13,852 |
$17,327 |
$12,268 |
$29,482 |
12/31/2025 |
$13,939 |
$17,355 |
$12,242 |
$29,790 |
1/31/2026 |
$15,078 |
$17,567 |
$12,272 |
$30,673 |
2/28/2026 |
$15,824 |
$17,800 |
$12,444 |
$31,067 |
3/31/2026 |
$15,951 |
$17,175 |
$12,223 |
$28,836 |
4/30/2026 |
$16,166 |
$17,871 |
$12,260 |
$31,770 |
|
| Average Annual Return [Table Text Block] |
|
|
Table Summary
AATR |
1 Year |
5 Years |
10 Years |
Class C |
24.64 |
6.45 |
4.92 |
Class C with Load |
23.64 |
6.45 |
4.92 |
Absolute Return Blended IndexFootnote Reference* |
12.62 |
4.56 |
5.98 |
Bloomberg Global Aggregate Index Hedged (USD) |
2.79 |
0.82 |
2.06 |
MSCI ACWI Index (Net) |
31.00 |
10.68 |
12.25 | |
| No Deduction of Taxes [Text Block] |
|
|
do not reflect taxes that a shareholder may pay on an investment in a fund.
|
| AssetsNet |
|
|
$ 454,532,175
|
| Holdings Count | Holding |
|
|
9
|
| Advisory Fees Paid, Amount |
|
|
$ 1,014,911
|
| InvestmentCompanyPortfolioTurnover |
|
|
38.00%
|
| Additional Fund Statistics [Text Block] |
|
|
Table Summary
Total net assets |
$454,532,175 |
# of portfolio holdings |
9 |
Portfolio turnover rate |
38% |
Total advisory fees paid |
$1,014,911 | |
| Holdings [Text Block] |
|
|
PORTFOLIO COMPOSITION (% OF LONG-TERM INVESTMENTS)
Table Summary
Commodities |
21.8 |
Treasuries (Including inflation linked) |
20.7 |
Alternative investments |
17.3 |
Emerging markets equities |
13.5 |
U.S. equities |
12.9 |
Global credit |
7.3 |
International developed equities |
6.5 | |
| Largest Holdings [Text Block] |
|
|
TOP HOLDINGS (% OF NET ASSETS)
Table Summary
Allspring Macro Strategies Portfolio |
48.5 |
Allspring Alternative Risk Premia Fund Class R6 |
18.7 |
Allspring Income Plus ETF |
7.9 |
Allspring Disciplined Large Cap Portfolio |
5.7 |
Allspring Emerging Markets Equity Advantage Fund Class R6 |
5.4 |
Allspring Disciplined International Developed Markets Portfolio |
4.5 |
iShares MSCI South Korea ETF |
4.4 |
iShares MSCI Brazil ETF |
3.9 | |
| Material Fund Change [Text Block] |
|
|
|
| C000150671 |
|
|
|
| Shareholder Report [Line Items] |
|
|
|
| Fund Name |
|
|
Absolute Return Fund
|
| Class Name |
|
|
Class R6
|
| Trading Symbol |
|
|
WARRX
|
| Annual or Semi-Annual Statement [Text Block] |
|
|
This annual shareholder report contains important information about Absolute Return Fund for the period from May 1, 2025 to April 30, 2026.
|
| Additional Information [Text Block] |
|
|
You can find additional information about the Fund at allspringglobal.com. You can also request this information by contacting us at 1-800-222-8222.
|
| Additional Information Phone Number |
|
|
<span style="white-space: nowrap; box-sizing: border-box; color: rgb(0, 0, 0); display: inline; flex-wrap: nowrap; font-size: 12px; font-weight: 400; grid-area: auto; line-height: 18px; margin: 0px; overflow: visible; text-align: left; text-align-last: auto;"> 1-800-222-8222.</span>
|
| Additional Information Website |
|
|
<span style="box-sizing: border-box; color: rgb(0, 0, 0); display: inline; flex-wrap: nowrap; font-size: 12px; font-weight: 400; grid-area: auto; line-height: 18px; margin: 0px; overflow: visible; text-align: left; text-align-last: auto; white-space-collapse: preserve-breaks;">allspringglobal.com</span>
|
| Expenses [Text Block] |
|
|
What were the Fund costs for the past year?The table explains the costs you would have paid within the reporting period based on a hypothetical $10,000 investment.
Table Summary
CLASS NAME |
COSTS OF A $10,000 INVESTMENT |
COSTS PAID AS A % OF A $10,000 INVESTMENT |
Class R6 |
$32 |
0.28% | The manager has contractually committed to waive fees and/or reimburse certain expenses to the extent necessary to cap the Fund's total annual fund operating expense ratio at a specific amount. Without this cap, the costs shown above may have been higher. Please see the prospectus for the amount and the expiration date of the cap. Prior to or after the commitment expiration date, the cap may be increased or the commitment to maintain the cap may be terminated only with the approval of the Board of Trustees. |
| Expenses Paid, Amount |
|
|
$ 32
|
| Expense Ratio, Percent |
|
|
0.28%
|
| Factors Affecting Performance [Text Block] |
|
|
How did the Fund perform last year and what affected its performance?The Fund outperformed its benchmark for the period. The past year saw a wide set of narratives drive the global economy and financial markets. From an initial focus on tariffs, markets swiftly moved onto opportunities within artificial intelligence (AI), followed by a U.S. government shutdown that led to a dearth of data. Geopolitical risk remained elevated. U.S. economic growth was above trend, supported initially by AI-driven capital expenditures and resilient consumer spending. Inflation remained above target. Outside the U.S., investment opportunities were divergent. Globally, expectations for earnings growth remain concentrated in a single theme: AI. We spent the bulk of the period with lower-than-benchmark exposure to U.S. assets, preferring emerging markets and developed ex U.S. equities. Early in 2026, we moderated this positioning slightly. We also increased the Fund's exposure to alternatives through the Alternative Risk Premia Strategy. That, along with tactical asset allocation, drove performance. No major portfolio components detracted significantly from the benchmark. |
| Performance Past Does Not Indicate Future [Text] |
|
|
Figures quoted represent past performance, which is no guarantee of future results,
|
| Line Graph [Table Text Block] |
|
|
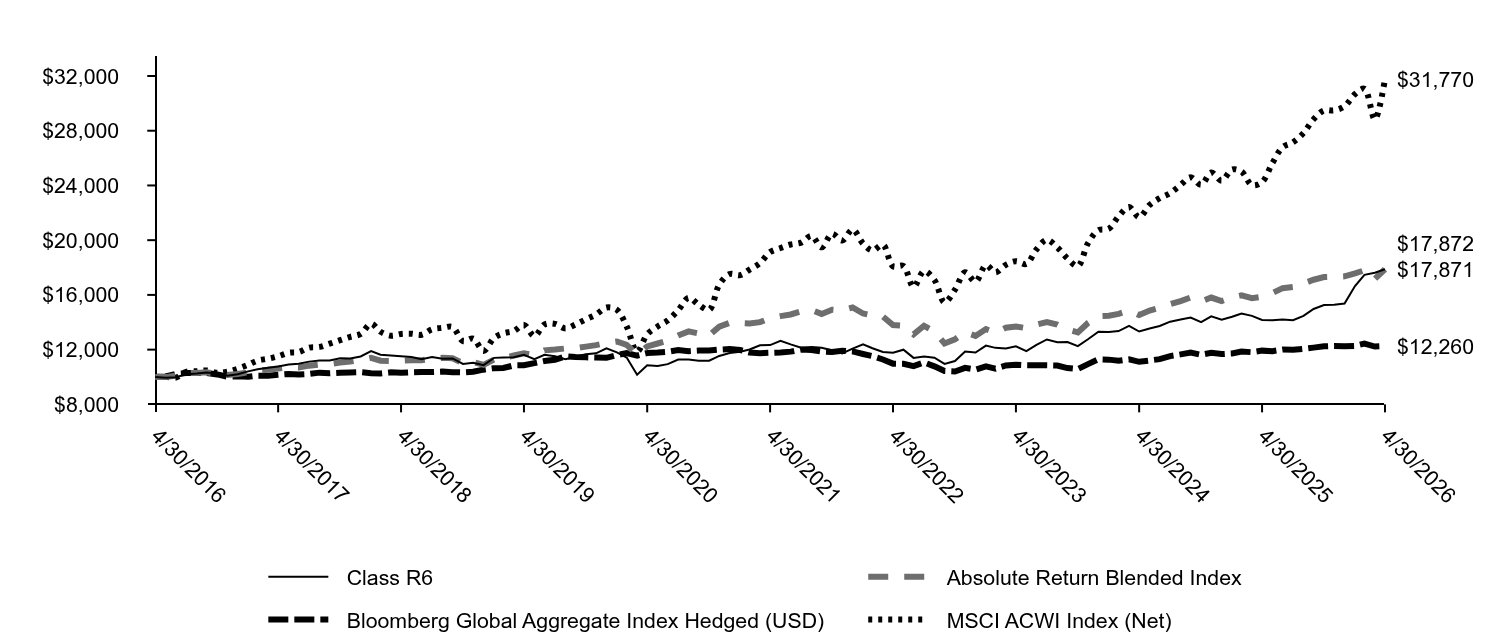
Table Summary
|
Class R6 |
Absolute Return Blended Index |
Bloomberg Global Aggregate Index Hedged (USD) |
MSCI ACWI Index (Net) |
4/30/2016 |
$10,000 |
$10,000 |
$10,000 |
$10,000 |
5/31/2016 |
$9,942 |
$9,992 |
$10,042 |
$10,013 |
6/30/2016 |
$9,981 |
$10,101 |
$10,233 |
$9,952 |
7/31/2016 |
$10,195 |
$10,302 |
$10,295 |
$10,381 |
8/31/2016 |
$10,253 |
$10,296 |
$10,289 |
$10,416 |
9/30/2016 |
$10,331 |
$10,338 |
$10,288 |
$10,480 |
10/31/2016 |
$10,253 |
$10,232 |
$10,188 |
$10,302 |
11/30/2016 |
$10,097 |
$10,140 |
$10,020 |
$10,380 |
12/31/2016 |
$10,195 |
$10,221 |
$10,048 |
$10,604 |
1/31/2017 |
$10,412 |
$10,338 |
$10,011 |
$10,894 |
2/28/2017 |
$10,570 |
$10,483 |
$10,097 |
$11,200 |
3/31/2017 |
$10,669 |
$10,524 |
$10,092 |
$11,337 |
4/30/2017 |
$10,767 |
$10,625 |
$10,160 |
$11,514 |
5/31/2017 |
$10,906 |
$10,724 |
$10,220 |
$11,768 |
6/30/2017 |
$10,965 |
$10,697 |
$10,191 |
$11,821 |
7/31/2017 |
$11,123 |
$10,829 |
$10,225 |
$12,152 |
8/31/2017 |
$11,212 |
$10,913 |
$10,318 |
$12,198 |
9/30/2017 |
$11,202 |
$10,947 |
$10,270 |
$12,434 |
10/31/2017 |
$11,369 |
$11,049 |
$10,313 |
$12,692 |
11/30/2017 |
$11,350 |
$11,134 |
$10,329 |
$12,938 |
12/31/2017 |
$11,498 |
$11,240 |
$10,353 |
$13,146 |
1/31/2018 |
$11,891 |
$11,404 |
$10,279 |
$13,888 |
2/28/2018 |
$11,629 |
$11,190 |
$10,255 |
$13,305 |
3/31/2018 |
$11,579 |
$11,175 |
$10,340 |
$13,020 |
4/30/2018 |
$11,518 |
$11,198 |
$10,302 |
$13,144 |
5/31/2018 |
$11,468 |
$11,232 |
$10,341 |
$13,161 |
6/30/2018 |
$11,306 |
$11,232 |
$10,360 |
$13,089 |
7/31/2018 |
$11,457 |
$11,333 |
$10,363 |
$13,484 |
8/31/2018 |
$11,326 |
$11,403 |
$10,394 |
$13,590 |
9/30/2018 |
$11,356 |
$11,365 |
$10,355 |
$13,649 |
10/31/2018 |
$10,953 |
$11,004 |
$10,334 |
$12,626 |
11/30/2018 |
$11,044 |
$11,095 |
$10,385 |
$12,811 |
12/31/2018 |
$10,867 |
$10,890 |
$10,535 |
$11,909 |
1/31/2019 |
$11,398 |
$11,277 |
$10,647 |
$12,849 |
2/28/2019 |
$11,430 |
$11,386 |
$10,659 |
$13,193 |
3/31/2019 |
$11,450 |
$11,571 |
$10,850 |
$13,359 |
4/30/2019 |
$11,617 |
$11,723 |
$10,857 |
$13,810 |
5/31/2019 |
$11,304 |
$11,598 |
$11,013 |
$12,990 |
6/30/2019 |
$11,627 |
$11,948 |
$11,167 |
$13,841 |
7/31/2019 |
$11,523 |
$12,003 |
$11,255 |
$13,882 |
8/31/2019 |
$11,304 |
$12,085 |
$11,511 |
$13,552 |
9/30/2019 |
$11,482 |
$12,100 |
$11,457 |
$13,837 |
10/31/2019 |
$11,669 |
$12,220 |
$11,437 |
$14,216 |
11/30/2019 |
$11,732 |
$12,327 |
$11,424 |
$14,563 |
12/31/2019 |
$12,099 |
$12,487 |
$11,401 |
$15,076 |
1/31/2020 |
$11,798 |
$12,598 |
$11,606 |
$14,910 |
2/29/2020 |
$11,423 |
$12,350 |
$11,748 |
$13,705 |
3/31/2020 |
$10,167 |
$11,632 |
$11,566 |
$11,855 |
4/30/2020 |
$10,854 |
$12,238 |
$11,753 |
$13,125 |
5/31/2020 |
$10,811 |
$12,448 |
$11,786 |
$13,696 |
6/30/2020 |
$10,940 |
$12,654 |
$11,845 |
$14,133 |
7/31/2020 |
$11,272 |
$13,032 |
$11,974 |
$14,881 |
8/31/2020 |
$11,272 |
$13,332 |
$11,888 |
$15,792 |
9/30/2020 |
$11,186 |
$13,179 |
$11,931 |
$15,283 |
10/31/2020 |
$11,186 |
$13,038 |
$11,932 |
$14,911 |
11/30/2020 |
$11,541 |
$13,674 |
$12,000 |
$16,749 |
12/31/2020 |
$11,754 |
$13,963 |
$12,037 |
$17,527 |
1/31/2021 |
$11,843 |
$13,935 |
$11,972 |
$17,447 |
2/28/2021 |
$12,010 |
$13,904 |
$11,786 |
$17,851 |
3/31/2021 |
$12,321 |
$14,009 |
$11,740 |
$18,328 |
4/30/2021 |
$12,332 |
$14,303 |
$11,770 |
$19,129 |
5/31/2021 |
$12,643 |
$14,451 |
$11,797 |
$19,427 |
6/30/2021 |
$12,387 |
$14,569 |
$11,854 |
$19,683 |
7/31/2021 |
$12,143 |
$14,794 |
$12,001 |
$19,819 |
8/31/2021 |
$12,188 |
$14,906 |
$11,977 |
$20,315 |
9/30/2021 |
$12,132 |
$14,611 |
$11,864 |
$19,475 |
10/31/2021 |
$11,954 |
$14,919 |
$11,833 |
$20,470 |
11/30/2021 |
$11,721 |
$14,872 |
$11,918 |
$19,977 |
12/31/2021 |
$12,076 |
$15,078 |
$11,869 |
$20,776 |
1/31/2022 |
$12,387 |
$14,641 |
$11,683 |
$19,755 |
2/28/2022 |
$12,099 |
$14,494 |
$11,527 |
$19,245 |
3/31/2022 |
$11,834 |
$14,416 |
$11,279 |
$19,662 |
4/30/2022 |
$11,777 |
$13,793 |
$10,976 |
$18,088 |
5/31/2022 |
$11,996 |
$13,745 |
$10,961 |
$18,109 |
6/30/2022 |
$11,397 |
$13,124 |
$10,794 |
$16,583 |
7/31/2022 |
$11,501 |
$13,745 |
$11,069 |
$17,741 |
8/31/2022 |
$11,408 |
$13,333 |
$10,780 |
$17,088 |
9/30/2022 |
$10,960 |
$12,449 |
$10,434 |
$15,452 |
10/31/2022 |
$11,167 |
$12,753 |
$10,399 |
$16,384 |
11/30/2022 |
$11,857 |
$13,278 |
$10,664 |
$17,655 |
12/31/2022 |
$11,786 |
$13,001 |
$10,538 |
$16,960 |
1/31/2023 |
$12,294 |
$13,500 |
$10,780 |
$18,176 |
2/28/2023 |
$12,129 |
$13,236 |
$10,608 |
$17,655 |
3/31/2023 |
$12,081 |
$13,600 |
$10,844 |
$18,200 |
4/30/2023 |
$12,247 |
$13,695 |
$10,900 |
$18,461 |
5/31/2023 |
$11,892 |
$13,570 |
$10,857 |
$18,263 |
6/30/2023 |
$12,342 |
$13,828 |
$10,850 |
$19,324 |
7/31/2023 |
$12,744 |
$14,012 |
$10,854 |
$20,031 |
8/31/2023 |
$12,543 |
$13,826 |
$10,840 |
$19,471 |
9/30/2023 |
$12,555 |
$13,465 |
$10,653 |
$18,666 |
10/31/2023 |
$12,259 |
$13,261 |
$10,577 |
$18,105 |
11/30/2023 |
$12,756 |
$13,951 |
$10,941 |
$19,776 |
12/31/2023 |
$13,312 |
$14,451 |
$11,291 |
$20,726 |
1/31/2024 |
$13,287 |
$14,481 |
$11,269 |
$20,847 |
2/29/2024 |
$13,360 |
$14,615 |
$11,191 |
$21,742 |
3/31/2024 |
$13,739 |
$14,857 |
$11,292 |
$22,425 |
4/30/2024 |
$13,324 |
$14,526 |
$11,110 |
$21,685 |
5/31/2024 |
$13,544 |
$14,858 |
$11,209 |
$22,566 |
6/30/2024 |
$13,727 |
$15,053 |
$11,306 |
$23,068 |
7/31/2024 |
$14,045 |
$15,320 |
$11,524 |
$23,440 |
8/31/2024 |
$14,204 |
$15,548 |
$11,651 |
$24,035 |
9/30/2024 |
$14,351 |
$15,810 |
$11,786 |
$24,594 |
10/31/2024 |
$14,008 |
$15,523 |
$11,626 |
$24,042 |
11/30/2024 |
$14,436 |
$15,808 |
$11,764 |
$24,941 |
12/31/2024 |
$14,181 |
$15,553 |
$11,674 |
$24,351 |
1/31/2025 |
$14,399 |
$15,824 |
$11,719 |
$25,168 |
2/28/2025 |
$14,644 |
$15,969 |
$11,861 |
$25,016 |
3/31/2025 |
$14,467 |
$15,764 |
$11,811 |
$24,028 |
4/30/2025 |
$14,167 |
$15,868 |
$11,927 |
$24,252 |
5/31/2025 |
$14,154 |
$16,139 |
$11,888 |
$25,646 |
6/30/2025 |
$14,208 |
$16,493 |
$12,002 |
$26,798 |
7/31/2025 |
$14,154 |
$16,574 |
$11,992 |
$27,161 |
8/31/2025 |
$14,467 |
$16,834 |
$12,058 |
$27,832 |
9/30/2025 |
$14,970 |
$17,110 |
$12,147 |
$28,840 |
10/31/2025 |
$15,256 |
$17,306 |
$12,243 |
$29,485 |
11/30/2025 |
$15,283 |
$17,327 |
$12,268 |
$29,482 |
12/31/2025 |
$15,376 |
$17,355 |
$12,242 |
$29,790 |
1/31/2026 |
$16,645 |
$17,567 |
$12,272 |
$30,673 |
2/28/2026 |
$17,467 |
$17,800 |
$12,444 |
$31,067 |
3/31/2026 |
$17,621 |
$17,175 |
$12,223 |
$28,836 |
4/30/2026 |
$17,872 |
$17,871 |
$12,260 |
$31,770 |
|
| Average Annual Return [Table Text Block] |
|
|
Table Summary
AATR |
1 Year |
5 Years |
10 Years |
Class R6 |
26.15 |
7.70 |
5.98 |
Absolute Return Blended IndexFootnote Reference* |
12.62 |
4.56 |
5.98 |
Bloomberg Global Aggregate Index Hedged (USD) |
2.79 |
0.82 |
2.06 |
MSCI ACWI Index (Net) |
31.00 |
10.68 |
12.25 | |
| No Deduction of Taxes [Text Block] |
|
|
do not reflect taxes that a shareholder may pay on an investment in a fund.
|
| AssetsNet |
|
|
$ 454,532,175
|
| Holdings Count | Holding |
|
|
9
|
| Advisory Fees Paid, Amount |
|
|
$ 1,014,911
|
| InvestmentCompanyPortfolioTurnover |
|
|
38.00%
|
| Additional Fund Statistics [Text Block] |
|
|
Table Summary
Total net assets |
$454,532,175 |
# of portfolio holdings |
9 |
Portfolio turnover rate |
38% |
Total advisory fees paid |
$1,014,911 | |
| Holdings [Text Block] |
|
|
PORTFOLIO COMPOSITION (% OF LONG-TERM INVESTMENTS)
Table Summary
Commodities |
21.8 |
Treasuries (Including inflation linked) |
20.7 |
Alternative investments |
17.3 |
Emerging markets equities |
13.5 |
U.S. equities |
12.9 |
Global credit |
7.3 |
International developed equities |
6.5 | |
| Largest Holdings [Text Block] |
|
|
TOP HOLDINGS (% OF NET ASSETS)
Table Summary
Allspring Macro Strategies Portfolio |
48.5 |
Allspring Alternative Risk Premia Fund Class R6 |
18.7 |
Allspring Income Plus ETF |
7.9 |
Allspring Disciplined Large Cap Portfolio |
5.7 |
Allspring Emerging Markets Equity Advantage Fund Class R6 |
5.4 |
Allspring Disciplined International Developed Markets Portfolio |
4.5 |
iShares MSCI South Korea ETF |
4.4 |
iShares MSCI Brazil ETF |
3.9 | |
| Material Fund Change [Text Block] |
|
|
|
| C000123115 |
|
|
|
| Shareholder Report [Line Items] |
|
|
|
| Fund Name |
|
|
Absolute Return Fund
|
| Class Name |
|
|
Institutional Class
|
| Trading Symbol |
|
|
WABIX
|
| Annual or Semi-Annual Statement [Text Block] |
|
|
This annual shareholder report contains important information about Absolute Return Fund for the period from May 1, 2025 to April 30, 2026.
|
| Additional Information [Text Block] |
|
|
You can find additional information about the Fund at allspringglobal.com. You can also request this information by contacting us at 1-800-222-8222.
|
| Additional Information Phone Number |
|
|
<span style="white-space: nowrap; box-sizing: border-box; color: rgb(0, 0, 0); display: inline; flex-wrap: nowrap; font-size: 12px; font-weight: 400; grid-area: auto; line-height: 18px; margin: 0px; overflow: visible; text-align: left; text-align-last: auto;"> 1-800-222-8222.</span>
|
| Additional Information Website |
|
|
<span style="box-sizing: border-box; color: rgb(0, 0, 0); display: inline; flex-wrap: nowrap; font-size: 12px; font-weight: 400; grid-area: auto; line-height: 18px; margin: 0px; overflow: visible; text-align: left; text-align-last: auto; white-space-collapse: preserve-breaks;">allspringglobal.com</span>
|
| Expenses [Text Block] |
|
|
What were the Fund costs for the past year?The table explains the costs you would have paid within the reporting period based on a hypothetical $10,000 investment.
Table Summary
CLASS NAME |
COSTS OF A $10,000 INVESTMENT |
COSTS PAID AS A % OF A $10,000 INVESTMENT |
Institutional Class |
$37 |
0.33% | The manager has contractually committed to waive fees and/or reimburse certain expenses to the extent necessary to cap the Fund's total annual fund operating expense ratio at a specific amount. Without this cap, the costs shown above may have been higher. Please see the prospectus for the amount and the expiration date of the cap. Prior to or after the commitment expiration date, the cap may be increased or the commitment to maintain the cap may be terminated only with the approval of the Board of Trustees. |
| Expenses Paid, Amount |
|
|
$ 37
|
| Expense Ratio, Percent |
|
|
0.33%
|
| Factors Affecting Performance [Text Block] |
|
|
How did the Fund perform last year and what affected its performance?The Fund outperformed its benchmark for the period. The past year saw a wide set of narratives drive the global economy and financial markets. From an initial focus on tariffs, markets swiftly moved onto opportunities within artificial intelligence (AI), followed by a U.S. government shutdown that led to a dearth of data. Geopolitical risk remained elevated. U.S. economic growth was above trend, supported initially by AI-driven capital expenditures and resilient consumer spending. Inflation remained above target. Outside the U.S., investment opportunities were divergent. Globally, expectations for earnings growth remain concentrated in a single theme: AI. We spent the bulk of the period with lower-than-benchmark exposure to U.S. assets, preferring emerging markets and developed ex U.S. equities. Early in 2026, we moderated this positioning slightly. We also increased the Fund's exposure to alternatives through the Alternative Risk Premia Strategy. That, along with tactical asset allocation, drove performance. No major portfolio components detracted significantly from the benchmark. |
| Performance Past Does Not Indicate Future [Text] |
|
|
Figures quoted represent past performance, which is no guarantee of future results,
|
| Line Graph [Table Text Block] |
|
|
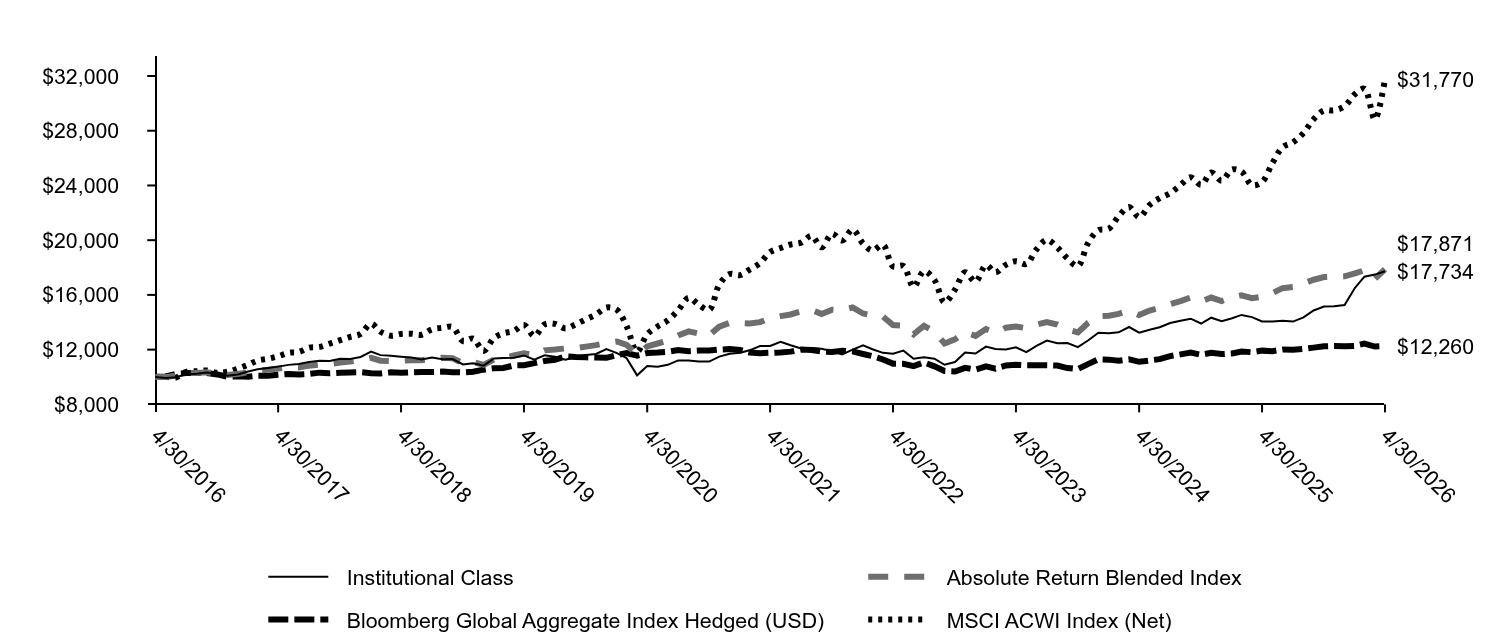
Table Summary
|
Institutional Class |
Absolute Return Blended Index |
Bloomberg Global Aggregate Index Hedged (USD) |
MSCI ACWI Index (Net) |
4/30/2016 |
$10,000 |
$10,000 |
$10,000 |
$10,000 |
5/31/2016 |
$9,932 |
$9,992 |
$10,042 |
$10,013 |
6/30/2016 |
$9,981 |
$10,101 |
$10,233 |
$9,952 |
7/31/2016 |
$10,195 |
$10,302 |
$10,295 |
$10,381 |
8/31/2016 |
$10,243 |
$10,296 |
$10,289 |
$10,416 |
9/30/2016 |
$10,321 |
$10,338 |
$10,288 |
$10,480 |
10/31/2016 |
$10,243 |
$10,232 |
$10,188 |
$10,302 |
11/30/2016 |
$10,088 |
$10,140 |
$10,020 |
$10,380 |
12/31/2016 |
$10,187 |
$10,221 |
$10,048 |
$10,604 |
1/31/2017 |
$10,404 |
$10,338 |
$10,011 |
$10,894 |
2/28/2017 |
$10,561 |
$10,483 |
$10,097 |
$11,200 |
3/31/2017 |
$10,660 |
$10,524 |
$10,092 |
$11,337 |
4/30/2017 |
$10,758 |
$10,625 |
$10,160 |
$11,514 |
5/31/2017 |
$10,886 |
$10,724 |
$10,220 |
$11,768 |
6/30/2017 |
$10,946 |
$10,697 |
$10,191 |
$11,821 |
7/31/2017 |
$11,103 |
$10,829 |
$10,225 |
$12,152 |
8/31/2017 |
$11,192 |
$10,913 |
$10,318 |
$12,198 |
9/30/2017 |
$11,172 |
$10,947 |
$10,270 |
$12,434 |
10/31/2017 |
$11,340 |
$11,049 |
$10,313 |
$12,692 |
11/30/2017 |
$11,320 |
$11,134 |
$10,329 |
$12,938 |
12/31/2017 |
$11,467 |
$11,240 |
$10,353 |
$13,146 |
1/31/2018 |
$11,860 |
$11,404 |
$10,279 |
$13,888 |
2/28/2018 |
$11,598 |
$11,190 |
$10,255 |
$13,305 |
3/31/2018 |
$11,548 |
$11,175 |
$10,340 |
$13,020 |
4/30/2018 |
$11,487 |
$11,198 |
$10,302 |
$13,144 |
5/31/2018 |
$11,427 |
$11,232 |
$10,341 |
$13,161 |
6/30/2018 |
$11,276 |
$11,232 |
$10,360 |
$13,089 |
7/31/2018 |
$11,427 |
$11,333 |
$10,363 |
$13,484 |
8/31/2018 |
$11,296 |
$11,403 |
$10,394 |
$13,590 |
9/30/2018 |
$11,316 |
$11,365 |
$10,355 |
$13,649 |
10/31/2018 |
$10,913 |
$11,004 |
$10,334 |
$12,626 |
11/30/2018 |
$11,004 |
$11,095 |
$10,385 |
$12,811 |
12/31/2018 |
$10,827 |
$10,890 |
$10,535 |
$11,909 |
1/31/2019 |
$11,357 |
$11,277 |
$10,647 |
$12,849 |
2/28/2019 |
$11,388 |
$11,386 |
$10,659 |
$13,193 |
3/31/2019 |
$11,409 |
$11,571 |
$10,850 |
$13,359 |
4/30/2019 |
$11,575 |
$11,723 |
$10,857 |
$13,810 |
5/31/2019 |
$11,263 |
$11,598 |
$11,013 |
$12,990 |
6/30/2019 |
$11,585 |
$11,948 |
$11,167 |
$13,841 |
7/31/2019 |
$11,481 |
$12,003 |
$11,255 |
$13,882 |
8/31/2019 |
$11,263 |
$12,085 |
$11,511 |
$13,552 |
9/30/2019 |
$11,440 |
$12,100 |
$11,457 |
$13,837 |
10/31/2019 |
$11,616 |
$12,220 |
$11,437 |
$14,216 |
11/30/2019 |
$11,679 |
$12,327 |
$11,424 |
$14,563 |
12/31/2019 |
$12,045 |
$12,487 |
$11,401 |
$15,076 |
1/31/2020 |
$11,746 |
$12,598 |
$11,606 |
$14,910 |
2/29/2020 |
$11,372 |
$12,350 |
$11,748 |
$13,705 |
3/31/2020 |
$10,121 |
$11,632 |
$11,566 |
$11,855 |
4/30/2020 |
$10,805 |
$12,238 |
$11,753 |
$13,125 |
5/31/2020 |
$10,752 |
$12,448 |
$11,786 |
$13,696 |
6/30/2020 |
$10,891 |
$12,654 |
$11,845 |
$14,133 |
7/31/2020 |
$11,211 |
$13,032 |
$11,974 |
$14,881 |
8/31/2020 |
$11,211 |
$13,332 |
$11,888 |
$15,792 |
9/30/2020 |
$11,126 |
$13,179 |
$11,931 |
$15,283 |
10/31/2020 |
$11,126 |
$13,038 |
$11,932 |
$14,911 |
11/30/2020 |
$11,489 |
$13,674 |
$12,000 |
$16,749 |
12/31/2020 |
$11,697 |
$13,963 |
$12,037 |
$17,527 |
1/31/2021 |
$11,774 |
$13,935 |
$11,972 |
$17,447 |
2/28/2021 |
$11,951 |
$13,904 |
$11,786 |
$17,851 |
3/31/2021 |
$12,261 |
$14,009 |
$11,740 |
$18,328 |
4/30/2021 |
$12,272 |
$14,303 |
$11,770 |
$19,129 |
5/31/2021 |
$12,570 |
$14,451 |
$11,797 |
$19,427 |
6/30/2021 |
$12,316 |
$14,569 |
$11,854 |
$19,683 |
7/31/2021 |
$12,084 |
$14,794 |
$12,001 |
$19,819 |
8/31/2021 |
$12,117 |
$14,906 |
$11,977 |
$20,315 |
9/30/2021 |
$12,062 |
$14,611 |
$11,864 |
$19,475 |
10/31/2021 |
$11,885 |
$14,919 |
$11,833 |
$20,470 |
11/30/2021 |
$11,653 |
$14,872 |
$11,918 |
$19,977 |
12/31/2021 |
$12,006 |
$15,078 |
$11,869 |
$20,776 |
1/31/2022 |
$12,315 |
$14,641 |
$11,683 |
$19,755 |
2/28/2022 |
$12,029 |
$14,494 |
$11,527 |
$19,245 |
3/31/2022 |
$11,765 |
$14,416 |
$11,279 |
$19,662 |
4/30/2022 |
$11,708 |
$13,793 |
$10,976 |
$18,088 |
5/31/2022 |
$11,926 |
$13,745 |
$10,961 |
$18,109 |
6/30/2022 |
$11,331 |
$13,124 |
$10,794 |
$16,583 |
7/31/2022 |
$11,434 |
$13,745 |
$11,069 |
$17,741 |
8/31/2022 |
$11,342 |
$13,333 |
$10,780 |
$17,088 |
9/30/2022 |
$10,896 |
$12,449 |
$10,434 |
$15,452 |
10/31/2022 |
$11,090 |
$12,753 |
$10,399 |
$16,384 |
11/30/2022 |
$11,788 |
$13,278 |
$10,664 |
$17,655 |
12/31/2022 |
$11,714 |
$13,001 |
$10,538 |
$16,960 |
1/31/2023 |
$12,220 |
$13,500 |
$10,780 |
$18,176 |
2/28/2023 |
$12,044 |
$13,236 |
$10,608 |
$17,655 |
3/31/2023 |
$12,008 |
$13,600 |
$10,844 |
$18,200 |
4/30/2023 |
$12,173 |
$13,695 |
$10,900 |
$18,461 |
5/31/2023 |
$11,820 |
$13,570 |
$10,857 |
$18,263 |
6/30/2023 |
$12,267 |
$13,828 |
$10,850 |
$19,324 |
7/31/2023 |
$12,667 |
$14,012 |
$10,854 |
$20,031 |
8/31/2023 |
$12,467 |
$13,826 |
$10,840 |
$19,471 |
9/30/2023 |
$12,479 |
$13,465 |
$10,653 |
$18,666 |
10/31/2023 |
$12,185 |
$13,261 |
$10,577 |
$18,105 |
11/30/2023 |
$12,667 |
$13,951 |
$10,941 |
$19,776 |
12/31/2023 |
$13,229 |
$14,451 |
$11,291 |
$20,726 |
1/31/2024 |
$13,192 |
$14,481 |
$11,269 |
$20,847 |
2/29/2024 |
$13,265 |
$14,615 |
$11,191 |
$21,742 |
3/31/2024 |
$13,654 |
$14,857 |
$11,292 |
$22,425 |
4/30/2024 |
$13,241 |
$14,526 |
$11,110 |
$21,685 |
5/31/2024 |
$13,447 |
$14,858 |
$11,209 |
$22,566 |
6/30/2024 |
$13,641 |
$15,053 |
$11,306 |
$23,068 |
7/31/2024 |
$13,945 |
$15,320 |
$11,524 |
$23,440 |
8/31/2024 |
$14,115 |
$15,548 |
$11,651 |
$24,035 |
9/30/2024 |
$14,260 |
$15,810 |
$11,786 |
$24,594 |
10/31/2024 |
$13,908 |
$15,523 |
$11,626 |
$24,042 |
11/30/2024 |
$14,333 |
$15,808 |
$11,764 |
$24,941 |
12/31/2024 |
$14,078 |
$15,553 |
$11,674 |
$24,351 |
1/31/2025 |
$14,294 |
$15,824 |
$11,719 |
$25,168 |
2/28/2025 |
$14,537 |
$15,969 |
$11,861 |
$25,016 |
3/31/2025 |
$14,375 |
$15,764 |
$11,811 |
$24,028 |
4/30/2025 |
$14,064 |
$15,868 |
$11,927 |
$24,252 |
5/31/2025 |
$14,051 |
$16,139 |
$11,888 |
$25,646 |
6/30/2025 |
$14,118 |
$16,493 |
$12,002 |
$26,798 |
7/31/2025 |
$14,051 |
$16,574 |
$11,992 |
$27,161 |
8/31/2025 |
$14,361 |
$16,834 |
$12,058 |
$27,832 |
9/30/2025 |
$14,861 |
$17,110 |
$12,147 |
$28,840 |
10/31/2025 |
$15,144 |
$17,306 |
$12,243 |
$29,485 |
11/30/2025 |
$15,171 |
$17,327 |
$12,268 |
$29,482 |
12/31/2025 |
$15,262 |
$17,355 |
$12,242 |
$29,790 |
1/31/2026 |
$16,518 |
$17,567 |
$12,272 |
$30,673 |
2/28/2026 |
$17,333 |
$17,800 |
$12,444 |
$31,067 |
3/31/2026 |
$17,485 |
$17,175 |
$12,223 |
$28,836 |
4/30/2026 |
$17,734 |
$17,871 |
$12,260 |
$31,770 |
|
| Average Annual Return [Table Text Block] |
|
|
Table Summary
AATR |
1 Year |
5 Years |
10 Years |
Institutional Class |
26.09 |
7.64 |
5.90 |
Absolute Return Blended IndexFootnote Reference* |
12.62 |
4.56 |
5.98 |
Bloomberg Global Aggregate Index Hedged (USD) |
2.79 |
0.82 |
2.06 |
MSCI ACWI Index (Net) |
31.00 |
10.68 |
12.25 | |
| No Deduction of Taxes [Text Block] |
|
|
do not reflect taxes that a shareholder may pay on an investment in a fund.
|
| AssetsNet |
|
|
$ 454,532,175
|
| Holdings Count | Holding |
|
|
9
|
| Advisory Fees Paid, Amount |
|
|
$ 1,014,911
|
| InvestmentCompanyPortfolioTurnover |
|
|
38.00%
|
| Additional Fund Statistics [Text Block] |
|
|
Table Summary
Total net assets |
$454,532,175 |
# of portfolio holdings |
9 |
Portfolio turnover rate |
38% |
Total advisory fees paid |
$1,014,911 | |
| Holdings [Text Block] |
|
|
PORTFOLIO COMPOSITION (% OF LONG-TERM INVESTMENTS)
Table Summary
Commodities |
21.8 |
Treasuries (Including inflation linked) |
20.7 |
Alternative investments |
17.3 |
Emerging markets equities |
13.5 |
U.S. equities |
12.9 |
Global credit |
7.3 |
International developed equities |
6.5 | |
| Largest Holdings [Text Block] |
|
|
TOP HOLDINGS (% OF NET ASSETS)
Table Summary
Allspring Macro Strategies Portfolio |
48.5 |
Allspring Alternative Risk Premia Fund Class R6 |
18.7 |
Allspring Income Plus ETF |
7.9 |
Allspring Disciplined Large Cap Portfolio |
5.7 |
Allspring Emerging Markets Equity Advantage Fund Class R6 |
5.4 |
Allspring Disciplined International Developed Markets Portfolio |
4.5 |
iShares MSCI South Korea ETF |
4.4 |
iShares MSCI Brazil ETF |
3.9 | |
| Material Fund Change [Text Block] |
|
|
|
|
|