v3.26.1
Pay vs Performance Disclosure - USD ($)
12 Months Ended
Mar. 31, 2026
Mar. 31, 2025
Mar. 31, 2024
Mar. 31, 2023
Mar. 31, 2022
Pay vs Performance Disclosure          
Pay vs Performance Disclosure, Table

Value of Initial Fixed $100
Investment Based on:

Fiscal
Year

Summary
Compensation
Table
Total for
PEO
(1) ($)

Compensation
Actually
Paid to
PEO
(1)(2)(3) ($)

Average
Summary
Compensation
Table
Total for
non-PEO
NEOs
(1) ($)

Average
Compensation
Actually
Paid to
non-PEO
NEOs
(1)(2)(3) ($)

Total
shareholder
return ($)

Peer
Group Total
Shareholder
Return
(4) ($)

Net
income ($)

Moving
and Storage
EBITDA
(5) ($)

(a)

(b)

(c)

(d)

(e)

(f)

(g)

(h)

(i)

2026

1,015,838

992,945

618,887

598,155

 UHAL

78.33

127.19

83,128

1,645,859

 UHAL.B

73.23


2025

1,025,045

1,012,282

621,238

606,016

 UHAL

107.15

100.78

367,090

1,619,714

 UHAL.B

96.62

2024

1,015,068

1,018,532

620,427

624,630

 UHAL

110.72

110.80

628,707

1,567,985

 UHAL.B

96.62

2023

1,011,616

1,012,158

632,132

632,820

 UHAL

97.79

98.68

924,472

1,817,521

 UHAL.B

84.13


2022

1,011,744

1,011,423

617,660

617,100

 UHAL

97.67

111.29

1,124,362

2,052,723

 UHAL.B

97.67


(1)
Edward J. Shoen was PEO for each year presented. The individuals comprising the Non-PEO named executive officers for each of the fiscal years ended March 31, 2023 and 2022 were Jason A. Berg, Chief Financial Officer of U-Haul Holding Company; John C. Taylor, President of U-Haul; Samuel J. Shoen, Vice-Chairman of U-Haul Holding Company and U-Box Project Manager; and Laurence J. De Respino, former General Counsel of U-Haul Holding Company through May 2023. The Non-PEO named executive officers for the fiscal year ended March 31, 2024 were Jason A. Berg, John C. Taylor, Samuel J. Shoen (each holding the same positions as in the fiscal years ended March 31, 2023 and 2022), and Mark A. Haydukovich, former President of Oxford Life Insurance Company through April 2024. The Non-PEO named executive officers for Fiscal 2026 and for the fiscal year ended March 31, 2025 (“Fiscal 2025”) were Jason A. Berg, John C. Taylor, Samuel J. Shoen (each holding the same positions as in the fiscal years ended March 31, 2024, 2023 and 2022), and Douglas M. Bell, President of Repwest Insurance Company.
(2)
The amounts shown for Compensation Actually Paid have been calculated in accordance with Item 402(v) of Regulation S-K and do not reflect compensation actually earned, realized, or received by the Company’s NEOs. These amounts reflect the Summary Compensation Table Total with certain adjustments as described in footnote 3 below.
(3)
Compensation actually paid (“CAP”) is defined by the SEC and is computed in accordance with SEC rules by subtracting the amounts in the “Stock Awards” columns of the Summary Compensation Table for each year from the “Total” column of the Summary Compensation Table and then: (i) adding the fair value as of the end of the fiscal year shown of all awards granted during such fiscal year; (ii) subtracting from the fair value as of the end of the prior fiscal year the amount equal to the fair value at the end of the prior fiscal year; and (iii) adding the fair value of the prior fiscal year awards granted using the closing price for the fiscal year shown. The following tables reflect the adjustments made to the Summary Compensation Table total compensation to compute CAP for our PEO and average CAP for our non-PEO NEOs. Our fiscal year begins on April 1 of each calendar year and ends on March 31 of the following year. For example, Fiscal 2026 began on April 1, 2025, and ended on March 31, 2026. Equity values are calculated in accordance with FASB ASC Topic 718.

Fiscal Year

NEO Type

Summary
Compensation
Table Total ($)

Subtract Equity
Awards ($)

Add Fiscal
Year End
Value of
Current Year
Equity Awards
($)

Subtract Fiscal Year End Value of Prior Year
Equity Awards
($)

Change in
Value of Prior
Equity Awards
($)

Total Compensation
Actually Paid ($)

2026

PEO

1,015,838

(13,569

)

10,285

(14,783

)

(4,826

)

992,945

Non-PEO

618,887

(16,725

)

12,500

(15,581

)

(926

)

598,155

2025

PEO

1,025,045

(20,041

)

19,609

(10,944

)

(1,387

)

1,012,282

Non-PEO

621,238

(22,388

)

21,798

(12,986

)

(1,646

)

606,016

2024

 PEO

1,015,068

(10,064

)

12,331

(9,036

)

10,233

1,018,532

 Non-PEO

620,427

(12,730

)

15,305

(11,276

)

12,904

624,630

2023

 PEO

1,011,616

(8,487

)

9,036

(9,420

)

9,413

1,012,158

 Non-PEO

632,132

(10,579

)

11,276

(11,062

)

11,053

632,820

2022

 PEO

1,011,744

(9,740

)

9,420

(58

)

57

1,011,423

 Non-PEO

617,660

(11,514

)

11,062

(4,225

)

4,117

617,100


(4)
The Peer Group TSR set forth in this table reflects the Dow Jones US Transportation Average Index which we also utilize in the stock performance graph required by Item 201(e)(1)(ii) of Regulation S-K included in our Annual Report for the year ended March 31, 2026. The comparison assumes $100 was invested for the period starting April 1, 2021, through the end of the listed year in the Company and in the Dow Jones US Transportation Average Index, respectively and that all dividends were reinvested. Historical stock performance is not necessarily indicative of future stock performance.
(5)
Earnings before interest, taxes, depreciation, and amortization for our Moving and Storage segment ("Moving and Storage adjusted EBITDA"), is a non-GAAP financial measure as defined under SEC rules. We determined Moving and Storage adjusted EBITDA to be the most important financial performance measure used to link Company performance to Compensation Actually Paid to our PEO and Non-PEO NEOs in Fiscal 2026 and Fiscal 2025 and the fiscal years ended March 31, 2024 and March 31, 2023. Moving and Storage adjusted EBITDA may not have been the most important financial performance measure for the fiscal year ended March 31, 2022, and we may determine a different financial performance measure to be the most important financial performance measure in future years.

The following supplemental information is a reconciliation of Moving and Storage adjusted EBITDA to net earnings. The Company believes that widely accepted measures of operating profitability, such as earnings before interest, taxes, depreciation, and amortization, improve the transparency of the Company's disclosures and provide a meaningful presentation of the Company's results from its core business operations excluding the impact of items not related to the Company's ongoing core business operations and improve the period-to-period comparability of the Company's results from its core business operations. This non-GAAP financial measure is not a substitute for GAAP financial results and should only be considered in conjunction with the Company's financial information that is presented in accordance with GAAP.

       
Named Executive Officers, Footnote
(1)
Edward J. Shoen was PEO for each year presented. The individuals comprising the Non-PEO named executive officers for each of the fiscal years ended March 31, 2023 and 2022 were Jason A. Berg, Chief Financial Officer of U-Haul Holding Company; John C. Taylor, President of U-Haul; Samuel J. Shoen, Vice-Chairman of U-Haul Holding Company and U-Box Project Manager; and Laurence J. De Respino, former General Counsel of U-Haul Holding Company through May 2023. The Non-PEO named executive officers for the fiscal year ended March 31, 2024 were Jason A. Berg, John C. Taylor, Samuel J. Shoen (each holding the same positions as in the fiscal years ended March 31, 2023 and 2022), and Mark A. Haydukovich, former President of Oxford Life Insurance Company through April 2024. The Non-PEO named executive officers for Fiscal 2026 and for the fiscal year ended March 31, 2025 (“Fiscal 2025”) were Jason A. Berg, John C. Taylor, Samuel J. Shoen (each holding the same positions as in the fiscal years ended March 31, 2024, 2023 and 2022), and Douglas M. Bell, President of Repwest Insurance Company.
       
Peer Group Issuers, Footnote
(4)
The Peer Group TSR set forth in this table reflects the Dow Jones US Transportation Average Index which we also utilize in the stock performance graph required by Item 201(e)(1)(ii) of Regulation S-K included in our Annual Report for the year ended March 31, 2026. The comparison assumes $100 was invested for the period starting April 1, 2021, through the end of the listed year in the Company and in the Dow Jones US Transportation Average Index, respectively and that all dividends were reinvested. Historical stock performance is not necessarily indicative of future stock performance.
       
PEO Total Compensation Amount $ 1,015,838,000 $ 1,025,045,000 $ 1,015,068,000 $ 1,011,616,000 $ 1,011,744,000
PEO Actually Paid Compensation Amount 992,945,000 1,012,282,000 1,018,532,000 1,012,158,000 1,011,423,000
Non-PEO NEO Average Total Compensation Amount 618,887,000 621,238,000 620,427,000 632,132,000 617,660,000
Non-PEO NEO Average Compensation Actually Paid Amount $ 598,155,000 606,016,000 624,630,000 632,820,000 617,100,000
Compensation Actually Paid vs. Total Shareholder Return

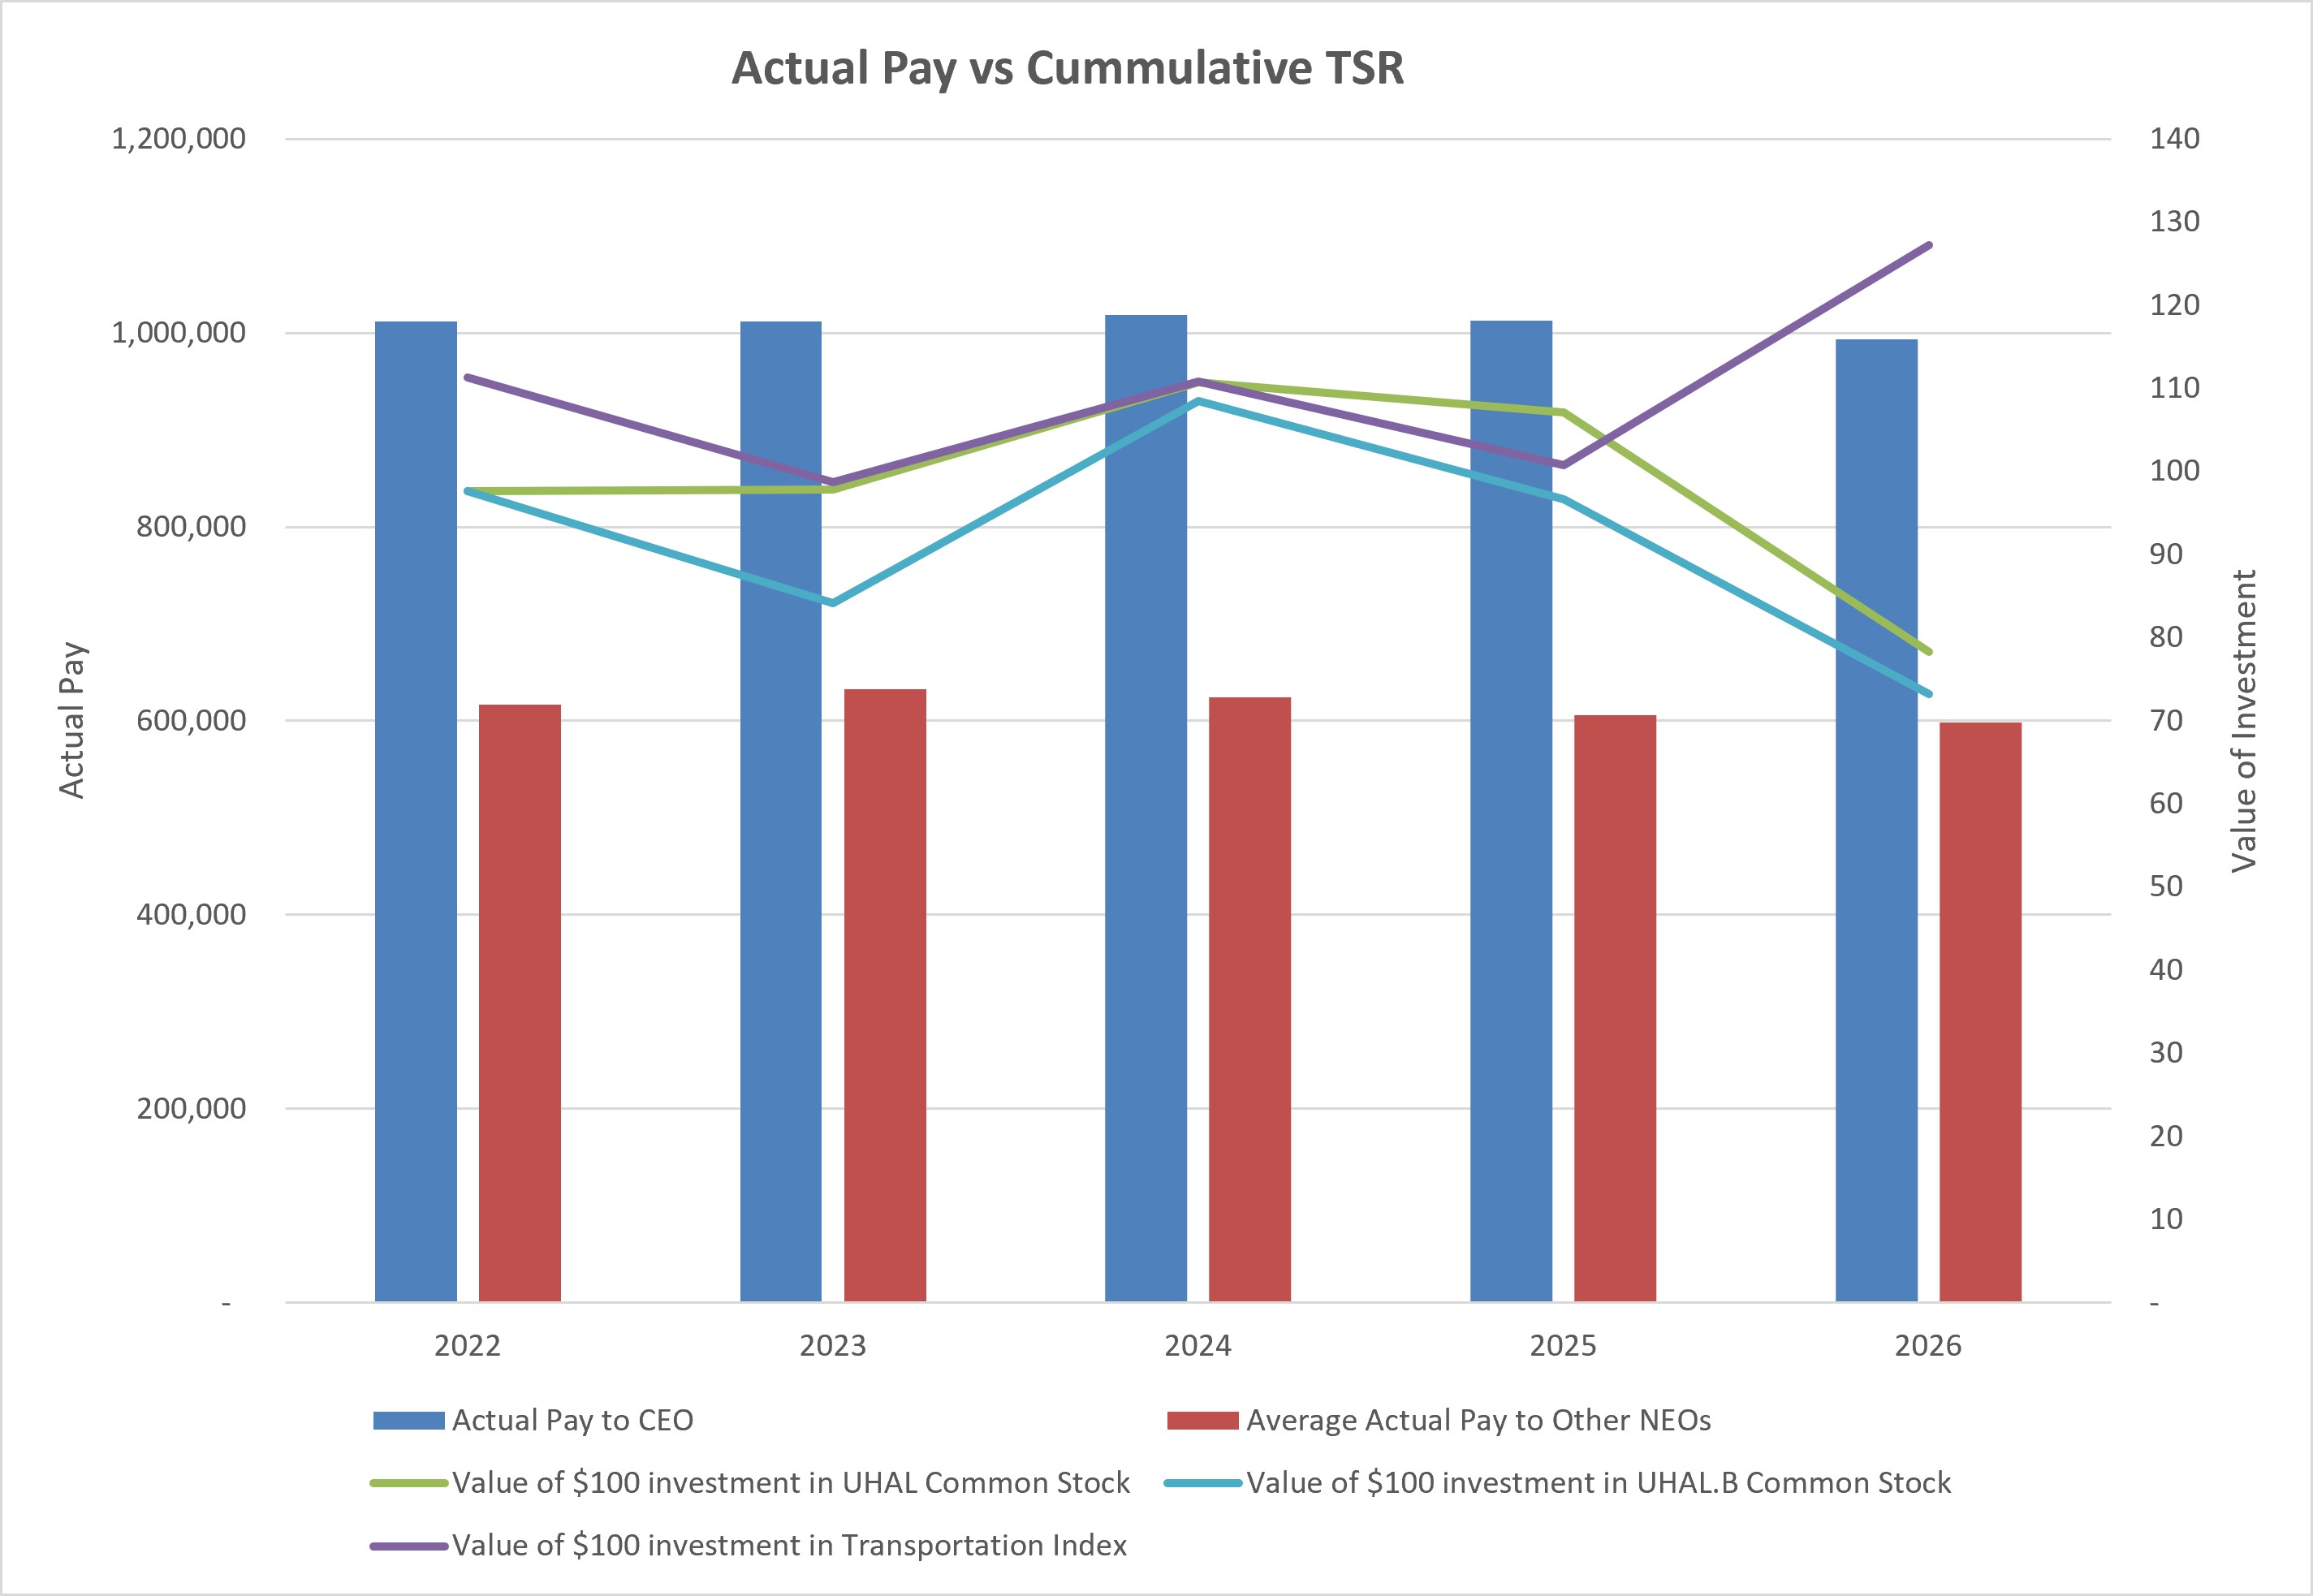
Description of Relationship Between Compensation Actually Paid and Company Total Shareholder Return (“TSR”). The following chart sets forth the relationship between Compensation Actually Paid to our PEO, the average of Compensation Actually Paid to our Non-PEO NEOs, and the Company’s cumulative TSR over the five most recently completed fiscal years.

img140321452_1.jpg

       
Compensation Actually Paid vs. Net Income

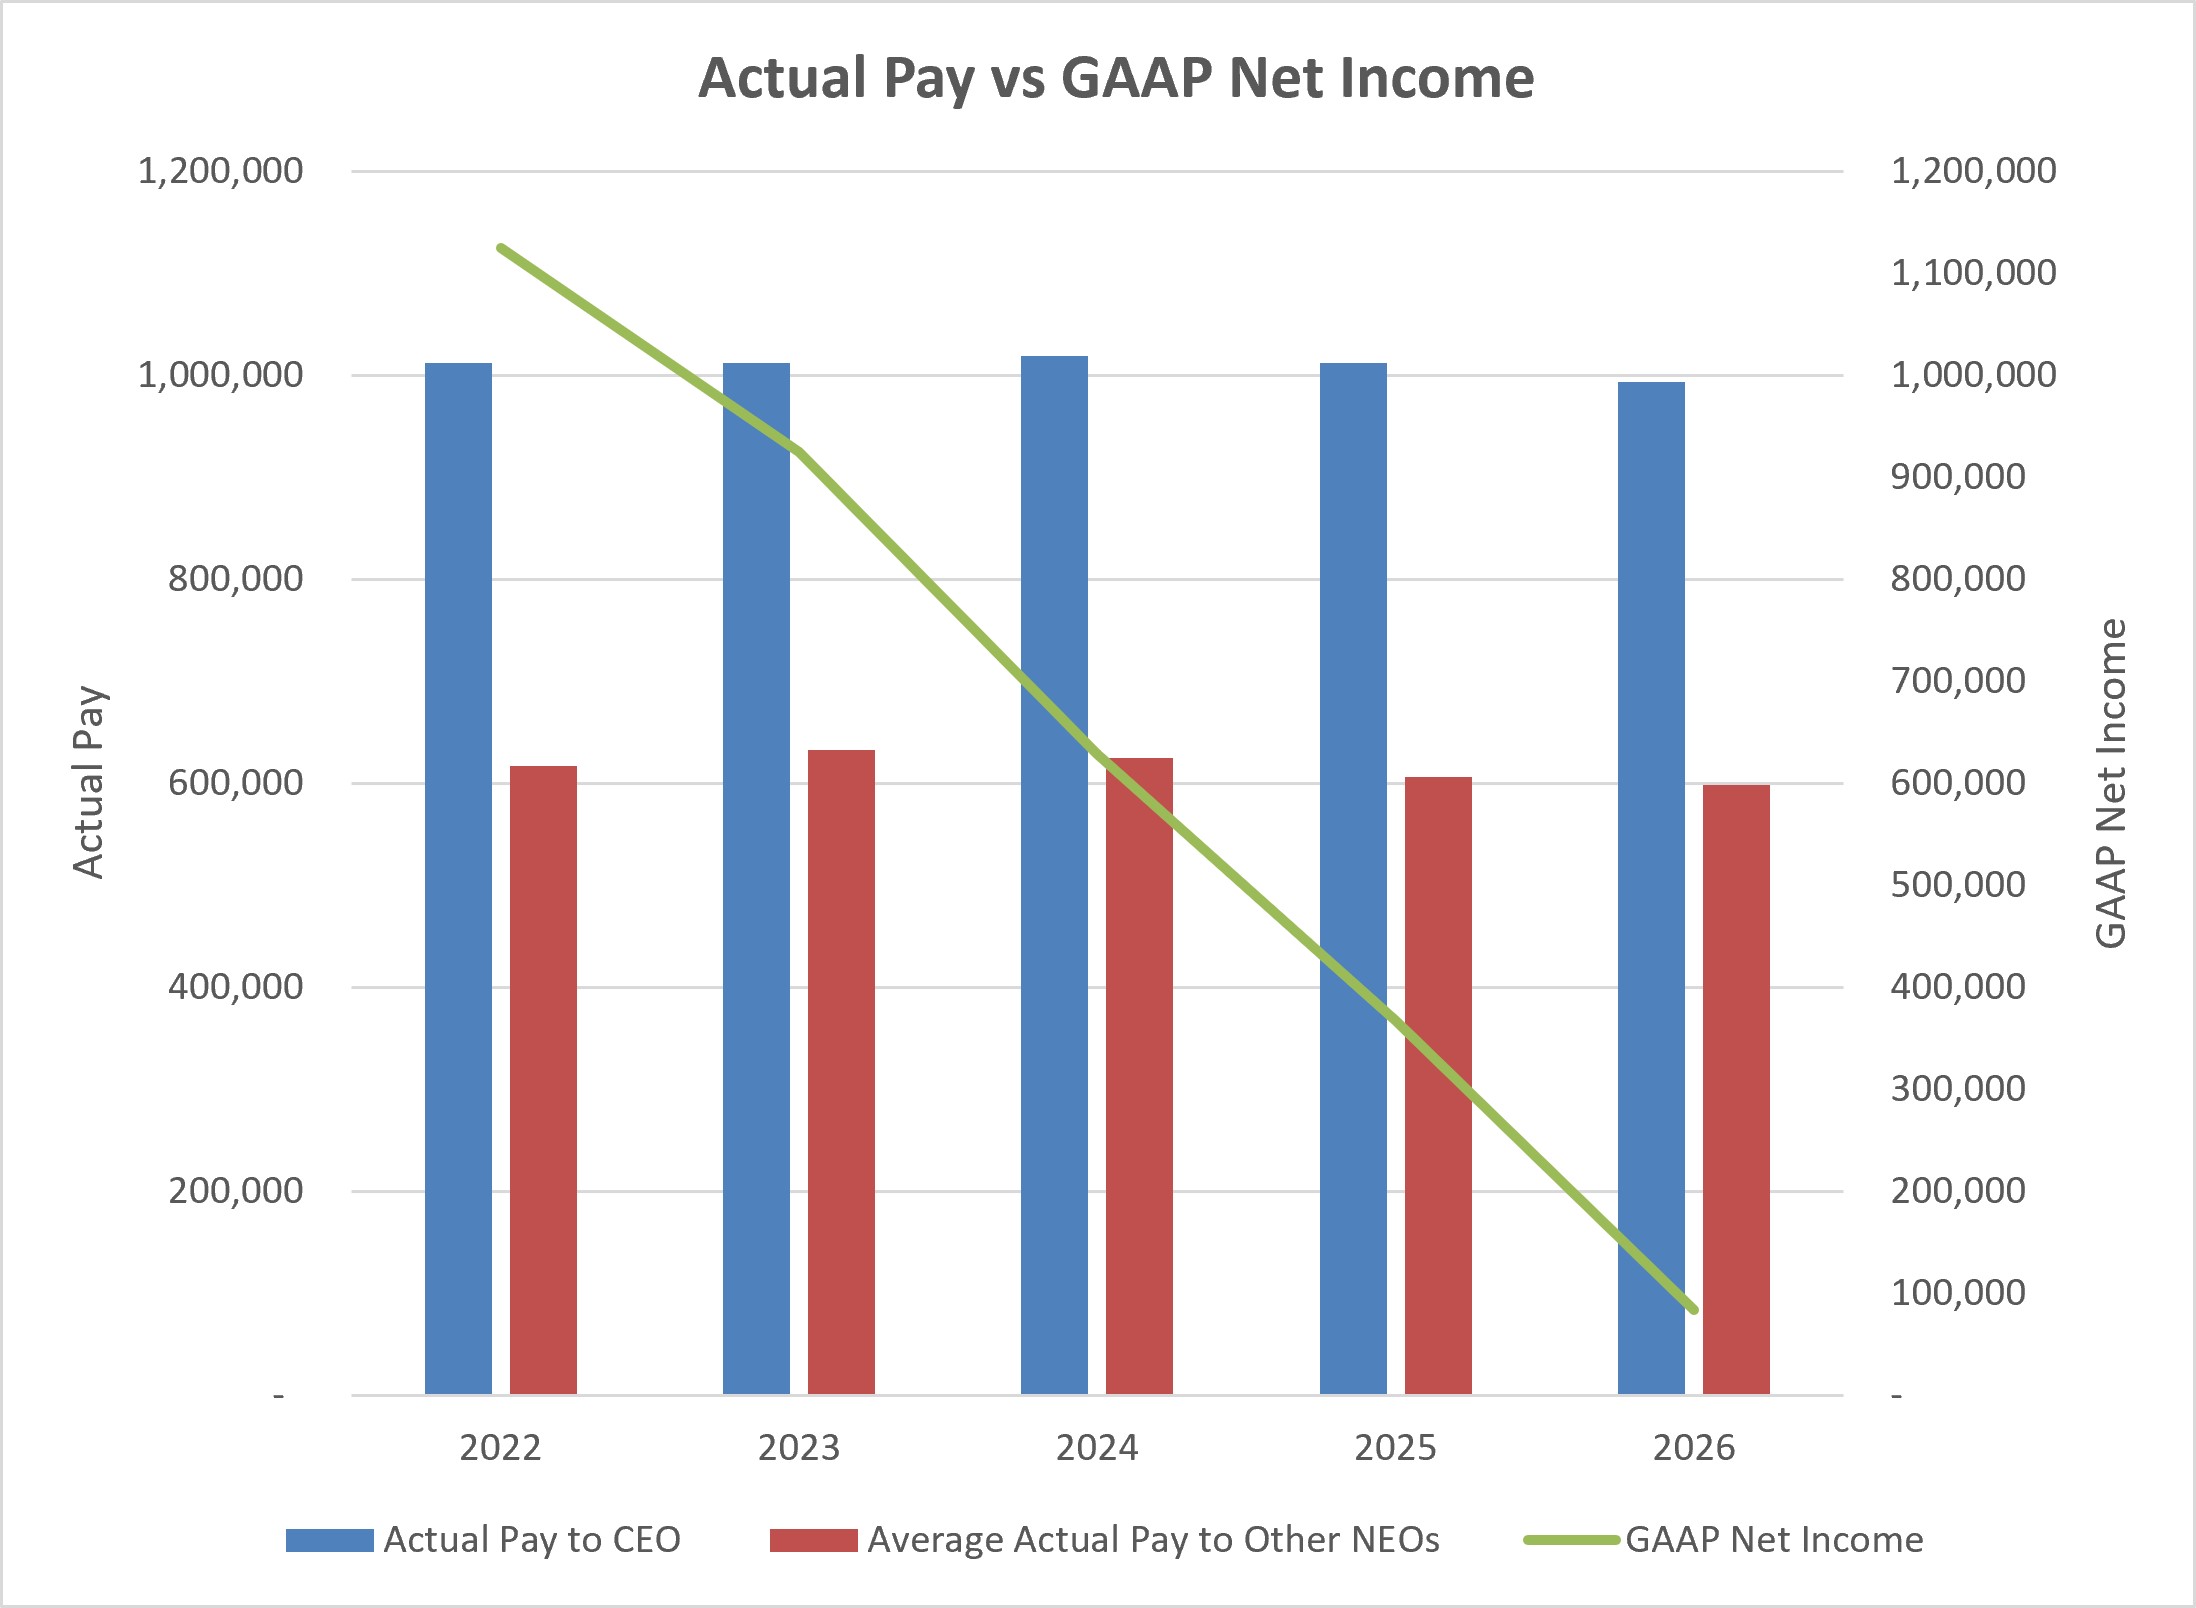
Description of Relationship Between Compensation Actually Paid and Net Income. The following chart sets forth the relationship between Compensation Actually Paid to our PEO, the average of Compensation Actually Paid to our Non-PEO NEOs, and our net income during each of the five most recently completed fiscal years.

img140321452_2.jpg

       
Compensation Actually Paid vs. Company Selected Measure

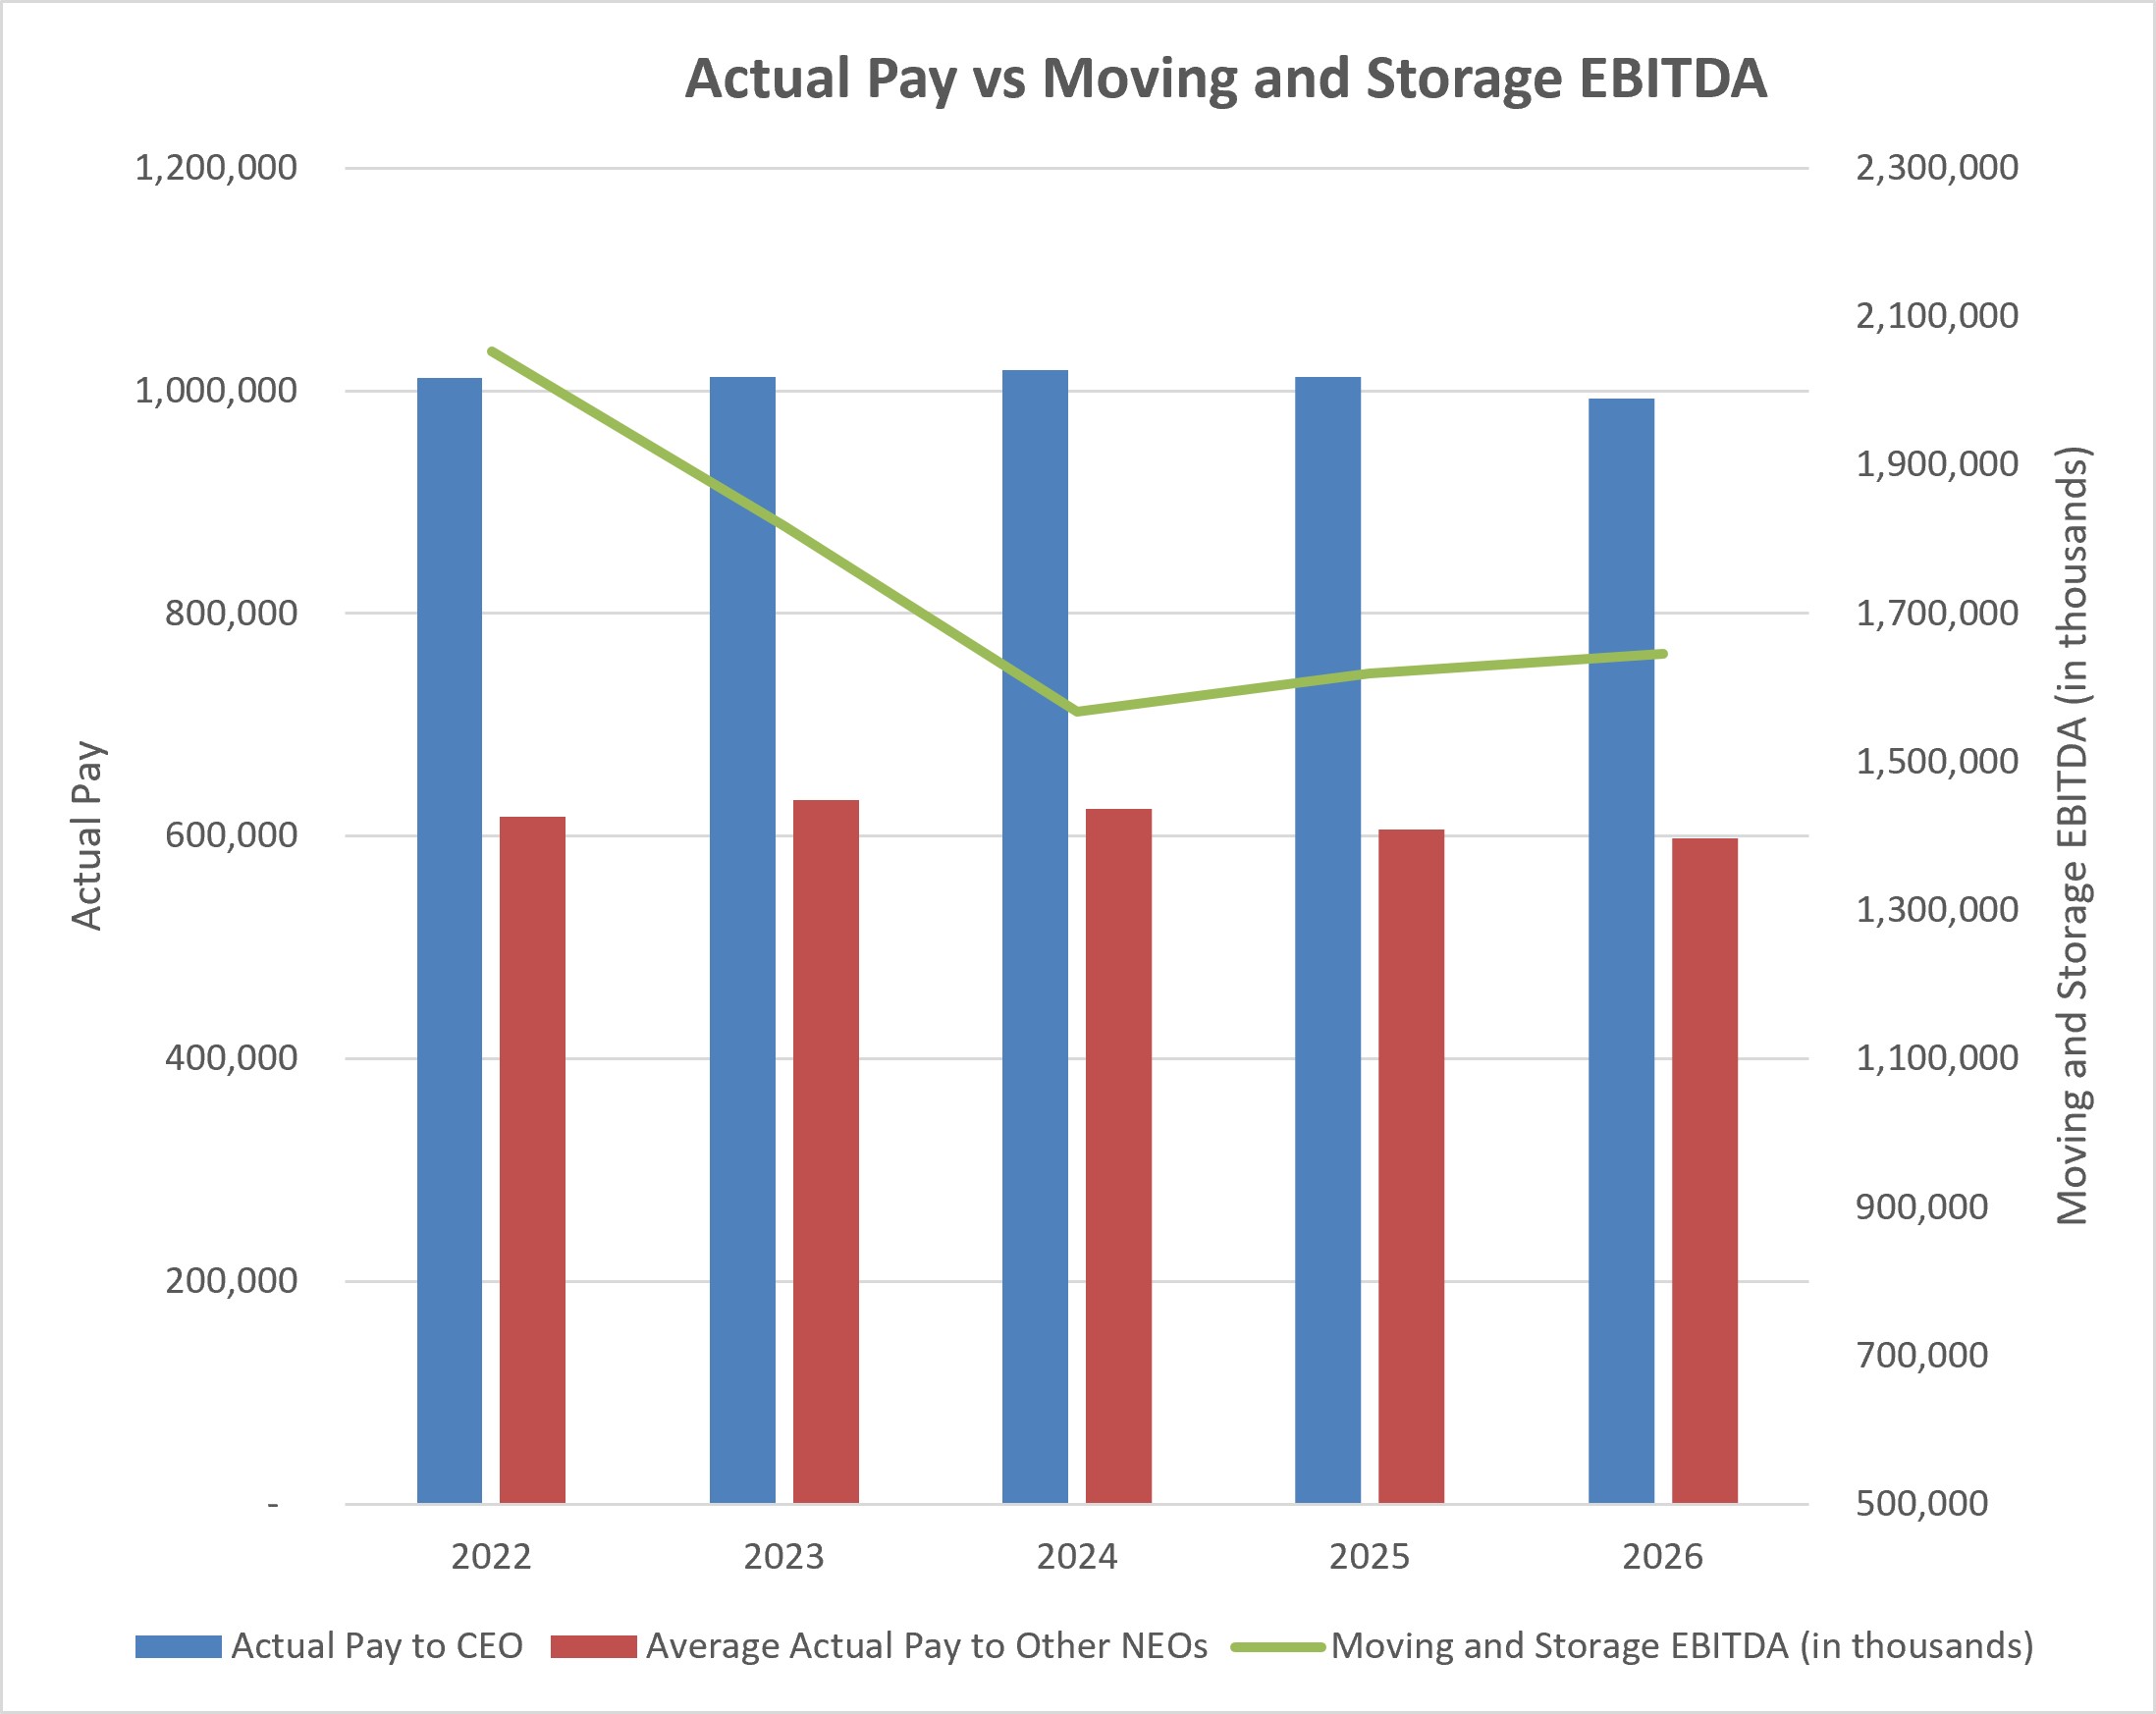
Description of Relationship Between Compensation Actually Paid and Moving and Storage adjusted EBITDA. The following chart sets forth the relationship between Compensation Actually Paid to our PEO, the average of Compensation Actually Paid to our Non-PEO NEOs, and Moving and Storage adjusted EBITDA (in thousands) during each of the five most recently completed fiscal years.

img140321452_3.jpg

       
Total Shareholder Return Vs Peer Group

Description of Relationship Between Company TSR and Peer Group TSR. The following chart compares our cumulative TSR over each of the five most recently completed fiscal years to that of the Dow Jones US Transportation Average Index over the same period.

img140321452_4.gif

       
Tabular List, Table

Tabular List of Most Important Financial Performance Measures. The following table presents the financial performance measures that the Company considers to have been the most important in linking Compensation Actually Paid to our PEO and Non-PEO NEOs for Fiscal 2026 to Company performance. The measures in this table are not ranked.

Most Important Financial Measures

Moving and Storage Adjusted EBITDA

Moving and Storage Combined Moving Transactions and Occupied Storage Unit Count

Moving and Storage Operating Cash Flows

       
Peer Group Total Shareholder Return Amount $ 127,190 100,780 110,800 98,680 111,290
Net Income (Loss) $ 83,128,000 $ 367,090,000 $ 628,707,000 $ 924,472,000 $ 1,124,362,000
Company Selected Measure Amount 1,645,859 1,619,714 1,567,985 1,817,521 2,052,723
PEO Name Edward J. Shoen Edward J. Shoen Edward J. Shoen Edward J. Shoen Edward J. Shoen
Measure:: 1          
Pay vs Performance Disclosure          
Name Moving and Storage Adjusted EBITDA        
Non-GAAP Measure Description Earnings before interest, taxes, depreciation, and amortization for our Moving and Storage segment ("Moving and Storage adjusted EBITDA"), is a non-GAAP financial measure as defined under SEC rules. We determined Moving and Storage adjusted EBITDA to be the most important financial performance measure used to link Company performance to Compensation Actually Paid to our PEO and Non-PEO NEOs in Fiscal 2026 and Fiscal 2025 and the fiscal years ended March 31, 2024 and March 31, 2023. Moving and Storage adjusted EBITDA may not have been the most important financial performance measure for the fiscal year ended March 31, 2022, and we may determine a different financial performance measure to be the most important financial performance measure in future years.        
Measure:: 2          
Pay vs Performance Disclosure          
Name Moving and Storage Combined Moving Transactions and Occupied Storage Unit Count        
Measure:: 3          
Pay vs Performance Disclosure          
Name Moving and Storage Operating Cash Flows        
U-HAULB [Member]          
Pay vs Performance Disclosure          
Total Shareholder Return Amount $ 73,230 $ 96,620 $ 96,620 $ 84,130 $ 97,670
U-HAUL [Member]          
Pay vs Performance Disclosure          
Total Shareholder Return Amount 78,330 107,150 110,720 97,790 97,670
PEO | Equity Awards [Member]          
Pay vs Performance Disclosure          
Adjustment to Compensation, Amount (13,569,000) (20,041,000) (10,064,000) (8,487,000) (9,740,000)
PEO | Fiscal Year End Value of Current Year Equity Awards [Member]          
Pay vs Performance Disclosure          
Adjustment to Compensation, Amount 10,285,000 19,609,000 12,331,000 9,036,000 9,420,000
PEO | Fiscal Year End Value Prior Year Equity Awards [Member]          
Pay vs Performance Disclosure          
Adjustment to Compensation, Amount (14,783,000) (10,944,000) (9,036,000) (9,420,000) (58,000)
PEO | Change in Value of Prior Equity Awards [Member]          
Pay vs Performance Disclosure          
Adjustment to Compensation, Amount (4,826,000) (1,387,000) 10,233,000 9,413,000 57,000
Non-PEO NEO | Equity Awards [Member]          
Pay vs Performance Disclosure          
Adjustment to Compensation, Amount (16,725,000) (22,388,000) (12,730,000) (10,579,000) (11,514,000)
Non-PEO NEO | Fiscal Year End Value of Current Year Equity Awards [Member]          
Pay vs Performance Disclosure          
Adjustment to Compensation, Amount 12,500,000 21,798,000 15,305,000 11,276,000 11,062,000
Non-PEO NEO | Fiscal Year End Value Prior Year Equity Awards [Member]          
Pay vs Performance Disclosure          
Adjustment to Compensation, Amount (15,581,000) (12,986,000) (11,276,000) (11,062,000) (4,225,000)
Non-PEO NEO | Change in Value of Prior Equity Awards [Member]          
Pay vs Performance Disclosure          
Adjustment to Compensation, Amount $ (926,000) $ (1,646,000) $ 12,904,000 $ 11,053,000 $ 4,117,000