The fund’s investment objective is to produce income and to provide an opportunity for growth of principal consistent with sound common stock investing.
This table describes the fees and expenses that you may pay if you buy, hold and sell shares of the fund. You may pay other fees, such as brokerage commissions and other fees to financial intermediaries, which are not reflected in the tables and examples below. For example, in addition to the fees and expenses described below, you may also be required to pay brokerage commissions on purchases and sales of Class F-2, F-3, 529-F-2 or 529-F-3 shares of the fund. You may qualify for sales charge discounts if you and your family invest, or agree to invest in the future, at least $25,000 in American Funds and Capital Group KKR Public-Private+ Funds (collectively “Capital Group Funds”) ($250,000 for Class 529-A shares). More information about these and other discounts is available from your financial professional, in the “Sales charge reductions and waivers” sections on page 34 of the prospectus and on page 66 of the fund’s statement of additional information, and in the sales charge waiver appendix to the prospectus.
| Shareholder fees (fees paid directly from your investment) | ||||||
| Share class: | A | 529-A | C
and 529-C |
529-E | All F and 529-F share classes | All
R share classes |
| Maximum sales charge (load) imposed on purchases (as a percentage of offering price) | 5.75% | 3.50% | none | none | none | none |
| Maximum deferred sales charge (load) (as a percentage of the amount redeemed) | 1.00* | 1.00* | 1.00% | none | none | none |
| Maximum sales charge (load) imposed on reinvested dividends | none | none | none | none | none | none |
| Redemption or exchange fees | none | none | none | none | none | none |
| Annual fund operating expenses (expenses that you pay each year as a percentage of the net asset value of your investment) | ||||||
| Share class: | A | C | F-1 | F-2 | F-3 | 529-A |
| Management fees | 0.22% | 0.22% | 0.22% | 0.22% | 0.22% | 0.22% |
| Distribution and/or service (12b-1) fees | 0.24 | 1.00 | 0.25 | none | none | 0.23 |
| Other expenses | 0.09 | 0.09 | 0.15 | 0.15 | 0.04 | 0.13 |
| Total annual fund operating expenses | 0.55 | 1.31 | 0.62 | 0.37 | 0.26 | 0.58 |
| Share class: | 529-C | 529-E | 529-F-2 | 529-F-3 | R-1 | R-2 |
| Management fees | 0.22% | 0.22% | 0.22% | 0.22% | 0.22% | 0.22% |
| Distribution and/or service (12b-1) fees | 1.00 | 0.50 | none | none | 1.00 | 0.75 |
| Other expenses | 0.14 | 0.12 | 0.13 | 0.09 | 0.13 | 0.38 |
| Total annual fund operating expenses | 1.36 | 0.84 | 0.35 | 0.31 | 1.35 | 1.35 |
| Share class: | R-2E | R-3 | R-4 | R-5E | R-5 | R-6 |
| Management fees | 0.22% | 0.22% | 0.22% | 0.22% | 0.22% | 0.22% |
| Distribution and/or service (12b-1) fees | 0.60 | 0.50 | 0.25 | none | none | none |
| Other expenses | 0.24 | 0.19 | 0.14 | 0.19 | 0.09 | 0.04 |
| Total annual fund operating expenses | 1.06 | 0.91 | 0.61 | 0.41 | 0.31 | 0.26 |
* A contingent deferred sales charge of 1.00% applies on certain redemptions made within 18 months following purchases of $1 million or more made without an initial sales charge. Contingent deferred sales charge is calculated based on the lesser of the offering price and market value of shares being sold.
This example is intended to help you compare the cost of investing in the fund with the cost of investing in other mutual funds.
The example assumes that you invest $10,000 in the fund for the time periods indicated and then redeem or hold all of your shares at the end of those periods. The example also assumes that your investment has a 5% return each year and that the fund’s operating expenses remain the same. You may be required to pay brokerage commissions on your purchases and sales of Class F-2, F-3, 529-F-2 or 529-F-3 shares of the fund, which are not reflected in the example.
| Share class: | A | C | F-1 | F-2 | F-3 | 529-A | 529-C | 529-E | 529-F-2 | 529-F-3 | R-1 | R-2 |
| 1 year | $628 | $233 | $63 | $38 | $27 | $407 | $238 | $86 | $36 | $32 | $137 | $137 |
| 3 years | 741 | 415 | 199 | 119 | 84 | 529 | 431 | 268 | 113 | 100 | 428 | 428 |
| 5 years | 865 | 718 | 346 | 208 | 146 | 662 | 745 | 466 | 197 | 174 | 739 | 739 |
| 10 years | 1,225 | 1,369 | 774 | 468 | 331 | 1,050 | 1,132 | 1,037 | 443 | 393 | 1,624 | 1,624 |
| Share class: | R-2E | R-3 | R-4 | R-5E | R-5 | R-6 | For the share classes listed to the right, you would pay the following if you did not redeem your shares: | Share class: | C | 529-C |
| 1 year | $108 | $93 | $62 | $42 | $32 | $27 | 1 year | $133 | $138 | |
| 3 years | 337 | 290 | 195 | 132 | 100 | 84 | 3 years | 415 | 431 | |
| 5 years | 585 | 504 | 340 | 230 | 174 | 146 | 5 years | 718 | 745 | |
| 10 years | 1,294 | 1,120 | 762 | 518 | 393 | 331 | 10 years | 1,369 | 1,132 |
The fund pays transaction costs, such as commissions, when it buys and sells securities (or “turns over” its portfolio). A higher portfolio turnover rate may indicate higher transaction costs and may result in higher taxes when fund shares are held in a taxable account. These costs, which are not reflected in annual fund operating expenses or in the example, affect the fund’s investment results. During the most recent fiscal year, the fund’s portfolio turnover rate was 32% of the average value of its portfolio.
The fund invests primarily in common stocks of established companies that are listed on, or meet the financial listing requirements of, the New York Stock Exchange and have a strong record of earnings and dividends. The fund strives to accomplish its objective through fundamental research, careful selection and broad diversification. In the selection of common stocks and other securities for investment, current and potential income as well as the potential for long-term capital appreciation are considered. The fund seeks to provide an above-average yield in its quarterly income distribution in relation to the S&P 500 Index (a broad, unmanaged index). The fund strives to maintain a fully invested, diversified portfolio, consisting primarily of high-quality common stocks.
The fund has Investment Standards originally based upon criteria established by the United States District Court for the District of Columbia for determining eligibility under the Court’s Legal List procedure, which was in effect for many years. The fund has an “Eligible List” — based on the Investment Standards — of securities considered appropriate for a prudent investor seeking opportunities for income and growth of principal consistent with common stock investing. The investment adviser generates and maintains the Eligible List in compliance with the fund’s Investment Standards and selects the fund’s investments exclusively from the securities on the Eligible List.
The investment adviser uses a system of multiple portfolio managers in managing the fund’s assets. Under this approach, the portfolio of the fund is divided into segments managed by individual managers.
The fund relies on the professional judgment of its investment adviser to make decisions about the fund’s portfolio investments. The basic investment philosophy of the investment adviser is to seek to invest in attractively valued companies that, in its opinion, represent good, long-term investment opportunities. Securities may be sold when the investment adviser believes that they no longer represent relatively attractive investment opportunities.
The following bar chart shows how the fund’s investment results have varied from year to year, and the following table shows how the fund’s average annual total returns for various periods compare with a broad measure of securities market results and, if applicable, other measures of market results that reflect the fund’s investment universe. This information provides some indication of the risks of investing in the fund. Past investment results (before and after taxes) are not predictive of future investment results. Updated information on the fund’s investment results can be obtained by visiting capitalgroup.com.
The following bar chart shows how the fund’s investment results have varied from year to year, and the following table shows how the fund’s average annual total returns for various periods compare with a broad measure of securities market results and, if applicable, other measures of market results that reflect the fund’s investment universe.
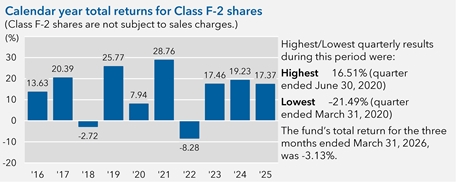
Highest/Lowest quarterly results during this period were:
Highest 16.51% (quarter ended June 30, 2020)
Lowest -21.49% (quarter ended March 31, 2020)
The fund's total return for the three months ended March 31, 2026, was -3.13%.
| Average annual total returns For the periods ended December 31, 2025: | |||||
| Share class | Inception date | 1 year | 5 years | 10 years | Lifetime |
| F-2 − Before taxes | 8/5/2008 | 17.37% | 14.19% | 13.37% | 11.21% |
| − After taxes on distributions | 14.57 | 12.06 | 11.45 | N/A | |
| − After taxes on distributions and sale of fund shares | 12.09 | 10.98 | 10.58 | N/A | |
| Share classes (before taxes) | Inception date | 1 year | 5 years | 10 years | Lifetime |
| A (with maximum sales charge) | 7/31/1952 | 10.41% | 12.62% | 12.48% | 11.88% |
| C | 3/15/2001 | 15.29 | 13.11 | 12.46 | 8.70 |
| F-1 | 3/15/2001 | 17.09 | 13.90 | 13.07 | 8.93 |
| F-3 | 1/27/2017 | 17.51 | 14.31 | N/A | 13.30 |
| 529-A (with maximum sales charge) | 2/15/2002 | 13.04 | 13.12 | 12.69 | 9.06 |
| 529-C | 2/15/2002 | 15.24 | 13.06 | 12.67 | 9.03 |
| 529-E | 3/1/2002 | 16.83 | 13.65 | 12.82 | 8.80 |
| 529-F-2 | 10/30/2020 | 17.41 | 14.21 | N/A | 16.81 |
| 529-F-3 | 10/30/2020 | 17.45 | 14.25 | N/A | 16.85 |
| R-1 | 5/29/2002 | 16.23 | 13.08 | 12.26 | 8.38 |
| R-2 | 5/31/2002 | 16.23 | 13.07 | 12.26 | 8.40 |
| R-2E | 8/29/2014 | 16.58 | 13.40 | 12.59 | 11.23 |
| R-3 | 6/4/2002 | 16.76 | 13.57 | 12.75 | 9.00 |
| R-4 | 5/20/2002 | 17.09 | 13.91 | 13.10 | 9.15 |
| R-5E | 11/20/2015 | 17.32 | 14.14 | 13.32 | 12.94 |
| R-5 | 5/15/2002 | 17.45 | 14.25 | 13.43 | 9.46 |
| R-6 | 5/1/2009 | 17.52 | 14.31 | 13.49 | 14.20 |
| Indexes | 1 year | 5 years | 10 years | Lifetime (from Class F-2 inception) |
| S&P 500 Index (reflects no deductions for sales charges, account fees, expenses or U.S. federal income taxes) | 17.88% | 14.42% | 14.82% | 12.23% |
| Class
F-2 annualized 30-day yield at April 30, 2026: 1.52% (For current yield information, please call American Funds Service Company at (800) 421-4225 or visit capitalgroup.com.) | ||||
After-tax returns are shown only for Class F-2 shares; after-tax returns for other share classes will vary. After-tax returns are calculated using the highest individual federal income tax rates in effect during each year of the periods shown and do not reflect the impact of state and local taxes. Your actual after-tax returns depend on your individual tax situation and likely will differ from the results shown above. In addition, after-tax returns are not relevant if you hold your fund shares through a tax-favored arrangement, such as a 401(k) plan, individual retirement account (IRA) or 529 college savings plan.