Shareholder Report
|
6 Months Ended |
|
Apr. 30, 2026
USD ($)
Holding
|
|---|
| Shareholder Report [Line Items] |
|
|
| Document Type |
N-CSRS
|
|
| Amendment Flag |
false
|
|
| Registrant Name |
AMERICAN BEACON FUNDS
|
|
| Entity Central Index Key |
0000809593
|
|
| Entity Investment Company Type |
N-1A
|
|
| Document Period End Date |
Apr. 30, 2026
|
|
| Shareholder Report Annual or Semi-Annual |
Semi-Annual Shareholder Report
|
|
| C000089421 |
|
|
| Shareholder Report [Line Items] |
|
|
| Fund Name |
Balanced Fund
|
|
| Class Name |
A
|
|
| Trading Symbol |
ABFAX
|
|
| Annual or Semi-Annual Statement [Text Block] |
This semi-annual shareholder report contains important information about American Beacon Balanced Fund for the period of November 1, 2025 to April 30, 2026.
|
|
| Additional Information [Text Block] |
You can find additional information about the Fund at www.americanbeaconfunds.com/fund-resources/. You can request this information by contacting us at 800-658-5811.
|
|
| Additional Information Phone Number |
800-658-5811
|
|
| Additional Information Website |
www.americanbeaconfunds.com/fund-resources/
|
|
| Expenses [Text Block] |
What were the Fund costs for the last six months?(based on a hypothetical $10,000 investment)
Table Summary
Class Name |
Costs of a $10,000 investment |
Costs paid as a percentage of a $10,000 investment |
Class A |
$60 |
1.18%Footnote Reference* |
| Footnote |
Description |
Footnote* |
Annualized. | |
|
| Expenses Paid, Amount |
$ 60
|
|
| Expense Ratio, Percent |
1.18%
|
[1] |
| AssetsNet |
$ 107,835,283
|
|
| Holdings Count | Holding |
380
|
|
| Advisory Fees Paid, Amount |
$ 278,989
|
|
| InvestmentCompanyPortfolioTurnover |
16.00%
|
|
| Additional Fund Statistics [Text Block] |
Table Summary
Total Net Assets |
$107,835,283 |
# of Portfolio Holdings |
380 |
Portfolio Turnover Rate |
16% |
Total Management Fees Paid |
$278,989 | |
|
| Holdings [Text Block] |
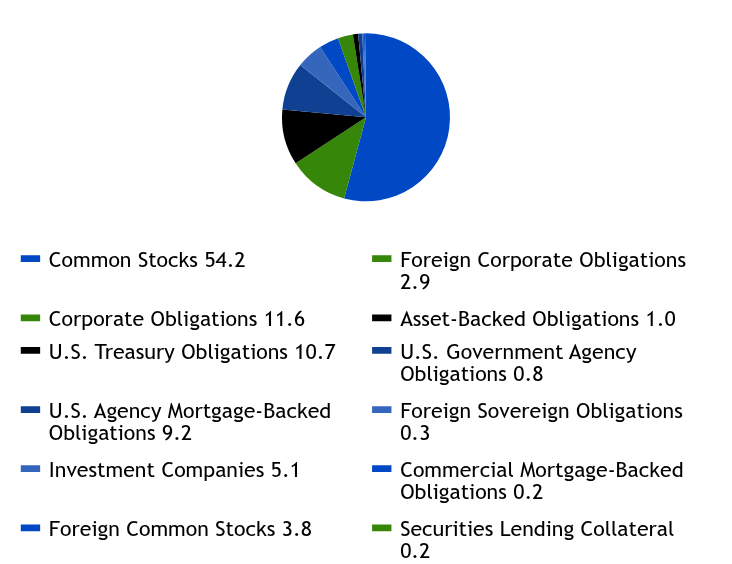
Asset Allocation - % Investments
Table Summary
Value |
Value |
Common Stocks |
54.2 |
Corporate Obligations |
11.6 |
U.S. Treasury Obligations |
10.7 |
U.S. Agency Mortgage-Backed Obligations |
9.2 |
Investment Companies |
5.1 |
Foreign Common Stocks |
3.8 |
Foreign Corporate Obligations |
2.9 |
Asset-Backed Obligations |
1.0 |
U.S. Government Agency Obligations |
0.8 |
Foreign Sovereign Obligations |
0.3 |
Commercial Mortgage-Backed Obligations |
0.2 |
Securities Lending Collateral |
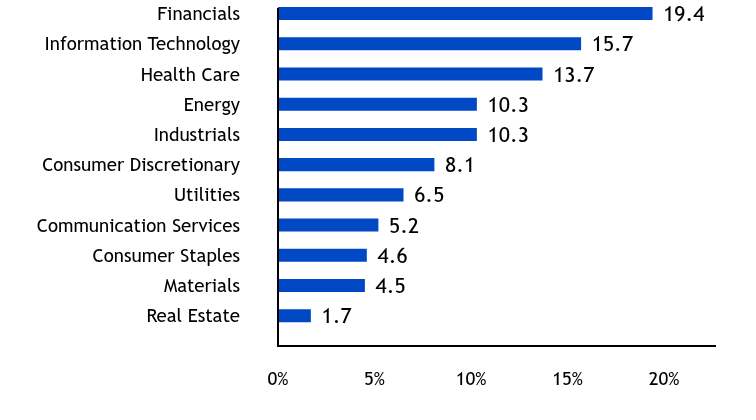
0.2 | The Fund may purchase and sell futures contracts to gain market exposure on cash balances. Sector Allocation - % Equities
Table Summary
Value |
Value |
Real Estate |
1.7 |
Materials |
4.5 |
Consumer Staples |
4.6 |
Communication Services |
5.2 |
Utilities |
6.5 |
Consumer Discretionary |
8.1 |
Industrials |
10.3 |
Energy |
10.3 |
Health Care |
13.7 |
Information Technology |
15.7 |
Financials |
19.4 | |
|
| Largest Holdings [Text Block] |
Top Ten Holdings - % Net Assets
Table Summary
U.S. Treasury Notes, 3.750%, Due 8/31/2026 |
2.3 |
Alphabet, Inc., Class A |
1.6 |
GE HealthCare Technologies, Inc. |
1.5 |
Bank of America Corp. |
1.4 |
Workday, Inc., Class A |
1.3 |
APA Corp. |
1.3 |
UnitedHealth Group, Inc. |
1.2 |
Carnival Corp. |
1.2 |
Microchip Technology, Inc. |
1.1 |
Elevance Health, Inc. |
1.1 | Excludes cash equivalents. |
|
| Material Fund Change [Text Block] |
|
|
| Accountant Change Statement [Text Block] |
|
|
| C000004802 |
|
|
| Shareholder Report [Line Items] |
|
|
| Fund Name |
Balanced Fund
|
|
| Class Name |
Advisor
|
|
| Trading Symbol |
ABLSX
|
|
| Annual or Semi-Annual Statement [Text Block] |
This semi-annual shareholder report contains important information about American Beacon Balanced Fund for the period of November 1, 2025 to April 30, 2026.
|
|
| Additional Information [Text Block] |
You can find additional information about the Fund at www.americanbeaconfunds.com/fund-resources/. You can request this information by contacting us at 800-658-5811.
|
|
| Additional Information Phone Number |
800-658-5811
|
|
| Additional Information Website |
www.americanbeaconfunds.com/fund-resources/
|
|
| Expenses [Text Block] |
What were the Fund costs for the last six months?(based on a hypothetical $10,000 investment)
Table Summary
Class Name |
Costs of a $10,000 investment |
Costs paid as a percentage of a $10,000 investment |
Advisor Class |
$68 |
1.35%Footnote Reference* |
| Footnote |
Description |
Footnote* |
Annualized. | |
|
| Expenses Paid, Amount |
$ 68
|
|
| Expense Ratio, Percent |
1.35%
|
[2] |
| AssetsNet |
$ 107,835,283
|
|
| Holdings Count | Holding |
380
|
|
| Advisory Fees Paid, Amount |
$ 278,989
|
|
| InvestmentCompanyPortfolioTurnover |
16.00%
|
|
| Additional Fund Statistics [Text Block] |
Table Summary
Total Net Assets |
$107,835,283 |
# of Portfolio Holdings |
380 |
Portfolio Turnover Rate |
16% |
Total Management Fees Paid |
$278,989 | |
|
| Holdings [Text Block] |
Asset Allocation - % Investments
Table Summary
Value |
Value |
Common Stocks |
54.2 |
Corporate Obligations |
11.6 |
U.S. Treasury Obligations |
10.7 |
U.S. Agency Mortgage-Backed Obligations |
9.2 |
Investment Companies |
5.1 |
Foreign Common Stocks |
3.8 |
Foreign Corporate Obligations |
2.9 |
Asset-Backed Obligations |
1.0 |
U.S. Government Agency Obligations |
0.8 |
Foreign Sovereign Obligations |
0.3 |
Commercial Mortgage-Backed Obligations |
0.2 |
Securities Lending Collateral |
0.2 | The Fund may purchase and sell futures contracts to gain market exposure on cash balances. Sector Allocation - % Equities
Table Summary
Value |
Value |
Real Estate |
1.7 |
Materials |
4.5 |
Consumer Staples |
4.6 |
Communication Services |
5.2 |
Utilities |
6.5 |
Consumer Discretionary |
8.1 |
Industrials |
10.3 |
Energy |
10.3 |
Health Care |
13.7 |
Information Technology |
15.7 |
Financials |
19.4 | |
|
| Largest Holdings [Text Block] |
Top Ten Holdings - % Net Assets
Table Summary
U.S. Treasury Notes, 3.750%, Due 8/31/2026 |
2.3 |
Alphabet, Inc., Class A |
1.6 |
GE HealthCare Technologies, Inc. |
1.5 |
Bank of America Corp. |
1.4 |
Workday, Inc., Class A |
1.3 |
APA Corp. |
1.3 |
UnitedHealth Group, Inc. |
1.2 |
Carnival Corp. |
1.2 |
Microchip Technology, Inc. |
1.1 |
Elevance Health, Inc. |
1.1 | Excludes cash equivalents. |
|
| Material Fund Change [Text Block] |
|
|
| Accountant Change Statement [Text Block] |
|
|
| C000092338 |
|
|
| Shareholder Report [Line Items] |
|
|
| Fund Name |
Balanced Fund
|
|
| Class Name |
C
|
|
| Trading Symbol |
ABCCX
|
|
| Annual or Semi-Annual Statement [Text Block] |
This semi-annual shareholder report contains important information about American Beacon Balanced Fund for the period of November 1, 2025 to April 30, 2026.
|
|
| Additional Information [Text Block] |
You can find additional information about the Fund at www.americanbeaconfunds.com/fund-resources/. You can request this information by contacting us at 800-658-5811.
|
|
| Additional Information Phone Number |
800-658-5811
|
|
| Additional Information Website |
www.americanbeaconfunds.com/fund-resources/
|
|
| Expenses [Text Block] |
What were the Fund costs for the last six months?(based on a hypothetical $10,000 investment)
Table Summary
Class Name |
Costs of a $10,000 investment |
Costs paid as a percentage of a $10,000 investment |
Class C |
$98 |
1.94%Footnote Reference* |
| Footnote |
Description |
Footnote* |
Annualized. | |
|
| Expenses Paid, Amount |
$ 98
|
|
| Expense Ratio, Percent |
1.94%
|
[3] |
| AssetsNet |
$ 107,835,283
|
|
| Holdings Count | Holding |
380
|
|
| Advisory Fees Paid, Amount |
$ 278,989
|
|
| InvestmentCompanyPortfolioTurnover |
16.00%
|
|
| Additional Fund Statistics [Text Block] |
Table Summary
Total Net Assets |
$107,835,283 |
# of Portfolio Holdings |
380 |
Portfolio Turnover Rate |
16% |
Total Management Fees Paid |
$278,989 | |
|
| Holdings [Text Block] |
Asset Allocation - % Investments
Table Summary
Value |
Value |
Common Stocks |
54.2 |
Corporate Obligations |
11.6 |
U.S. Treasury Obligations |
10.7 |
U.S. Agency Mortgage-Backed Obligations |
9.2 |
Investment Companies |
5.1 |
Foreign Common Stocks |
3.8 |
Foreign Corporate Obligations |
2.9 |
Asset-Backed Obligations |
1.0 |
U.S. Government Agency Obligations |
0.8 |
Foreign Sovereign Obligations |
0.3 |
Commercial Mortgage-Backed Obligations |
0.2 |
Securities Lending Collateral |
0.2 | The Fund may purchase and sell futures contracts to gain market exposure on cash balances. Sector Allocation - % Equities
Table Summary
Value |
Value |
Real Estate |
1.7 |
Materials |
4.5 |
Consumer Staples |
4.6 |
Communication Services |
5.2 |
Utilities |
6.5 |
Consumer Discretionary |
8.1 |
Industrials |
10.3 |
Energy |
10.3 |
Health Care |
13.7 |
Information Technology |
15.7 |
Financials |
19.4 | |
|
| Largest Holdings [Text Block] |
Top Ten Holdings - % Net Assets
Table Summary
U.S. Treasury Notes, 3.750%, Due 8/31/2026 |
2.3 |
Alphabet, Inc., Class A |
1.6 |
GE HealthCare Technologies, Inc. |
1.5 |
Bank of America Corp. |
1.4 |
Workday, Inc., Class A |
1.3 |
APA Corp. |
1.3 |
UnitedHealth Group, Inc. |
1.2 |
Carnival Corp. |
1.2 |
Microchip Technology, Inc. |
1.1 |
Elevance Health, Inc. |
1.1 | Excludes cash equivalents. |
|
| Material Fund Change [Text Block] |
|
|
| Accountant Change Statement [Text Block] |
|
|
| C000002090 |
|
|
| Shareholder Report [Line Items] |
|
|
| Fund Name |
Balanced Fund
|
|
| Class Name |
Investor
|
|
| Trading Symbol |
AABPX
|
|
| Annual or Semi-Annual Statement [Text Block] |
This semi-annual shareholder report contains important information about American Beacon Balanced Fund for the period of November 1, 2025 to April 30, 2026.
|
|
| Additional Information [Text Block] |
You can find additional information about the Fund at www.americanbeaconfunds.com/fund-resources/. You can request this information by contacting us at 800-658-5811.
|
|
| Additional Information Phone Number |
800-658-5811
|
|
| Additional Information Website |
www.americanbeaconfunds.com/fund-resources/
|
|
| Expenses [Text Block] |
What were the Fund costs for the last six months?(based on a hypothetical $10,000 investment)
Table Summary
Class Name |
Costs of a $10,000 investment |
Costs paid as a percentage of a $10,000 investment |
Investor |
$58 |
1.14%Footnote Reference* |
| Footnote |
Description |
Footnote* |
Annualized. | |
|
| Expenses Paid, Amount |
$ 58
|
|
| Expense Ratio, Percent |
1.14%
|
[4] |
| AssetsNet |
$ 107,835,283
|
|
| Holdings Count | Holding |
380
|
|
| Advisory Fees Paid, Amount |
$ 278,989
|
|
| InvestmentCompanyPortfolioTurnover |
16.00%
|
|
| Additional Fund Statistics [Text Block] |
Table Summary
Total Net Assets |
$107,835,283 |
# of Portfolio Holdings |
380 |
Portfolio Turnover Rate |
16% |
Total Management Fees Paid |
$278,989 | |
|
| Holdings [Text Block] |
Asset Allocation - % Investments
Table Summary
Value |
Value |
Common Stocks |
54.2 |
Corporate Obligations |
11.6 |
U.S. Treasury Obligations |
10.7 |
U.S. Agency Mortgage-Backed Obligations |
9.2 |
Investment Companies |
5.1 |
Foreign Common Stocks |
3.8 |
Foreign Corporate Obligations |
2.9 |
Asset-Backed Obligations |
1.0 |
U.S. Government Agency Obligations |
0.8 |
Foreign Sovereign Obligations |
0.3 |
Commercial Mortgage-Backed Obligations |
0.2 |
Securities Lending Collateral |
0.2 | The Fund may purchase and sell futures contracts to gain market exposure on cash balances. Sector Allocation - % Equities
Table Summary
Value |
Value |
Real Estate |
1.7 |
Materials |
4.5 |
Consumer Staples |
4.6 |
Communication Services |
5.2 |
Utilities |
6.5 |
Consumer Discretionary |
8.1 |
Industrials |
10.3 |
Energy |
10.3 |
Health Care |
13.7 |
Information Technology |
15.7 |
Financials |
19.4 | |
|
| Largest Holdings [Text Block] |
Top Ten Holdings - % Net Assets
Table Summary
U.S. Treasury Notes, 3.750%, Due 8/31/2026 |
2.3 |
Alphabet, Inc., Class A |
1.6 |
GE HealthCare Technologies, Inc. |
1.5 |
Bank of America Corp. |
1.4 |
Workday, Inc., Class A |
1.3 |
APA Corp. |
1.3 |
UnitedHealth Group, Inc. |
1.2 |
Carnival Corp. |
1.2 |
Microchip Technology, Inc. |
1.1 |
Elevance Health, Inc. |
1.1 | Excludes cash equivalents. |
|
| Material Fund Change [Text Block] |
|
|
| Accountant Change Statement [Text Block] |
|
|
| C000002089 |
|
|
| Shareholder Report [Line Items] |
|
|
| Fund Name |
Balanced Fund
|
|
| Class Name |
R5
|
|
| Trading Symbol |
AADBX
|
|
| Annual or Semi-Annual Statement [Text Block] |
This semi-annual shareholder report contains important information about American Beacon Balanced Fund for the period of November 1, 2025 to April 30, 2026.
|
|
| Additional Information [Text Block] |
You can find additional information about the Fund at www.americanbeaconfunds.com/fund-resources/. You can request this information by contacting us at 800-658-5811.
|
|
| Additional Information Phone Number |
800-658-5811
|
|
| Additional Information Website |
www.americanbeaconfunds.com/fund-resources/
|
|
| Expenses [Text Block] |
What were the Fund costs for the last six months?(based on a hypothetical $10,000 investment)
Table Summary
Class Name |
Costs of a $10,000 investment |
Costs paid as a percentage of a $10,000 investment |
R5 |
$44 |
0.87%Footnote Reference* |
| Footnote |
Description |
Footnote* |
Annualized. | |
|
| Expenses Paid, Amount |
$ 44
|
|
| Expense Ratio, Percent |
0.87%
|
[5] |
| AssetsNet |
$ 107,835,283
|
|
| Holdings Count | Holding |
380
|
|
| Advisory Fees Paid, Amount |
$ 278,989
|
|
| InvestmentCompanyPortfolioTurnover |
16.00%
|
|
| Additional Fund Statistics [Text Block] |
Table Summary
Total Net Assets |
$107,835,283 |
# of Portfolio Holdings |
380 |
Portfolio Turnover Rate |
16% |
Total Management Fees Paid |
$278,989 | |
|
| Holdings [Text Block] |
Asset Allocation - % Investments
Table Summary
Value |
Value |
Common Stocks |
54.2 |
Corporate Obligations |
11.6 |
U.S. Treasury Obligations |
10.7 |
U.S. Agency Mortgage-Backed Obligations |
9.2 |
Investment Companies |
5.1 |
Foreign Common Stocks |
3.8 |
Foreign Corporate Obligations |
2.9 |
Asset-Backed Obligations |
1.0 |
U.S. Government Agency Obligations |
0.8 |
Foreign Sovereign Obligations |
0.3 |
Commercial Mortgage-Backed Obligations |
0.2 |
Securities Lending Collateral |
0.2 | The Fund may purchase and sell futures contracts to gain market exposure on cash balances. Sector Allocation - % Equities
Table Summary
Value |
Value |
Real Estate |
1.7 |
Materials |
4.5 |
Consumer Staples |
4.6 |
Communication Services |
5.2 |
Utilities |
6.5 |
Consumer Discretionary |
8.1 |
Industrials |
10.3 |
Energy |
10.3 |
Health Care |
13.7 |
Information Technology |
15.7 |
Financials |
19.4 | |
|
| Largest Holdings [Text Block] |
Top Ten Holdings - % Net Assets
Table Summary
U.S. Treasury Notes, 3.750%, Due 8/31/2026 |
2.3 |
Alphabet, Inc., Class A |
1.6 |
GE HealthCare Technologies, Inc. |
1.5 |
Bank of America Corp. |
1.4 |
Workday, Inc., Class A |
1.3 |
APA Corp. |
1.3 |
UnitedHealth Group, Inc. |
1.2 |
Carnival Corp. |
1.2 |
Microchip Technology, Inc. |
1.1 |
Elevance Health, Inc. |
1.1 | Excludes cash equivalents. |
|
| Material Fund Change [Text Block] |
|
|
| Accountant Change Statement [Text Block] |
|
|
| C000085576 |
|
|
| Shareholder Report [Line Items] |
|
|
| Fund Name |
Balanced Fund
|
|
| Class Name |
Y
|
|
| Trading Symbol |
ACBYX
|
|
| Annual or Semi-Annual Statement [Text Block] |
This semi-annual shareholder report contains important information about American Beacon Balanced Fund for the period of November 1, 2025 to April 30, 2026.
|
|
| Additional Information [Text Block] |
You can find additional information about the Fund at www.americanbeaconfunds.com/fund-resources/. You can request this information by contacting us at 800-658-5811.
|
|
| Additional Information Phone Number |
800-658-5811
|
|
| Additional Information Website |
www.americanbeaconfunds.com/fund-resources/
|
|
| Expenses [Text Block] |
What were the Fund costs for the last six months?(based on a hypothetical $10,000 investment)
Table Summary
Class Name |
Costs of a $10,000 investment |
Costs paid as a percentage of a $10,000 investment |
Y |
$47 |
0.93%Footnote Reference* |
| Footnote |
Description |
Footnote* |
Annualized. | |
|
| Expenses Paid, Amount |
$ 47
|
|
| Expense Ratio, Percent |
0.93%
|
[6] |
| AssetsNet |
$ 107,835,283
|
|
| Holdings Count | Holding |
380
|
|
| Advisory Fees Paid, Amount |
$ 278,989
|
|
| InvestmentCompanyPortfolioTurnover |
16.00%
|
|
| Additional Fund Statistics [Text Block] |
Table Summary
Total Net Assets |
$107,835,283 |
# of Portfolio Holdings |
380 |
Portfolio Turnover Rate |
16% |
Total Management Fees Paid |
$278,989 | |
|
| Holdings [Text Block] |
Asset Allocation - % Investments
Table Summary
Value |
Value |
Common Stocks |
54.2 |
Corporate Obligations |
11.6 |
U.S. Treasury Obligations |
10.7 |
U.S. Agency Mortgage-Backed Obligations |
9.2 |
Investment Companies |
5.1 |
Foreign Common Stocks |
3.8 |
Foreign Corporate Obligations |
2.9 |
Asset-Backed Obligations |
1.0 |
U.S. Government Agency Obligations |
0.8 |
Foreign Sovereign Obligations |
0.3 |
Commercial Mortgage-Backed Obligations |
0.2 |
Securities Lending Collateral |
0.2 | The Fund may purchase and sell futures contracts to gain market exposure on cash balances. Sector Allocation - % Equities
Table Summary
Value |
Value |
Real Estate |
1.7 |
Materials |
4.5 |
Consumer Staples |
4.6 |
Communication Services |
5.2 |
Utilities |
6.5 |
Consumer Discretionary |
8.1 |
Industrials |
10.3 |
Energy |
10.3 |
Health Care |
13.7 |
Information Technology |
15.7 |
Financials |
19.4 | |
|
| Largest Holdings [Text Block] |
Top Ten Holdings - % Net Assets
Table Summary
U.S. Treasury Notes, 3.750%, Due 8/31/2026 |
2.3 |
Alphabet, Inc., Class A |
1.6 |
GE HealthCare Technologies, Inc. |
1.5 |
Bank of America Corp. |
1.4 |
Workday, Inc., Class A |
1.3 |
APA Corp. |
1.3 |
UnitedHealth Group, Inc. |
1.2 |
Carnival Corp. |
1.2 |
Microchip Technology, Inc. |
1.1 |
Elevance Health, Inc. |
1.1 | Excludes cash equivalents. |
|
| Material Fund Change [Text Block] |
|
|
| Accountant Change Statement [Text Block] |
|
|
| C000089428 |
|
|
| Shareholder Report [Line Items] |
|
|
| Fund Name |
International Equity Fund
|
|
| Class Name |
A
|
|
| Trading Symbol |
AIEAX
|
|
| Annual or Semi-Annual Statement [Text Block] |
This semi-annual shareholder report contains important information about American Beacon International Equity Fund for the period of November 1, 2025 to April 30, 2026.
|
|
| Additional Information [Text Block] |
You can find additional information about the Fund at www.americanbeaconfunds.com/fund-resources/. You can request this information by contacting us at 800-658-5811.
|
|
| Additional Information Phone Number |
800-658-5811
|
|
| Additional Information Website |
www.americanbeaconfunds.com/fund-resources/
|
|
| Expenses [Text Block] |
What were the Fund costs for the last six months?(based on a hypothetical $10,000 investment)
Table Summary
Class Name |
Costs of a $10,000 investment |
Costs paid as a percentage of a $10,000 investment |
Class A |
$61 |
1.18%Footnote Reference* |
| Footnote |
Description |
Footnote* |
Annualized. | |
|
| Expenses Paid, Amount |
$ 61
|
|
| Expense Ratio, Percent |
1.18%
|
[7] |
| AssetsNet |
$ 588,733,814
|
|
| Holdings Count | Holding |
160
|
|
| Advisory Fees Paid, Amount |
$ 1,715,972
|
|
| InvestmentCompanyPortfolioTurnover |
28.00%
|
|
| Additional Fund Statistics [Text Block] |
Table Summary
Total Net Assets |
$588,733,814 |
# of Portfolio Holdings |
160 |
Portfolio Turnover Rate |
28% |
Total Management Fees Paid |
$1,715,972 | |
|
| Holdings [Text Block] |
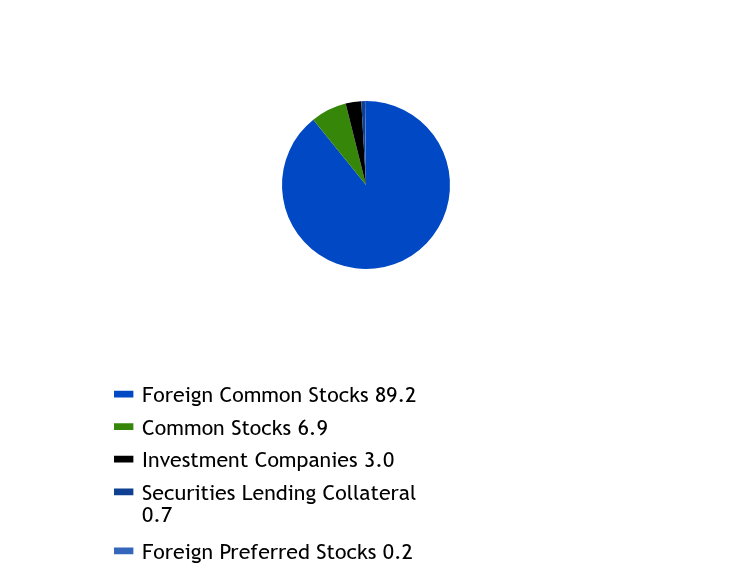
Asset Allocation - % Investments
Table Summary
Value |
Value |
Foreign Common Stocks |
89.2 |
Common Stocks |
6.9 |
Investment Companies |
3.0 |
Securities Lending Collateral |
0.7 |
Foreign Preferred Stocks |
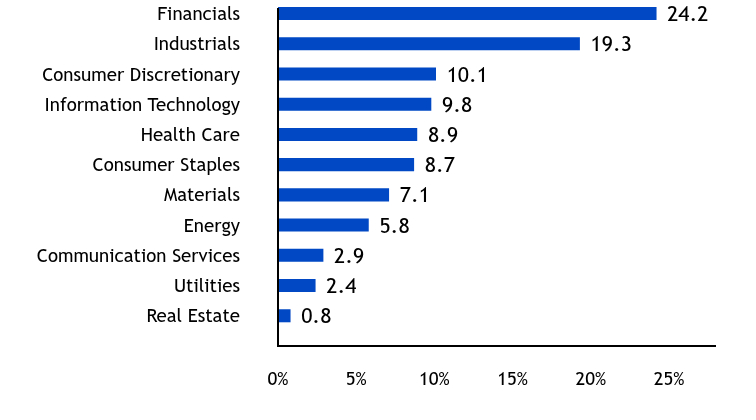
0.2 | The Fund may purchase and sell futures contracts to gain market exposure on cash balances. Sector Allocation - % Equities
Table Summary
Value |
Value |
Real Estate |
0.8 |
Utilities |
2.4 |
Communication Services |
2.9 |
Energy |
5.8 |
Materials |
7.1 |
Consumer Staples |
8.7 |
Health Care |
8.9 |
Information Technology |
9.8 |
Consumer Discretionary |
10.1 |
Industrials |
19.3 |
Financials |
24.2 | |
|
| Largest Holdings [Text Block] |
Top Ten Holdings - % Net Assets
Table Summary
AstraZeneca PLC |
2.5 |
Shell PLC |
2.1 |
Barclays PLC |
2.0 |
Cie de Saint-Gobain SA |
1.9 |
BNP Paribas SA |
1.8 |
Banco Santander SA |
1.8 |
RELX PLC |
1.5 |
Heineken NV |
1.5 |
Renesas Electronics Corp. |
1.5 |
Kering SA |
1.4 | Excludes cash equivalents. |
|
| Material Fund Change [Text Block] |
|
|
| Accountant Change Statement [Text Block] |
|
|
| C000004786 |
|
|
| Shareholder Report [Line Items] |
|
|
| Fund Name |
International Equity Fund
|
|
| Class Name |
Advisor
|
|
| Trading Symbol |
AAISX
|
|
| Annual or Semi-Annual Statement [Text Block] |
This semi-annual shareholder report contains important information about American Beacon International Equity Fund for the period of November 1, 2025 to April 30, 2026.
|
|
| Additional Information [Text Block] |
You can find additional information about the Fund at www.americanbeaconfunds.com/fund-resources/. You can request this information by contacting us at 800-658-5811.
|
|
| Additional Information Phone Number |
800-658-5811
|
|
| Additional Information Website |
www.americanbeaconfunds.com/fund-resources/
|
|
| Expenses [Text Block] |
What were the Fund costs for the last six months?(based on a hypothetical $10,000 investment)
Table Summary
Class Name |
Costs of a $10,000 investment |
Costs paid as a percentage of a $10,000 investment |
Advisor Class |
$64 |
1.24%Footnote Reference* |
| Footnote |
Description |
Footnote* |
Annualized. | |
|
| Expenses Paid, Amount |
$ 64
|
|
| Expense Ratio, Percent |
1.24%
|
[8] |
| AssetsNet |
$ 588,733,814
|
|
| Holdings Count | Holding |
160
|
|
| Advisory Fees Paid, Amount |
$ 1,715,972
|
|
| InvestmentCompanyPortfolioTurnover |
28.00%
|
|
| Additional Fund Statistics [Text Block] |
Table Summary
Total Net Assets |
$588,733,814 |
# of Portfolio Holdings |
160 |
Portfolio Turnover Rate |
28% |
Total Management Fees Paid |
$1,715,972 | |
|
| Holdings [Text Block] |
Asset Allocation - % Investments
Table Summary
Value |
Value |
Foreign Common Stocks |
89.2 |
Common Stocks |
6.9 |
Investment Companies |
3.0 |
Securities Lending Collateral |
0.7 |
Foreign Preferred Stocks |
0.2 | The Fund may purchase and sell futures contracts to gain market exposure on cash balances. Sector Allocation - % Equities
Table Summary
Value |
Value |
Real Estate |
0.8 |
Utilities |
2.4 |
Communication Services |
2.9 |
Energy |
5.8 |
Materials |
7.1 |
Consumer Staples |
8.7 |
Health Care |
8.9 |
Information Technology |
9.8 |
Consumer Discretionary |
10.1 |
Industrials |
19.3 |
Financials |
24.2 | |
|
| Largest Holdings [Text Block] |
Top Ten Holdings - % Net Assets
Table Summary
AstraZeneca PLC |
2.5 |
Shell PLC |
2.1 |
Barclays PLC |
2.0 |
Cie de Saint-Gobain SA |
1.9 |
BNP Paribas SA |
1.8 |
Banco Santander SA |
1.8 |
RELX PLC |
1.5 |
Heineken NV |
1.5 |
Renesas Electronics Corp. |
1.5 |
Kering SA |
1.4 | Excludes cash equivalents. |
|
| Material Fund Change [Text Block] |
|
|
| Accountant Change Statement [Text Block] |
|
|
| C000092345 |
|
|
| Shareholder Report [Line Items] |
|
|
| Fund Name |
International Equity Fund
|
|
| Class Name |
C
|
|
| Trading Symbol |
AILCX
|
|
| Annual or Semi-Annual Statement [Text Block] |
This semi-annual shareholder report contains important information about American Beacon International Equity Fund for the period of November 1, 2025 to April 30, 2026.
|
|
| Additional Information [Text Block] |
You can find additional information about the Fund at www.americanbeaconfunds.com/fund-resources/. You can request this information by contacting us at 800-658-5811.
|
|
| Additional Information Phone Number |
800-658-5811
|
|
| Additional Information Website |
www.americanbeaconfunds.com/fund-resources/
|
|
| Expenses [Text Block] |
What were the Fund costs for the last six months?(based on a hypothetical $10,000 investment)
Table Summary
Class Name |
Costs of a $10,000 investment |
Costs paid as a percentage of a $10,000 investment |
Class C |
$107 |
2.09%Footnote Reference* |
| Footnote |
Description |
Footnote* |
Annualized. | |
|
| Expenses Paid, Amount |
$ 107
|
|
| Expense Ratio, Percent |
2.09%
|
[9] |
| AssetsNet |
$ 588,733,814
|
|
| Holdings Count | Holding |
160
|
|
| Advisory Fees Paid, Amount |
$ 1,715,972
|
|
| InvestmentCompanyPortfolioTurnover |
28.00%
|
|
| Additional Fund Statistics [Text Block] |
Table Summary
Total Net Assets |
$588,733,814 |
# of Portfolio Holdings |
160 |
Portfolio Turnover Rate |
28% |
Total Management Fees Paid |
$1,715,972 | |
|
| Holdings [Text Block] |
Asset Allocation - % Investments
Table Summary
Value |
Value |
Foreign Common Stocks |
89.2 |
Common Stocks |
6.9 |
Investment Companies |
3.0 |
Securities Lending Collateral |
0.7 |
Foreign Preferred Stocks |
0.2 | The Fund may purchase and sell futures contracts to gain market exposure on cash balances. Sector Allocation - % Equities
Table Summary
Value |
Value |
Real Estate |
0.8 |
Utilities |
2.4 |
Communication Services |
2.9 |
Energy |
5.8 |
Materials |
7.1 |
Consumer Staples |
8.7 |
Health Care |
8.9 |
Information Technology |
9.8 |
Consumer Discretionary |
10.1 |
Industrials |
19.3 |
Financials |
24.2 | |
|
| Largest Holdings [Text Block] |
Top Ten Holdings - % Net Assets
Table Summary
AstraZeneca PLC |
2.5 |
Shell PLC |
2.1 |
Barclays PLC |
2.0 |
Cie de Saint-Gobain SA |
1.9 |
BNP Paribas SA |
1.8 |
Banco Santander SA |
1.8 |
RELX PLC |
1.5 |
Heineken NV |
1.5 |
Renesas Electronics Corp. |
1.5 |
Kering SA |
1.4 | Excludes cash equivalents. |
|
| Material Fund Change [Text Block] |
|
|
| Accountant Change Statement [Text Block] |
|
|
| C000004785 |
|
|
| Shareholder Report [Line Items] |
|
|
| Fund Name |
International Equity Fund
|
|
| Class Name |
Investor
|
|
| Trading Symbol |
AAIPX
|
|
| Annual or Semi-Annual Statement [Text Block] |
This semi-annual shareholder report contains important information about American Beacon International Equity Fund for the period of November 1, 2025 to April 30, 2026.
|
|
| Additional Information [Text Block] |
You can find additional information about the Fund at www.americanbeaconfunds.com/fund-resources/. You can request this information by contacting us at 800-658-5811.
|
|
| Additional Information Phone Number |
800-658-5811
|
|
| Additional Information Website |
www.americanbeaconfunds.com/fund-resources/
|
|
| Expenses [Text Block] |
What were the Fund costs for the last six months?(based on a hypothetical $10,000 investment)
Table Summary
Class Name |
Costs of a $10,000 investment |
Costs paid as a percentage of a $10,000 investment |
Investor |
$55 |
1.07%Footnote Reference* |
| Footnote |
Description |
Footnote* |
Annualized. | |
|
| Expenses Paid, Amount |
$ 55
|
|
| Expense Ratio, Percent |
1.07%
|
[10] |
| AssetsNet |
$ 588,733,814
|
|
| Holdings Count | Holding |
160
|
|
| Advisory Fees Paid, Amount |
$ 1,715,972
|
|
| InvestmentCompanyPortfolioTurnover |
28.00%
|
|
| Additional Fund Statistics [Text Block] |
Table Summary
Total Net Assets |
$588,733,814 |
# of Portfolio Holdings |
160 |
Portfolio Turnover Rate |
28% |
Total Management Fees Paid |
$1,715,972 | |
|
| Holdings [Text Block] |
Asset Allocation - % Investments
Table Summary
Value |
Value |
Foreign Common Stocks |
89.2 |
Common Stocks |
6.9 |
Investment Companies |
3.0 |
Securities Lending Collateral |
0.7 |
Foreign Preferred Stocks |
0.2 | The Fund may purchase and sell futures contracts to gain market exposure on cash balances. Sector Allocation - % Equities
Table Summary
Value |
Value |
Real Estate |
0.8 |
Utilities |
2.4 |
Communication Services |
2.9 |
Energy |
5.8 |
Materials |
7.1 |
Consumer Staples |
8.7 |
Health Care |
8.9 |
Information Technology |
9.8 |
Consumer Discretionary |
10.1 |
Industrials |
19.3 |
Financials |
24.2 | |
|
| Largest Holdings [Text Block] |
Top Ten Holdings - % Net Assets
Table Summary
AstraZeneca PLC |
2.5 |
Shell PLC |
2.1 |
Barclays PLC |
2.0 |
Cie de Saint-Gobain SA |
1.9 |
BNP Paribas SA |
1.8 |
Banco Santander SA |
1.8 |
RELX PLC |
1.5 |
Heineken NV |
1.5 |
Renesas Electronics Corp. |
1.5 |
Kering SA |
1.4 | Excludes cash equivalents. |
|
| Material Fund Change [Text Block] |
|
|
| Accountant Change Statement [Text Block] |
|
|
| C000004784 |
|
|
| Shareholder Report [Line Items] |
|
|
| Fund Name |
International Equity Fund
|
|
| Class Name |
R5
|
|
| Trading Symbol |
AAIEX
|
|
| Annual or Semi-Annual Statement [Text Block] |
This semi-annual shareholder report contains important information about American Beacon International Equity Fund for the period of November 1, 2025 to April 30, 2026.
|
|
| Additional Information [Text Block] |
You can find additional information about the Fund at www.americanbeaconfunds.com/fund-resources/. You can request this information by contacting us at 800-658-5811.
|
|
| Additional Information Phone Number |
800-658-5811
|
|
| Additional Information Website |
www.americanbeaconfunds.com/fund-resources/
|
|
| Expenses [Text Block] |
What were the Fund costs for the last six months?(based on a hypothetical $10,000 investment)
Table Summary
Class Name |
Costs of a $10,000 investment |
Costs paid as a percentage of a $10,000 investment |
R5 |
$39 |
0.76%Footnote Reference* |
| Footnote |
Description |
Footnote* |
Annualized. | |
|
| Expenses Paid, Amount |
$ 39
|
|
| Expense Ratio, Percent |
0.76%
|
[11] |
| AssetsNet |
$ 588,733,814
|
|
| Holdings Count | Holding |
160
|
|
| Advisory Fees Paid, Amount |
$ 1,715,972
|
|
| InvestmentCompanyPortfolioTurnover |
28.00%
|
|
| Additional Fund Statistics [Text Block] |
Table Summary
Total Net Assets |
$588,733,814 |
# of Portfolio Holdings |
160 |
Portfolio Turnover Rate |
28% |
Total Management Fees Paid |
$1,715,972 | |
|
| Holdings [Text Block] |
Asset Allocation - % Investments
Table Summary
Value |
Value |
Foreign Common Stocks |
89.2 |
Common Stocks |
6.9 |
Investment Companies |
3.0 |
Securities Lending Collateral |
0.7 |
Foreign Preferred Stocks |
0.2 | The Fund may purchase and sell futures contracts to gain market exposure on cash balances. Sector Allocation - % Equities
Table Summary
Value |
Value |
Real Estate |
0.8 |
Utilities |
2.4 |
Communication Services |
2.9 |
Energy |
5.8 |
Materials |
7.1 |
Consumer Staples |
8.7 |
Health Care |
8.9 |
Information Technology |
9.8 |
Consumer Discretionary |
10.1 |
Industrials |
19.3 |
Financials |
24.2 | |
|
| Largest Holdings [Text Block] |
Top Ten Holdings - % Net Assets
Table Summary
AstraZeneca PLC |
2.5 |
Shell PLC |
2.1 |
Barclays PLC |
2.0 |
Cie de Saint-Gobain SA |
1.9 |
BNP Paribas SA |
1.8 |
Banco Santander SA |
1.8 |
RELX PLC |
1.5 |
Heineken NV |
1.5 |
Renesas Electronics Corp. |
1.5 |
Kering SA |
1.4 | Excludes cash equivalents. |
|
| Material Fund Change [Text Block] |
|
|
| Accountant Change Statement [Text Block] |
|
|
| C000185593 |
|
|
| Shareholder Report [Line Items] |
|
|
| Fund Name |
International Equity Fund
|
|
| Class Name |
R6
|
|
| Trading Symbol |
AAERX
|
|
| Annual or Semi-Annual Statement [Text Block] |
This semi-annual shareholder report contains important information about American Beacon International Equity Fund for the period of November 1, 2025 to April 30, 2026.
|
|
| Additional Information [Text Block] |
You can find additional information about the Fund at www.americanbeaconfunds.com/fund-resources/. You can request this information by contacting us at 800-658-5811.
|
|
| Additional Information Phone Number |
800-658-5811
|
|
| Additional Information Website |
www.americanbeaconfunds.com/fund-resources/
|
|
| Expenses [Text Block] |
What were the Fund costs for the last six months?(based on a hypothetical $10,000 investment)
Table Summary
Class Name |
Costs of a $10,000 investment |
Costs paid as a percentage of a $10,000 investment |
R6 |
$35 |
0.69%Footnote Reference* |
| Footnote |
Description |
Footnote* |
Annualized. | |
|
| Expenses Paid, Amount |
$ 35
|
|
| Expense Ratio, Percent |
0.69%
|
[12] |
| AssetsNet |
$ 588,733,814
|
|
| Holdings Count | Holding |
160
|
|
| Advisory Fees Paid, Amount |
$ 1,715,972
|
|
| InvestmentCompanyPortfolioTurnover |
28.00%
|
|
| Additional Fund Statistics [Text Block] |
Table Summary
Total Net Assets |
$588,733,814 |
# of Portfolio Holdings |
160 |
Portfolio Turnover Rate |
28% |
Total Management Fees Paid |
$1,715,972 | |
|
| Holdings [Text Block] |
Asset Allocation - % Investments
Table Summary
Value |
Value |
Foreign Common Stocks |
89.2 |
Common Stocks |
6.9 |
Investment Companies |
3.0 |
Securities Lending Collateral |
0.7 |
Foreign Preferred Stocks |
0.2 | The Fund may purchase and sell futures contracts to gain market exposure on cash balances. Sector Allocation - % Equities
Table Summary
Value |
Value |
Real Estate |
0.8 |
Utilities |
2.4 |
Communication Services |
2.9 |
Energy |
5.8 |
Materials |
7.1 |
Consumer Staples |
8.7 |
Health Care |
8.9 |
Information Technology |
9.8 |
Consumer Discretionary |
10.1 |
Industrials |
19.3 |
Financials |
24.2 | |
|
| Largest Holdings [Text Block] |
Top Ten Holdings - % Net Assets
Table Summary
AstraZeneca PLC |
2.5 |
Shell PLC |
2.1 |
Barclays PLC |
2.0 |
Cie de Saint-Gobain SA |
1.9 |
BNP Paribas SA |
1.8 |
Banco Santander SA |
1.8 |
RELX PLC |
1.5 |
Heineken NV |
1.5 |
Renesas Electronics Corp. |
1.5 |
Kering SA |
1.4 | Excludes cash equivalents. |
|
| Material Fund Change [Text Block] |
|
|
| Accountant Change Statement [Text Block] |
|
|
| C000079124 |
|
|
| Shareholder Report [Line Items] |
|
|
| Fund Name |
International Equity Fund
|
|
| Class Name |
Y
|
|
| Trading Symbol |
ABEYX
|
|
| Annual or Semi-Annual Statement [Text Block] |
This semi-annual shareholder report contains important information about American Beacon International Equity Fund for the period of November 1, 2025 to April 30, 2026.
|
|
| Additional Information [Text Block] |
You can find additional information about the Fund at www.americanbeaconfunds.com/fund-resources/. You can request this information by contacting us at 800-658-5811.
|
|
| Additional Information Phone Number |
800-658-5811
|
|
| Additional Information Website |
www.americanbeaconfunds.com/fund-resources/
|
|
| Expenses [Text Block] |
What were the Fund costs for the last six months?(based on a hypothetical $10,000 investment)
Table Summary
Class Name |
Costs of a $10,000 investment |
Costs paid as a percentage of a $10,000 investment |
Y |
$43 |
0.83%Footnote Reference* |
| Footnote |
Description |
Footnote* |
Annualized. | |
|
| Expenses Paid, Amount |
$ 43
|
|
| Expense Ratio, Percent |
0.83%
|
[13] |
| AssetsNet |
$ 588,733,814
|
|
| Holdings Count | Holding |
160
|
|
| Advisory Fees Paid, Amount |
$ 1,715,972
|
|
| InvestmentCompanyPortfolioTurnover |
28.00%
|
|
| Additional Fund Statistics [Text Block] |
Table Summary
Total Net Assets |
$588,733,814 |
# of Portfolio Holdings |
160 |
Portfolio Turnover Rate |
28% |
Total Management Fees Paid |
$1,715,972 | |
|
| Holdings [Text Block] |
Asset Allocation - % Investments
Table Summary
Value |
Value |
Foreign Common Stocks |
89.2 |
Common Stocks |
6.9 |
Investment Companies |
3.0 |
Securities Lending Collateral |
0.7 |
Foreign Preferred Stocks |
0.2 | The Fund may purchase and sell futures contracts to gain market exposure on cash balances. Sector Allocation - % Equities
Table Summary
Value |
Value |
Real Estate |
0.8 |
Utilities |
2.4 |
Communication Services |
2.9 |
Energy |
5.8 |
Materials |
7.1 |
Consumer Staples |
8.7 |
Health Care |
8.9 |
Information Technology |
9.8 |
Consumer Discretionary |
10.1 |
Industrials |
19.3 |
Financials |
24.2 | |
|
| Largest Holdings [Text Block] |
Top Ten Holdings - % Net Assets
Table Summary
AstraZeneca PLC |
2.5 |
Shell PLC |
2.1 |
Barclays PLC |
2.0 |
Cie de Saint-Gobain SA |
1.9 |
BNP Paribas SA |
1.8 |
Banco Santander SA |
1.8 |
RELX PLC |
1.5 |
Heineken NV |
1.5 |
Renesas Electronics Corp. |
1.5 |
Kering SA |
1.4 | Excludes cash equivalents. |
|
| Material Fund Change [Text Block] |
|
|
| Accountant Change Statement [Text Block] |
|
|
| C000167880 |
|
|
| Shareholder Report [Line Items] |
|
|
| Fund Name |
Garcia Hamilton Quality Bond Fund
|
|
| Class Name |
Investor
|
|
| Trading Symbol |
GHQPX
|
|
| Annual or Semi-Annual Statement [Text Block] |
This semi-annual shareholder report contains important information about American Beacon Garcia Hamilton Quality Bond Fund for the period of November 1, 2025 to April 30, 2026.
|
|
| Additional Information [Text Block] |
You can find additional information about the Fund at www.americanbeaconfunds.com/fund-resources/. You can request this information by contacting us at 800-658-5811.
|
|
| Additional Information Phone Number |
800-658-5811
|
|
| Additional Information Website |
www.americanbeaconfunds.com/fund-resources/
|
|
| Expenses [Text Block] |
What were the Fund costs for the last six months?(based on a hypothetical $10,000 investment)
Table Summary
Class Name |
Costs of a $10,000 investment |
Costs paid as a percentage of a $10,000 investment |
Investor |
$41 |
0.83%Footnote Reference* |
| Footnote |
Description |
Footnote* |
Annualized. | |
|
| Expenses Paid, Amount |
$ 41
|
|
| Expense Ratio, Percent |
0.83%
|
[14] |
| AssetsNet |
$ 354,916,793
|
|
| Holdings Count | Holding |
27
|
|
| Advisory Fees Paid, Amount |
$ 535,836
|
|
| InvestmentCompanyPortfolioTurnover |
24.00%
|
|
| Additional Fund Statistics [Text Block] |
Table Summary
Total Net Assets |
$354,916,793 |
# of Portfolio Holdings |
27 |
Portfolio Turnover Rate |
24% |
Total Management Fees Paid |
$535,836 | |
|
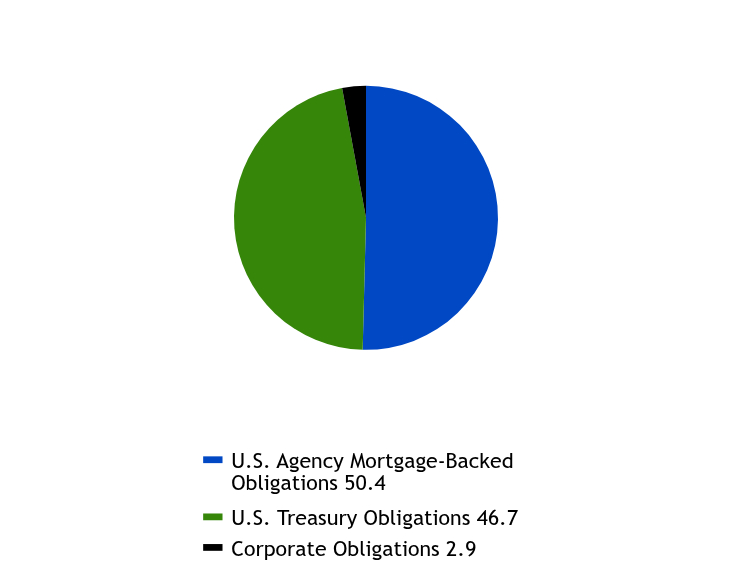
| Holdings [Text Block] |
Asset Allocation - % Investments
Table Summary
Value |
Value |
U.S. Agency Mortgage-Backed Obligations |
50.4 |
U.S. Treasury Obligations |
46.7 |
Corporate Obligations |
2.9 | |
|
| Largest Holdings [Text Block] |
Top Ten Holdings - % Net Assets
Table Summary
U.S. Treasury Notes, 4.000%, Due 2/15/2034 |
11.4 |
U.S. Treasury Bonds, 3.750%, Due 8/15/2041 |
9.9 |
U.S. Treasury Notes, 3.875%, Due 8/15/2034 |
7.8 |
U.S. Treasury Notes, 3.500%, Due 2/15/2033 |
6.9 |
U.S. Treasury Bonds, 2.500%, Due 2/15/2045 |
5.0 |
Federal Home Loan Mortgage Corp., 2.000%, Due 10/1/2052 |
4.9 |
Federal Home Loan Mortgage Corp., 2.500%, Due 4/1/2052 |
4.8 |
Federal Home Loan Mortgage Corp., 3.000%, Due 6/1/2052 |
3.6 |
Federal National Mortgage Association, 3.000%, Due 5/1/2052 |
3.4 |
Federal Home Loan Mortgage Corp., 4.000%, Due 11/1/2052 |
3.3 | Excludes cash equivalents. |
|
| Material Fund Change [Text Block] |
|
|
| Accountant Change Statement [Text Block] |
|
|
| C000167879 |
|
|
| Shareholder Report [Line Items] |
|
|
| Fund Name |
Garcia Hamilton Quality Bond Fund
|
|
| Class Name |
R5
|
|
| Trading Symbol |
GHQIX
|
|
| Annual or Semi-Annual Statement [Text Block] |
This semi-annual shareholder report contains important information about American Beacon Garcia Hamilton Quality Bond Fund for the period of November 1, 2025 to April 30, 2026.
|
|
| Additional Information [Text Block] |
You can find additional information about the Fund at www.americanbeaconfunds.com/fund-resources/. You can request this information by contacting us at 800-658-5811.
|
|
| Additional Information Phone Number |
800-658-5811
|
|
| Additional Information Website |
www.americanbeaconfunds.com/fund-resources/
|
|
| Expenses [Text Block] |
What were the Fund costs for the last six months?(based on a hypothetical $10,000 investment)
Table Summary
Class Name |
Costs of a $10,000 investment |
Costs paid as a percentage of a $10,000 investment |
R5 |
$22 |
0.45%Footnote Reference* |
| Footnote |
Description |
Footnote* |
Annualized. | |
|
| Expenses Paid, Amount |
$ 22
|
|
| Expense Ratio, Percent |
0.45%
|
[15] |
| AssetsNet |
$ 354,916,793
|
|
| Holdings Count | Holding |
27
|
|
| Advisory Fees Paid, Amount |
$ 535,836
|
|
| InvestmentCompanyPortfolioTurnover |
24.00%
|
|
| Additional Fund Statistics [Text Block] |
Table Summary
Total Net Assets |
$354,916,793 |
# of Portfolio Holdings |
27 |
Portfolio Turnover Rate |
24% |
Total Management Fees Paid |
$535,836 | |
|
| Holdings [Text Block] |
Asset Allocation - % Investments
Table Summary
Value |
Value |
U.S. Agency Mortgage-Backed Obligations |
50.4 |
U.S. Treasury Obligations |
46.7 |
Corporate Obligations |
2.9 | |
|
| Largest Holdings [Text Block] |
Top Ten Holdings - % Net Assets
Table Summary
U.S. Treasury Notes, 4.000%, Due 2/15/2034 |
11.4 |
U.S. Treasury Bonds, 3.750%, Due 8/15/2041 |
9.9 |
U.S. Treasury Notes, 3.875%, Due 8/15/2034 |
7.8 |
U.S. Treasury Notes, 3.500%, Due 2/15/2033 |
6.9 |
U.S. Treasury Bonds, 2.500%, Due 2/15/2045 |
5.0 |
Federal Home Loan Mortgage Corp., 2.000%, Due 10/1/2052 |
4.9 |
Federal Home Loan Mortgage Corp., 2.500%, Due 4/1/2052 |
4.8 |
Federal Home Loan Mortgage Corp., 3.000%, Due 6/1/2052 |
3.6 |
Federal National Mortgage Association, 3.000%, Due 5/1/2052 |
3.4 |
Federal Home Loan Mortgage Corp., 4.000%, Due 11/1/2052 |
3.3 | Excludes cash equivalents. |
|
| Material Fund Change [Text Block] |
|
|
| Accountant Change Statement [Text Block] |
|
|
| C000211731 |
|
|
| Shareholder Report [Line Items] |
|
|
| Fund Name |
Garcia Hamilton Quality Bond Fund
|
|
| Class Name |
R6
|
|
| Trading Symbol |
GHQRX
|
|
| Annual or Semi-Annual Statement [Text Block] |
This semi-annual shareholder report contains important information about American Beacon Garcia Hamilton Quality Bond Fund for the period of November 1, 2025 to April 30, 2026.
|
|
| Additional Information [Text Block] |
You can find additional information about the Fund at www.americanbeaconfunds.com/fund-resources/. You can request this information by contacting us at 800-658-5811.
|
|
| Additional Information Phone Number |
800-658-5811
|
|
| Additional Information Website |
www.americanbeaconfunds.com/fund-resources/
|
|
| Expenses [Text Block] |
What were the Fund costs for the last six months?(based on a hypothetical $10,000 investment)
Table Summary
Class Name |
Costs of a $10,000 investment |
Costs paid as a percentage of a $10,000 investment |
R6 |
$20 |
0.41%Footnote Reference* |
| Footnote |
Description |
Footnote* |
Annualized. | |
|
| Expenses Paid, Amount |
$ 20
|
|
| Expense Ratio, Percent |
0.41%
|
[16] |
| AssetsNet |
$ 354,916,793
|
|
| Holdings Count | Holding |
27
|
|
| Advisory Fees Paid, Amount |
$ 535,836
|
|
| InvestmentCompanyPortfolioTurnover |
24.00%
|
|
| Additional Fund Statistics [Text Block] |
Table Summary
Total Net Assets |
$354,916,793 |
# of Portfolio Holdings |
27 |
Portfolio Turnover Rate |
24% |
Total Management Fees Paid |
$535,836 | |
|
| Holdings [Text Block] |
Asset Allocation - % Investments
Table Summary
Value |
Value |
U.S. Agency Mortgage-Backed Obligations |
50.4 |
U.S. Treasury Obligations |
46.7 |
Corporate Obligations |
2.9 | |
|
| Largest Holdings [Text Block] |
Top Ten Holdings - % Net Assets
Table Summary
U.S. Treasury Notes, 4.000%, Due 2/15/2034 |
11.4 |
U.S. Treasury Bonds, 3.750%, Due 8/15/2041 |
9.9 |
U.S. Treasury Notes, 3.875%, Due 8/15/2034 |
7.8 |
U.S. Treasury Notes, 3.500%, Due 2/15/2033 |
6.9 |
U.S. Treasury Bonds, 2.500%, Due 2/15/2045 |
5.0 |
Federal Home Loan Mortgage Corp., 2.000%, Due 10/1/2052 |
4.9 |
Federal Home Loan Mortgage Corp., 2.500%, Due 4/1/2052 |
4.8 |
Federal Home Loan Mortgage Corp., 3.000%, Due 6/1/2052 |
3.6 |
Federal National Mortgage Association, 3.000%, Due 5/1/2052 |
3.4 |
Federal Home Loan Mortgage Corp., 4.000%, Due 11/1/2052 |
3.3 | Excludes cash equivalents. |
|
| Material Fund Change [Text Block] |
|
|
| Accountant Change Statement [Text Block] |
|
|
| C000167881 |
|
|
| Shareholder Report [Line Items] |
|
|
| Fund Name |
Garcia Hamilton Quality Bond Fund
|
|
| Class Name |
Y
|
|
| Trading Symbol |
GHQYX
|
|
| Annual or Semi-Annual Statement [Text Block] |
This semi-annual shareholder report contains important information about American Beacon Garcia Hamilton Quality Bond Fund for the period of November 1, 2025 to April 30, 2026.
|
|
| Additional Information [Text Block] |
You can find additional information about the Fund at www.americanbeaconfunds.com/fund-resources/. You can request this information by contacting us at 800-658-5811.
|
|
| Additional Information Phone Number |
800-658-5811
|
|
| Additional Information Website |
www.americanbeaconfunds.com/fund-resources/
|
|
| Expenses [Text Block] |
What were the Fund costs for the last six months?(based on a hypothetical $10,000 investment)
Table Summary
Class Name |
Costs of a $10,000 investment |
Costs paid as a percentage of a $10,000 investment |
Y |
$25 |
0.51%Footnote Reference* |
| Footnote |
Description |
Footnote* |
Annualized. | |
|
| Expenses Paid, Amount |
$ 25
|
|
| Expense Ratio, Percent |
0.51%
|
[17] |
| AssetsNet |
$ 354,916,793
|
|
| Holdings Count | Holding |
27
|
|
| Advisory Fees Paid, Amount |
$ 535,836
|
|
| InvestmentCompanyPortfolioTurnover |
24.00%
|
|
| Additional Fund Statistics [Text Block] |
Table Summary
Total Net Assets |
$354,916,793 |
# of Portfolio Holdings |
27 |
Portfolio Turnover Rate |
24% |
Total Management Fees Paid |
$535,836 | |
|
| Holdings [Text Block] |
Asset Allocation - % Investments
Table Summary
Value |
Value |
U.S. Agency Mortgage-Backed Obligations |
50.4 |
U.S. Treasury Obligations |
46.7 |
Corporate Obligations |
2.9 | |
|
| Largest Holdings [Text Block] |
Top Ten Holdings - % Net Assets
Table Summary
U.S. Treasury Notes, 4.000%, Due 2/15/2034 |
11.4 |
U.S. Treasury Bonds, 3.750%, Due 8/15/2041 |
9.9 |
U.S. Treasury Notes, 3.875%, Due 8/15/2034 |
7.8 |
U.S. Treasury Notes, 3.500%, Due 2/15/2033 |
6.9 |
U.S. Treasury Bonds, 2.500%, Due 2/15/2045 |
5.0 |
Federal Home Loan Mortgage Corp., 2.000%, Due 10/1/2052 |
4.9 |
Federal Home Loan Mortgage Corp., 2.500%, Due 4/1/2052 |
4.8 |
Federal Home Loan Mortgage Corp., 3.000%, Due 6/1/2052 |
3.6 |
Federal National Mortgage Association, 3.000%, Due 5/1/2052 |
3.4 |
Federal Home Loan Mortgage Corp., 4.000%, Due 11/1/2052 |
3.3 | Excludes cash equivalents. |
|
| Material Fund Change [Text Block] |
|
|
| Accountant Change Statement [Text Block] |
|
|
| C000206040 |
|
|
| Shareholder Report [Line Items] |
|
|
| Fund Name |
IMC International Small Cap Fund
|
|
| Class Name |
Investor
|
|
| Trading Symbol |
TIVFX
|
|
| Annual or Semi-Annual Statement [Text Block] |
This semi-annual shareholder report contains important information about American Beacon IMC International Small Cap Fund for the period of November 1, 2025 to April 30, 2026.
|
|
| Additional Information [Text Block] |
You can find additional information about the Fund at www.americanbeaconfunds.com/fund-resources/. You can request this information by contacting us at 800-658-5811.
|
|
| Additional Information Phone Number |
800-658-5811
|
|
| Additional Information Website |
www.americanbeaconfunds.com/fund-resources/
|
|
| Expenses [Text Block] |
What were the Fund costs for the last six months?(based on a hypothetical $10,000 investment)
Table Summary
Class Name |
Costs of a $10,000 investment |
Costs paid as a percentage of a $10,000 investment |
Investor |
$74 |
1.30%Footnote Reference* |
| Footnote |
Description |
Footnote* |
Annualized. | |
|
| Expenses Paid, Amount |
$ 74
|
|
| Expense Ratio, Percent |
1.30%
|
[18] |
| AssetsNet |
$ 217,562,174
|
|
| Holdings Count | Holding |
164
|
|
| Advisory Fees Paid, Amount |
$ 590,781
|
|
| InvestmentCompanyPortfolioTurnover |
89.00%
|
|
| Additional Fund Statistics [Text Block] |
Table Summary
Total Net Assets |
$217,562,174 |
# of Portfolio Holdings |
164 |
Portfolio Turnover Rate |
89% |
Total Management Fees Paid |
$590,781 | |
|
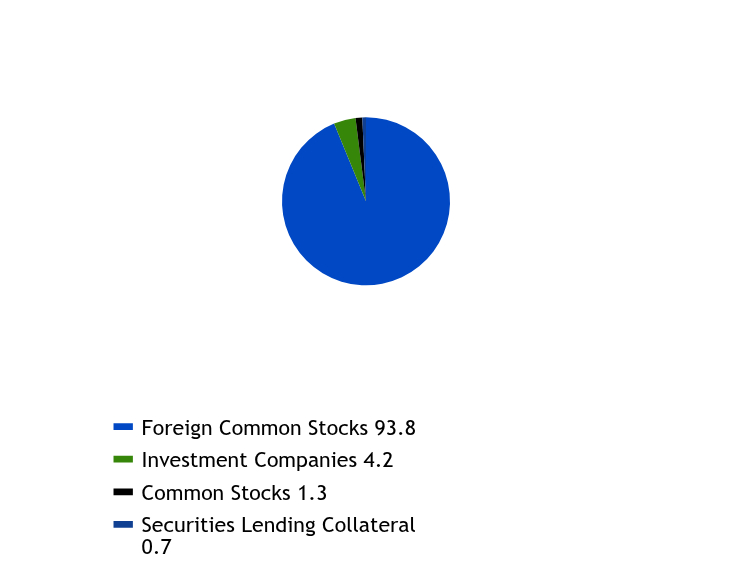
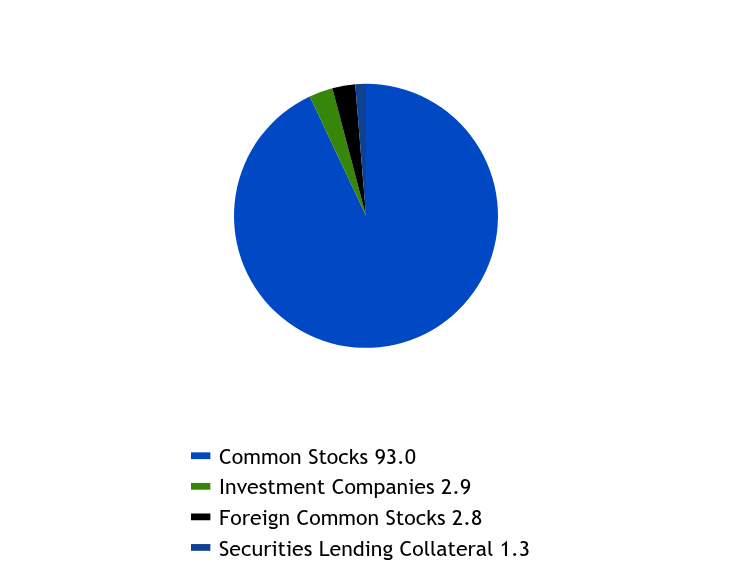
| Holdings [Text Block] |
Asset Allocation - % Investments
Table Summary
Value |
Value |
Foreign Common Stocks |
93.8 |
Investment Companies |
4.2 |
Common Stocks |
1.3 |
Securities Lending Collateral |
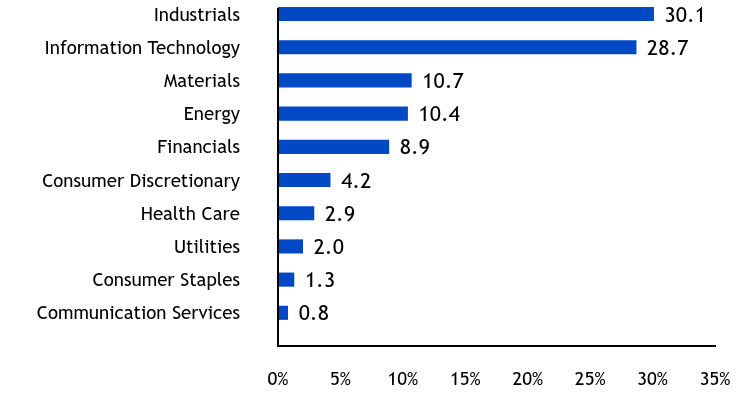
0.7 | The Fund may purchase and sell futures contracts to gain market exposure on cash balances. Sector Allocation - % Equities
Table Summary
Value |
Value |
Communication Services |
0.8 |
Consumer Staples |
1.3 |
Utilities |
2.0 |
Health Care |
2.9 |
Consumer Discretionary |
4.2 |
Financials |
8.9 |
Energy |
10.4 |
Materials |
10.7 |
Information Technology |
28.7 |
Industrials |
30.1 | |
|
| Largest Holdings [Text Block] |
Top Ten Holdings - % Net Assets
Table Summary
Ibiden Co. Ltd. |
1.1 |
Enerflex Ltd. |
1.1 |
Samsung Electro-Mechanics Co. Ltd. |
1.0 |
MTAR Technologies Ltd. |
1.0 |
Kioxia Holdings Corp. |
1.0 |
Tamarack Valley Energy Ltd. |
1.0 |
5N Plus, Inc. |
0.9 |
ASPEED Technology, Inc. |
0.9 |
Asia Vital Components Co. Ltd. |
0.9 |
Browave Corp. |
0.9 | Excludes cash equivalents. |
|
| Material Fund Change [Text Block] |
|
|
| Accountant Change Statement [Text Block] |
|
|
| C000206039 |
|
|
| Shareholder Report [Line Items] |
|
|
| Fund Name |
IMC International Small Cap Fund
|
|
| Class Name |
R5
|
|
| Trading Symbol |
TOVIX
|
|
| Annual or Semi-Annual Statement [Text Block] |
This semi-annual shareholder report contains important information about American Beacon IMC International Small Cap Fund for the period of November 1, 2025 to April 30, 2026.
|
|
| Additional Information [Text Block] |
You can find additional information about the Fund at www.americanbeaconfunds.com/fund-resources/. You can request this information by contacting us at 800-658-5811.
|
|
| Additional Information Phone Number |
800-658-5811
|
|
| Additional Information Website |
www.americanbeaconfunds.com/fund-resources/
|
|
| Expenses [Text Block] |
What were the Fund costs for the last six months?(based on a hypothetical $10,000 investment)
Table Summary
Class Name |
Costs of a $10,000 investment |
Costs paid as a percentage of a $10,000 investment |
R5 |
$51 |
0.89%Footnote Reference* |
| Footnote |
Description |
Footnote* |
Annualized. | |
|
| Expenses Paid, Amount |
$ 51
|
|
| Expense Ratio, Percent |
0.89%
|
[19] |
| AssetsNet |
$ 217,562,174
|
|
| Holdings Count | Holding |
164
|
|
| Advisory Fees Paid, Amount |
$ 590,781
|
|
| InvestmentCompanyPortfolioTurnover |
89.00%
|
|
| Additional Fund Statistics [Text Block] |
Table Summary
Total Net Assets |
$217,562,174 |
# of Portfolio Holdings |
164 |
Portfolio Turnover Rate |
89% |
Total Management Fees Paid |
$590,781 | |
|
| Holdings [Text Block] |
Asset Allocation - % Investments
Table Summary
Value |
Value |
Foreign Common Stocks |
93.8 |
Investment Companies |
4.2 |
Common Stocks |
1.3 |
Securities Lending Collateral |
0.7 | The Fund may purchase and sell futures contracts to gain market exposure on cash balances. Sector Allocation - % Equities
Table Summary
Value |
Value |
Communication Services |
0.8 |
Consumer Staples |
1.3 |
Utilities |
2.0 |
Health Care |
2.9 |
Consumer Discretionary |
4.2 |
Financials |
8.9 |
Energy |
10.4 |
Materials |
10.7 |
Information Technology |
28.7 |
Industrials |
30.1 | |
|
| Largest Holdings [Text Block] |
Top Ten Holdings - % Net Assets
Table Summary
Ibiden Co. Ltd. |
1.1 |
Enerflex Ltd. |
1.1 |
Samsung Electro-Mechanics Co. Ltd. |
1.0 |
MTAR Technologies Ltd. |
1.0 |
Kioxia Holdings Corp. |
1.0 |
Tamarack Valley Energy Ltd. |
1.0 |
5N Plus, Inc. |
0.9 |
ASPEED Technology, Inc. |
0.9 |
Asia Vital Components Co. Ltd. |
0.9 |
Browave Corp. |
0.9 | Excludes cash equivalents. |
|
| Material Fund Change [Text Block] |
|
|
| Accountant Change Statement [Text Block] |
|
|
| C000206041 |
|
|
| Shareholder Report [Line Items] |
|
|
| Fund Name |
IMC International Small Cap Fund
|
|
| Class Name |
Y
|
|
| Trading Symbol |
TOVYX
|
|
| Annual or Semi-Annual Statement [Text Block] |
This semi-annual shareholder report contains important information about American Beacon IMC International Small Cap Fund for the period of November 1, 2025 to April 30, 2026.
|
|
| Additional Information [Text Block] |
You can find additional information about the Fund at www.americanbeaconfunds.com/fund-resources/. You can request this information by contacting us at 800-658-5811.
|
|
| Additional Information Phone Number |
800-658-5811
|
|
| Additional Information Website |
www.americanbeaconfunds.com/fund-resources/
|
|
| Expenses [Text Block] |
What were the Fund costs for the last six months?(based on a hypothetical $10,000 investment)
Table Summary
Class Name |
Costs of a $10,000 investment |
Costs paid as a percentage of a $10,000 investment |
Y |
$62 |
1.10%Footnote Reference* |
| Footnote |
Description |
Footnote* |
Annualized. | |
|
| Expenses Paid, Amount |
$ 62
|
|
| Expense Ratio, Percent |
1.10%
|
[20] |
| AssetsNet |
$ 217,562,174
|
|
| Holdings Count | Holding |
164
|
|
| Advisory Fees Paid, Amount |
$ 590,781
|
|
| InvestmentCompanyPortfolioTurnover |
89.00%
|
|
| Additional Fund Statistics [Text Block] |
Table Summary
Total Net Assets |
$217,562,174 |
# of Portfolio Holdings |
164 |
Portfolio Turnover Rate |
89% |
Total Management Fees Paid |
$590,781 | |
|
| Holdings [Text Block] |
Asset Allocation - % Investments
Table Summary
Value |
Value |
Foreign Common Stocks |
93.8 |
Investment Companies |
4.2 |
Common Stocks |
1.3 |
Securities Lending Collateral |
0.7 | The Fund may purchase and sell futures contracts to gain market exposure on cash balances. Sector Allocation - % Equities
Table Summary
Value |
Value |
Communication Services |
0.8 |
Consumer Staples |
1.3 |
Utilities |
2.0 |
Health Care |
2.9 |
Consumer Discretionary |
4.2 |
Financials |
8.9 |
Energy |
10.4 |
Materials |
10.7 |
Information Technology |
28.7 |
Industrials |
30.1 | |
|
| Largest Holdings [Text Block] |
Top Ten Holdings - % Net Assets
Table Summary
Ibiden Co. Ltd. |
1.1 |
Enerflex Ltd. |
1.1 |
Samsung Electro-Mechanics Co. Ltd. |
1.0 |
MTAR Technologies Ltd. |
1.0 |
Kioxia Holdings Corp. |
1.0 |
Tamarack Valley Energy Ltd. |
1.0 |
5N Plus, Inc. |
0.9 |
ASPEED Technology, Inc. |
0.9 |
Asia Vital Components Co. Ltd. |
0.9 |
Browave Corp. |
0.9 | Excludes cash equivalents. |
|
| Material Fund Change [Text Block] |
|
|
| Accountant Change Statement [Text Block] |
|
|
| C000089422 |
|
|
| Shareholder Report [Line Items] |
|
|
| Fund Name |
Large Cap Value Fund
|
|
| Class Name |
A
|
|
| Trading Symbol |
ALVAX
|
|
| Annual or Semi-Annual Statement [Text Block] |
This semi-annual shareholder report contains important information about American Beacon Large Cap Value Fund for the period of November 1, 2025 to April 30, 2026.
|
|
| Additional Information [Text Block] |
You can find additional information about the Fund at www.americanbeaconfunds.com/fund-resources/. You can request this information by contacting us at 800-658-5811.
|
|
| Additional Information Phone Number |
800-658-5811
|
|
| Additional Information Website |
www.americanbeaconfunds.com/fund-resources/
|
|
| Expenses [Text Block] |
What were the Fund costs for the last six months?(based on a hypothetical $10,000 investment)
Table Summary
Class Name |
Costs of a $10,000 investment |
Costs paid as a percentage of a $10,000 investment |
Class A |
$52 |
1.02%Footnote Reference* |
| Footnote |
Description |
Footnote* |
Annualized. | |
|
| Expenses Paid, Amount |
$ 52
|
|
| Expense Ratio, Percent |
1.02%
|
[21] |
| AssetsNet |
$ 3,006,439,135
|
|
| Holdings Count | Holding |
164
|
|
| Advisory Fees Paid, Amount |
$ 8,808,509
|
|
| InvestmentCompanyPortfolioTurnover |
13.00%
|
|
| Additional Fund Statistics [Text Block] |
Table Summary
Total Net Assets |
$3,006,439,135 |
# of Portfolio Holdings |
164 |
Portfolio Turnover Rate |
13% |
Total Management Fees Paid |
$8,808,509 | |
|
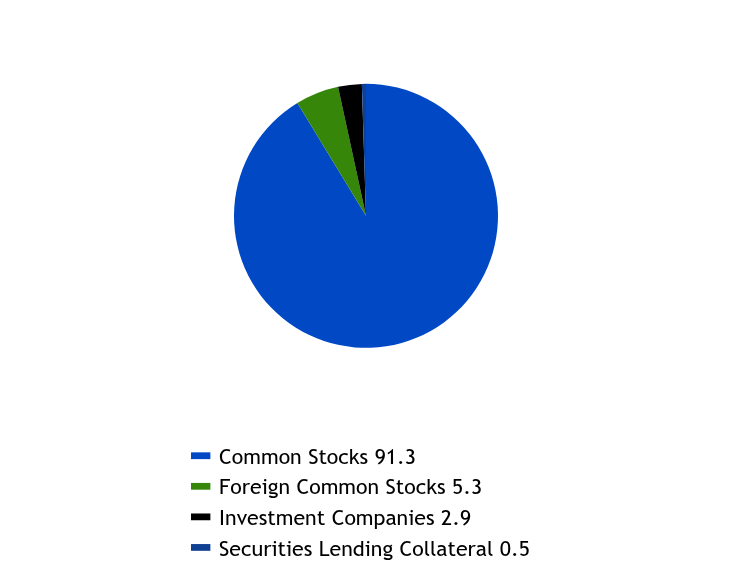
| Holdings [Text Block] |
Asset Allocation - % Investments
Table Summary
Value |
Value |
Common Stocks |
91.3 |
Foreign Common Stocks |
5.3 |
Investment Companies |
2.9 |
Securities Lending Collateral |
0.5 | The Fund may purchase and sell futures contracts to gain market exposure on cash balances. |
|
| Largest Holdings [Text Block] |
Top Ten Holdings - % Net Assets
Table Summary
Exxon Mobil Corp. |
1.8 |
Alphabet, Inc., Class A |
1.7 |
GE HealthCare Technologies, Inc. |
1.7 |
Elevance Health, Inc. |
1.6 |
Citigroup, Inc. |
1.6 |
Workday, Inc., Class A |
1.5 |
JPMorgan Chase & Co. |
1.4 |
Bank of America Corp. |
1.4 |
Wells Fargo & Co. |
1.4 |
APA Corp. |
1.4 | Excludes cash equivalents. |
|
| Material Fund Change [Text Block] |
|
|
| Accountant Change Statement [Text Block] |
|
|
| C000004803 |
|
|
| Shareholder Report [Line Items] |
|
|
| Fund Name |
Large Cap Value Fund
|
|
| Class Name |
Advisor
|
|
| Trading Symbol |
AVASX
|
|
| Annual or Semi-Annual Statement [Text Block] |
This semi-annual shareholder report contains important information about American Beacon Large Cap Value Fund for the period of November 1, 2025 to April 30, 2026.
|
|
| Additional Information [Text Block] |
You can find additional information about the Fund at www.americanbeaconfunds.com/fund-resources/. You can request this information by contacting us at 800-658-5811.
|
|
| Additional Information Phone Number |
800-658-5811
|
|
| Additional Information Website |
www.americanbeaconfunds.com/fund-resources/
|
|
| Expenses [Text Block] |
What were the Fund costs for the last six months?(based on a hypothetical $10,000 investment)
Table Summary
Class Name |
Costs of a $10,000 investment |
Costs paid as a percentage of a $10,000 investment |
Advisor Class |
$58 |
1.13%Footnote Reference* |
| Footnote |
Description |
Footnote* |
Annualized. | |
|
| Expenses Paid, Amount |
$ 58
|
|
| Expense Ratio, Percent |
1.13%
|
[22] |
| AssetsNet |
$ 3,006,439,135
|
|
| Holdings Count | Holding |
164
|
|
| Advisory Fees Paid, Amount |
$ 8,808,509
|
|
| InvestmentCompanyPortfolioTurnover |
13.00%
|
|
| Additional Fund Statistics [Text Block] |
Table Summary
Total Net Assets |
$3,006,439,135 |
# of Portfolio Holdings |
164 |
Portfolio Turnover Rate |
13% |
Total Management Fees Paid |
$8,808,509 | |
|
| Holdings [Text Block] |
Asset Allocation - % Investments
Table Summary
Value |
Value |
Common Stocks |
91.3 |
Foreign Common Stocks |
5.3 |
Investment Companies |
2.9 |
Securities Lending Collateral |
0.5 | The Fund may purchase and sell futures contracts to gain market exposure on cash balances. |
|
| Largest Holdings [Text Block] |
Top Ten Holdings - % Net Assets
Table Summary
Exxon Mobil Corp. |
1.8 |
Alphabet, Inc., Class A |
1.7 |
GE HealthCare Technologies, Inc. |
1.7 |
Elevance Health, Inc. |
1.6 |
Citigroup, Inc. |
1.6 |
Workday, Inc., Class A |
1.5 |
JPMorgan Chase & Co. |
1.4 |
Bank of America Corp. |
1.4 |
Wells Fargo & Co. |
1.4 |
APA Corp. |
1.4 | Excludes cash equivalents. |
|
| Material Fund Change [Text Block] |
|
|
| Accountant Change Statement [Text Block] |
|
|
| C000092339 |
|
|
| Shareholder Report [Line Items] |
|
|
| Fund Name |
Large Cap Value Fund
|
|
| Class Name |
C
|
|
| Trading Symbol |
ALVCX
|
|
| Annual or Semi-Annual Statement [Text Block] |
This semi-annual shareholder report contains important information about American Beacon Large Cap Value Fund for the period of November 1, 2025 to April 30, 2026.
|
|
| Additional Information [Text Block] |
You can find additional information about the Fund at www.americanbeaconfunds.com/fund-resources/. You can request this information by contacting us at 800-658-5811.
|
|
| Additional Information Phone Number |
800-658-5811
|
|
| Additional Information Website |
www.americanbeaconfunds.com/fund-resources/
|
|
| Expenses [Text Block] |
What were the Fund costs for the last six months?(based on a hypothetical $10,000 investment)
Table Summary
Class Name |
Costs of a $10,000 investment |
Costs paid as a percentage of a $10,000 investment |
Class C |
$89 |
1.73%Footnote Reference* |
| Footnote |
Description |
Footnote* |
Annualized. | |
|
| Expenses Paid, Amount |
$ 89
|
|
| Expense Ratio, Percent |
1.73%
|
[23] |
| AssetsNet |
$ 3,006,439,135
|
|
| Holdings Count | Holding |
164
|
|
| Advisory Fees Paid, Amount |
$ 8,808,509
|
|
| InvestmentCompanyPortfolioTurnover |
13.00%
|
|
| Additional Fund Statistics [Text Block] |
Table Summary
Total Net Assets |
$3,006,439,135 |
# of Portfolio Holdings |
164 |
Portfolio Turnover Rate |
13% |
Total Management Fees Paid |
$8,808,509 | |
|
| Holdings [Text Block] |
Asset Allocation - % Investments
Table Summary
Value |
Value |
Common Stocks |
91.3 |
Foreign Common Stocks |
5.3 |
Investment Companies |
2.9 |
Securities Lending Collateral |
0.5 | The Fund may purchase and sell futures contracts to gain market exposure on cash balances. |
|
| Largest Holdings [Text Block] |
Top Ten Holdings - % Net Assets
Table Summary
Exxon Mobil Corp. |
1.8 |
Alphabet, Inc., Class A |
1.7 |
GE HealthCare Technologies, Inc. |
1.7 |
Elevance Health, Inc. |
1.6 |
Citigroup, Inc. |
1.6 |
Workday, Inc., Class A |
1.5 |
JPMorgan Chase & Co. |
1.4 |
Bank of America Corp. |
1.4 |
Wells Fargo & Co. |
1.4 |
APA Corp. |
1.4 | Excludes cash equivalents. |
|
| Material Fund Change [Text Block] |
|
|
| Accountant Change Statement [Text Block] |
|
|
| C000002970 |
|
|
| Shareholder Report [Line Items] |
|
|
| Fund Name |
Large Cap Value Fund
|
|
| Class Name |
Investor
|
|
| Trading Symbol |
AAGPX
|
|
| Annual or Semi-Annual Statement [Text Block] |
This semi-annual shareholder report contains important information about American Beacon Large Cap Value Fund for the period of November 1, 2025 to April 30, 2026.
|
|
| Additional Information [Text Block] |
You can find additional information about the Fund at www.americanbeaconfunds.com/fund-resources/. You can request this information by contacting us at 800-658-5811.
|
|
| Additional Information Phone Number |
800-658-5811
|
|
| Additional Information Website |
www.americanbeaconfunds.com/fund-resources/
|
|
| Expenses [Text Block] |
What were the Fund costs for the last six months?(based on a hypothetical $10,000 investment)
Table Summary
Class Name |
Costs of a $10,000 investment |
Costs paid as a percentage of a $10,000 investment |
Investor |
$49 |
0.96%Footnote Reference* |
| Footnote |
Description |
Footnote* |
Annualized. | |
|
| Expenses Paid, Amount |
$ 49
|
|
| Expense Ratio, Percent |
0.96%
|
[24] |
| AssetsNet |
$ 3,006,439,135
|
|
| Holdings Count | Holding |
164
|
|
| Advisory Fees Paid, Amount |
$ 8,808,509
|
|
| InvestmentCompanyPortfolioTurnover |
13.00%
|
|
| Additional Fund Statistics [Text Block] |
Table Summary
Total Net Assets |
$3,006,439,135 |
# of Portfolio Holdings |
164 |
Portfolio Turnover Rate |
13% |
Total Management Fees Paid |
$8,808,509 | |
|
| Holdings [Text Block] |
Asset Allocation - % Investments
Table Summary
Value |
Value |
Common Stocks |
91.3 |
Foreign Common Stocks |
5.3 |
Investment Companies |
2.9 |
Securities Lending Collateral |
0.5 | The Fund may purchase and sell futures contracts to gain market exposure on cash balances. |
|
| Largest Holdings [Text Block] |
Top Ten Holdings - % Net Assets
Table Summary
Exxon Mobil Corp. |
1.8 |
Alphabet, Inc., Class A |
1.7 |
GE HealthCare Technologies, Inc. |
1.7 |
Elevance Health, Inc. |
1.6 |
Citigroup, Inc. |
1.6 |
Workday, Inc., Class A |
1.5 |
JPMorgan Chase & Co. |
1.4 |
Bank of America Corp. |
1.4 |
Wells Fargo & Co. |
1.4 |
APA Corp. |
1.4 | Excludes cash equivalents. |
|
| Material Fund Change [Text Block] |
|
|
| Accountant Change Statement [Text Block] |
|
|
| C000002969 |
|
|
| Shareholder Report [Line Items] |
|
|
| Fund Name |
Large Cap Value Fund
|
|
| Class Name |
R5
|
|
| Trading Symbol |
AADEX
|
|
| Annual or Semi-Annual Statement [Text Block] |
This semi-annual shareholder report contains important information about American Beacon Large Cap Value Fund for the period of November 1, 2025 to April 30, 2026.
|
|
| Additional Information [Text Block] |
You can find additional information about the Fund at www.americanbeaconfunds.com/fund-resources/. You can request this information by contacting us at 800-658-5811.
|
|
| Additional Information Phone Number |
800-658-5811
|
|
| Additional Information Website |
www.americanbeaconfunds.com/fund-resources/
|
|
| Expenses [Text Block] |
What were the Fund costs for the last six months?(based on a hypothetical $10,000 investment)
Table Summary
Class Name |
Costs of a $10,000 investment |
Costs paid as a percentage of a $10,000 investment |
R5 |
$34 |
0.66%Footnote Reference* |
| Footnote |
Description |
Footnote* |
Annualized. | |
|
| Expenses Paid, Amount |
$ 34
|
|
| Expense Ratio, Percent |
0.66%
|
[25] |
| AssetsNet |
$ 3,006,439,135
|
|
| Holdings Count | Holding |
164
|
|
| Advisory Fees Paid, Amount |
$ 8,808,509
|
|
| InvestmentCompanyPortfolioTurnover |
13.00%
|
|
| Additional Fund Statistics [Text Block] |
Table Summary
Total Net Assets |
$3,006,439,135 |
# of Portfolio Holdings |
164 |
Portfolio Turnover Rate |
13% |
Total Management Fees Paid |
$8,808,509 | |
|
| Holdings [Text Block] |
Asset Allocation - % Investments
Table Summary
Value |
Value |
Common Stocks |
91.3 |
Foreign Common Stocks |
5.3 |
Investment Companies |
2.9 |
Securities Lending Collateral |
0.5 | The Fund may purchase and sell futures contracts to gain market exposure on cash balances. |
|
| Largest Holdings [Text Block] |
Top Ten Holdings - % Net Assets
Table Summary
Exxon Mobil Corp. |
1.8 |
Alphabet, Inc., Class A |
1.7 |
GE HealthCare Technologies, Inc. |
1.7 |
Elevance Health, Inc. |
1.6 |
Citigroup, Inc. |
1.6 |
Workday, Inc., Class A |
1.5 |
JPMorgan Chase & Co. |
1.4 |
Bank of America Corp. |
1.4 |
Wells Fargo & Co. |
1.4 |
APA Corp. |
1.4 | Excludes cash equivalents. |
|
| Material Fund Change [Text Block] |
|
|
| Accountant Change Statement [Text Block] |
|
|
| C000185590 |
|
|
| Shareholder Report [Line Items] |
|
|
| Fund Name |
Large Cap Value Fund
|
|
| Class Name |
R6
|
|
| Trading Symbol |
AALRX
|
|
| Annual or Semi-Annual Statement [Text Block] |
This semi-annual shareholder report contains important information about American Beacon Large Cap Value Fund for the period of November 1, 2025 to April 30, 2026.
|
|
| Additional Information [Text Block] |
You can find additional information about the Fund at www.americanbeaconfunds.com/fund-resources/. You can request this information by contacting us at 800-658-5811.
|
|
| Additional Information Phone Number |
800-658-5811
|
|
| Additional Information Website |
www.americanbeaconfunds.com/fund-resources/
|
|
| Expenses [Text Block] |
What were the Fund costs for the last six months?(based on a hypothetical $10,000 investment)
Table Summary
Class Name |
Costs of a $10,000 investment |
Costs paid as a percentage of a $10,000 investment |
R6 |
$32 |
0.62%Footnote Reference* |
| Footnote |
Description |
Footnote* |
Annualized. | |
|
| Expenses Paid, Amount |
$ 32
|
|
| Expense Ratio, Percent |
0.62%
|
[26] |
| AssetsNet |
$ 3,006,439,135
|
|
| Holdings Count | Holding |
164
|
|
| Advisory Fees Paid, Amount |
$ 8,808,509
|
|
| InvestmentCompanyPortfolioTurnover |
13.00%
|
|
| Additional Fund Statistics [Text Block] |
Table Summary
Total Net Assets |
$3,006,439,135 |
# of Portfolio Holdings |
164 |
Portfolio Turnover Rate |
13% |
Total Management Fees Paid |
$8,808,509 | |
|
| Holdings [Text Block] |
Asset Allocation - % Investments
Table Summary
Value |
Value |
Common Stocks |
91.3 |
Foreign Common Stocks |
5.3 |
Investment Companies |
2.9 |
Securities Lending Collateral |
0.5 | The Fund may purchase and sell futures contracts to gain market exposure on cash balances. |
|
| Largest Holdings [Text Block] |
Top Ten Holdings - % Net Assets
Table Summary
Exxon Mobil Corp. |
1.8 |
Alphabet, Inc., Class A |
1.7 |
GE HealthCare Technologies, Inc. |
1.7 |
Elevance Health, Inc. |
1.6 |
Citigroup, Inc. |
1.6 |
Workday, Inc., Class A |
1.5 |
JPMorgan Chase & Co. |
1.4 |
Bank of America Corp. |
1.4 |
Wells Fargo & Co. |
1.4 |
APA Corp. |
1.4 | Excludes cash equivalents. |
|
| Material Fund Change [Text Block] |
|
|
| Accountant Change Statement [Text Block] |
|
|
| C000079122 |
|
|
| Shareholder Report [Line Items] |
|
|
| Fund Name |
Large Cap Value Fund
|
|
| Class Name |
Y
|
|
| Trading Symbol |
ABLYX
|
|
| Annual or Semi-Annual Statement [Text Block] |
This semi-annual shareholder report contains important information about American Beacon Large Cap Value Fund for the period of November 1, 2025 to April 30, 2026.
|
|
| Additional Information [Text Block] |
You can find additional information about the Fund at www.americanbeaconfunds.com/fund-resources/. You can request this information by contacting us at 800-658-5811.
|
|
| Additional Information Phone Number |
800-658-5811
|
|
| Additional Information Website |
www.americanbeaconfunds.com/fund-resources/
|
|
| Expenses [Text Block] |
What were the Fund costs for the last six months?(based on a hypothetical $10,000 investment)
Table Summary
Class Name |
Costs of a $10,000 investment |
Costs paid as a percentage of a $10,000 investment |
Y |
$37 |
0.72%Footnote Reference* |
| Footnote |
Description |
Footnote* |
Annualized. | |
|
| Expenses Paid, Amount |
$ 37
|
|
| Expense Ratio, Percent |
0.72%
|
[27] |
| AssetsNet |
$ 3,006,439,135
|
|
| Holdings Count | Holding |
164
|
|
| Advisory Fees Paid, Amount |
$ 8,808,509
|
|
| InvestmentCompanyPortfolioTurnover |
13.00%
|
|
| Additional Fund Statistics [Text Block] |
Table Summary
Total Net Assets |
$3,006,439,135 |
# of Portfolio Holdings |
164 |
Portfolio Turnover Rate |
13% |
Total Management Fees Paid |
$8,808,509 | |
|
| Holdings [Text Block] |
Asset Allocation - % Investments
Table Summary
Value |
Value |
Common Stocks |
91.3 |
Foreign Common Stocks |
5.3 |
Investment Companies |
2.9 |
Securities Lending Collateral |
0.5 | The Fund may purchase and sell futures contracts to gain market exposure on cash balances. |
|
| Largest Holdings [Text Block] |
Top Ten Holdings - % Net Assets
Table Summary
Exxon Mobil Corp. |
1.8 |
Alphabet, Inc., Class A |
1.7 |
GE HealthCare Technologies, Inc. |
1.7 |
Elevance Health, Inc. |
1.6 |
Citigroup, Inc. |
1.6 |
Workday, Inc., Class A |
1.5 |
JPMorgan Chase & Co. |
1.4 |
Bank of America Corp. |
1.4 |
Wells Fargo & Co. |
1.4 |
APA Corp. |
1.4 | Excludes cash equivalents. |
|
| Material Fund Change [Text Block] |
|
|
| Accountant Change Statement [Text Block] |
|
|
| C000089424 |
|
|
| Shareholder Report [Line Items] |
|
|
| Fund Name |
Small Cap Value Fund
|
|
| Class Name |
A
|
|
| Trading Symbol |
ABSAX
|
|
| Annual or Semi-Annual Statement [Text Block] |
This semi-annual shareholder report contains important information about American Beacon Small Cap Value Fund for the period of November 1, 2025 to April 30, 2026.
|
|
| Additional Information [Text Block] |
You can find additional information about the Fund at www.americanbeaconfunds.com/fund-resources/. You can request this information by contacting us at 800-658-5811.
|
|
| Additional Information Phone Number |
800-658-5811
|
|
| Additional Information Website |
www.americanbeaconfunds.com/fund-resources/
|
|
| Expenses [Text Block] |
What were the Fund costs for the last six months?(based on a hypothetical $10,000 investment)
Table Summary
Class Name |
Costs of a $10,000 investment |
Costs paid as a percentage of a $10,000 investment |
Class A |
$65 |
1.19%Footnote Reference* |
| Footnote |
Description |
Footnote* |
Annualized. | |
|
| Expenses Paid, Amount |
$ 65
|
|
| Expense Ratio, Percent |
1.19%
|
[28] |
| AssetsNet |
$ 3,829,405,021
|
|
| Holdings Count | Holding |
447
|
|
| Advisory Fees Paid, Amount |
$ 12,167,959
|
|
| InvestmentCompanyPortfolioTurnover |
35.00%
|
|
| Additional Fund Statistics [Text Block] |
Table Summary
Total Net Assets |
$3,829,405,021 |
# of Portfolio Holdings |
447 |
Portfolio Turnover Rate |
35% |
Total Management Fees Paid |
$12,167,959 | |
|
| Holdings [Text Block] |
Asset Allocation - % Investments
Table Summary
Value |
Value |
Common Stocks |
93.0 |
Investment Companies |
2.9 |
Foreign Common Stocks |
2.8 |
Securities Lending Collateral |
1.3 | The Fund may purchase and sell futures contracts to gain market exposure on cash balances. |
|
| Largest Holdings [Text Block] |
Top Ten Holdings - % Net Assets
Table Summary
Standex International Corp. |
1.3 |
Avnet, Inc. |
1.3 |
Knife River Corp. |
1.0 |
Murphy Oil Corp. |
0.9 |
F5, Inc. |
0.9 |
Olin Corp. |
0.9 |
ATI, Inc. |
0.9 |
AAR Corp. |
0.8 |
Stagwell, Inc. |
0.8 |
SLM Corp. |
0.8 | Excludes cash equivalents. |
|
| Material Fund Change [Text Block] |
|
|
| Accountant Change Statement [Text Block] |
|
|
| C000004770 |
|
|
| Shareholder Report [Line Items] |
|
|
| Fund Name |
Small Cap Value Fund
|
|
| Class Name |
Advisor
|
|
| Trading Symbol |
AASSX
|
|
| Annual or Semi-Annual Statement [Text Block] |
This semi-annual shareholder report contains important information about American Beacon Small Cap Value Fund for the period of November 1, 2025 to April 30, 2026.
|
|
| Additional Information [Text Block] |
You can find additional information about the Fund at www.americanbeaconfunds.com/fund-resources/. You can request this information by contacting us at 800-658-5811.
|
|
| Additional Information Phone Number |
800-658-5811
|
|
| Additional Information Website |
www.americanbeaconfunds.com/fund-resources/
|
|
| Expenses [Text Block] |
What were the Fund costs for the last six months?(based on a hypothetical $10,000 investment)
Table Summary
Class Name |
Costs of a $10,000 investment |
Costs paid as a percentage of a $10,000 investment |
Advisor Class |
$69 |
1.26%Footnote Reference* |
| Footnote |
Description |
Footnote* |
Annualized. | |
|
| Expenses Paid, Amount |
$ 69
|
|
| Expense Ratio, Percent |
1.26%
|
[29] |
| AssetsNet |
$ 3,829,405,021
|
|
| Holdings Count | Holding |
447
|
|
| Advisory Fees Paid, Amount |
$ 12,167,959
|
|
| InvestmentCompanyPortfolioTurnover |
35.00%
|
|
| Additional Fund Statistics [Text Block] |
Table Summary
Total Net Assets |
$3,829,405,021 |
# of Portfolio Holdings |
447 |
Portfolio Turnover Rate |
35% |
Total Management Fees Paid |
$12,167,959 | |
|
| Holdings [Text Block] |
Asset Allocation - % Investments
Table Summary
Value |
Value |
Common Stocks |
93.0 |
Investment Companies |
2.9 |
Foreign Common Stocks |
2.8 |
Securities Lending Collateral |
1.3 | The Fund may purchase and sell futures contracts to gain market exposure on cash balances. |
|
| Largest Holdings [Text Block] |
Top Ten Holdings - % Net Assets
Table Summary
Standex International Corp. |
1.3 |
Avnet, Inc. |
1.3 |
Knife River Corp. |
1.0 |
Murphy Oil Corp. |
0.9 |
F5, Inc. |
0.9 |
Olin Corp. |
0.9 |
ATI, Inc. |
0.9 |
AAR Corp. |
0.8 |
Stagwell, Inc. |
0.8 |
SLM Corp. |
0.8 | Excludes cash equivalents. |
|
| Material Fund Change [Text Block] |
|
|
| Accountant Change Statement [Text Block] |
|
|
| C000092341 |
|
|
| Shareholder Report [Line Items] |
|
|
| Fund Name |
Small Cap Value Fund
|
|
| Class Name |
C
|
|
| Trading Symbol |
ASVCX
|
|
| Annual or Semi-Annual Statement [Text Block] |
This semi-annual shareholder report contains important information about American Beacon Small Cap Value Fund for the period of November 1, 2025 to April 30, 2026.
|
|
| Additional Information [Text Block] |
You can find additional information about the Fund at www.americanbeaconfunds.com/fund-resources/. You can request this information by contacting us at 800-658-5811.
|
|
| Additional Information Phone Number |
800-658-5811
|
|
| Additional Information Website |
www.americanbeaconfunds.com/fund-resources/
|
|
| Expenses [Text Block] |
What were the Fund costs for the last six months?(based on a hypothetical $10,000 investment)
Table Summary
Class Name |
Costs of a $10,000 investment |
Costs paid as a percentage of a $10,000 investment |
Class C |
$110 |
2.02%Footnote Reference* |
| Footnote |
Description |
Footnote* |
Annualized. | |
|
| Expenses Paid, Amount |
$ 110
|
|
| Expense Ratio, Percent |
2.02%
|
[30] |
| AssetsNet |
$ 3,829,405,021
|
|
| Holdings Count | Holding |
447
|
|
| Advisory Fees Paid, Amount |
$ 12,167,959
|
|
| InvestmentCompanyPortfolioTurnover |
35.00%
|
|
| Additional Fund Statistics [Text Block] |
Table Summary
Total Net Assets |
$3,829,405,021 |
# of Portfolio Holdings |
447 |
Portfolio Turnover Rate |
35% |
Total Management Fees Paid |
$12,167,959 | |
|
| Holdings [Text Block] |
Asset Allocation - % Investments
Table Summary
Value |
Value |
Common Stocks |
93.0 |
Investment Companies |
2.9 |
Foreign Common Stocks |
2.8 |
Securities Lending Collateral |
1.3 | The Fund may purchase and sell futures contracts to gain market exposure on cash balances. |
|
| Largest Holdings [Text Block] |
Top Ten Holdings - % Net Assets
Table Summary
Standex International Corp. |
1.3 |
Avnet, Inc. |
1.3 |
Knife River Corp. |
1.0 |
Murphy Oil Corp. |
0.9 |
F5, Inc. |
0.9 |
Olin Corp. |
0.9 |
ATI, Inc. |
0.9 |
AAR Corp. |
0.8 |
Stagwell, Inc. |
0.8 |
SLM Corp. |
0.8 | Excludes cash equivalents. |
|
| Material Fund Change [Text Block] |
|
|
| Accountant Change Statement [Text Block] |
|
|
| C000004769 |
|
|
| Shareholder Report [Line Items] |
|
|
| Fund Name |
Small Cap Value Fund
|
|
| Class Name |
Investor
|
|
| Trading Symbol |
AVPAX
|
|
| Annual or Semi-Annual Statement [Text Block] |
This semi-annual shareholder report contains important information about American Beacon Small Cap Value Fund for the period of November 1, 2025 to April 30, 2026.
|
|
| Additional Information [Text Block] |
You can find additional information about the Fund at www.americanbeaconfunds.com/fund-resources/. You can request this information by contacting us at 800-658-5811.
|
|
| Additional Information Phone Number |
800-658-5811
|
|
| Additional Information Website |
www.americanbeaconfunds.com/fund-resources/
|
|
| Expenses [Text Block] |
What were the Fund costs for the last six months?(based on a hypothetical $10,000 investment)
Table Summary
Class Name |
Costs of a $10,000 investment |
Costs paid as a percentage of a $10,000 investment |
Investor |
$60 |
1.10%Footnote Reference* |
| Footnote |
Description |
Footnote* |
Annualized. | |
|
| Expenses Paid, Amount |
$ 60
|
|
| Expense Ratio, Percent |
1.10%
|
[31] |
| AssetsNet |
$ 3,829,405,021
|
|
| Holdings Count | Holding |
447
|
|
| Advisory Fees Paid, Amount |
$ 12,167,959
|
|
| InvestmentCompanyPortfolioTurnover |
35.00%
|
|
| Additional Fund Statistics [Text Block] |
Table Summary
Total Net Assets |
$3,829,405,021 |
# of Portfolio Holdings |
447 |
Portfolio Turnover Rate |
35% |
Total Management Fees Paid |
$12,167,959 | |
|
| Holdings [Text Block] |
Asset Allocation - % Investments
Table Summary
Value |
Value |
Common Stocks |
93.0 |
Investment Companies |
2.9 |
Foreign Common Stocks |
2.8 |
Securities Lending Collateral |
1.3 | The Fund may purchase and sell futures contracts to gain market exposure on cash balances. |
|
| Largest Holdings [Text Block] |
Top Ten Holdings - % Net Assets
Table Summary
Standex International Corp. |
1.3 |
Avnet, Inc. |
1.3 |
Knife River Corp. |
1.0 |
Murphy Oil Corp. |
0.9 |
F5, Inc. |
0.9 |
Olin Corp. |
0.9 |
ATI, Inc. |
0.9 |
AAR Corp. |
0.8 |
Stagwell, Inc. |
0.8 |
SLM Corp. |
0.8 | Excludes cash equivalents. |
|
| Material Fund Change [Text Block] |
|
|
| Accountant Change Statement [Text Block] |
|
|
| C000004768 |
|
|
| Shareholder Report [Line Items] |
|
|
| Fund Name |
Small Cap Value Fund
|
|
| Class Name |
R5
|
|
| Trading Symbol |
AVFIX
|
|
| Annual or Semi-Annual Statement [Text Block] |
This semi-annual shareholder report contains important information about American Beacon Small Cap Value Fund for the period of November 1, 2025 to April 30, 2026.
|
|
| Additional Information [Text Block] |
You can find additional information about the Fund at www.americanbeaconfunds.com/fund-resources/. You can request this information by contacting us at 800-658-5811.
|
|
| Additional Information Phone Number |
800-658-5811
|
|
| Additional Information Website |
www.americanbeaconfunds.com/fund-resources/
|
|
| Expenses [Text Block] |
What were the Fund costs for the last six months?(based on a hypothetical $10,000 investment)
Table Summary
Class Name |
Costs of a $10,000 investment |
Costs paid as a percentage of a $10,000 investment |
R5 |
$42 |
0.77%Footnote Reference* |
| Footnote |
Description |
Footnote* |
Annualized. | |
|
| Expenses Paid, Amount |
$ 42
|
|
| Expense Ratio, Percent |
0.77%
|
[32] |
| AssetsNet |
$ 3,829,405,021
|
|
| Holdings Count | Holding |
447
|
|
| Advisory Fees Paid, Amount |
$ 12,167,959
|
|
| InvestmentCompanyPortfolioTurnover |
35.00%
|
|
| Additional Fund Statistics [Text Block] |
Table Summary
Total Net Assets |
$3,829,405,021 |
# of Portfolio Holdings |
447 |
Portfolio Turnover Rate |
35% |
Total Management Fees Paid |
$12,167,959 | |
|
| Holdings [Text Block] |
Asset Allocation - % Investments
Table Summary
Value |
Value |
Common Stocks |
93.0 |
Investment Companies |
2.9 |
Foreign Common Stocks |
2.8 |
Securities Lending Collateral |
1.3 | The Fund may purchase and sell futures contracts to gain market exposure on cash balances. |
|
| Largest Holdings [Text Block] |
Top Ten Holdings - % Net Assets
Table Summary
Standex International Corp. |
1.3 |
Avnet, Inc. |
1.3 |
Knife River Corp. |
1.0 |
Murphy Oil Corp. |
0.9 |
F5, Inc. |
0.9 |
Olin Corp. |
0.9 |
ATI, Inc. |
0.9 |
AAR Corp. |
0.8 |
Stagwell, Inc. |
0.8 |
SLM Corp. |
0.8 | Excludes cash equivalents. |
|
| Material Fund Change [Text Block] |
|
|
| Accountant Change Statement [Text Block] |
|
|
| C000180103 |
|
|
| Shareholder Report [Line Items] |
|
|
| Fund Name |
Small Cap Value Fund
|
|
| Class Name |
R6
|
|
| Trading Symbol |
AASRX
|
|
| Annual or Semi-Annual Statement [Text Block] |
This semi-annual shareholder report contains important information about American Beacon Small Cap Value Fund for the period of November 1, 2025 to April 30, 2026.
|
|
| Additional Information [Text Block] |
You can find additional information about the Fund at www.americanbeaconfunds.com/fund-resources/. You can request this information by contacting us at 800-658-5811.
|
|
| Additional Information Phone Number |
800-658-5811
|
|
| Additional Information Website |
www.americanbeaconfunds.com/fund-resources/
|
|
| Expenses [Text Block] |
What were the Fund costs for the last six months?(based on a hypothetical $10,000 investment)
Table Summary
Class Name |
Costs of a $10,000 investment |
Costs paid as a percentage of a $10,000 investment |
R6 |
$40 |
0.74%Footnote Reference* |
| Footnote |
Description |
Footnote* |
Annualized. | |
|
| Expenses Paid, Amount |
$ 40
|
|
| Expense Ratio, Percent |
0.74%
|
[33] |
| AssetsNet |
$ 3,829,405,021
|
|
| Holdings Count | Holding |
447
|
|
| Advisory Fees Paid, Amount |
$ 12,167,959
|
|
| InvestmentCompanyPortfolioTurnover |
35.00%
|
|
| Additional Fund Statistics [Text Block] |
Table Summary
Total Net Assets |
$3,829,405,021 |
# of Portfolio Holdings |
447 |
Portfolio Turnover Rate |
35% |
Total Management Fees Paid |
$12,167,959 | |
|
| Holdings [Text Block] |
Asset Allocation - % Investments
Table Summary
Value |
Value |
Common Stocks |
93.0 |
Investment Companies |
2.9 |
Foreign Common Stocks |
2.8 |
Securities Lending Collateral |
1.3 | The Fund may purchase and sell futures contracts to gain market exposure on cash balances. |
|
| Largest Holdings [Text Block] |
Top Ten Holdings - % Net Assets
Table Summary
Standex International Corp. |
1.3 |
Avnet, Inc. |
1.3 |
Knife River Corp. |
1.0 |
Murphy Oil Corp. |
0.9 |
F5, Inc. |
0.9 |
Olin Corp. |
0.9 |
ATI, Inc. |
0.9 |
AAR Corp. |
0.8 |
Stagwell, Inc. |
0.8 |
SLM Corp. |
0.8 | Excludes cash equivalents. |
|
| Material Fund Change [Text Block] |
|
|
| Accountant Change Statement [Text Block] |
|
|
| C000079123 |
|
|
| Shareholder Report [Line Items] |
|
|
| Fund Name |
Small Cap Value Fund
|
|
| Class Name |
Y
|
|
| Trading Symbol |
ABSYX
|
|
| Annual or Semi-Annual Statement [Text Block] |
This semi-annual shareholder report contains important information about American Beacon Small Cap Value Fund for the period of November 1, 2025 to April 30, 2026.
|
|
| Additional Information [Text Block] |
You can find additional information about the Fund at www.americanbeaconfunds.com/fund-resources/. You can request this information by contacting us at 800-658-5811.
|
|
| Additional Information Phone Number |
800-658-5811
|
|
| Additional Information Website |
www.americanbeaconfunds.com/fund-resources/
|
|
| Expenses [Text Block] |
What were the Fund costs for the last six months?(based on a hypothetical $10,000 investment)
Table Summary
Class Name |
Costs of a $10,000 investment |
Costs paid as a percentage of a $10,000 investment |
Y |
$46 |
0.84%Footnote Reference* |
| Footnote |
Description |
Footnote* |
Annualized. | |
|
| Expenses Paid, Amount |
$ 46
|
|
| Expense Ratio, Percent |
0.84%
|
[34] |
| AssetsNet |
$ 3,829,405,021
|
|
| Holdings Count | Holding |
447
|
|
| Advisory Fees Paid, Amount |
$ 12,167,959
|
|
| InvestmentCompanyPortfolioTurnover |
35.00%
|
|
| Additional Fund Statistics [Text Block] |
Table Summary
Total Net Assets |
$3,829,405,021 |
# of Portfolio Holdings |
447 |
Portfolio Turnover Rate |
35% |
Total Management Fees Paid |
$12,167,959 | |
|
| Holdings [Text Block] |
Asset Allocation - % Investments
Table Summary
Value |
Value |
Common Stocks |
93.0 |
Investment Companies |
2.9 |
Foreign Common Stocks |
2.8 |
Securities Lending Collateral |
1.3 | The Fund may purchase and sell futures contracts to gain market exposure on cash balances. |
|
| Largest Holdings [Text Block] |
Top Ten Holdings - % Net Assets
Table Summary
Standex International Corp. |
1.3 |
Avnet, Inc. |
1.3 |
Knife River Corp. |
1.0 |
Murphy Oil Corp. |
0.9 |
F5, Inc. |
0.9 |
Olin Corp. |
0.9 |
ATI, Inc. |
0.9 |
AAR Corp. |
0.8 |
Stagwell, Inc. |
0.8 |
SLM Corp. |
0.8 | Excludes cash equivalents. |
|
| Material Fund Change [Text Block] |
|
|
| Accountant Change Statement [Text Block] |
|
|
|
|