Pay vs Performance Disclosure - USD ($)
|
3 Months Ended |
4 Months Ended |
9 Months Ended |
12 Months Ended |
Aug. 04, 2025 |
Apr. 30, 2025 |
Apr. 30, 2026 |
Apr. 30, 2026 |
Dec. 31, 2024 |
| Pay vs Performance Disclosure |
|
|
|
|
|
| Pay vs Performance Disclosure, Table |
|
|
|
| | | | | | | | | | | | | | | | | | | | | | | | | | | | | | | | | | | | | | | | | | | | | | | | | | | Year(1) | | Summary Compensation Table Total for First PEO(2) | | Compensation Actually Paid to First PEO(2) (3) (4) | | Summary Compensation Table Total for Second PEO(2) | | Compensation Actually Paid to Second PEO(2) (3) (4) | | Average Summary Compensation Table Total for Non-PEO NEOs(5) | | Average Compensation Actually Paid to Non-PEO NEOs(3) (4) (5) | | Value of Initial Fixed $100 Investment Based on Total Shareholder Return(6) | | Net Income (in millions) | | (a) | | (b) | | (c) | | (d) | | (e) | | (f) | | (g) | | (h) | | (i) | | 2026 | | $1,911,233 | | $1,911,233 | | $539,000 | | $539,000 | | $1,040,384 | | $1,171,293 | | $47.39 | | $0.1 | | Transition period ended April 30, 2025 | | n/a | | n/a | | $129,202 | | $129,202 | | n/a | | n/a | | $113.52 | | $(1.4) | | 2024 | | n/a | | n/a | | $371,656 | | $371,656 | | $185,505 | | $185,402 | | $123.73 | | $(3.1) | | | | | | | | | | | | | | | | | |
|
|
| Named Executive Officers, Footnote |
|
|
|
Effective August 5, 2025, David J. Namdar was named PEO and is listed as "First PEO". Anthony K. McDonald served as PEO until August 4, 2025 and is listed as the "Second PEO". For 2026, our Non-PEO NEOs consisted of William B. Miller. For 2025, there were no Non-PEO NEOs. For 2024, our Non-PEO NEOs consisted of Ian K. Patel.
|
|
| Adjustment To PEO Compensation, Footnote |
|
|
|
Deductions from, and additions to, total compensation in the 2026 Summary Compensation Table to calculate Compensation Actually Paid consist of: | | | | | | | | | | | | | | | | | | | | | | | | | | | | | | | | | | | | | | | | | | | | | | | | | | | | | | | 2026 | | Transition period ended April 30, 2025 | | 2024 | | First PEO | | Second PEO | | Average Non-PEO NEOs | | First PEO | | Second PEO | | Average Non-PEO NEOs | | First PEO | | Second PEO | | Average Non-PEO NEOs | | Total Compensation from Summary Compensation Table | $1,911,233 | | $539,000 | | $1,040,384 | | n/a | | $129,202 | | n/a | | n/a | | $371,656 | | $185,505 | | Adjustments for Equity Awards | | | | | | | | | | | | | | | | | | | Adjustment for grant date values in the Summary Compensation Table | -$558,400 | | $0 | | -$999,999 | | n/a | | $0 | | n/a | | n/a | | $0 | | $0 | | Year-end fair value of unvested awards granted in the current year | $558,400 | | $0 | | $1,130,908 | | n/a | | $0 | | n/a | | n/a | | $0 | | $0 | | Year-over-year difference of year-end fair values for unvested awards granted in prior years | $0 | | $0 | | $0 | | n/a | | $0 | | n/a | | n/a | | $0 | | $0 | | Fair values at vest date for awards granted and vested in current year | $0 | | $0 | | $0 | | n/a | | $0 | | n/a | | n/a | | $0 | | $0 | | Difference in fair values between prior year-end fair values and vest date fair values for awards granted in prior years | $0 | | $0 | | $0 | | n/a | | $0 | | n/a | | n/a | | $0 | | $0 | | Forfeitures during current year equal to prior year-end fair value | $0 | | $0 | | $0 | | n/a | | $0 | | n/a | | n/a | | $0 | | -$3 | | Dividends or dividend equivalents not otherwise included in the total compensation | $0 | | $0 | | $0 | | n/a | | $0 | | n/a | | n/a | | $0 | | -$100 | | Total Adjustments for Equity Awards | $0 | | $0 | | $130,909 | | n/a | | $0 | | n/a | | n/a | | $0 | | -$103 | | Compensation Actually Paid (as calculated) | $1,911,233 | | $539,000 | | $1,171,293 | | n/a | | $129,202 | | n/a | | n/a | | $371,656 | | $185,402 |
|
|
| Non-PEO NEO Average Total Compensation Amount |
|
|
|
$ 1,040,384
|
$ 185,505
|
| Non-PEO NEO Average Compensation Actually Paid Amount |
|
|
|
$ 1,171,293
|
185,402
|
| Adjustment to Non-PEO NEO Compensation Footnote |
|
|
|
Deductions from, and additions to, total compensation in the 2026 Summary Compensation Table to calculate Compensation Actually Paid consist of: | | | | | | | | | | | | | | | | | | | | | | | | | | | | | | | | | | | | | | | | | | | | | | | | | | | | | | | 2026 | | Transition period ended April 30, 2025 | | 2024 | | First PEO | | Second PEO | | Average Non-PEO NEOs | | First PEO | | Second PEO | | Average Non-PEO NEOs | | First PEO | | Second PEO | | Average Non-PEO NEOs | | Total Compensation from Summary Compensation Table | $1,911,233 | | $539,000 | | $1,040,384 | | n/a | | $129,202 | | n/a | | n/a | | $371,656 | | $185,505 | | Adjustments for Equity Awards | | | | | | | | | | | | | | | | | | | Adjustment for grant date values in the Summary Compensation Table | -$558,400 | | $0 | | -$999,999 | | n/a | | $0 | | n/a | | n/a | | $0 | | $0 | | Year-end fair value of unvested awards granted in the current year | $558,400 | | $0 | | $1,130,908 | | n/a | | $0 | | n/a | | n/a | | $0 | | $0 | | Year-over-year difference of year-end fair values for unvested awards granted in prior years | $0 | | $0 | | $0 | | n/a | | $0 | | n/a | | n/a | | $0 | | $0 | | Fair values at vest date for awards granted and vested in current year | $0 | | $0 | | $0 | | n/a | | $0 | | n/a | | n/a | | $0 | | $0 | | Difference in fair values between prior year-end fair values and vest date fair values for awards granted in prior years | $0 | | $0 | | $0 | | n/a | | $0 | | n/a | | n/a | | $0 | | $0 | | Forfeitures during current year equal to prior year-end fair value | $0 | | $0 | | $0 | | n/a | | $0 | | n/a | | n/a | | $0 | | -$3 | | Dividends or dividend equivalents not otherwise included in the total compensation | $0 | | $0 | | $0 | | n/a | | $0 | | n/a | | n/a | | $0 | | -$100 | | Total Adjustments for Equity Awards | $0 | | $0 | | $130,909 | | n/a | | $0 | | n/a | | n/a | | $0 | | -$103 | | Compensation Actually Paid (as calculated) | $1,911,233 | | $539,000 | | $1,171,293 | | n/a | | $129,202 | | n/a | | n/a | | $371,656 | | $185,402 |
|
|
| Equity Valuation Assumption Difference, Footnote |
|
|
|
Equity valuation assumptions for calculating Compensation Actually Paid are not materially different from grant date valuation assumptions.
|
|
| Compensation Actually Paid vs. Total Shareholder Return |
|
|
|
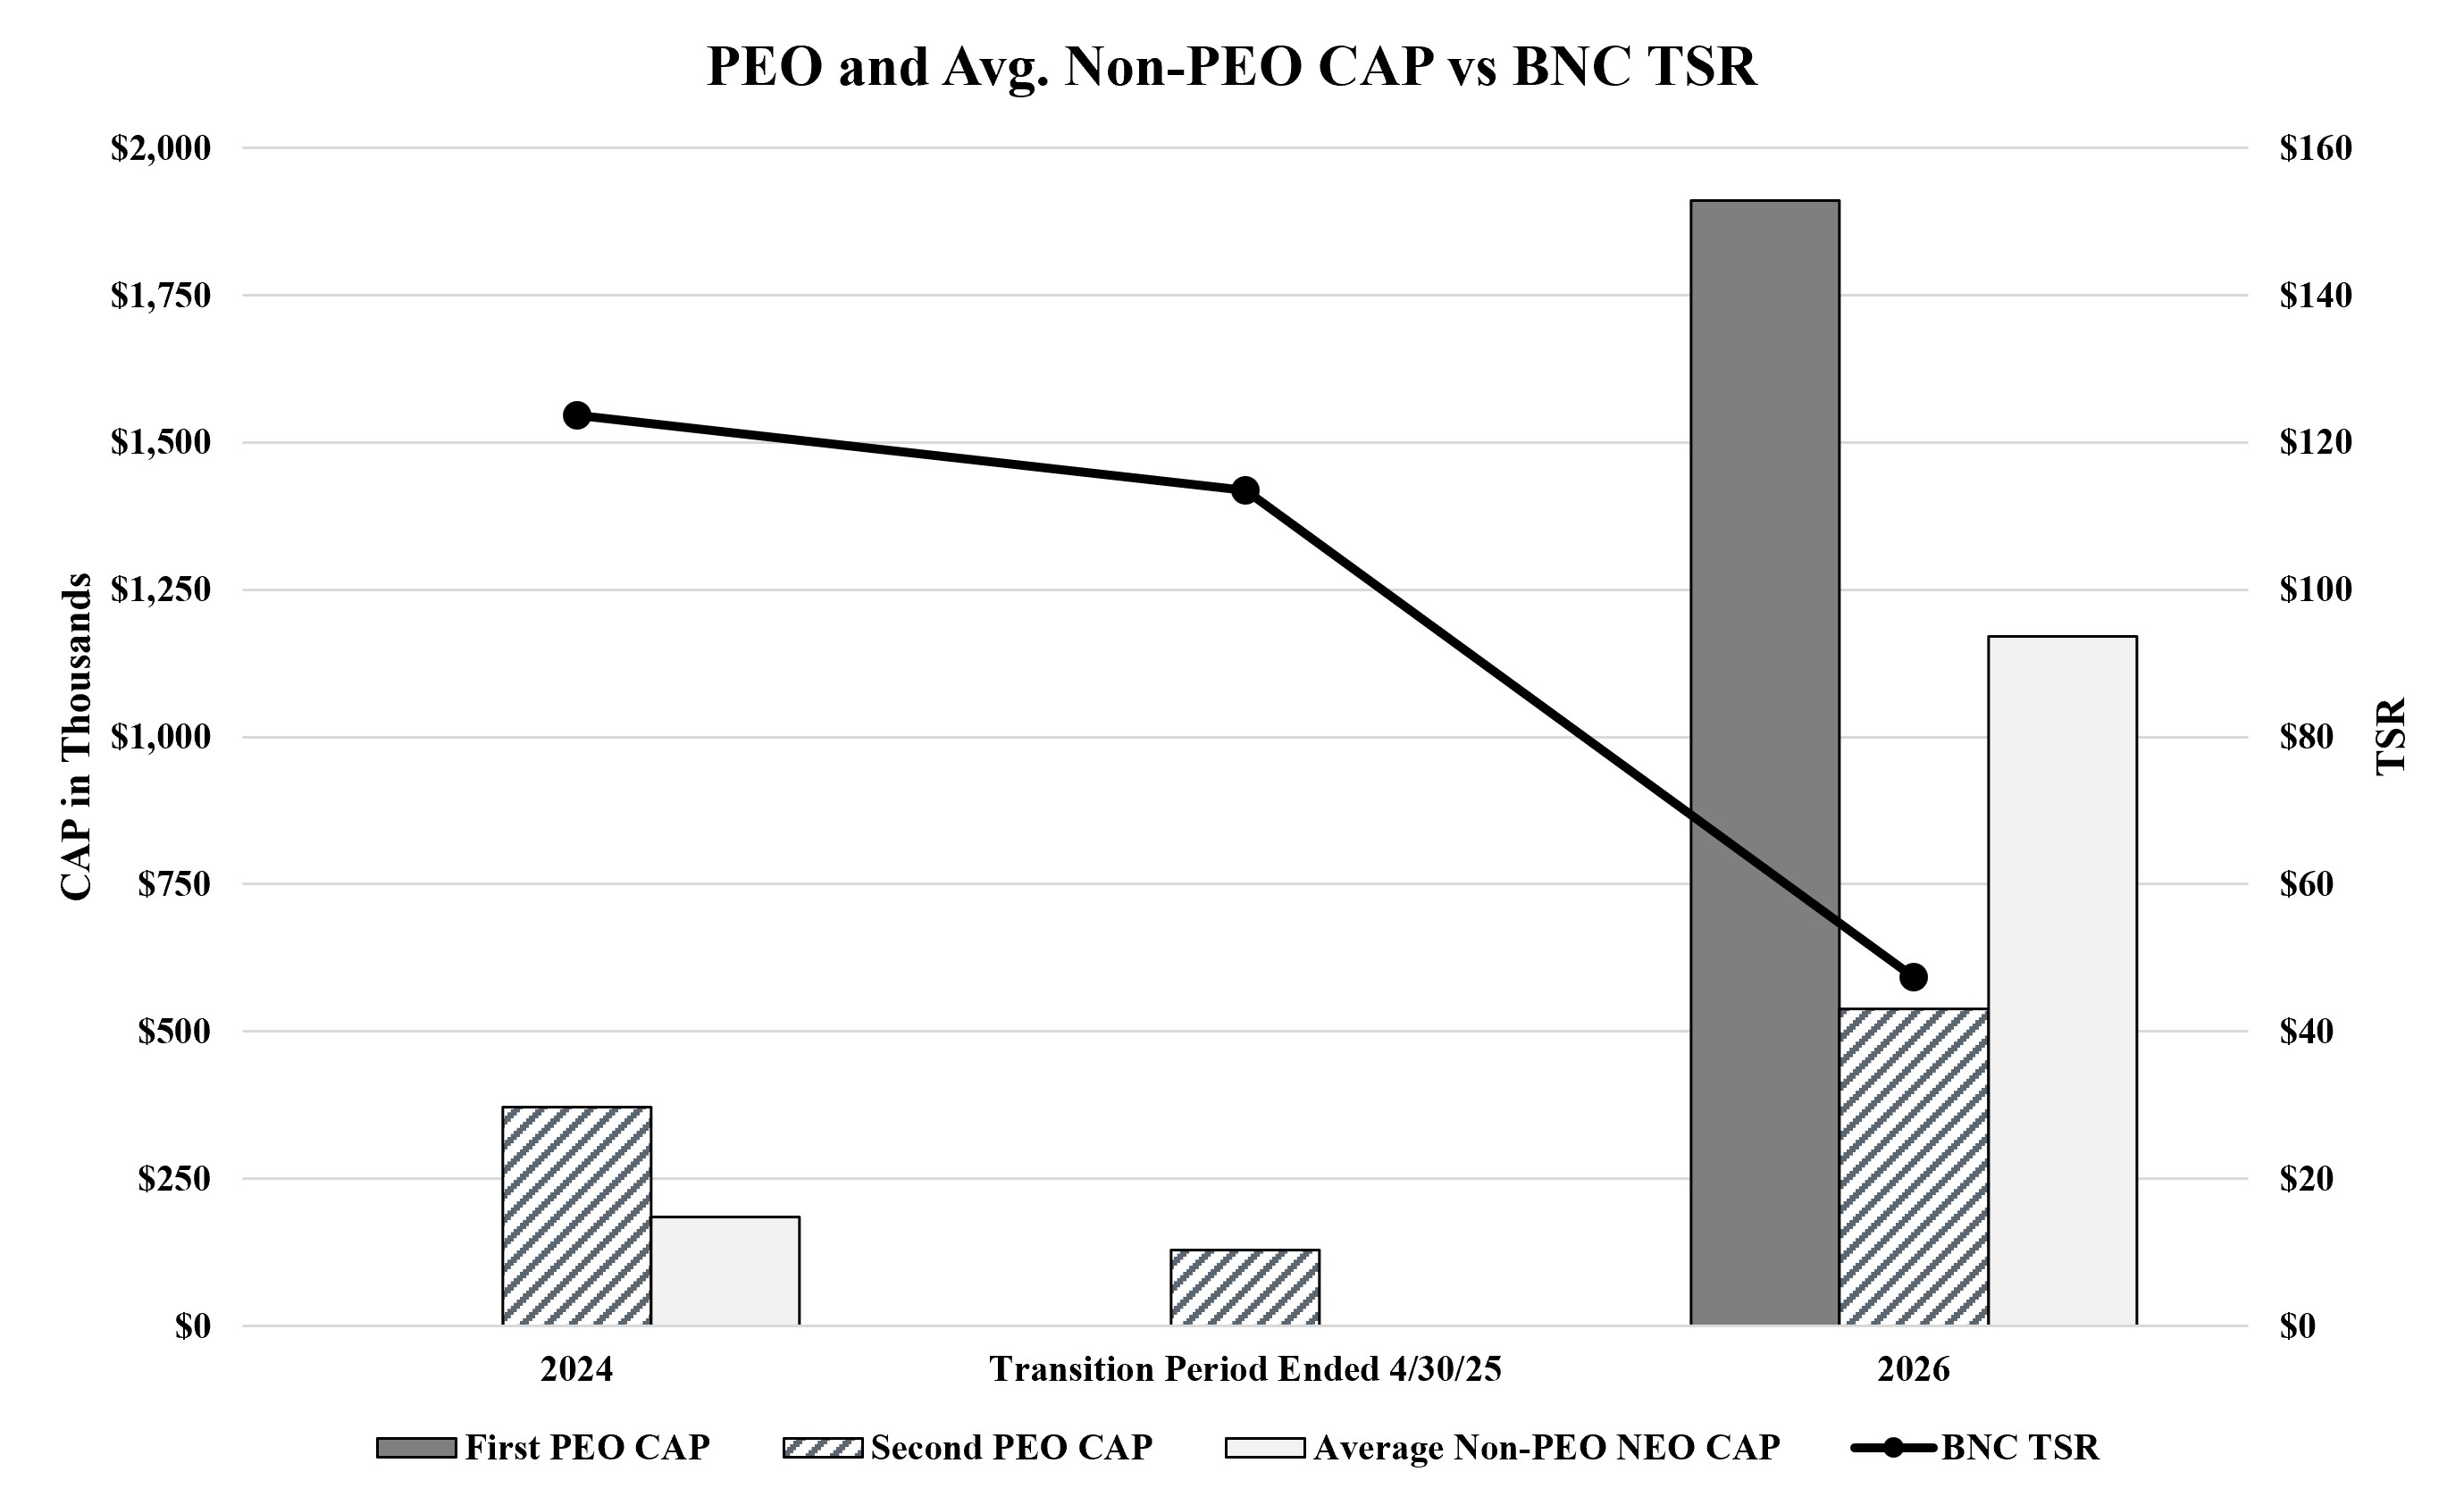
The illustrations below provide a graphical description of CAP (as calculated in accordance with the SEC rules) and the following measures: •the Company’s cumulative TSR; •the Company’s Net Income.
CAP and Cumulative TSR
|
|
| Compensation Actually Paid vs. Net Income |
|
|
|
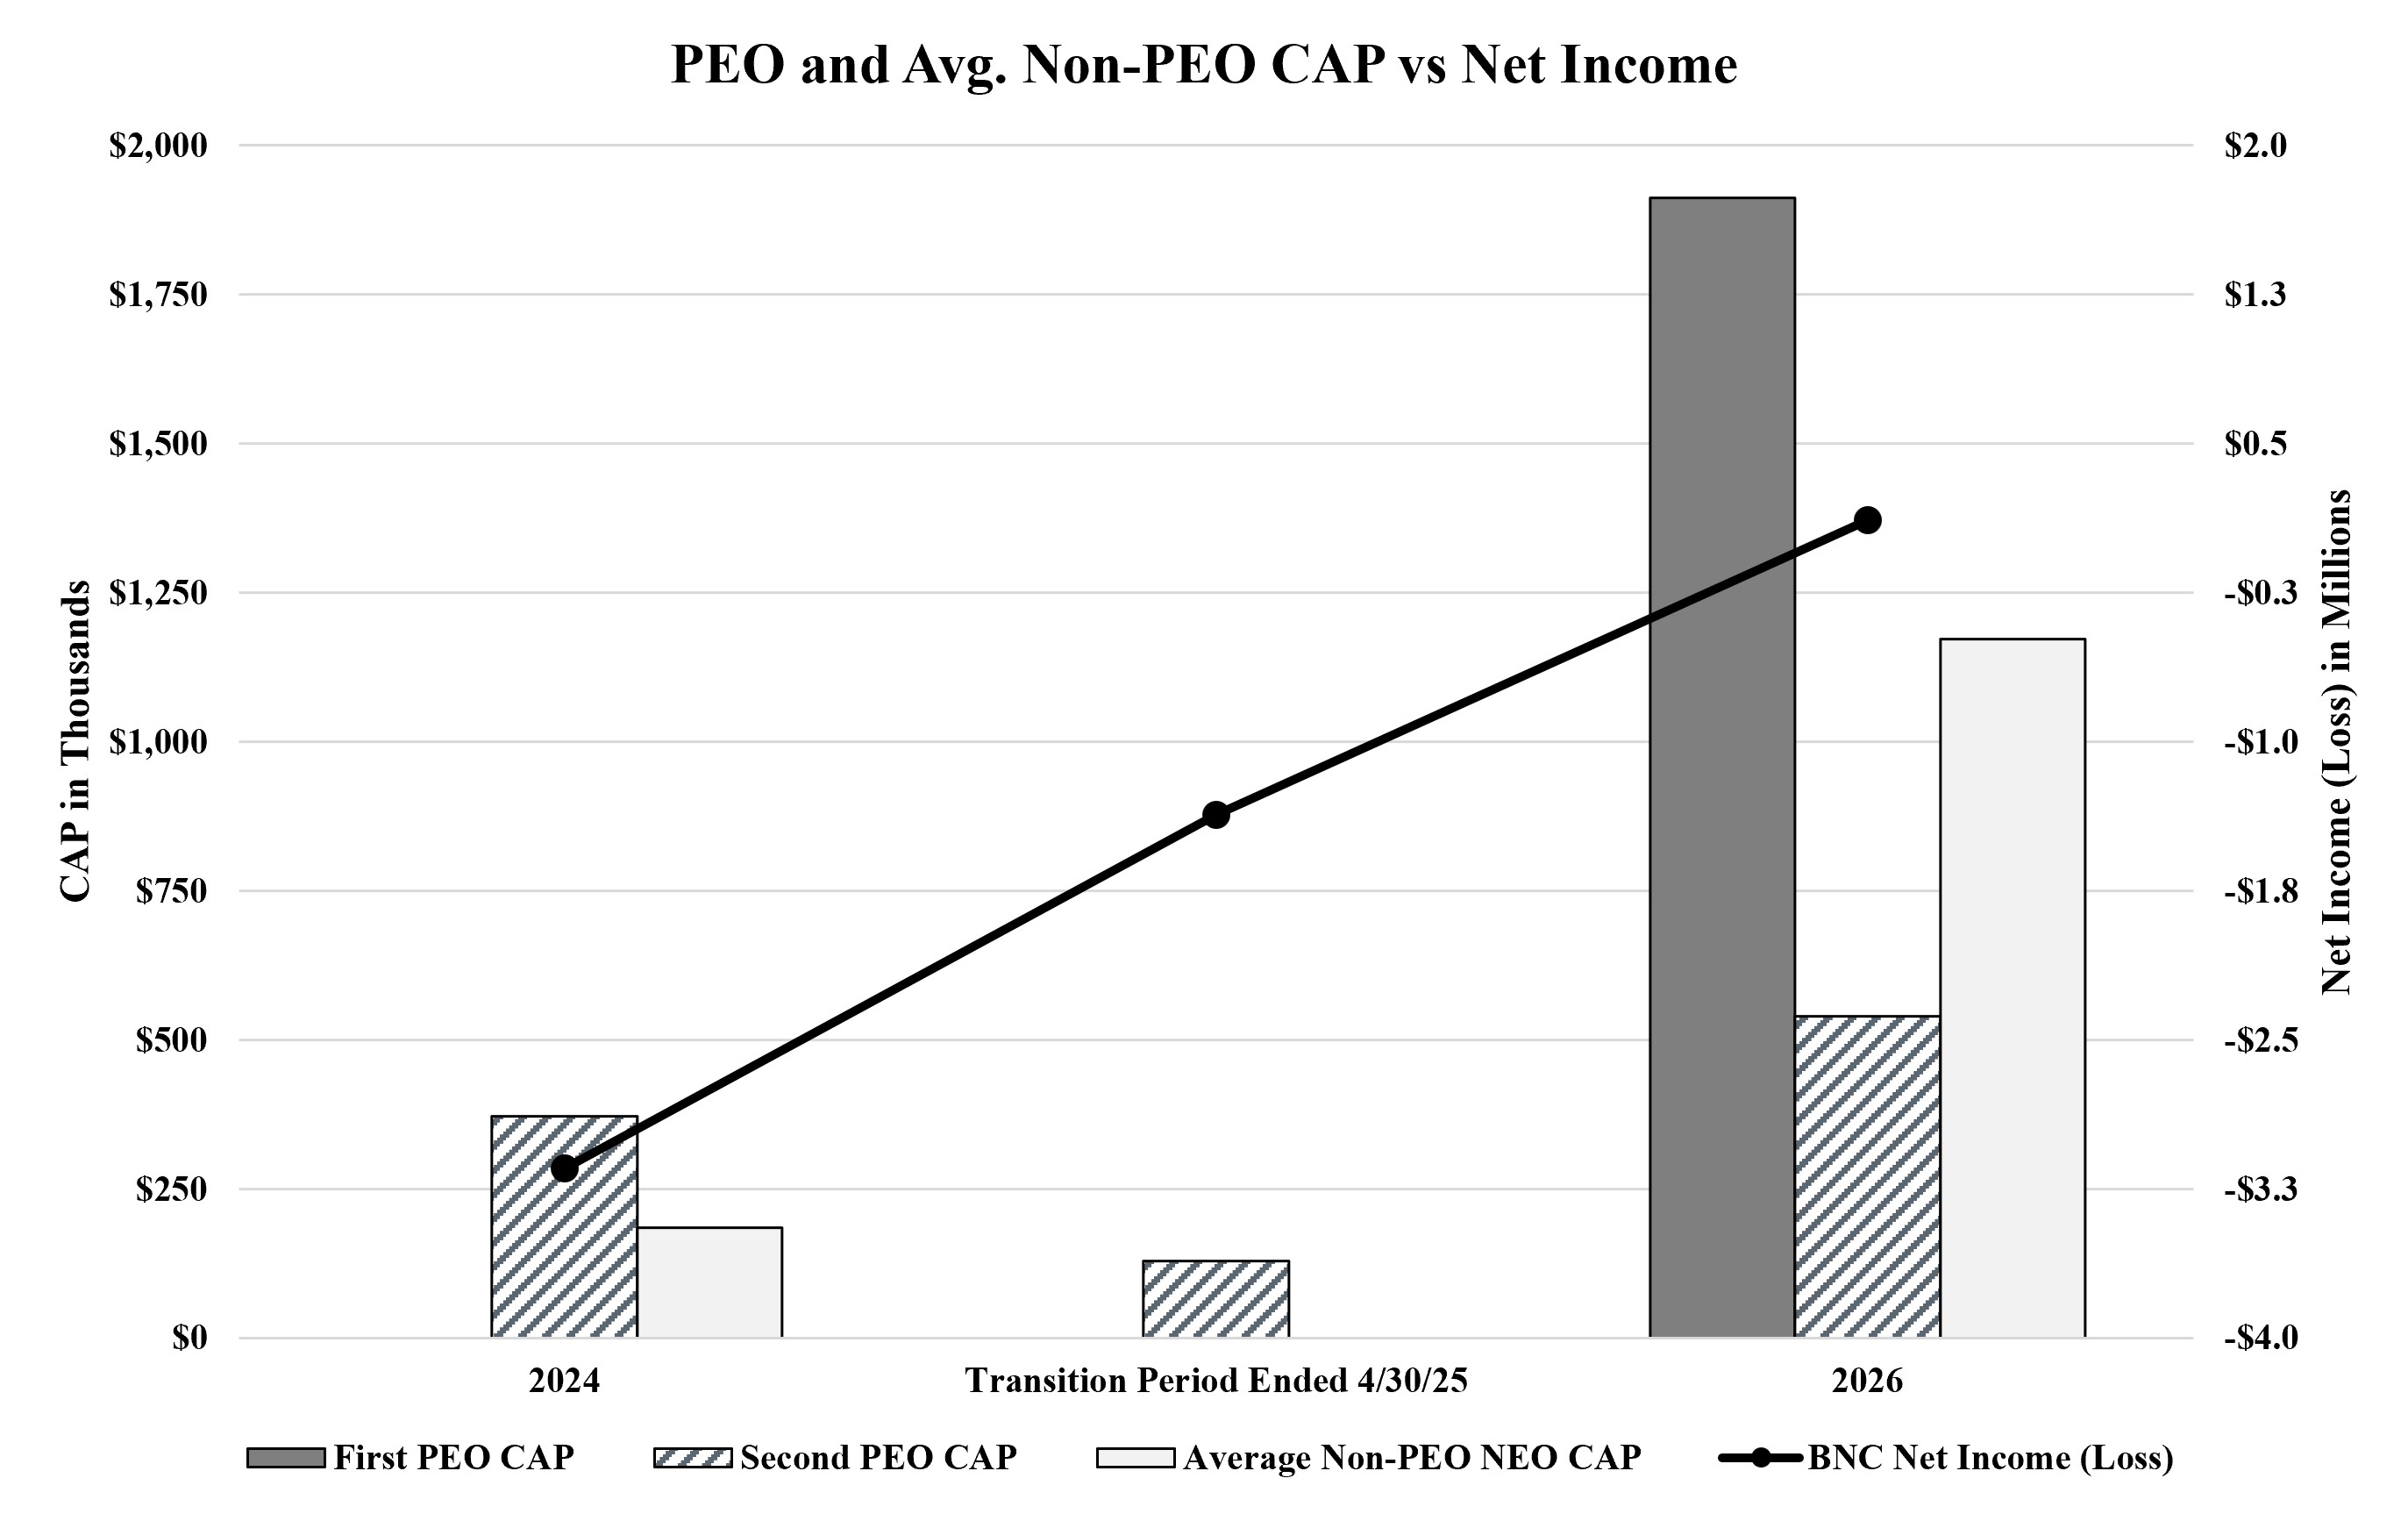
The illustrations below provide a graphical description of CAP (as calculated in accordance with the SEC rules) and the following measures: •the Company’s cumulative TSR; •the Company’s Net Income. CAP and Company Net Income
|
|
| Total Shareholder Return Amount |
|
$ 113.52
|
|
$ 47.39
|
123.73
|
| Net Income (Loss) |
|
(1,400,000)
|
|
$ 100,000
|
(3,100,000)
|
| Additional 402(v) Disclosure |
|
|
|
The first covered period (2024) reflects the fiscal year ended December 31, 2024. The second covered period (2025) reflects the four months ended April 30, 2025. The third covered period (2026) reflects the fiscal year ended April 30, 2026.Total shareholder return is calculated based on the value of an initial fixed investment of $100 on December 31, 2023, assuming reinvestment of dividends.
|
|
| David J. Namdar [Member] |
|
|
|
|
|
| Pay vs Performance Disclosure |
|
|
|
|
|
| PEO Total Compensation Amount |
|
|
|
$ 1,911,233
|
|
| PEO Actually Paid Compensation Amount |
|
|
|
1,911,233
|
|
| PEO Name |
|
|
David J. Namdar
|
|
|
| Anthony K. McDonald [Member] |
|
|
|
|
|
| Pay vs Performance Disclosure |
|
|
|
|
|
| PEO Total Compensation Amount |
|
129,202
|
|
539,000
|
371,656
|
| PEO Actually Paid Compensation Amount |
|
$ 129,202
|
|
539,000
|
$ 371,656
|
| PEO Name |
Anthony K. McDonald
|
Anthony K. McDonald
|
|
|
Anthony K. McDonald
|
| PEO | David J. Namdar [Member] | Equity Awards Adjustments |
|
|
|
|
|
| Pay vs Performance Disclosure |
|
|
|
|
|
| Adjustment to Compensation, Amount |
|
|
|
0
|
|
| PEO | David J. Namdar [Member] | Aggregate Grant Date Fair Value of Equity Award Amounts Reported in Summary Compensation Table |
|
|
|
|
|
| Pay vs Performance Disclosure |
|
|
|
|
|
| Adjustment to Compensation, Amount |
|
|
|
(558,400)
|
|
| PEO | David J. Namdar [Member] | Year-end Fair Value of Equity Awards Granted in Covered Year that are Outstanding and Unvested |
|
|
|
|
|
| Pay vs Performance Disclosure |
|
|
|
|
|
| Adjustment to Compensation, Amount |
|
|
|
558,400
|
|
| PEO | David J. Namdar [Member] | Year-over-Year Change in Fair Value of Equity Awards Granted in Prior Years That are Outstanding and Unvested |
|
|
|
|
|
| Pay vs Performance Disclosure |
|
|
|
|
|
| Adjustment to Compensation, Amount |
|
|
|
0
|
|
| PEO | David J. Namdar [Member] | Vesting Date Fair Value of Equity Awards Granted and Vested in Covered Year |
|
|
|
|
|
| Pay vs Performance Disclosure |
|
|
|
|
|
| Adjustment to Compensation, Amount |
|
|
|
0
|
|
| PEO | David J. Namdar [Member] | Change in Fair Value as of Vesting Date of Prior Year Equity Awards Vested in Covered Year |
|
|
|
|
|
| Pay vs Performance Disclosure |
|
|
|
|
|
| Adjustment to Compensation, Amount |
|
|
|
0
|
|
| PEO | David J. Namdar [Member] | Prior Year End Fair Value of Equity Awards Granted in Any Prior Year that Fail to Meet Applicable Vesting Conditions During Covered Year |
|
|
|
|
|
| Pay vs Performance Disclosure |
|
|
|
|
|
| Adjustment to Compensation, Amount |
|
|
|
0
|
|
| PEO | David J. Namdar [Member] | Dividends or Other Earnings Paid on Equity Awards not Otherwise Reflected in Total Compensation for Covered Year |
|
|
|
|
|
| Pay vs Performance Disclosure |
|
|
|
|
|
| Adjustment to Compensation, Amount |
|
|
|
0
|
|
| PEO | Anthony K. McDonald [Member] | Equity Awards Adjustments |
|
|
|
|
|
| Pay vs Performance Disclosure |
|
|
|
|
|
| Adjustment to Compensation, Amount |
|
$ 0
|
|
0
|
$ 0
|
| PEO | Anthony K. McDonald [Member] | Aggregate Grant Date Fair Value of Equity Award Amounts Reported in Summary Compensation Table |
|
|
|
|
|
| Pay vs Performance Disclosure |
|
|
|
|
|
| Adjustment to Compensation, Amount |
|
0
|
|
0
|
0
|
| PEO | Anthony K. McDonald [Member] | Year-end Fair Value of Equity Awards Granted in Covered Year that are Outstanding and Unvested |
|
|
|
|
|
| Pay vs Performance Disclosure |
|
|
|
|
|
| Adjustment to Compensation, Amount |
|
0
|
|
0
|
0
|
| PEO | Anthony K. McDonald [Member] | Year-over-Year Change in Fair Value of Equity Awards Granted in Prior Years That are Outstanding and Unvested |
|
|
|
|
|
| Pay vs Performance Disclosure |
|
|
|
|
|
| Adjustment to Compensation, Amount |
|
0
|
|
0
|
0
|
| PEO | Anthony K. McDonald [Member] | Vesting Date Fair Value of Equity Awards Granted and Vested in Covered Year |
|
|
|
|
|
| Pay vs Performance Disclosure |
|
|
|
|
|
| Adjustment to Compensation, Amount |
|
0
|
|
0
|
0
|
| PEO | Anthony K. McDonald [Member] | Change in Fair Value as of Vesting Date of Prior Year Equity Awards Vested in Covered Year |
|
|
|
|
|
| Pay vs Performance Disclosure |
|
|
|
|
|
| Adjustment to Compensation, Amount |
|
0
|
|
0
|
0
|
| PEO | Anthony K. McDonald [Member] | Prior Year End Fair Value of Equity Awards Granted in Any Prior Year that Fail to Meet Applicable Vesting Conditions During Covered Year |
|
|
|
|
|
| Pay vs Performance Disclosure |
|
|
|
|
|
| Adjustment to Compensation, Amount |
|
0
|
|
0
|
0
|
| PEO | Anthony K. McDonald [Member] | Dividends or Other Earnings Paid on Equity Awards not Otherwise Reflected in Total Compensation for Covered Year |
|
|
|
|
|
| Pay vs Performance Disclosure |
|
|
|
|
|
| Adjustment to Compensation, Amount |
|
$ 0
|
|
0
|
0
|
| Non-PEO NEO | Equity Awards Adjustments |
|
|
|
|
|
| Pay vs Performance Disclosure |
|
|
|
|
|
| Adjustment to Compensation, Amount |
|
|
|
130,909
|
(103)
|
| Non-PEO NEO | Aggregate Grant Date Fair Value of Equity Award Amounts Reported in Summary Compensation Table |
|
|
|
|
|
| Pay vs Performance Disclosure |
|
|
|
|
|
| Adjustment to Compensation, Amount |
|
|
|
(999,999)
|
0
|
| Non-PEO NEO | Year-end Fair Value of Equity Awards Granted in Covered Year that are Outstanding and Unvested |
|
|
|
|
|
| Pay vs Performance Disclosure |
|
|
|
|
|
| Adjustment to Compensation, Amount |
|
|
|
1,130,908
|
0
|
| Non-PEO NEO | Year-over-Year Change in Fair Value of Equity Awards Granted in Prior Years That are Outstanding and Unvested |
|
|
|
|
|
| Pay vs Performance Disclosure |
|
|
|
|
|
| Adjustment to Compensation, Amount |
|
|
|
0
|
0
|
| Non-PEO NEO | Vesting Date Fair Value of Equity Awards Granted and Vested in Covered Year |
|
|
|
|
|
| Pay vs Performance Disclosure |
|
|
|
|
|
| Adjustment to Compensation, Amount |
|
|
|
0
|
0
|
| Non-PEO NEO | Change in Fair Value as of Vesting Date of Prior Year Equity Awards Vested in Covered Year |
|
|
|
|
|
| Pay vs Performance Disclosure |
|
|
|
|
|
| Adjustment to Compensation, Amount |
|
|
|
0
|
0
|
| Non-PEO NEO | Prior Year End Fair Value of Equity Awards Granted in Any Prior Year that Fail to Meet Applicable Vesting Conditions During Covered Year |
|
|
|
|
|
| Pay vs Performance Disclosure |
|
|
|
|
|
| Adjustment to Compensation, Amount |
|
|
|
0
|
(3)
|
| Non-PEO NEO | Dividends or Other Earnings Paid on Equity Awards not Otherwise Reflected in Total Compensation for Covered Year |
|
|
|
|
|
| Pay vs Performance Disclosure |
|
|
|
|
|
| Adjustment to Compensation, Amount |
|
|
|
$ 0
|
$ (100)
|