Shareholder Report
Apr. 30, 2026
USD ($)
Holding
| [1] | Annualized. |
Shareholder Report |
6 Months Ended | |||||||||||||||||||||||||||||||||||||||||||||||||||||||||||||||||||||||||||||||||||||||||||||||||
|---|---|---|---|---|---|---|---|---|---|---|---|---|---|---|---|---|---|---|---|---|---|---|---|---|---|---|---|---|---|---|---|---|---|---|---|---|---|---|---|---|---|---|---|---|---|---|---|---|---|---|---|---|---|---|---|---|---|---|---|---|---|---|---|---|---|---|---|---|---|---|---|---|---|---|---|---|---|---|---|---|---|---|---|---|---|---|---|---|---|---|---|---|---|---|---|---|---|---|
|
Apr. 30, 2026
USD ($)
Holding
| ||||||||||||||||||||||||||||||||||||||||||||||||||||||||||||||||||||||||||||||||||||||||||||||||||
| Shareholder Report [Line Items] | ||||||||||||||||||||||||||||||||||||||||||||||||||||||||||||||||||||||||||||||||||||||||||||||||||
| Document Type | N-CSRS | |||||||||||||||||||||||||||||||||||||||||||||||||||||||||||||||||||||||||||||||||||||||||||||||||
| Amendment Flag | false | |||||||||||||||||||||||||||||||||||||||||||||||||||||||||||||||||||||||||||||||||||||||||||||||||
| Registrant Name | American Beacon Institutional Funds Trust | |||||||||||||||||||||||||||||||||||||||||||||||||||||||||||||||||||||||||||||||||||||||||||||||||
| Entity Central Index Key | 0001700933 | |||||||||||||||||||||||||||||||||||||||||||||||||||||||||||||||||||||||||||||||||||||||||||||||||
| Entity Investment Company Type | N-1A | |||||||||||||||||||||||||||||||||||||||||||||||||||||||||||||||||||||||||||||||||||||||||||||||||
| Document Period End Date | Apr. 30, 2026 | |||||||||||||||||||||||||||||||||||||||||||||||||||||||||||||||||||||||||||||||||||||||||||||||||
| Shareholder Report Annual or Semi-Annual | Semi-Annual Shareholder Report | |||||||||||||||||||||||||||||||||||||||||||||||||||||||||||||||||||||||||||||||||||||||||||||||||
| C000186839 | ||||||||||||||||||||||||||||||||||||||||||||||||||||||||||||||||||||||||||||||||||||||||||||||||||
| Shareholder Report [Line Items] | ||||||||||||||||||||||||||||||||||||||||||||||||||||||||||||||||||||||||||||||||||||||||||||||||||
| Fund Name | Diversified Fund | |||||||||||||||||||||||||||||||||||||||||||||||||||||||||||||||||||||||||||||||||||||||||||||||||
| Class Name | AAL | |||||||||||||||||||||||||||||||||||||||||||||||||||||||||||||||||||||||||||||||||||||||||||||||||
| Trading Symbol | ZABDFX | |||||||||||||||||||||||||||||||||||||||||||||||||||||||||||||||||||||||||||||||||||||||||||||||||
| Annual or Semi-Annual Statement [Text Block] | This semi-annual shareholder report contains important information about American Beacon Diversified Fund for the period of November 1, 2025 to April 30, 2026. | |||||||||||||||||||||||||||||||||||||||||||||||||||||||||||||||||||||||||||||||||||||||||||||||||
| Additional Information [Text Block] | You can request this information by contacting us at 800-658-5811. | |||||||||||||||||||||||||||||||||||||||||||||||||||||||||||||||||||||||||||||||||||||||||||||||||
| Additional Information Phone Number | 800-658-5811 | |||||||||||||||||||||||||||||||||||||||||||||||||||||||||||||||||||||||||||||||||||||||||||||||||
| Expenses [Text Block] | What were the Fund costs for the last six months?(based on a hypothetical $10,000 investment)
|
|||||||||||||||||||||||||||||||||||||||||||||||||||||||||||||||||||||||||||||||||||||||||||||||||
| Expenses Paid, Amount | $ 21 | |||||||||||||||||||||||||||||||||||||||||||||||||||||||||||||||||||||||||||||||||||||||||||||||||
| Expense Ratio, Percent | 0.42% | [1] | ||||||||||||||||||||||||||||||||||||||||||||||||||||||||||||||||||||||||||||||||||||||||||||||||
| AssetsNet | $ 597,129,616 | |||||||||||||||||||||||||||||||||||||||||||||||||||||||||||||||||||||||||||||||||||||||||||||||||
| Holdings Count | Holding | 535 | |||||||||||||||||||||||||||||||||||||||||||||||||||||||||||||||||||||||||||||||||||||||||||||||||
| Advisory Fees Paid, Amount | $ 975,643 | |||||||||||||||||||||||||||||||||||||||||||||||||||||||||||||||||||||||||||||||||||||||||||||||||
| InvestmentCompanyPortfolioTurnover | 45.00% | |||||||||||||||||||||||||||||||||||||||||||||||||||||||||||||||||||||||||||||||||||||||||||||||||
| Additional Fund Statistics [Text Block] | Key Fund Statistics
|
|||||||||||||||||||||||||||||||||||||||||||||||||||||||||||||||||||||||||||||||||||||||||||||||||
| Holdings [Text Block] | Top Ten Country Exposure - % Investments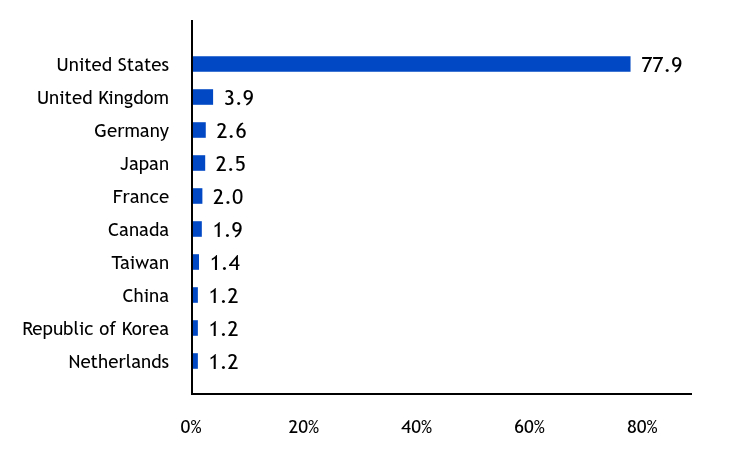
Excludes cash equivalents. Sector Allocation - % Equities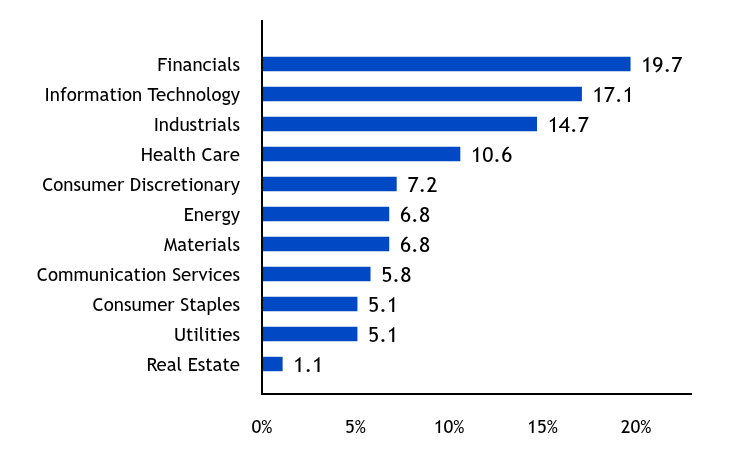
Top Ten Industry Allocations - % Fixed Income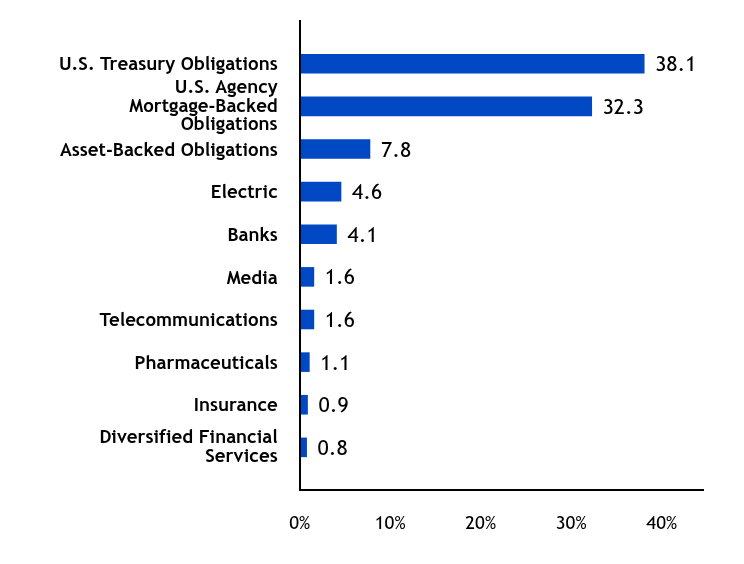
Asset Allocation - % Investments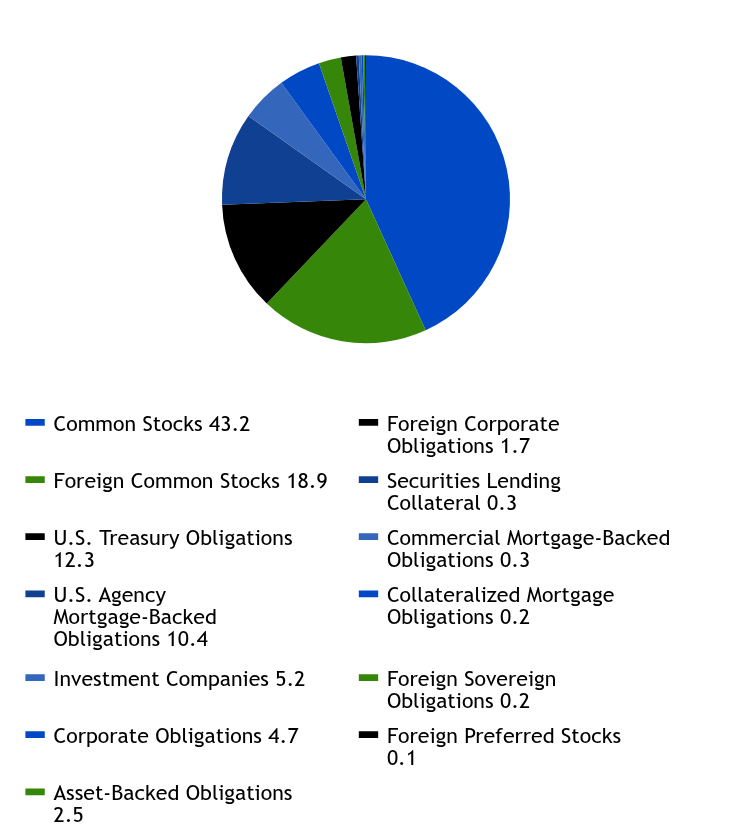
The Fund may purchase and sell futures contracts to gain market exposure on cash balances. |
|||||||||||||||||||||||||||||||||||||||||||||||||||||||||||||||||||||||||||||||||||||||||||||||||
| Largest Holdings [Text Block] | Top Ten Holdings - % Net Assets
Excludes cash equivalents. |
|||||||||||||||||||||||||||||||||||||||||||||||||||||||||||||||||||||||||||||||||||||||||||||||||
| Material Fund Change [Text Block] | ||||||||||||||||||||||||||||||||||||||||||||||||||||||||||||||||||||||||||||||||||||||||||||||||||
| Accountant Change Statement [Text Block] | ||||||||||||||||||||||||||||||||||||||||||||||||||||||||||||||||||||||||||||||||||||||||||||||||||
| ||||||||||||||||||||||||||||||||||||||||||||||||||||||||||||||||||||||||||||||||||||||||||||||||||
| X | ||||||||||
- Definition Boolean flag that is true when the XBRL content amends previously-filed or accepted submission. No definition available.
|
| X | ||||||||||
- Definition For the EDGAR submission types of Form 8-K: the date of the report, the date of the earliest event reported; for the EDGAR submission types of Form N-1A: the filing date; for all other submission types: the end of the reporting or transition period. The format of the date is YYYY-MM-DD. No definition available.
|
| X | ||||||||||
- Definition The type of document being provided (such as 10-K, 10-Q, 485BPOS, etc). The document type is limited to the same value as the supporting SEC submission type, or the word 'Other'. No definition available.
|
| X | ||||||||||
- Definition A unique 10-digit SEC-issued value to identify entities that have filed disclosures with the SEC. It is commonly abbreviated as CIK. Reference 1: http://www.xbrl.org/2003/role/presentationRef
|
| X | ||||||||||
- Definition One of: N-1A (Mutual Fund), N-1 (Open-End Separate Account with No Variable Annuities), N-2 (Closed-End Investment Company), N-3 (Separate Account Registered as Open-End Management Investment Company), N-4 (Variable Annuity UIT Separate Account), N-5 (Small Business Investment Company), N-6 (Variable Life UIT Separate Account), S-1 or S-3 (Face Amount Certificate Company), S-6 (UIT, Non-Insurance Product). Reference 1: http://www.xbrl.org/2003/role/presentationRef
|
| X | ||||||||||
- Definition The exact name of the entity filing the report as specified in its charter, which is required by forms filed with the SEC. Reference 1: http://www.xbrl.org/2003/role/presentationRef
|
| X | ||||||||||
- Definition Trading symbol of an instrument as listed on an exchange. No definition available.
|
| X | ||||||||||
- References Reference 1: http://www.xbrl.org/2003/role/presentationRef
|
| X | ||||||||||
- References Reference 1: http://www.xbrl.org/2003/role/presentationRef
|
| X | ||||||||||
- References Reference 1: http://www.xbrl.org/2003/role/presentationRef
|
| X | ||||||||||
- References Reference 1: http://www.xbrl.org/2003/role/presentationRef
|
| X | ||||||||||
- References Reference 1: http://www.xbrl.org/2003/role/presentationRef
|
| X | ||||||||||
- References Reference 1: http://www.xbrl.org/2003/role/presentationRef
|
| X | ||||||||||
- References Reference 1: http://www.xbrl.org/2003/role/presentationRef
|
| X | ||||||||||
- References Reference 1: http://www.xbrl.org/2003/role/presentationRef
|
| X | ||||||||||
- References Reference 1: http://www.xbrl.org/2003/role/presentationRef
|
| X | ||||||||||
- References Reference 1: http://www.xbrl.org/2003/role/presentationRef
|
| X | ||||||||||
- References Reference 1: http://www.xbrl.org/2003/role/presentationRef
|
| X | ||||||||||
- References Reference 1: http://www.xbrl.org/2003/role/presentationRef
|
| X | ||||||||||
- References Reference 1: http://www.xbrl.org/2003/role/presentationRef
|
| X | ||||||||||
- References Reference 1: http://www.xbrl.org/2003/role/presentationRef
|
| X | ||||||||||
- References Reference 1: http://www.xbrl.org/2003/role/presentationRef
|
| X | ||||||||||
- References Reference 1: http://www.xbrl.org/2003/role/presentationRef
|
| X | ||||||||||
- References Reference 1: http://www.xbrl.org/2003/role/presentationRef
|
| X | ||||||||||
- Definition Amount of net assets (liabilities). Reference 1: http://fasb.org/us-gaap/role/ref/legacyRef
|
| X | ||||||||||
- Definition Percentage of lesser of purchase or sale of portfolio securities to average value of portfolio securities owned. Reference 1: http://www.xbrl.org/2009/role/commonPracticeRef
|
| X | ||||||||||
- Details
|