Performance Management - Oakmark Bond Fund
|
Jun. 30, 2026 |
| Prospectus [Line Items] |
|
| Bar Chart and Performance Table [Heading] |
Performance information
|
| Performance Narrative [Text Block] |
The bar chart and performance table below can help you evaluate the potential risk and reward of investing in the Fund by showing changes in the performance of the Fund’s Institutional Class Shares from year to year. The Fund’s past performance (before and after taxes), as provided by the bar chart and performance table that follow, is not an indication of how the Fund will perform in the future. The performance table illustrates the volatility of the Fund’s historical returns over various lengths of time and shows how the Fund’s average annual returns compare with those of a broad measure of market performance. The index, which is described in “Descriptions of Indices” in the prospectus, has characteristics relevant to the Fund’s investment strategy. The Fund’s Advisor Class and Institutional Class each commenced operations on June 10, 2020, the R6 Class commenced operations on December 15, 2020 and the Investor Class commenced operations on January 28, 2022. Updated performance information is available on Oakmark.com or by calling 1-800-OAKMARK (625-6275).
|
| Performance Past Does Not Indicate Future [Text] |
The Fund’s past performance (before and after taxes), as provided by the bar chart and performance table that follow, is not an indication of how the Fund will perform in the future.
|
| Performance Information Illustrates Variability of Returns [Text] |
The bar chart and performance table below can help you evaluate the potential risk and reward of investing in the Fund by showing changes in the performance of the Fund's Institutional Class Shares from year to year. The performance table illustrates the volatility of the Fund's historical returns over various lengths of time and shows how the Fund's average annual returns compare with those of a broad measure of market performance.
|
| Bar Chart [Heading] |
INSTITUTIONAL CLASS SHARES (%) Total Returns for Years Ended December 31
|
| Bar Chart [Table] |
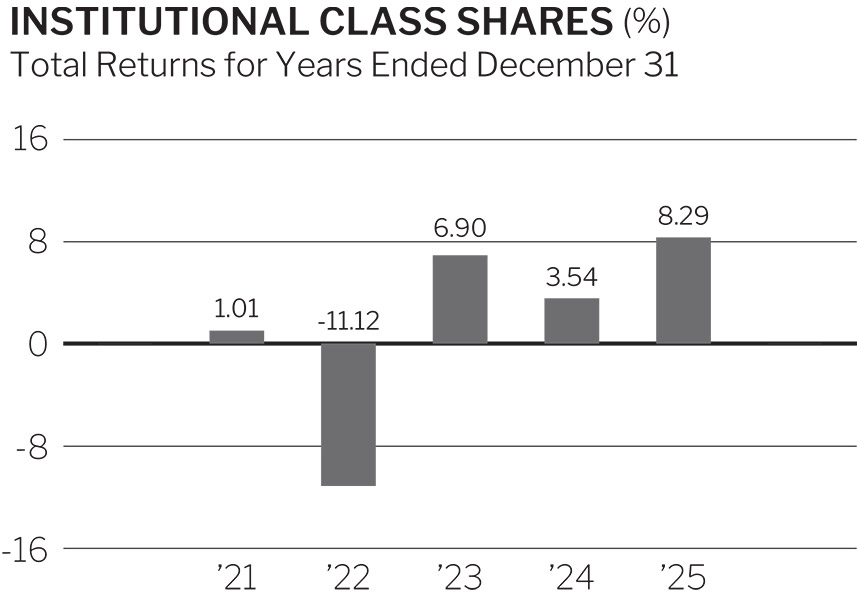
| Since 2020, the highest and lowest quarterly returns for the Fund’s Institutional Class Shares were:
Highest quarterly return: 7.1%, during the quarter ended December 31, 2023 Lowest quarterly return: -5.7%, during the quarter ended June 30, 2022 |
|
| Bar Chart Closing [Text Block] |
Since 2020, the highest and lowest quarterly returns for the Fund's Institutional Class Shares were:
• Highest quarterly return: 7.1%, during the quarter ended December 31, 2023
• Lowest quarterly return: -5.7%, during the quarter ended June 30, 2022
|
| Highest Quarterly Return, Label [Optional Text] |
Highest quarterly return:
|
| Highest Quarterly Return |
7.10%
|
| Highest Quarterly Return, Date |
Dec. 31, 2023
|
| Lowest Quarterly Return, Label [Optional Text] |
Lowest quarterly return:
|
| Lowest Quarterly Return |
(5.70%)
|
| Lowest Quarterly Return, Date |
Jun. 30, 2022
|
| Performance Table Uses Highest Federal Rate |
After-tax returns are calculated using the historical highest individual federal marginal income tax rates and do not reflect the impact of state and local taxes.
|
| Performance Table Not Relevant to Tax Deferred |
After-tax returns shown are not relevant to investors who hold their shares through tax-deferred arrangements, such as 401(k) plans, qualified plans, education savings accounts or individual retirement accounts.
|
| Performance Table Explanation after Tax Higher |
In some cases, the after-tax returns may exceed the return before taxes due to an assumed tax benefit from any losses on a sale of Fund shares at the end of the measurement period.
|
| Performance [Table] |
Bond Fund | 1 Year | 5 Years | Since
Inception |
Institutional Class* |
| Return before taxes | 8.29% | 1.48% | 2.21% |
| Return after taxes on distributions | 6.14% | -0.23% | 0.57% |
| Return after taxes on distributions
and sale of Fund shares | 4.87% | 0.38% | 0.97% |
Advisor Class* |
| Return before taxes | 8.39% | 1.47% | 2.19% |
R6 Class** |
| Return before taxes | 8.37% | 1.57% | 1.67% |
Investor Class*** |
| Return before taxes | 8.03% | None | 1.89% |
Bloomberg U.S. Aggregate Bond Index
(does not reflect the deduction of fees,
expenses or taxes)**** | 7.30% | -0.36% | 0.02% |
* Institutional Class and Advisor Class shares commenced operations on 06/10/2020.
** R6 Class shares commenced operations on 12/15/2020.
*** Investor Class shares commenced operations on 01/28/2022.
**** Bloomberg U.S. Aggregate Bond Index since inception return is calculated using 06/10/2020, which is the date the Fund commenced operations.
|
| Average Annual Return, Caption [Optional Text] |
AVERAGE ANNUAL TOTAL RETURNS FOR PERIODS ENDED DECEMBER 31, 2025
|
| Performance Table One Class of after Tax Shown [Text] |
After-tax returns are shown only for Institutional Class Shares. After-tax returns for Advisor Class Shares, and R6 Class Shares will vary from returns shown for Institutional Class Shares.
|
| Index No Deduction for Fees, Expenses, or Taxes [Text] |
(does not reflect the deduction of fees, expenses or taxes)
|
| Performance Table Closing [Text Block] |
After-tax returns are calculated using the historical highest individual federal marginal income tax rates and do not reflect the impact of state and local taxes. Actual after-tax returns depend on an investor’s tax situation and may differ from those shown. After-tax returns shown are not relevant to investors who hold their shares through tax-deferred arrangements, such as 401(k) plans, qualified plans, education savings accounts or individual retirement accounts. In some cases, the after-tax returns may exceed the return before taxes due to an assumed tax benefit from any losses on a sale of Fund shares at the end of the measurement period. After-tax returns are shown only for Institutional Class Shares. After-tax returns for Advisor Class Shares, and R6 Class Shares will vary from returns shown for Institutional Class Shares.
|
| Performance Availability Website Address [Text] |
Oakmark.com
|
| Performance Availability Phone [Text] |
1-800-OAKMARK (625-6275)
|