Exhibit 99.1


 Investor Presentation  June 2026 
 

 ‹#›  Forward Looking Statements  This presentation contains historical information and forward-looking statements within the meaning of the Securities Act of 1933, as amended, the Securities Exchange Act of 1934, as amended, and the safe- harbor provisions of the Private Securities Litigation Reform Act of 1995 with respect to the business, financial condition and results of operations of Perion. The words “will,” “believe,” “expect,” “intend,” “plan,” “should,” “estimate” and similar expressions are intended to identify forward-looking statements. Such statements reflect the current views, assumptions and expectations of Perion with respect to future events and are subject to risks and uncertainties. All statements other than statements of historical fact included in this presentation are forward-looking statements. Many factors could cause the actual results, performance or achievements of Perion to be materially different from any future results, performance or achievements that may be expressed or implied by such forward-looking statements, or financial information, including, but not limited to, political, economic and other developments (including the current war between Israel and Hamas and other armed groups in the region), the failure to realize the anticipated benefits of companies and businesses we acquired and may acquire in the future, risks entailed in integrating the companies and businesses we acquire, including employee retention and customer acceptance, the risk that such transactions will divert management and other resources from the ongoing operations of the business or otherwise disrupt the conduct of those businesses, and general risks associated with the business of Perion including, loss of, or reduction in our business with, key customers or other partners that are material to our business, the impact of the rapid development and broad adoption of generative AI on our business, the transformation in our strategy, intended to unify our business units under the Perion brand (Perion One), intense and frequent changes in the markets in which the businesses operate and in general economic and business conditions (including the fluctuation of our share price), armed conflicts with Iran and other parties, the outcome of any pending or future proceedings against Perion, data breaches, cyber-attacks and other similar incidents, unpredictable sales cycles, competitive pressures, market acceptance of new products and of the Perion One strategy, changes in applicable laws and regulations as well as industry self-regulation, negative or unexpected tax consequences, inability to meet efficiency and cost reduction objectives, changes in business strategy and various other factors, whether referenced or not referenced in this presentation. We urge you to consider those factors, together with the other risks and uncertainties described in our most recent Annual Report on Form 20-F for the year ended December 31, 2025 as filed with the Securities and Exchange Commission (SEC) on March 16, 2026, and our other reports filed with the SEC, in evaluating our forward-looking statements and other risks and uncertainties that may affect Perion and its results of operations. Perion does not assume any obligation to update these 
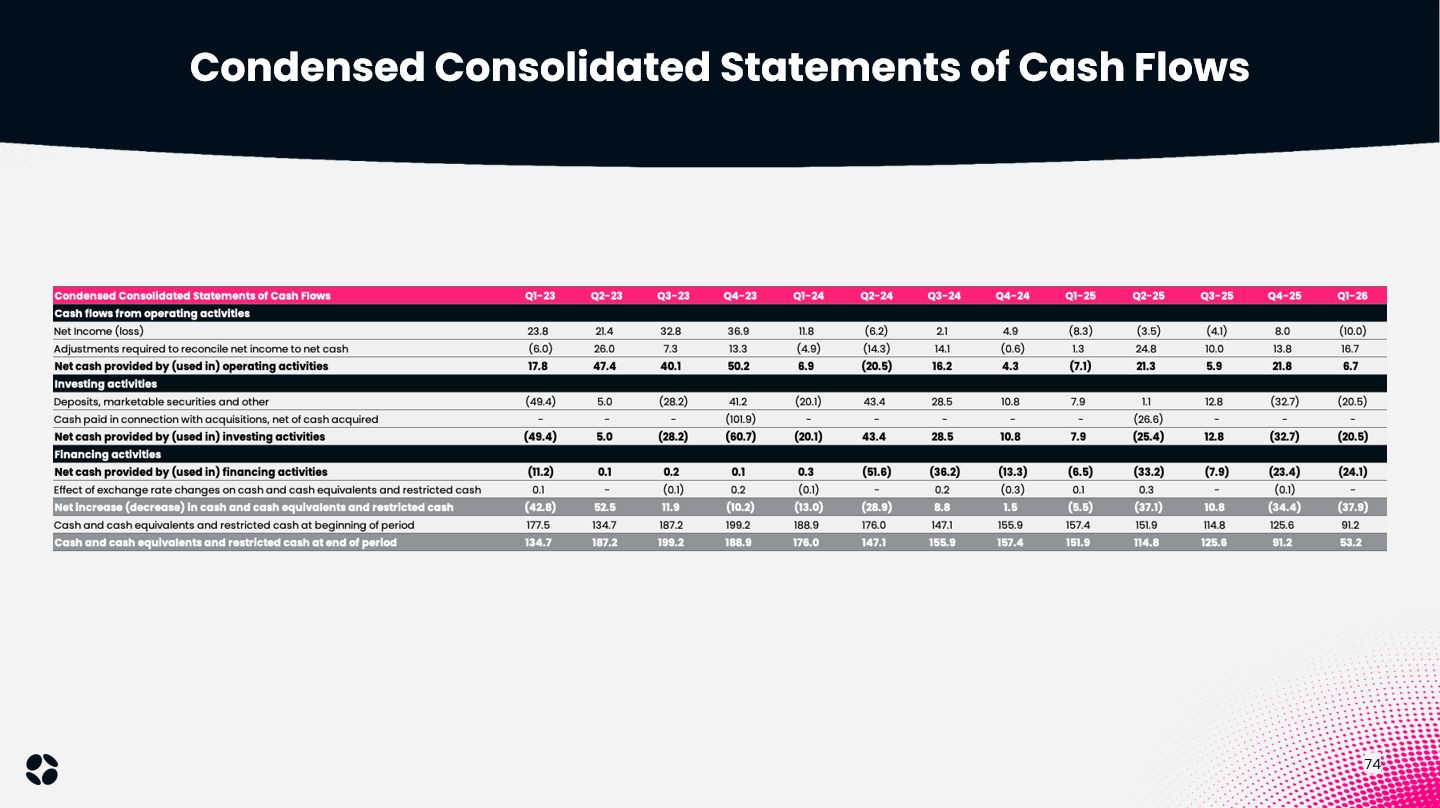
forward-looking statements. Investors should read this presentation together with our respective quarterly press release furnished to the SEC.  Non-GAAP Measures  Non-GAAP financial measures consist of GAAP financial measures 
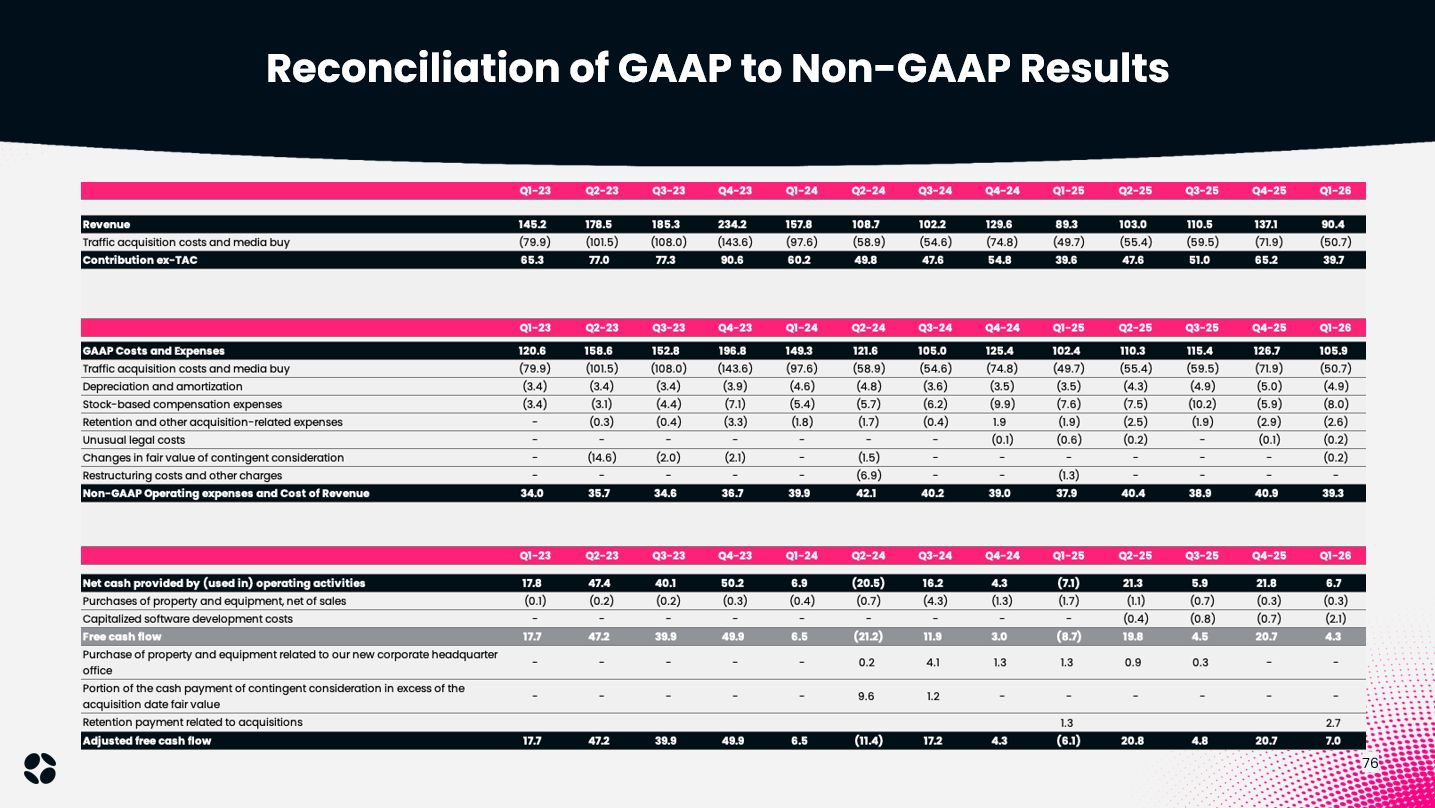
adjusted to exclude certain items. This press release includes certain non-GAAP measures, including Contribution ex-TAC, Adjusted EBITDA, Adjusted free cash flow, Non-GAAP net income and non-GAAP diluted earnings per 
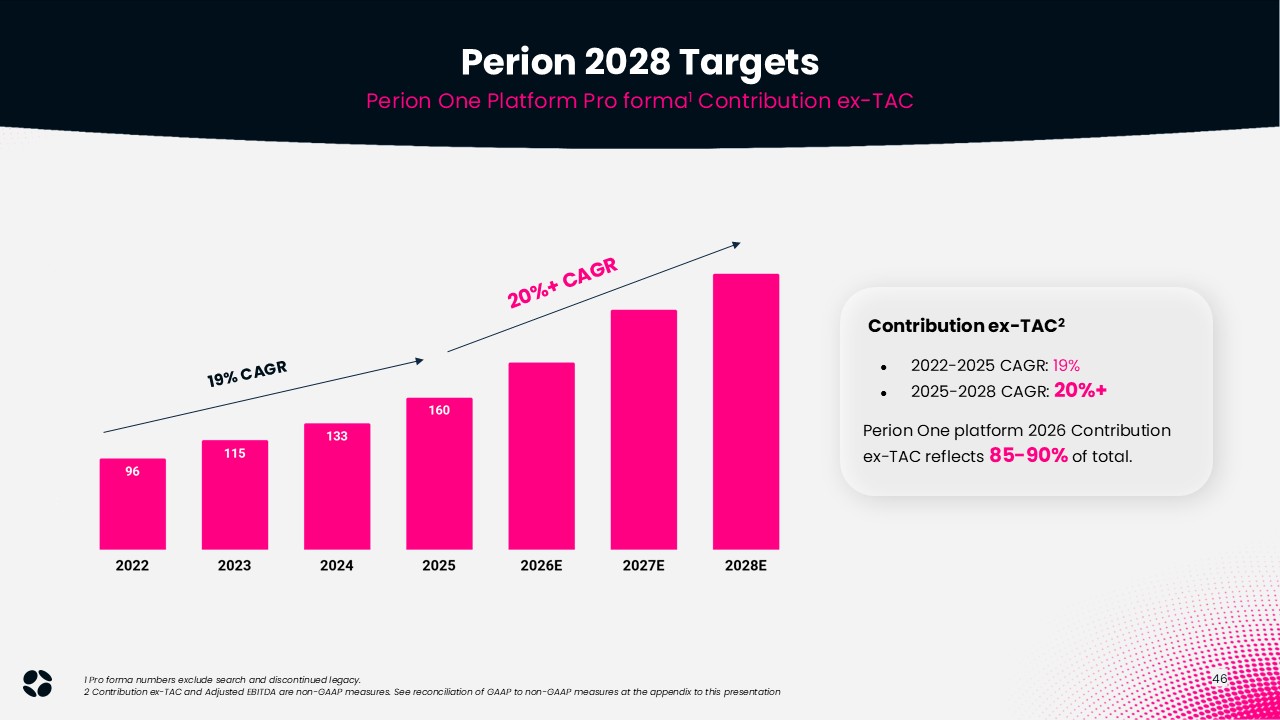
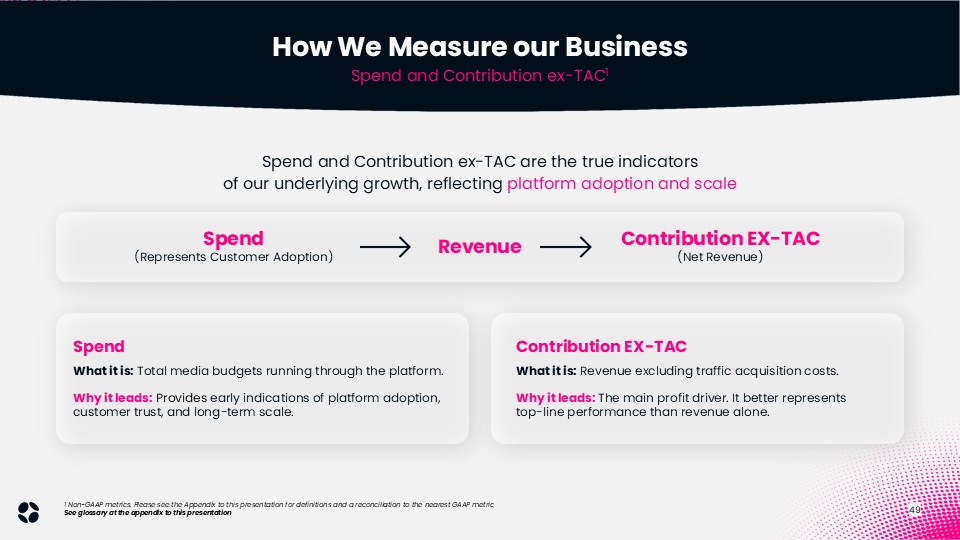
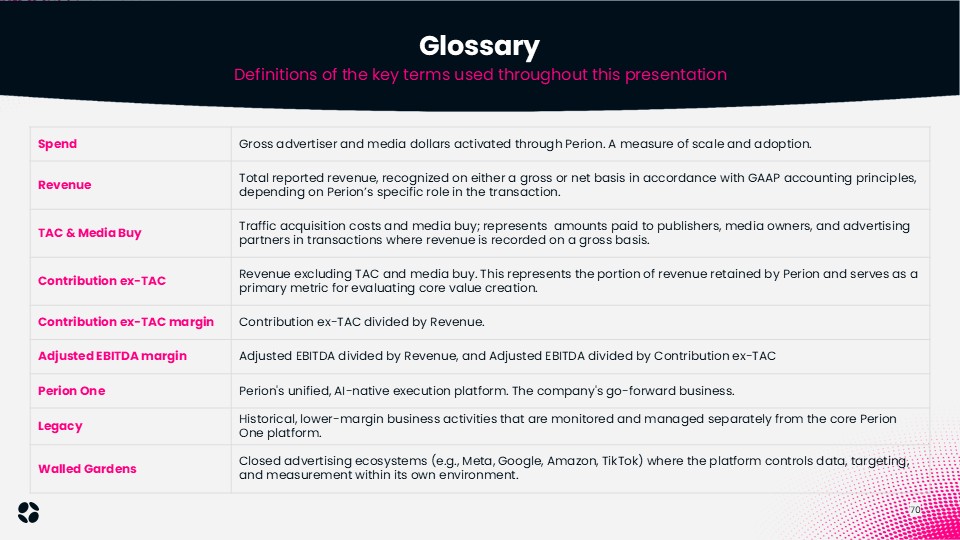
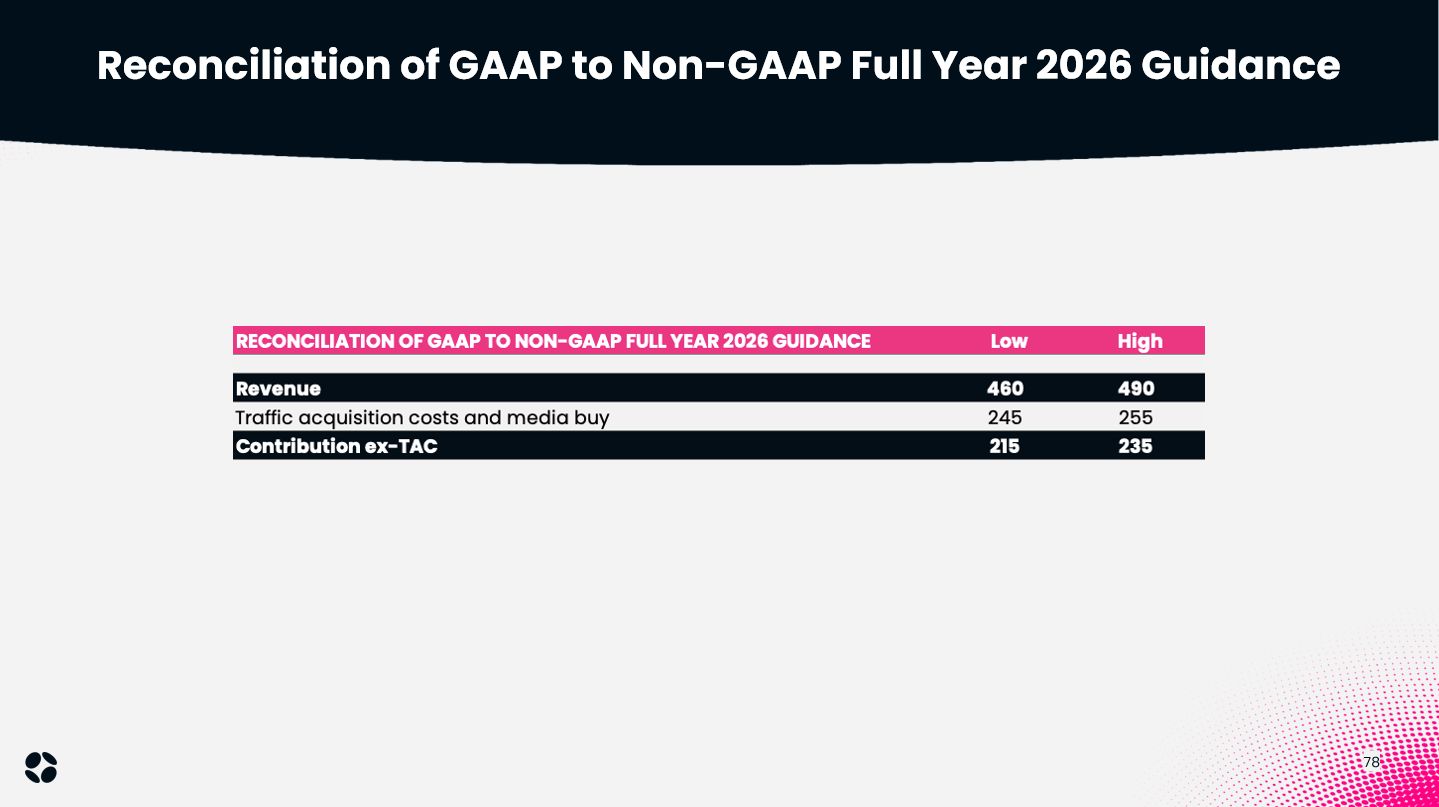
share.  Contribution ex-TAC presents revenue reduced by traffic acquisition costs and media buy, reflecting a portion of our revenue that must be directly passed to publishers or advertisers and presents our revenue excluding such items. We believe Contribution ex-TAC is a useful measure in assessing the performance of the Company because it facilitates a consistent comparison against our core business without considering the impact of traffic acquisition 
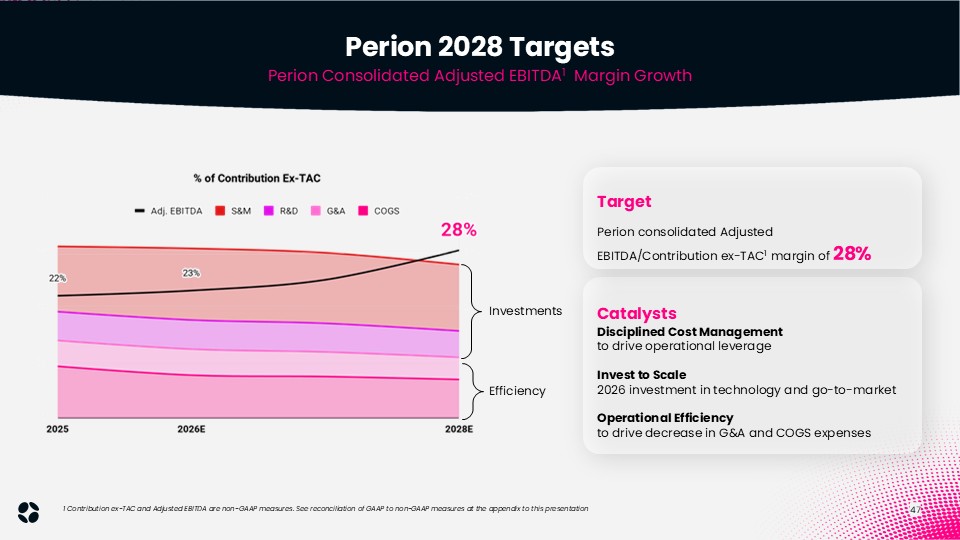
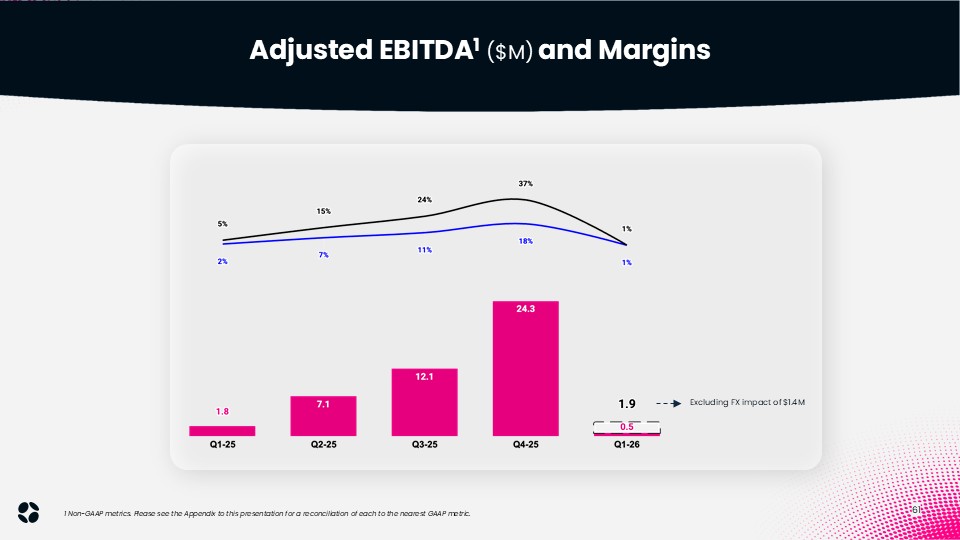
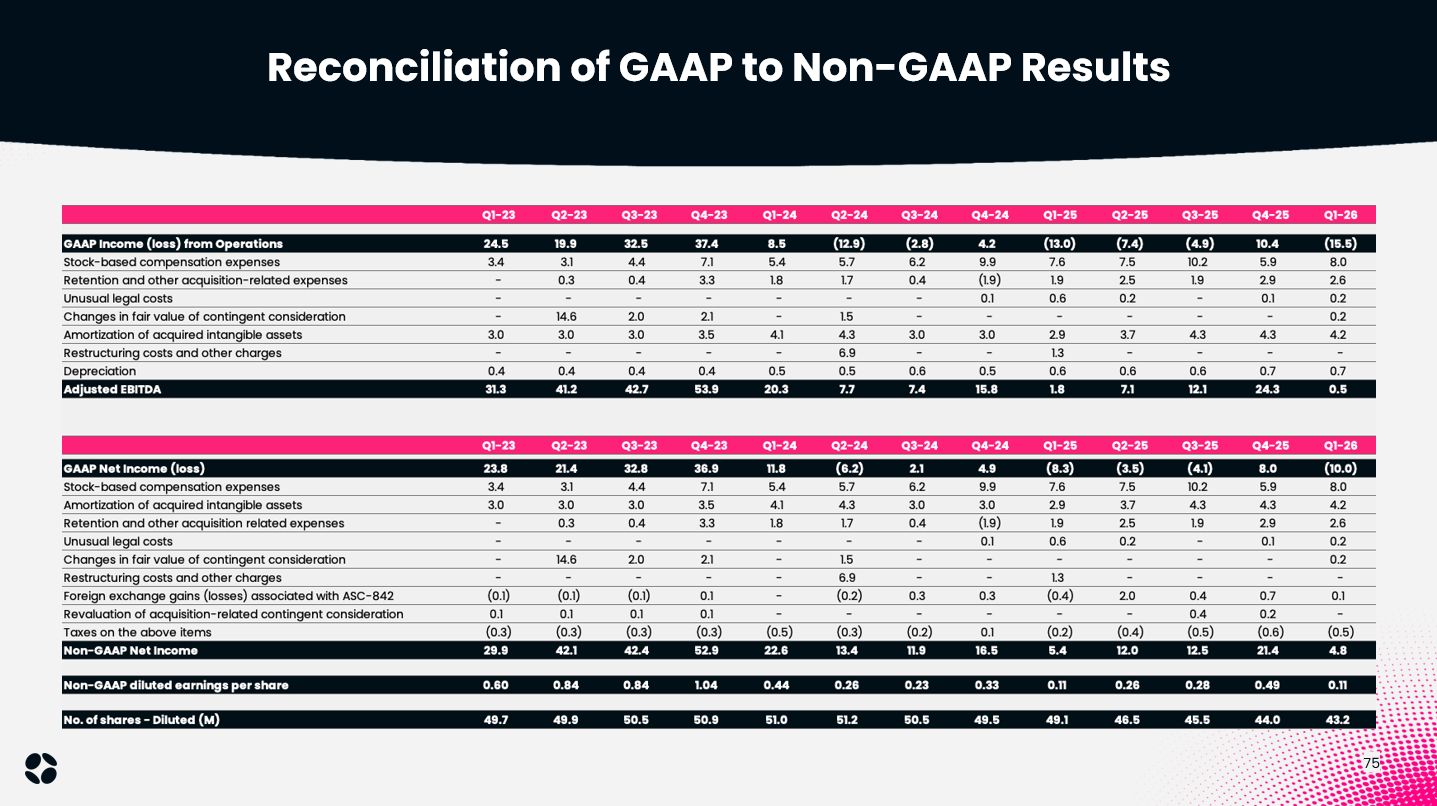
costs and media buy related to revenue reported on a gross basis.  Adjusted Earnings Before Interest, Taxes, Depreciation and Amortization (“Adjusted EBITDA”) is defined as GAAP income (loss) from operations excluding stock-based compensation expenses, retention and other acquisition-related expenses, unusual legal costs, gains and losses recognized with respect to changes in fair value of contingent consideration, amortization of acquired intangible 
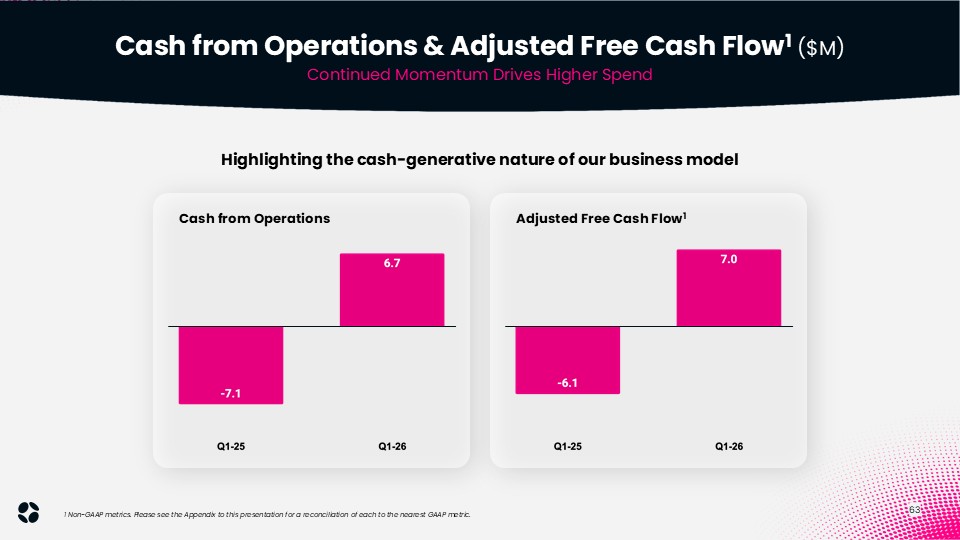
assets, restructuring costs and other charges as well as depreciation.  Adjusted free cash flow is defined as net cash provided by (or used in) operating activities less cash used for the purchase of property and equipment, net of sales and capitalized software development costs, but excluding the purchase of property and equipment related to our new corporate headquarter office, the portion of the cash payment of contingent consideration in excess of the acquisition date fair value and retention payment related to acquisitions, as we do not view either of those expenses as reflective of our normal on-going expenses. It is important to note that these expenses are in fact cash 
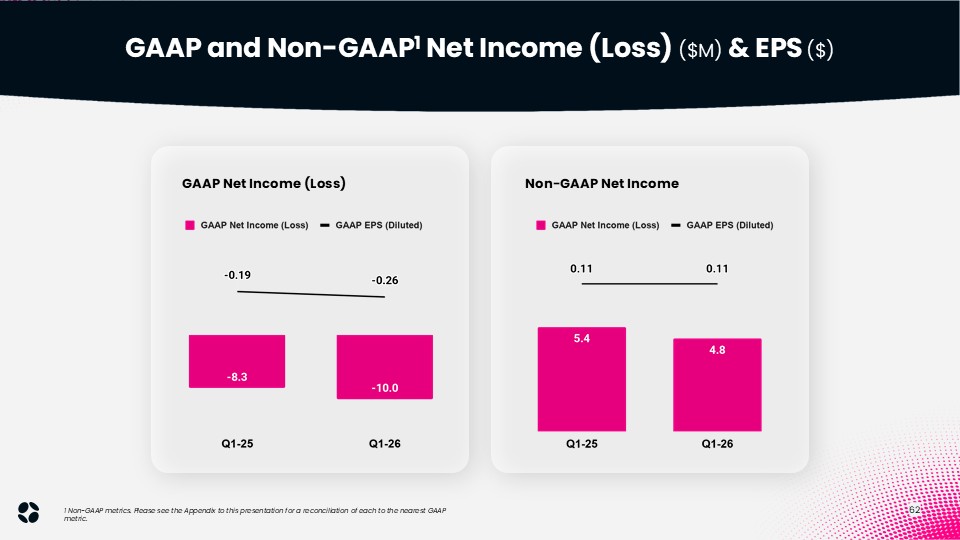
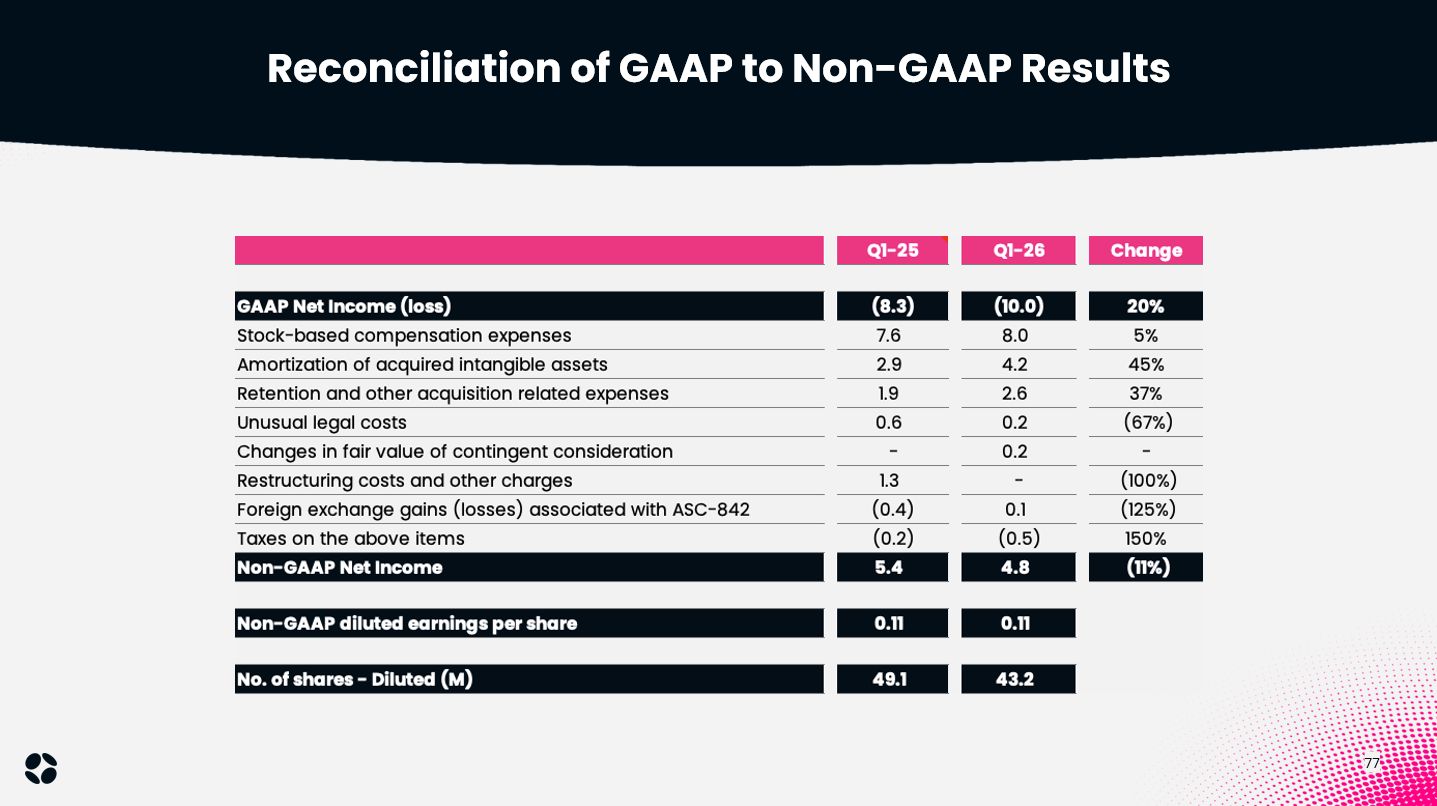
expenditures.  Non-GAAP net income and non-GAAP diluted earnings per share are defined as GAAP net income (loss) and GAAP net earnings (loss) per share excluding stock-based compensation expenses, amortization of acquired intangible assets and the related taxes thereon, retention and other acquisition-related expenses, unusual legal costs, gains and losses recognized with respect to changes in fair value of contingent consideration, restructuring costs and other charges as well as foreign exchange gains and losses associated with ASC-842  The purpose of such adjustments is to give an indication of our performance exclusive of non-cash charges and other items that are considered by management to be outside of our core operating results. These non-GAAP measures are among the primary factors management uses in planning for and forecasting future periods. Furthermore, the non-GAAP measures are regularly used internally to understand, manage and evaluate our business and make operating decisions, and we believe that they are useful to investors as a consistent and comparable measure of the ongoing performance of our business. However, our non-GAAP financial measures are not meant to be considered in isolation or as a substitute for comparable GAAP measures and should be read only in conjunction with our consolidated financial statements prepared in accordance wi th GAAP. Additionally, these non-GAAP financial measures may differ materially from the non-GAAP financial measures used by other companies. Due to the high variability and difficulty in making accurate forecasts and projections of some of the information excluded from these projected measures, together with some of the excluded information not being ascertainable or accessible, we are unable to quantify certain amounts that would be required for such presentation without unreasonable effort. Consequently, no reconciliation of the forward-looking non-GAAP financial measures is included in this presentation. A reconciliation between results on a GAAP and non-GAAP basis is provided in the appendix attached to this presentation. 

 Perion at a Glance  NASDAQ (PERI)  Perion One Pro-Forma5  $439.9MRevenue   $203.4MContribution ex-TAC1   $45.2MAdjusted EBITDA1   FY 2025   $40.2MAdjusted Free cash Flow1   2028 Growth Targets  619 Employees worldwide as of Mar. 31, 2026  40+ Operates in countries worldwide  $142M returned to Shareholders through a share repurchase program4  $293M Net cashas of Mar. 31, 2026  See glossary at the appendix to this presentation  1 Contribution ex-TAC (Revenue excluding Traffic Acquisition Costs and media buy), Adjusted Free Cash Flow and Adjusted EBITDA are non-GAAP measures. See reconciliation of GAAP to non-GAAP measures at the appendix to this presentation.  2 Implies a revenue range of $460 - 490 million.  2026 Guidance:     Contribution ex-TAC1   Adjusted EBITDA1   Adj. EBITDA/Cont. ex-TAC3   $215M - $235M2  $50M - $54M  23%  +11% YoY  +15% YoY  3 Calculated at Contribution ex-TAC and Adjusted EBITDA guidance midpoint.  4 Since initiation, as of March 31, 2026. Total authorized program of $200 million.  5 Pro forma numbers exclude search and discontinued legacy.   6 Adjusted EBITDA to Contribution ex-TAC.  25%+3-YR Spend CAGR  20%+3-YR Contribution Ex-TAC1 CAGR  28%+Adj. EBITDA Margin6(From 22% FY’25)  ‹#› 
 

 Perion is an Advanced Technology Company Redefining Digital Advertising Through AI-Native Execution Infrastructure   ‹#› 
 

 Solving The $1T Advertising Challenge  Marketers are navigatinga fragmented universe of screens, creative formats, and placements, trying to connect the dots and drive business results.  Advertiser  Google  Spotify  DOOH  Pinterest  TikTok  CTV  Apple  Reddit  Amazon  Netflix  Open Web  Bing  YouTube  Meta  ‹#› 
 

 Perion OneOur unified multi-channel platform that plans, activates, optimizes, and measures advertising across CTV, DOOH, Retail Media, Social, and the Open Web.  Outmax The proprietary AI agent at the core of Perion One, continuously optimizing advertiser outcomes across channels and walled gardens in real time.  CTV - Connected TV  DOOH - Digital out of Home  See glossary at the appendix to this presentation  ‹#› 
 

 Serving 52 out of the Fortune 100 CompaniesAcross Key Industry Verticals  17 of the 19 largest Consumer & Retail companies  4 of the 4 largest Telecommunications companies  2 of the 3 largest Airline companies  6 of the 16 largest Insurance companies  5 of the 6 largest Pharmaceutical companies  4 of the 11 largest Financial companies  1 of the 3 largest Automotive companies  6 of the 10 largest Technology & Media companies  ‹#› 
 

 From Vision to Execution: What We Built in Year One  AI-Driven ExecutionIntroduced Outmax, our AI-agent, available on Tiktok, Youtube, Meta and more. AI is integrated in our internal processes & customer solutions.   Growth Engines AcceleratedHigh double-digit growth across CTV, DOOH, and Retail - outpacing the market by more than 2x.  Operational ReadinessRestructured the organization for faster execution and cost optimization.  Clear StrategyPerion One Platform established as an AI execution platform for marketers.  Financial MomentumOutmax spend scaling rapidly, growth engines continue to accelerate, Perion One spend growing YoY, Positive cash flow and adjusted free cash flow.  Ecosystem partnershipsRetail media, data integrations, and international partnerships, to accelerate adoption, reach, and channel coverage.  Capital Return$200M Share Repurchase plan authorized; $142.2M executed.   Successful M&AHighly successful acquisition and integration of Hivestack and Greenbids.  ‹#› 
 

 ‹#› 
 

 The Performance OS for Modern Marketers  AI execution layer   Multiple Open Web DSPs  CTV - Display - Web  Multiple Open Web SSPs  CTV - Display - Web  DOOH DSP / SSP  pDOOH - Perion-owned  Perion-Owned  Open ecosystem - unlimited connections  Outmax AI Agent  One  DSP  TikTok  DSP  Meta  Multiple Audience Data and Measurement integrations including Perion owned SORT  DSP  YouTube  Advertiser  DSP - Demand Side Platform  SSP - Supply Side Platform   pDOOH - Programmatic Digital out of Home  See glossary at the appendix to this presentation  ‹#› 
 

 Perion One  Our intelligent AI infrastructure powers advertiser execution and outcomes, continuously optimizing in real time.  Unified Campaign Orchestration  Intelligent Insights In Real-Time  Creative Discovery & Innovation  Results That Matter  ‹#› 
 

 Perion Outmax  The intelligent AI agentinside Perion One that optimizes outcomesacross channels and walled gardens.  Every Channel  One Agent  ‹#› 
 

 From Impression to Outcome: AI Optimizing in Real Time  Subset  Device  Time of Day  Channels  The algorithm continuously identifies and prioritizes top-performing audience and inventory subsets in real time.  It dynamically learns from a range of signals — including device, time of day, context, and format — while factoring in brand safety, attention metrics, and carbon intensity.  Each unique combination generates its own performance data, as inventory and audience segments become increasingly granular.  Powered by insights from IAS, DV, Lumen and others, the AI intelligently selects the most effective subsets to drive campaign performance.  Inside Outmax  ‹#› 


 Agentic Self Served App  Ask  ‹#› 
 Agentic Self Served App  Ask  14 

 With Flexible Activations & Integrations with Leading Partners  DSPs  DMPs  MEASUREMENT  Proprietary Tech & AI   Ad Builder  SORT® Audience Targeting  Publisher Platform  Dynamic Creative  Ad Server  SSPs  DMP - Data Measurement Platform  See glossary at the appendix to this presentation  ‹#› 
 

 CTV/Video  Web  DOOH  1 A selection of inventory across Perion’s supply partners  Audio  Perion’s Supply Path partners:   Ensuring Brands Appear In The Right Context1  ‹#› 
 

 ‹#›  ◉ Awareness   ◉ Consideration   ◉ Sales  Relaxes & watches last night's Real Housewives episode on CTV  Browses favorite entertainment / fashion sites for in-style winter shoes  Heads to site to finalize cart before deals run out  Checks upcoming week’s weather on her phone  Puts on streaming radio to get ready for the day  Drives to Work  Opens work emails & opens an article sent to her  Puts on a Podcast   Researches healthy dinner meals   Rebecca’s   Journey  Every Touchpoint. One Execution Layer  ‹#› 
 

 Turning Personalized Stories into Cross-Channel  Impact  A weather-alignedreminder during a snowy morning commute.  A family-friendly commercial while she’s winding down at the endof the day.  The location-driven pushshe needs while she’s outon the town. 
 

 Personalized Experiences For Every Brand & Consumer Moment  Weather triggered promotions  Weather aligned CTAs  Actionable ordering from all screens  Daytime aligned messaging  Local Offers &   Nearby Locations  Weather Aligned Messaging & CTAs  Weather Triggered Product Promotion  Daytime & Location Messaging  ‹#› 
 

 Display  Adhesion   (Expandable Or   Non-Expandable)  Interstitial  Inline  Social Display  Enhanced &  Performance Standard  Full spectrum of high-impact, adaptable formats - engineered to balance performance, scale, and creative innovation.     ‹#› 
 

 Commercial Break   Stay Live  Pause Screen  Own every CTV watching moment.  CTV  Video  ‹#› 
 

 Drives scale and engagement with hyper-targeted, animated storytelling experiences.  ‹#› 
 

 DOOH  Impactful experiences that reach your audience while they’re on the go.  ‹#› 
 

 Organic Growth  Land & Expand model  ‹#› 
 

 2023  2024  2025  $40M  $0  $30M  $20M  $10M  YouTube$50K  YouTube  $4.5M  YouTube+ Meta  $20M  Performance drives trust, trust drives scale. From a $50K YouTube test to $20M cross-channel in under 3 years, earned through measurable results at every stage.  Organic budget growth. Expansion driven by AI-delivered outcomes exceeding benchmarks, not sales pressure.  Repeatable pattern. Test → prove → expand is how Perion One grows wallet share across the enterprise base.  Outmax Land and Expand - Spend, Geos & Channels  $50K to $20M spend in 24 months  ‹#› 
 

 DOOH Fullstack Land and Expand   200 Euro → 506k Euro Spend a month in 90 days  May 2025  Jun 2025  Jul 2025  Aug 2025  Sep 2025  Oct 2025  Nov 2025  Dec 2025  0  100k  200k  300k  400k  500k  600k  Spend  Implementation of DOOH Player  Dec 2025  Spend:  EUR€ 506,078  Platform adoption accelerates revenue.€200 to €500K+/month in 90 days after integrating Perion's DOOH Player as the publisher's operating system.  Repeatable across formats. Not an isolated win — the same Perion One execution model works across digital and physical environments.  Bilateral stickiness. The platform that scales advertiser spend also scales publisher monetization, building network effects on both sides.  ‹#› 
 

 Organic Growth  Partnerships  ‹#› 
 

 Amazon DSP  New Partnership  This partnership brings together Perion's unique creative capabilities and premium inventory with Amazon's exclusive audience data.  New Premium Demand Channel: Commerce brands using Amazon as their DSP can now access Perion's solutions  Clear differentiation: Pairs Perion’s AI-driven creative and premium inventory with Amazon’s unique audiences and measurement   Growth signal: Strengthens Perion’s platform reach and long-term programmatic revenue potential   +  ‹#› 
 

 Walmart Connect  New Partnership  Combining Walmart Connect’s powerful omnichannel media solutions with Perion’s AI-driven creative and performance capabilities empowers advertisers to:  Help reach shoppers more effectivelythrough omnichannel touchpoints  Connect media exposure to actual saleswith closed-loop measurement  Better personalize campaigns at scalethrough advanced optimization  +  ‹#› 
 

 Mastercard  New Partnership  Mastercard Services data is now integrated into the Perion platform across Europe and the U.S  Advertisers can now activate aggregated purchase insights based on real consumer spend data directly within the platform  Makes it easier than ever to reach high-intent audiences across key industries and drive measurable impact  Transaction data is aggregated & anonymized - no PII, with independent third-party anonymization  +  +  ‹#› 
 

 BestBuy Canada  New Partnership  Best Buy Canada has selected Perion as its end-to-end technology partner to power and monetize its programmatic in-store digital signage network, creating one of the largest SSP-enabled DOOH media networks in the Canadian market.  Extends Perion's retail media footprint by transitioning Best Buy Canada's in-store screens to a programmatic-first model  Deploys Perion's complete Ad Server, SSP, and Header Bidding suite, deepening platform integration and share of wallet  Establishes a repeatable playbook for modernizing retail media networks globally, building more predictable, infrastructure-level revenue streams  +  ‹#› 
 

 Albertsons Media Collective  Exclusive Partnership  +  Expanding into a $60B Retail Media Market Growing at ~15% CAGR1  Partnership with one of the largest grocery retailers in the U.S.  Integrates Albertsons’ first-party data with Perion’s proprietary media technology  Enables measurable, commerce-connected campaigns aligned with market demand for ROI accountability  Positions Perion to capture share in one of the fastest-growing ad categories globally  1Source: eMarketer, Retail Media U.S. Ad Spending, 2024–2029  Primo Case Study: 5.5% Sales Lift   Click Here to Watch the Video  ‹#› 
 

 McSorely Media & Mediamark   Exclusive Partnership  +  Exclusive AI Advertising Partnership Across Africa to drive growth.  New high-growth market: Outmax now available across Africa through exclusive partnership with McSorely Media and Mediamark, addressing a programmatic market forecast to reach $6.5B by 2029 (15.3% CAGR)  Clear differentiation: Pairs Perion's Outmax real-time AI optimization and programmatic DOOH with McSorely and Mediamark's unmatched agency footprint across the continent, a capability not currently available in the region  Growth signal: Creates a new recurring revenue channel and expands Perion’s commercial footprint  ‹#› 
 

 Case Studies  ‹#› 
 

 AI Optimizations Drove Efficiencies in CPA Week over Week  9/25-10/1  10/2-10/8  10/9-10/15  10/16-10/22  $4.61  $1.94  $1.09  $0.53  Case Study  Outmax CTV  CPA in 4 weeks  (Cost per Acquisition)  89% ↓   Site visitation Rate  1.8% ↑  
 

 Case Study  Outmax  FTTH Acquisition Cost Reduction  -34%  Campaign Carbon Intensity  -51%  Bouygues Telecom Improved Acquisition Efficiency and Reduced Carbon Intensity with Perion Outmax  Bouygues Telecom partnered with Perion to optimize Meta campaigns using the Outmax AI agent, improving acquisition efficiency while reducing campaign carbon intensity through real-time optimization.  ‹#› 
 

 Lift in Brand  Ad Recall  4.1%  Lift in Brand Awareness  20.7%  Skippable View Rate  (80% higher than benchmark)  +80%  Case Study  Outmax  C4 Energy Elevates YouTube Performance with Perion's Outmax  High-impact YouTube creative, combined with Outmax's real-time optimization, helped C4 Energy strengthen brand awareness, ad recall, and view performance across premium YouTube inventory.  ‹#› 


 Case Study  Outmax  Completion Rate  (vs. 90% benchmark)  96%  Viewability  97%  Wepner’s Campaign Powered by Perion’s Outmax Improves Media Efficiency While Reducing Environmental Impact  Leveraging Perion Outmax, Wepner delivered standout performance across YouTube and Meta, driving both awareness and traffic at scale while improving media efficiency and sustainability.  CTR  0.94%  Engagement Rate  +7.65%  -27%Reduction in Carbon Intensity  CTR - Click-Through Rate  See glossary at the appendix to this presentation  38 


 Case Study  Outmax  Completion Rate  (vs. 90% benchmark)  96%  Viewability  97%  C4 Energy Elevates YouTube Performance with Perion's Outmax  Leveraging Perion Outmax, Wepner delivered standout performance across YouTube and Meta, driving both awareness and traffic at scale while improving media efficiency and sustainability.  CTR  0.94%  Engagement Rate  +7.65%  -27%Reduction in Carbon Intensity  CTR - Click-Through Rate  See glossary at the appendix to this presentation  ‹#› 
 Case Study  DOOH  Uber's Real-Time DOOH Campaign Drives Safety Feature Adoption Through Cultural Relevance  Partnering with OMD, Uber leveraged Perion's programmatic DOOH capabilities during Mexico City's iconic Catrinas Parade to connect its PIN Code safety feature to a culturally relevant moment. By combining real-time DOOH activation with broader media amplification, the campaign increased awareness, consideration, and adoption of one of Uber's most important rider safety features.  Increase in PIN code usage  +9%  Impressions  +162%  Ad recall  +4.5pp  ‹#› 
 

 Case Study  Outmax  Viewability improvements  +12 points  Reduction  in CPM  22%  Ford’s Outmax-Powered Campaign Improved Media Performance While Reducing Environmental Impact  Leveraging Perion Outmax, Ford delivered stronger YouTube performance while reducing the carbon footprint of its media investment. Through AI-powered carbon-aware bidding, the campaign improved visibility and cost efficiency.  -33%Reduction in Carbon Intensity  CPM - Cost Per Mille  See glossary at the appendix to this presentation  ‹#› 
 

 Case Study  DOOH  How Vaseline turned live UV data into real-time skin protection messaging leveraging programmatic DOOH  Live UV-index data integrated directly into DOOH creative, dynamically updating throughout the day to signal real-time exposure risk:  A clear color-coded system displayed:  Green for low exposure  Orange for moderate exposure  Red for high exposure  MILD  MODERATE  HIGH  ‹#› 
 

 A Trusted Partner of   The Most Recognized   Brands & Agencies   ‹#› 
 

 2025  Building the   Perion One Platform   Launched Perion One strategy, unifying all technologiesand brands under a singleplatform vision.  Executed leadership reorganization to align with platform strategy and operational excellence.  Acquired AI-first company - Greenbids, to automate optimization & improvewalled garden performance.  Began sales & go-to-market transformation, focusing on vertical solutions & enterprise client growth.  2026 - 2028  Scaling Platform, Intelligence & technology  Perion One orchestrates planning, activation, & measurement across allmajor digital channels.  Transition to platform-led company, increasing shareof recurring, high-margin revenue streams.  Expanded AI-agent capabilities, self-service tools, & creative automation to improve speed and efficiency.  Deepen global adoption across brands, agencies and retailers, unlocking long-term growthand margin leverage.  2024  Resetting the Businessfor Platform-Led Growth  Acquired Hivestack to enter the fast-growing DOOH market & establish its platform as the backbone of Perion One.  Launched full-scale planning & integration efforts across business lines.  Appointed key global executives to lead platform strategy.  Our Path Forward  Executing Our Transformation Plan  ‹#› 
 

 25%+ Perion One pro forma1 spend 3-Y CAGR  1 Pro forma numbers exclude Search and discontinued legacy.  2 Contribution ex-TAC and Adjusted EBITDA are non-GAAP measures. See reconciliation of GAAP to non-GAAP measures at the appendix to this presentation.   2028 targets first introduced Q4 2025; reaffirmed Q1 2026.  2028 Targets  Perion 2028: Scaling Perion Onewith Profitable Growth  AI   AI-driven operating leverage: Automation across delivery & optimization.  Capital  Disciplined capital deployment: Focused GTM & investment in innovation.  Performance  Shift to performance advertising to capture larger budgets.  Land & ExpandIncrease customer stickiness with cross-channel AI-Driven solutions for CTV, DOOH, YouTube, Meta & Web.  20%+ Perion One pro forma1Contribution ex-TAC2 3-Y CAGR  28% Perion Adj. EBITDA2 toContribution ex-TAC2  Plan Catalysts  ‹#› 
 

 Perion 2028 Targets  Perion One Platform Pro forma2 Spend Surge  Perion One Platform Spend Surges  Search & Legacy1 expected to remain stable  Perion One Spend  2022-2025 CAGR: 34%  2025-2028 CAGR: 25%+  $1.2B  $0.2B  $0.6B  1 Includes Search and discontinued low-margin historical activities  2 Pro forma numbers exclude search and discontinued legacy.   See Perion One and spend definitions in Appendix  ‹#› 
 

 Perion 2028 Targets  Perion One Platform Pro forma1 Contribution ex-TAC  Contribution ex-TAC2   2022-2025 CAGR: 19%  2025-2028 CAGR: 20%+  Perion One platform 2026 Contribution ex-TAC reflects 85-90% of total.  20%+ CAGR  19% CAGR  1 Pro forma numbers exclude search and discontinued legacy.   2 Contribution ex-TAC and Adjusted EBITDA are non-GAAP measures. See reconciliation of GAAP to non-GAAP measures at the appendix to this presentation  46
 

 Disciplined Cost Management to drive operational leverage  Invest to Scale  2026 investment in technology and go-to-market  Operational Efficiency   to drive decrease in G&A and COGS expenses  Investments  Efficiency  Catalysts  Target  Perion consolidated Adjusted EBITDA/Contribution ex-TAC1 margin of 28%  Perion 2028 Targets  Perion Consolidated Adjusted EBITDA1 Margin Growth  1 Contribution ex-TAC and Adjusted EBITDA are non-GAAP measures. See reconciliation of GAAP to non-GAAP measures at the appendix to this presentation  ‹#› 
 

 Financial KPIs   Q1 2026  ‹#› 
 

 Spend and Contribution ex-TAC are the true indicators of our underlying growth, reflecting platform adoption and scale  Spend  (Represents Customer Adoption)  Revenue  Contribution EX-TAC  (Net Revenue)  Spend  What it is: Total media budgets running through the platform.  Why it leads: Provides early indications of platform adoption, customer trust, and long-term scale.  Contribution EX-TAC  What it is: Revenue excluding traffic acquisition costs.  Why it leads: The main profit driver. It better represents top-line performance than revenue alone.  1 Non-GAAP metrics. Please see the Appendix to this presentation for definitions and a reconciliation to the nearest GAAP metric  See glossary at the appendix to this presentation  How We Measure our Business  Spend and Contribution ex-TAC1  ‹#› 
 

 Spend  Perion Total Spend ($M)  Perion Spend by Product Lines ($M)   Perion One + Legacy represent Advertising Solutions   Legacy includes low-margin historical activities   Numbers may not add due to rounding  ‹#› 
 

 Advertising Solutions revenue is comprised of Perion One + Legacy  Legacy includes low-margin historical activities   Numbers may not add due to rounding  Revenue  ‹#›  Perion Total Revenue ($M)  Perion Revenue by Product Lines ($M) 
 

 1 Non-GAAP metrics. Please see the Appendix to this presentation for a reconciliation of each to the nearest GAAP metric.  Legacy includes low-margin historical activities   Numbers may not add due to rounding  See glossary at the appendix to this presentation  Perion Contribution ex-TAC ($M) & Margin (%)   Contribution ex-TAC1  Perion One Contribution ex-TAC grew 7% YoY representing 81% of total contribution ex-TAC in Q1’26, up from 75% in Q1’25  Perion Contribution ex-TAC by Category ($M)   ‹#› 
 

 Growth Engines   Perion’s primary growth drivers consistently outpacing the broader market growth1 on CTV and DOOH channels, Retail Media vertical, alongside the adoption of our AI Agent technology, Outmax.   ‹#›  1 Source: eMarketer data, June 2026  See glossary at the appendix to this presentation 
 

 CTV Channel grew 68% YoY in Q1’26  Vs 17.5% Expected Market Growth in 2026  Growth Engines - CTV Spend ($M)  ‹#›  1 Source: eMarketer data, June 2026  See glossary at the appendix to this presentation 
 

 DOOH channel grew 29% YoY in Q1’26  Vs 16.3% Expected Market Growth in 2026  Growth Engines - DOOH Spend ($M)  ‹#›  1 Source: eMarketer data, June 2026  See glossary at the appendix to this presentation 
 

 Retail Media grew 27% YoY in Q1’26  Vs 20.3% Expected Market Growth in 2026  Growth Engines - Retail Media Spend ($M)  (Market vertical; includes CTV, DOOH, DIsplay and other channels)  ‹#›  1 Source: eMarketer data, June 2026  See glossary at the appendix to this presentation 
 

 Outmax AI Agent nearly doubled from 2024 to 2025 and grew 316% YoY in Q1’26  Growth Engines - Outmax Spend1 ($M)  (AI Agent Tech Solution; includes CTV, Social, DIsplay and other channels)  ‹#›  1 On a pro forma basis  Numbers may not add due to rounding  See glossary at the appendix to this presentation 
 

 Financial Results& Outlook  Q1 2026  ‹#› 
 

 Growth Engines  Q1 Business & Financial Highlights  Results  1 Non-GAAP metrics. Please see the Appendix to this presentation for a reconciliation of each to the nearest GAAP metric  2 On a proforma basis   See glossary at the appendix to this presentation  Channels  Vertical  Technology  $90.4MRevenue  $7.0MAdjusted free   cash flow1  $0.5MAdjusted EBITDA1  $39.7MContribution ex-TAC1  68%YoY Spend growth  CTV  29%YoY Spend growth  DOOH  27%YoY Spend growth  Retail Media  316%YoY Spend growth2  Outmax AI Agent  Highlights  Outmax ExpansionLaunched on TikTok -generated $1M in spend  Reseller InitiativeSouth Africa - Mediamark & McSorely Media  2028 Target Plan on track  Perion One spend increased +6% YoY  Perion One Cont. ex-TAC increased +7% YoY  59  Balanced, disciplined capital allocation2.5M shares repurchased in Q1’26 ($24.1M)
 

 Q1 2026 Key Financial Highlights  $90.4M  Revenue  Adjusted EBITDA1  Cash Flow from Operations  Net Cash2  Contribution ex-TAC1  $0.5M  $6.7M  $293.0M  $39.7M  Vs. $1.8M LY  Share Repurchase $24.1M  1 Non-GAAP metrics. Please see the Appendix to this presentation for a reconciliation of each to the nearest GAAP metric  2 Includes cash, cash equivalents, short term deposits and marketable securities  1% YoY growth  44% Margin  Adj. FCF1 $7.0M   ‹#› 
 

 Adjusted EBITDA1 ($M) and Margins  1 Non-GAAP metrics. Please see the Appendix to this presentation for a reconciliation of each to the nearest GAAP metric.  Excluding FX impact of $1.4M  ‹#› 
 

 GAAP and Non-GAAP1 Net Income (Loss) ($M) & EPS ($)  1 Non-GAAP metrics. Please see the Appendix to this presentation for a reconciliation of each to the nearest GAAP metric.  GAAP Net Income (Loss) & EPS  Non-GAAP Net Income & EPS1   GAAP Net Income (Loss)   Non-GAAP Net Income   ‹#› 
 

 1 Non-GAAP metrics. Please see the Appendix to this presentation for a reconciliation of each to the nearest GAAP metric.  Cash from Operations & Adjusted Free Cash Flow1 ($M)  Continued Momentum Drives Higher Spend  Highlighting the cash-generative nature of our business model  Cash from Operations   Adjusted Free Cash Flow1  ‹#› 
 

 1 Non-GAAP metrics. Please see the Appendix to this presentation for a reconciliation of each to the nearest GAAP metric.  FY2026E CapEx includes corporate headquarters investment  ‹#›  Disciplined Cash Deployment   Low CapEx, Strong FCF1, Aggressive Shareholder Returns ($M)  Investing in Growth While Maximizing Shareholder Returns 
 

 1 Includes cash, cash equivalents, short term deposits and marketable securities  Generating cash from operations  Returning cashto shareholders  Investing in Organic growth   Net Cash1 ($M)  Creating Value to Shareholders  ‹#› 
 

 Share Repurchase Program  Accumulated spend ($M)  Number of shares repurchased (M) & Average Share Price ($)  ‹#› 
 

 FY2026 Financial Outlook  1 Implies a revenue range of $460 - 490 million  2 Contribution ex-TAC and Adjusted EBITDA are non-GAAP measures. See reconciliation of GAAP to non-GAAP measures at the appendix to this presentation  3 Calculated at Contribution ex-TAC and Adjusted EBITDA guidance midpoint  Contribution ex-TAC  Adjusted EBITDA2   Adj. EBITDA/Contribution ex-TAC3  2025A  2026E  $203.4M  $45.2M  $215M - $235M1  $50M - $54M  22%  23%  ‹#› 
 

 Why Invest  Large OmnichannelGrowth OpportunityStrong focus on high-growth channels and market verticals: CTV, DOOH & Retail Media, through integrated cross-channel execution  Unified Media Performance with Perion OneA single platform to plan, activate, optimize & analyze across channels, bridging creative and media with actionable insights for performance-driven outcomes  AI as the OS of AdvertisingAI-native execution infrastructure for modern advertising, with a proprietary AI agent embedded into Perion One  Profitability & Cash Generation1Over a decade of positive annual Adjusted EBITDA & Operating Cash Flow, combined with efficient operations with scalable technology foundation  Global FootprintPresence in North America, South America, EMEA & APAC; Allows us to follow advertiser budgets across geographies and capture spend wherever it flows  Experienced ManagementLed by a highly experienced, global management team with a track record of delivering innovation and value  1 Annually, on a non-GAAP basis   ‹#› 
 

 Appendix.  ‹#› 
 

 Glossary  Definitions of the key terms used throughout this presentation  Spend  Gross advertiser and media dollars activated through Perion. A measure of scale and adoption.  Revenue  Total reported revenue, recognized on either a gross or net basis in accordance with GAAP accounting principles, depending on Perion’s specific role in the transaction.  TAC & Media Buy  Traffic acquisition costs and media buy; represents amounts paid to publishers, media owners, and advertising partners in transactions where revenue is recorded on a gross basis.  Contribution ex-TAC  Revenue excluding TAC and media buy. This represents the portion of revenue retained by Perion and serves as a primary metric for evaluating core value creation.  Contribution ex-TAC margin  Contribution ex-TAC divided by Revenue.  Adjusted EBITDA margin  Adjusted EBITDA divided by Revenue, and Adjusted EBITDA divided by Contribution ex-TAC  Perion One  Perion's unified, AI-native execution platform. The company's go-forward business.  Legacy  Historical, lower-margin business activities that are monitored and managed separately from the core Perion One platform.  Walled Gardens  Closed advertising ecosystems (e.g., Meta, Google, Amazon, TikTok) where the platform controls data, targeting, and measurement within its own environment.  ‹#› 
 

 Glossary  Definitions of the key terms used throughout this presentation  Outmax  Perion's proprietary AI agent embedded within Perion One. It automatically optimizes advertiser campaigns across channels and walled gardens in real time, driving outcome-based performance.  DSP  Demand-Side Platform, technology that enables advertisers and agencies to buy digital ad inventory programmatically across multiple sources through a single interface.  SSP  Supply-Side Platform, technology that enables publishers to manage and sell their ad inventory programmatically, maximizing yield across multiple demand sources.  DMP  Data Management Platform, a system that collects, organizes, and activates audience data from multiple sources to improve ad targeting and personalization.  CPA  Cost Per Action, a pricing model where the advertiser pays only when a user completes an action, such as a purchase, sign-up, or download.  CTR  Click-Through Rate, the percentage of users who click on an ad after seeing it. Calculated as clicks divided by impressions.  CPM  Cost per Mille, the cost an advertiser pays per 1,000 ad impressions served. The standard pricing unit for display and video advertising.  ‹#› 
 

 Condensed Consolidated Balance Sheets  ‹#› 
 

 Consolidated Statements Of Operations - GAAP  ‹#› 
 

 Condensed Consolidated Statements of Cash Flows  ‹#› 
 

 Reconciliation of GAAP to Non-GAAP Results  ‹#› 
 

 Reconciliation of GAAP to Non-GAAP Results  ‹#› 
 

 Reconciliation of GAAP to Non-GAAP Results  ‹#› 
 

 Reconciliation of GAAP to Non-GAAP Full Year 2026 Guidance  ‹#› 
 

 Perion One Spend - Distribution by Channel ($M)  ‹#›  Numbers may not add due to rounding  Social includes activities driven by the Outmax AI agent 


Thank you PERION