v3.26.1
Pay vs Performance Disclosure - USD ($)
12 Months Ended
Dec. 31, 2025
Dec. 31, 2024
Dec. 31, 2023
Pay vs Performance Disclosure      
Pay vs Performance Disclosure, Table

Pay-Versus-Performance


Year(1)
(a)


Summary
Compensation
Table Total
for PEO 1
(Faga)
(2)
(b)


Compensation
Actually Paid
for PEO 1
(Faga)
(3)
(c)


Average
Summary
Compensation
Table Total
for
Non-PEO
NEOs
(2)
(d)


Average
Compensation
Actually Paid
for Non-PEO
NEOs
(3)
(e)


Value of
Initial Fixed
$100
Investment
Based on
Total
Shareholder
Return
(4)
(f)


Net Income
(g)


2025


$

6,133,943


$

41,738,418


$

2,186,652


$

12,471,713


$

156


$

(13,232,000

)

2024


$

13,630,292


$

9,160,362


$

3,911,208


$

1,844,033


$

43


$

(145,231,000

)

2023


$

7,461,920


$

(1,737,869

)


$

2,349,651


$

544,250


$

69


$

(163,619,000

)

   
Named Executive Officers, Footnote
(1)
The Company’s PEOs and NEOs for the applicable fiscal years were as follows:


Year


PEO 1


Non-PEO NEOs

2025


Daniel Faga


Dennis Mulroy, Paul Lizzul

2024


Daniel Faga


Dennis Mulroy, Paul Lizzul

2023


Daniel Faga


Eric Loumeau, Paul Lizzul

   
PEO Total Compensation Amount $ 6,133,943 $ 13,630,292 $ 7,461,920
PEO Actually Paid Compensation Amount $ 41,738,418 9,160,362 (1,737,869)
Adjustment To PEO Compensation, Footnote
(2)
The dollar amounts reported in these columns represent (i) the amount of total compensation reported in the Summary Compensation Table for the applicable fiscal year our PEO and (ii) the average dollar amounts of total compensation reported in the Summary Compensation Table for the applicable fiscal year for our other NEOs as a group (excluding our PEO).
(3)
The dollar amounts reported in these columns represent (i) the “compensation actually paid” to our PEO and (ii) the average “compensation actually paid” to our other NEOs as a group (excluding our PEO), based on their total compensation reported in the Summary Compensation Table for the applicable fiscal years and adjusted in accordance with Item 402(v) of Regulation S-K. The dollar amounts reported in this column for the latest fiscal year are adjusted as shown in the table below:


2025
(PEO 1)


2025
(NEO Average)


 Summary Compensation Table - Total Compensation


$

6,133,943


$

2,186,652


-


Grant Date Fair Value of Stock Awards and Option Awards Granted in Fiscal Year


$

(4,937,654

)


$

(1,402,155

)

+


Fair Value at Fiscal Year End of Outstanding and Unvested Stock Awards and Option Awards Granted in Fiscal Year


$

20,014,968


$

5,684,280


+


Change in Fair Value of Outstanding and Unvested Stock Awards and Option Awards Granted in Prior Fiscal Years


$

17,158,745


$

4,805,546


+


Fair Value at Vesting of Stock Awards and Option Awards Granted in Fiscal Year That Vested During Fiscal Year


$


$


+


Change in Fair Value as of Vesting Date of Stock Awards and Option Awards Granted in Prior Fiscal Years For Which Applicable Vesting Conditions Were Satisfied During Fiscal Year


$

3,368,416


$

1,197,390


-


Fair Value as of Prior Fiscal Year End of Stock Awards and Option Awards Granted in Prior Fiscal Years That Failed to Meet Applicable Vesting Conditions During Fiscal Year


$


$


=


Compensation Actually Paid


$

41,738,418


$

12,471,713


The fair value or change in fair value, as applicable, of equity awards in the “Compensation Actually Paid” columns has been estimated pursuant to the guidance in ASC Topic 718, and the valuation assumptions used to calculate fair values did not materially differ from those disclosed at the time of the grant.

   
Non-PEO NEO Average Total Compensation Amount $ 2,186,652 3,911,208 2,349,651
Non-PEO NEO Average Compensation Actually Paid Amount $ 12,471,713 1,844,033 544,250
Adjustment to Non-PEO NEO Compensation Footnote
(3)
The dollar amounts reported in these columns represent (i) the “compensation actually paid” to our PEO and (ii) the average “compensation actually paid” to our other NEOs as a group (excluding our PEO), based on their total compensation reported in the Summary Compensation Table for the applicable fiscal years and adjusted in accordance with Item 402(v) of Regulation S-K. The dollar amounts reported in this column for the latest fiscal year are adjusted as shown in the table below:


2025
(PEO 1)


2025
(NEO Average)


 Summary Compensation Table - Total Compensation


$

6,133,943


$

2,186,652


-


Grant Date Fair Value of Stock Awards and Option Awards Granted in Fiscal Year


$

(4,937,654

)


$

(1,402,155

)

+


Fair Value at Fiscal Year End of Outstanding and Unvested Stock Awards and Option Awards Granted in Fiscal Year


$

20,014,968


$

5,684,280


+


Change in Fair Value of Outstanding and Unvested Stock Awards and Option Awards Granted in Prior Fiscal Years


$

17,158,745


$

4,805,546


+


Fair Value at Vesting of Stock Awards and Option Awards Granted in Fiscal Year That Vested During Fiscal Year


$


$


+


Change in Fair Value as of Vesting Date of Stock Awards and Option Awards Granted in Prior Fiscal Years For Which Applicable Vesting Conditions Were Satisfied During Fiscal Year


$

3,368,416


$

1,197,390


-


Fair Value as of Prior Fiscal Year End of Stock Awards and Option Awards Granted in Prior Fiscal Years That Failed to Meet Applicable Vesting Conditions During Fiscal Year


$


$


=


Compensation Actually Paid


$

41,738,418


$

12,471,713


The fair value or change in fair value, as applicable, of equity awards in the “Compensation Actually Paid” columns has been estimated pursuant to the guidance in ASC Topic 718, and the valuation assumptions used to calculate fair values did not materially differ from those disclosed at the time of the grant.

   
Compensation Actually Paid vs. Total Shareholder Return

The following graph displays our compensation actually paid (CAP) vs. our cumulative TSR.

img13455265_3.jpg

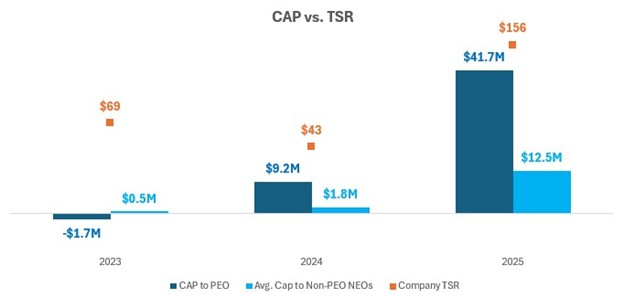
1. Cumulative TSR is calculated by dividing the sum of the cumulative amount of dividends for the measurement period, assuming dividend reinvestment, and the difference between the Company’s share price at the end and the beginning of the measurement period by the Company’s share price at the beginning of the measurement period.

   
Compensation Actually Paid vs. Net Income

The following graph displays our compensation actually paid vs. Net Income. As a pre-commercial biotechnology company, we do not believe Net Income is yet a reasonable metric to measure our financial performance.

img13455265_4.jpg

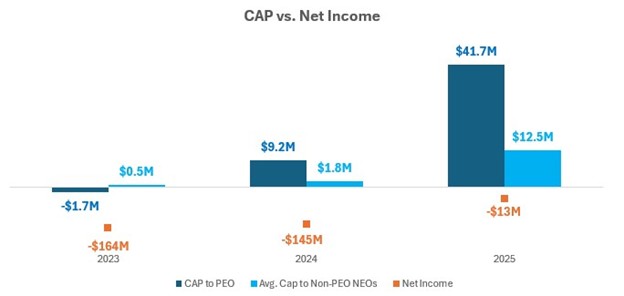
1. Net Income is calculated by subtracting expenses, interest, and taxes from revenue. The dollar amounts reported represent the amount of Net Income reflected in the Company’s audited financial statements for the applicable year.

   
Total Shareholder Return Amount $ 156 43 69
Net Income (Loss) $ (13,232,000) $ (145,231,000) $ (163,619,000)
PEO Name Daniel Faga Daniel Faga Daniel Faga
Additional 402(v) Disclosure Pursuant to Item 402(v) of Regulation S-K, the comparison assumes $100 was invested on December 31, 2022 in our common stock. Historic stock price performance is not necessarily indicative of future stock price performance.    
PEO | Aggregate Grant Date Fair Value of Equity Award Amounts Reported in Summary Compensation Table      
Pay vs Performance Disclosure      
Adjustment to Compensation, Amount $ (4,937,654)    
PEO | Year-end Fair Value of Equity Awards Granted in Covered Year that are Outstanding and Unvested      
Pay vs Performance Disclosure      
Adjustment to Compensation, Amount 20,014,968    
PEO | Year-over-Year Change in Fair Value of Equity Awards Granted in Prior Years That are Outstanding and Unvested      
Pay vs Performance Disclosure      
Adjustment to Compensation, Amount 17,158,745    
PEO | Vesting Date Fair Value of Equity Awards Granted and Vested in Covered Year      
Pay vs Performance Disclosure      
Adjustment to Compensation, Amount 0    
PEO | Change in Fair Value as of Vesting Date of Prior Year Equity Awards Vested in Covered Year      
Pay vs Performance Disclosure      
Adjustment to Compensation, Amount 3,368,416    
PEO | Prior Year End Fair Value of Equity Awards Granted in Any Prior Year that Fail to Meet Applicable Vesting Conditions During Covered Year      
Pay vs Performance Disclosure      
Adjustment to Compensation, Amount 0    
Non-PEO NEO | Aggregate Grant Date Fair Value of Equity Award Amounts Reported in Summary Compensation Table      
Pay vs Performance Disclosure      
Adjustment to Compensation, Amount (1,402,155)    
Non-PEO NEO | Year-end Fair Value of Equity Awards Granted in Covered Year that are Outstanding and Unvested      
Pay vs Performance Disclosure      
Adjustment to Compensation, Amount 5,684,280    
Non-PEO NEO | Year-over-Year Change in Fair Value of Equity Awards Granted in Prior Years That are Outstanding and Unvested      
Pay vs Performance Disclosure      
Adjustment to Compensation, Amount 4,805,546    
Non-PEO NEO | Vesting Date Fair Value of Equity Awards Granted and Vested in Covered Year      
Pay vs Performance Disclosure      
Adjustment to Compensation, Amount 0    
Non-PEO NEO | Change in Fair Value as of Vesting Date of Prior Year Equity Awards Vested in Covered Year      
Pay vs Performance Disclosure      
Adjustment to Compensation, Amount 1,197,390    
Non-PEO NEO | Prior Year End Fair Value of Equity Awards Granted in Any Prior Year that Fail to Meet Applicable Vesting Conditions During Covered Year      
Pay vs Performance Disclosure      
Adjustment to Compensation, Amount $ 0