Pay vs Performance Disclosure - USD ($)
Jan. 06, 2025
Dec. 31, 2025
Dec. 31, 2025
Dec. 31, 2024
Dec. 31, 2023
Dec. 31, 2022
Pay Versus Performance
As required by Item 402(v) of Regulation S-K, we are providing the following information about the relationship between executive compensation actually paid and certain of our financial performance. For the most recently completed fiscal year, we did not use any “financial performance measures” as defined in Item 402(v) of Regulation S-K to link compensation paid to our named executive officers (our “NEOs”), to our performance. We are a “smaller reporting company,” as defined in Rule 12b-2 under the Exchange Act, and have elected to provide in this proxy statement certain scaled disclosures permitted under the Exchange Act for smaller reporting companies. For further information regarding our compensation philosophy and how we seek to align executive compensation with our performance, refer to the section titled “Executive Officer and Director Compensation” above.
The following table shows the past three fiscal years’ total compensation for our principal executive officer (“PEO”) and our two most highly compensated executive offices (other than the PEO - our named executive officers or “Non-PEO NEOs”) as set forth in the Summary Compensation Table (“SCT”), the compensation actually paid (“CAP”) to our NEOs (as determined pursuant to SEC rules), our total shareholder return (“TSR”), and our net loss. SEC rules require certain adjustments be made to the SCT totals to determine CAP as reported in the pay versus performance table. CAP does not necessarily represent cash and/or equity value transferred to the applicable NEO without restriction, but rather is a valuation calculated under applicable SEC rules. The methodology for calculating CAP as required by Item 402(v) of Regulation S-K takes into account (among other things) changes in share price and its impact on the fair value of equity awards.
Year | Summary Compensation Table Total for PEO 1(1) | Compensation Actually Paid to PEO 1(2) | Summary Compensation Table Total for PEO 2(3) | Compensation Actually Paid to PEO 2(2) | Average Summary Compensation Table Total for Non-PEO NEOs(4) | Average Compensation Actually Paid to Non-PEO NEOs(5) | Value of Initial Fixed $100 Investment Based On Total Shareholder Return(6) | Net Loss(7) | ||||||||||||||||
2025 | $44,908 | $6,462 | $1,063,718 | $707,220 | $503,661 | $378,227 | $3.05 | ($19,882,000) | ||||||||||||||||
2024 | $742,968 | $399,799 | $0 | $0 | $325,147 | $201,272 | $9.19 | ($10,460,000) | ||||||||||||||||
2023 | $168,380 | $9,932 | $0 | $0 | $157,207 | $97,606 | $6.18 | ($2,603,000) | ||||||||||||||||
(1) | The dollar amounts reported are the amounts of total compensation reported for our PEO, Jon Olsen, for each corresponding years in the “Total” column of the SCT. Refer to “Summary Compensation Table – Years Ended December 31, 2025 and 2024” (the “SCT”), included in the Company’s annual report on Form 10-K for the year ended December 31, 2025, filed with the Securities and Exchange Commission on March 31, 2026. On January 6, 2025 Jon Olsen was removed from his position as the Company’s Chief Executive Officer without cause and Greg Lipschitz was appointed as the Company’s Interim Chief Executive Officer. |
(2) | The dollar amounts reported represent the amount of CAP for our PEOs. The dollar amounts reported are the amounts of total compensation reported in the SCT for the applicable year, but also include (i) the year-end value of equity awards granted during the reported year, (ii) the change in the value of equity awards that were unvested at the end of the prior year, measured through the date the awards vested, or through the end of the reported fiscal year, and (iii) the value of equity awards issued and vested during the reported fiscal year. See the table below for further information. |
(3) | The dollar amounts reported are the amounts of total compensation reported for our PEO, Greg Lipschitz, for each corresponding year in the “Total” column of the SCT. Greg Lipschitz was appointed as the Company's Interim Chief Executive Officer on January 6, 2025. |
(4) | The dollar amounts reported for 2023 represent the average of the total compensation reported for our NEOs, other than our PEO, namely, Stephen Purcell and Gil Issachar .The dollar amounts reported for 2024 are the average of the total compensation reported for our NEOs, other than our PEO, namely Stephen Purcell, Gil Issachar and Paul Krzywicki, in the “Total” column of the SCT. On March 7, 2024, Mr. Purcell resigned as our Chief Financial Officer upon the appointment of our current Chief Financial Officer, Mr. Krzywicki, on the same date. The inclusion of these three non-PEO NEOs during 2024, two of whom occupied the same position during the year, has the effect of reducing the average compensation amounts reported. The dollar amounts reported for 2025 are the average of the total compensation reported for our NEOs, other than our PEO, namely David DeCaprio and Gil Issachar in the “Total” column of the SCT. |
(5) | The dollar amounts reported represent the average amount of CAP for our NEOs, other than our PEO. The dollar amounts reported are the average of the total compensation reported for our NEOs, other than our PEO, in the SCT for the applicable year, but also include (i) the year-end value of equity awards granted during the reported year, (ii) the change in the value of equity awards that were unvested at the end of the prior year, measured through the date the awards vested, or through the end of the reported fiscal year, and (iii) value of equity awards issued and vested during the reported fiscal year. See the table below for further information. |
(6) | Assumes an initial fixed investment of $100 for the period starting December 31, 2022, through the end of each listed year. Prior to the merger with WaveDancer on August 12, 2024, the fair value of a share of Firefly Neuroscience private company common stock was estimated to be $28.82 and $1.78 as of December 31, 2022 and 2023, respectively. Following the merger, the closing price of the Company’s common stock, as reported on Nasdaq Capital Market, was $2.65 and $0.88 as of December 31, 2024 and 2025, respectively. |
(7) | For 2023, represents the stand-alone private company net loss of Firefly Neuroscience, Inc. (“Firefly”), prior to the merger with WaveDancer. For 2024 and 2025, represents the Company’s net losses as reported on its Form 10-K for the fiscal year ended December 31, 2024 and 2025, respectively, which was filed with the SEC on March 31, 2026. |
The following table summarizes the adjustments to the total compensation reported in the SCT for each of the PEOs and the average of non-PEO NEOs in calculating CAP for the most recent fiscal year:
PEO | PEO | Non-PEO NEOs | |||||||
Compensation Actually Paid | Jon Olsen | Greg Lipschitz | |||||||
Summary Compensation Table – Total Compensation | $44,908 | $1,063,718 | $503,661 | ||||||
- Grant Date Fair Value of Equity Awards | — | (611,706) | (203,903) | ||||||
- Fair Value at Prior Year-End for Awards Granted in Prior Years Forfeited During the Current Year | (38,446) | — | — | ||||||
+ Fair Value at Year-End of Outstanding Unvested Awards Granted During the Year | — | 130,656 | 43,552 | ||||||
+ Change in Fair Value of Outstanding Unvested Awards from Prior Year to Current Year | — | — | (5,602) | ||||||
+ Change in Fair Value of Current Year Awards Vesting During the Year | — | 124,552 | 37,778 | ||||||
+ Change in Fair Value of Prior Year Awards Vesting During the Year | — | — | 2,741 | ||||||
Compensation Actually Paid | $6,462 | $707,220 | $378,227 | ||||||
(1) | The dollar amounts reported are the amounts of total compensation reported for our PEO, Jon Olsen, for each corresponding years in the “Total” column of the SCT. Refer to “Summary Compensation Table – Years Ended December 31, 2025 and 2024” (the “SCT”), included in the Company’s annual report on Form 10-K for the year ended December 31, 2025, filed with the Securities and Exchange Commission on March 31, 2026. On January 6, 2025 Jon Olsen was removed from his position as the Company’s Chief Executive Officer without cause and Greg Lipschitz was appointed as the Company’s Interim Chief Executive Officer. |
(3) | The dollar amounts reported are the amounts of total compensation reported for our PEO, Greg Lipschitz, for each corresponding year in the “Total” column of the SCT. Greg Lipschitz was appointed as the Company's Interim Chief Executive Officer on January 6, 2025. |
(4) | The dollar amounts reported for 2023 represent the average of the total compensation reported for our NEOs, other than our PEO, namely, Stephen Purcell and Gil Issachar .The dollar amounts reported for 2024 are the average of the total compensation reported for our NEOs, other than our PEO, namely Stephen Purcell, Gil Issachar and Paul Krzywicki, in the “Total” column of the SCT. On March 7, 2024, Mr. Purcell resigned as our Chief Financial Officer upon the appointment of our current Chief Financial Officer, Mr. Krzywicki, on the same date. The inclusion of these three non-PEO NEOs during 2024, two of whom occupied the same position during the year, has the effect of reducing the average compensation amounts reported. The dollar amounts reported for 2025 are the average of the total compensation reported for our NEOs, other than our PEO, namely David DeCaprio and Gil Issachar in the “Total” column of the SCT. |
The following table summarizes the adjustments to the total compensation reported in the SCT for each of the PEOs and the average of non-PEO NEOs in calculating CAP for the most recent fiscal year:
PEO | PEO | Non-PEO NEOs | |||||||
Compensation Actually Paid | Jon Olsen | Greg Lipschitz | |||||||
Summary Compensation Table – Total Compensation | $44,908 | $1,063,718 | $503,661 | ||||||
- Grant Date Fair Value of Equity Awards | — | (611,706) | (203,903) | ||||||
- Fair Value at Prior Year-End for Awards Granted in Prior Years Forfeited During the Current Year | (38,446) | — | — | ||||||
+ Fair Value at Year-End of Outstanding Unvested Awards Granted During the Year | — | 130,656 | 43,552 | ||||||
+ Change in Fair Value of Outstanding Unvested Awards from Prior Year to Current Year | — | — | (5,602) | ||||||
+ Change in Fair Value of Current Year Awards Vesting During the Year | — | 124,552 | 37,778 | ||||||
+ Change in Fair Value of Prior Year Awards Vesting During the Year | — | — | 2,741 | ||||||
Compensation Actually Paid | $6,462 | $707,220 | $378,227 | ||||||
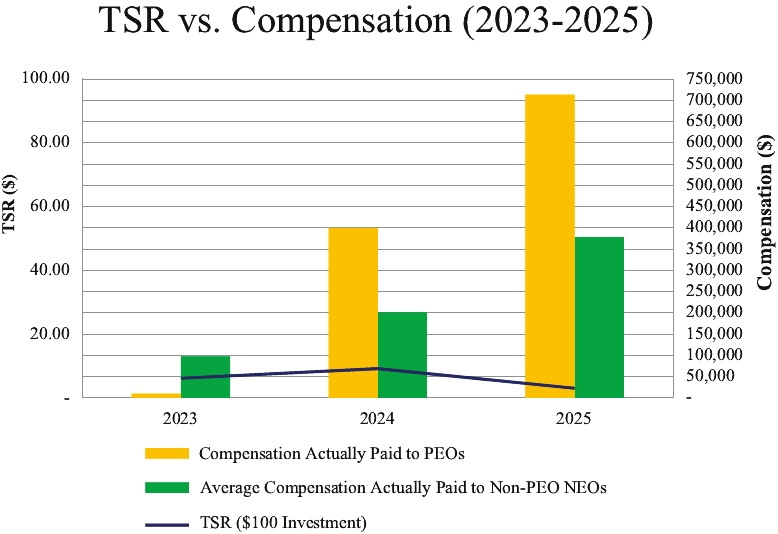
Compensation Actually Paid and Cumulative Total Shareholder Return (“TSR”)
The following chart sets forth the relationship between CAP to our PEO and non-PEO NEOs and the cumulative TSR over the three most recently completed fiscal years:
Compensation Actually Paid and Net Loss
The following chart sets forth the relationship between CAP to our PEO and our non-PEO NEOs and our net loss during the three most recently completed fiscal years:
From 2023 to 2025, our net loss increased, while the CAP to our PEO and non-PEO NEOs increased.