The bar chart and Average Annual Total Returns table gives some indication of the risks of investing in the Tactical Risk Fund. The bar chart shows the performance of the Fund for each calendar year since the Fund’s inception. The Average Annual Total Returns table shows how the Fund’s average annual returns compare with those of a broad measure of market performance. Remember, the Fund’s past performance, before and after taxes, is not necessarily an indication of how the Fund will perform in the future. Updated performance information will be available at no cost at www.beaconinvestingfunds.com or by calling 1-866-439-9093.
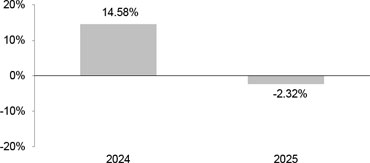
The year to date performance of the Tactical Risk Fund through the most recent quarter ended March 31, 2026 is 2.21%.
During the period shown in the bar chart, the best performance for a quarter was 8.28% (for the quarter ended September 30, 2024). The worst performance was (8.02)% (for the quarter ended June 30, 2025).
| One Year | Since Inception* | |
| Return Before Taxes | (2.32)% | 1.65% |
| Return After Taxes on Distributions | (2.82)% | 1.27% |
| Return After Taxes on Distributions and Sale of Fund Shares | (1.37)% | 1.15% |
| S&P 500 Total Return Index | 17.88% | 21.99% |
| Dow Jones Moderately Aggressive Portfolio Index | 16.73% | 13.81% |
| * | The Tactical Risk Fund commenced operations on April 17, 2023. |
After-tax returns are based on the highest historical individual federal marginal income tax rates, and do not reflect the impact of state and local taxes; actual after-tax returns depend on an individual investor’s tax situation and may differ from those shown. If you own shares of the Fund in a tax-deferred account, such as an individual retirement account or a 401(k) plan, this information is not applicable to your investment. A higher after-tax return results when a capital loss occurs upon redemption and translates into an assumed tax deduction that benefits the shareholder.
The S&P 500 Total Return Index is a widely accepted, unmanaged index of U.S. stock market performance, is the Fund’s regulatory index. The Fund’s regulatory index is shown in connection with certain regulatory requirements to provide a broad measure of market performance. The index does not take into account charges, fees and other expenses.
The Dow Jones Moderately Aggressive U.S. Portfolio Index is a benchmark index that represents a portfolio allocation designed for investors with a moderate risk tolerance. It aims to measure a total portfolio of U.S. stocks, bonds, and cash, with allocations intended to represent an investor’s desired risk profile and is a supplemental index of the Tactical Risk Fund that the Adviser believes is more representative of the Fund’s investment universe. The index does not take into account charges, fees and other expenses.
The bar chart and Average Annual Total Returns table gives some indication of the risks of investing in the Unified Catalyst Fund. The bar chart shows the performance of the Fund for each calendar year since the Fund’s inception. The Average Annual Total Returns table shows how the Fund’s average annual returns compare with those of a broad measure of market performance. Remember, the Fund’s past performance, before and after taxes, is not necessarily an indication of how the Fund will perform in the future. Updated performance information will be available at no cost at www.beaconinvestingfunds.com or by calling 1-866-439-9093. In the future, performance information will be presented in this section of the Prospectus.
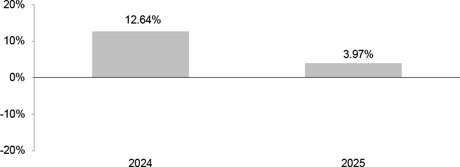
The year to date performance of the Unified Catalyst Fund through the most recent quarter ended March 31, 2026 is 1.06%.
During the period shown in the bar chart, the best performance for a quarter was 7.39% (for the quarter ended September 30, 2024). The worst performance was (1.50)% (for the quarter ended December 31, 2024).
| One Year | Since Inception* | |
| Return Before Taxes | 3.97% | 7.86% |
| Return After Taxes on Distributions | 3.09% | 7.31% |
| Return After Taxes on Distributions and Sale of Fund Shares | 2.67% | 5.96% |
| S&P 500 Total Return Index | 17.88% | 21.99% |
| Dow Jones Moderately Aggressive Portfolio Index | 16.73% | 13.81% |
| * | The Unified Catalyst Fund commenced operations on April 17, 2023. |
After-tax returns are based on the highest historical individual federal marginal income tax rates, and do not reflect the impact of state and local taxes; actual after-tax returns depend on an individual investor’s tax situation and may differ from those shown. If you own shares of the Fund in a tax-deferred account, such as an individual retirement account or a 401(k) plan, this information is not applicable to your investment. A higher after-tax return results when a capital loss occurs upon redemption and translates into an assumed tax deduction that benefits the shareholder.
The S&P 500 Total Return Index is a widely accepted, unmanaged index of U.S. stock market performance, is the Fund’s regulatory index. The Fund’s regulatory index is shown in connection with certain regulatory requirements to provide a broad measure of market performance. The index does not take into account charges, fees and other expenses.
The Dow Jones Moderately Aggressive U.S. Portfolio Index is an index that represents a portfolio allocation designed for investors with a moderate risk tolerance. It aims to measure a total portfolio of U.S. stocks, bonds, and cash, with allocations intended to represent an investor’s desired risk profile and is a supplemental index of the Unified Catalyst Fund that the Adviser believes is more representative of the Fund’s investment universe. The index does not take into account charges, fees and other expenses.