PAY VERSUS PERFORMANCE
As required by Section 953(a) of the Dodd-Frank Wall Street Reform and Consumer Protection Act and Item 402(v) of Regulation S-K, we are providing information about the relationship between executive compensation actually paid to our principal executive officers and the other named executive officers (as calculated in accordance with Item 402(v) of Regulation S-K). Compensation actually paid does not necessarily reflect the actual amount of compensation earned by or paid to our named executive officers during the applicable year, nor does it reflect how the Compensation Committee evaluates compensation decisions or pay-for-performance alignment. The Compensation Committee did not use compensation actually paid as the basis for making fiscal year 2026 compensation decisions. Rather, the Compensation Committee considered the factors described above under “Executive Compensation,” including Company performance, individual performance, leadership needs, retention considerations, market data, and stockholder alignment.
| Year | Summary | Summary | Summary | Compensation | Compensation | Compensation | Average | Average | Value of | Net Loss | Earnings | |||||||||||||||||||||||||
| 2026 |
|
|
|
| $ | 390,000 |
|
|
|
|
| $ | 433,743 | $ | 200,000 | $ | 249,163 | $ | 50.90 | $ | (4,560.00 | ) | $ | (0.56 | ) | |||||||||||
| 2025 |
|
| $ | 526,572 | $ | 648,766 |
|
| $ | (271,839 | ) | $ | 483,725 | $ | 159,757 | $ | 65,045 | $ | 31.74 | $ | (6,122.00 | ) | $ | (0.86 | ) | |||||||||||
| 2024 | $ | 552,115 | $ | 0 |
|
| $ | 552,115 | $ | 417,729 |
|
|
| $ | 158,734 | $ | 143,545 | $ | 80.84 | $ | (4,661.19 | ) | $ | (0.66 | )6 | |||||||||||
____________
(1) PEO 1: Robert Sarlls was the Chief Executive Officer in fiscal year 2023, effective as of effective as of May 9, 2022, until January 27, 2024). PEO 2: Starlette Johnson was the PEO in fiscal year 2024 and 2025 serving from January 27, 2024 to May 13, 2024. PEO 3: Jeffrey Geygan served as the PEO in fiscal year 2025 and 2026, effective from May 14, 2024.
(2) These amounts reflect compensation of Mr. Sarlls who was appointed the Company’s Chief Executive Officer effective May 9, 2022 until January 27, 2024.
(3) Non-PEO NEOs for fiscal year 2024 were A. Allen Arroyo Chief Financial Officer, Ryan McGrath Senior VP — Information Technology, Kara Conklin VP Franchise Development, and Donna Coupe VP Franchisee Support and Training. Non-PEO NEOs for fiscal year 2025 were Carrie Cass Chief Financial Officer and Ryan McGrath Senior VP — Operations. Non-PEO NEOs for fiscal year 2026 were Carrie Cass and Ryan McGrath.
(4) The amounts reported represent the sum of the amounts reported in the “Stock Awards” and “Option Awards” columns of the Summary Compensation Table for the applicable fiscal year.
(5) The equity award adjustments for each fiscal year include the following: (i) the addition (or subtraction, if applicable) of the year-end fair value of any equity awards granted in the year that are outstanding and unvested as of the end of the year; (ii) for any awards granted in prior years that are outstanding and unvested as of the end of the fiscal year, the addition (or subtraction, if applicable) of the change in fair value of between the end of the prior fiscal year and the end of the applicable fiscal year; (iii) for awards that are granted and vest in the same fiscal year, the addition of the fair value of such awards as of the vesting date; (iv) for awards granted in prior years that vest during the fiscal year, the addition (or subtraction, if applicable) of the change in fair value between the end of the prior fiscal year and the vesting date of such awards; (v) for awards granted in prior years that fail to meet the applicable vesting conditions during the fiscal year, the subtraction of the fair value of such awards at the end of the prior fiscal year; and (vi) the dollar value of any dividends or other earnings paid on such awards in the applicable year prior to the vesting date that are not otherwise reflected in the fair value of such award or included in any other component of the amount reported in the “Total” column of the
Summary Compensation Table for the applicable year. The valuation assumptions used to calculate fair values did not materially differ from those disclosed at the time of grant. The amounts deducted or added in calculating the equity award adjustments are as follows:
PEO 1:
| Year | Year End | Year over | Fair Value | Year over | Fair Value | Value of | Total | ||||||||||||||
| 2026 | $ |
| $ |
| $ |
| $ |
| $ |
| $ |
| $ |
| |||||||
| 2025 | $ |
| $ |
| $ |
| $ |
| $ |
| $ |
| $ |
| |||||||
| 2024 | $ |
| $ |
| $ |
| $ |
| $ |
| $ |
| $ |
| |||||||
PEO 2:
| Year | Year End | Year over | Fair Value | Year over | Fair Value | Value of | Total | |||||||||||||||||
| 2026 | $ |
| $ |
| $ |
| $ |
|
| $ |
|
| $ |
| $ |
|
| |||||||
| 2025 | $ |
| $ |
| $ |
| $ | (2,920 | ) | $ | (328,919 | ) | $ |
| $ | (385,839 | ) | |||||||
| 2024 | $ | 417,729 | $ |
| $ |
| $ |
|
| $ |
|
| $ |
| $ |
|
| |||||||
PEO 3:
| Year | Year End | Year over | Fair Value | Year over | Fair Value | Value of | Total | ||||||||||||||
| 2026 | $ | 0 | $ | 41,830 | $ | 0 | $ | 1,913 | $ | 0 | $ | 0 | $ | 43,743 | |||||||
| 2025 | $ | 128,661 | $ |
| $ | 67,064 | $ |
| $ |
| $ |
| $ | 195,725 | |||||||
| 2024 | $ |
| $ |
| $ |
| $ |
| $ |
| $ |
| $ |
| |||||||
____________
(6) The amounts reported represent the “compensation actually paid” to PEOs, computed in accordance with Item 402(v) of Regulation S-K, but do not reflect the actual amount of compensation earned by or paid to PEOs in the applicable year. In accordance with Item 402(v) of Regulation S-K, the following adjustments were made to the amount reported for our principal in the “Total” column of the Summary Compensation Table for each year to calculate compensation actually paid.
(7) The amounts reported represent the “compensation actually paid” to our Non-PEO NEOs, computed in accordance with Item 402(v) of Regulation S-K, but do not reflect the actual amount of compensation earned by or paid to our Non-PEO NEOs in the applicable year. In accordance with Item 402(v) of Regulation S-K, the following adjustments were made to the amount reported for our principal in the “Total” column of the Summary Compensation Table for each year to calculate compensation actually paid. The amounts deducted or added in calculating the equity award adjustments are as follows:
Average of Non-PEO NEOs:
| Year | Year End | Year over | Fair Value | Year over | Fair Value | Value of | Total | |||||||||||||||||
| 2026 | $ | 0 | $ | 50,085 | $ | 0 | $ | (921 | ) | $ | 0 |
| $ | 0 | $ | 49,163 |
| |||||||
| 2025 | $ | 18,492 | $ |
| $ | 4,946 | $ |
|
| $ | (82,734 | ) | $ |
| $ | (59,246 | ) | |||||||
| 2024 | $ |
| $ |
| $ |
| $ |
|
| $ |
|
| $ |
| $ |
|
| |||||||
____________
(8) TSR is calculated by dividing the difference between the Company’s share price at the end and the beginning of the measurement period by the Company’s share price at the beginning of the measurement period.
(9) The dollar amounts reported represent the amount of net income reflected in the Company’s audited financial statements for the applicable fiscal year.
PEO 1:
| Year | Year End | Year over | Fair Value | Year over | Fair Value | Value of | Total | ||||||||||||||
| 2026 | $ |
| $ |
| $ |
| $ |
| $ |
| $ |
| $ |
| |||||||
| 2025 | $ |
| $ |
| $ |
| $ |
| $ |
| $ |
| $ |
| |||||||
| 2024 | $ |
| $ |
| $ |
| $ |
| $ |
| $ |
| $ |
| |||||||
PEO 2:
| Year | Year End | Year over | Fair Value | Year over | Fair Value | Value of | Total | |||||||||||||||||
| 2026 | $ |
| $ |
| $ |
| $ |
|
| $ |
|
| $ |
| $ |
|
| |||||||
| 2025 | $ |
| $ |
| $ |
| $ | (2,920 | ) | $ | (328,919 | ) | $ |
| $ | (385,839 | ) | |||||||
| 2024 | $ | 417,729 | $ |
| $ |
| $ |
|
| $ |
|
| $ |
| $ |
|
| |||||||
PEO 3:
| Year | Year End | Year over | Fair Value | Year over | Fair Value | Value of | Total | ||||||||||||||
| 2026 | $ | 0 | $ | 41,830 | $ | 0 | $ | 1,913 | $ | 0 | $ | 0 | $ | 43,743 | |||||||
| 2025 | $ | 128,661 | $ |
| $ | 67,064 | $ |
| $ |
| $ |
| $ | 195,725 | |||||||
| 2024 | $ |
| $ |
| $ |
| $ |
| $ |
| $ |
| $ |
| |||||||
Average of Non-PEO NEOs:
| Year | Year End | Year over | Fair Value | Year over | Fair Value | Value of | Total | |||||||||||||||||
| 2026 | $ | 0 | $ | 50,085 | $ | 0 | $ | (921 | ) | $ | 0 |
| $ | 0 | $ | 49,163 |
| |||||||
| 2025 | $ | 18,492 | $ |
| $ | 4,946 | $ |
|
| $ | (82,734 | ) | $ |
| $ | (59,246 | ) | |||||||
| 2024 | $ |
| $ |
| $ |
| $ |
|
| $ |
|
| $ |
| $ |
|
| |||||||
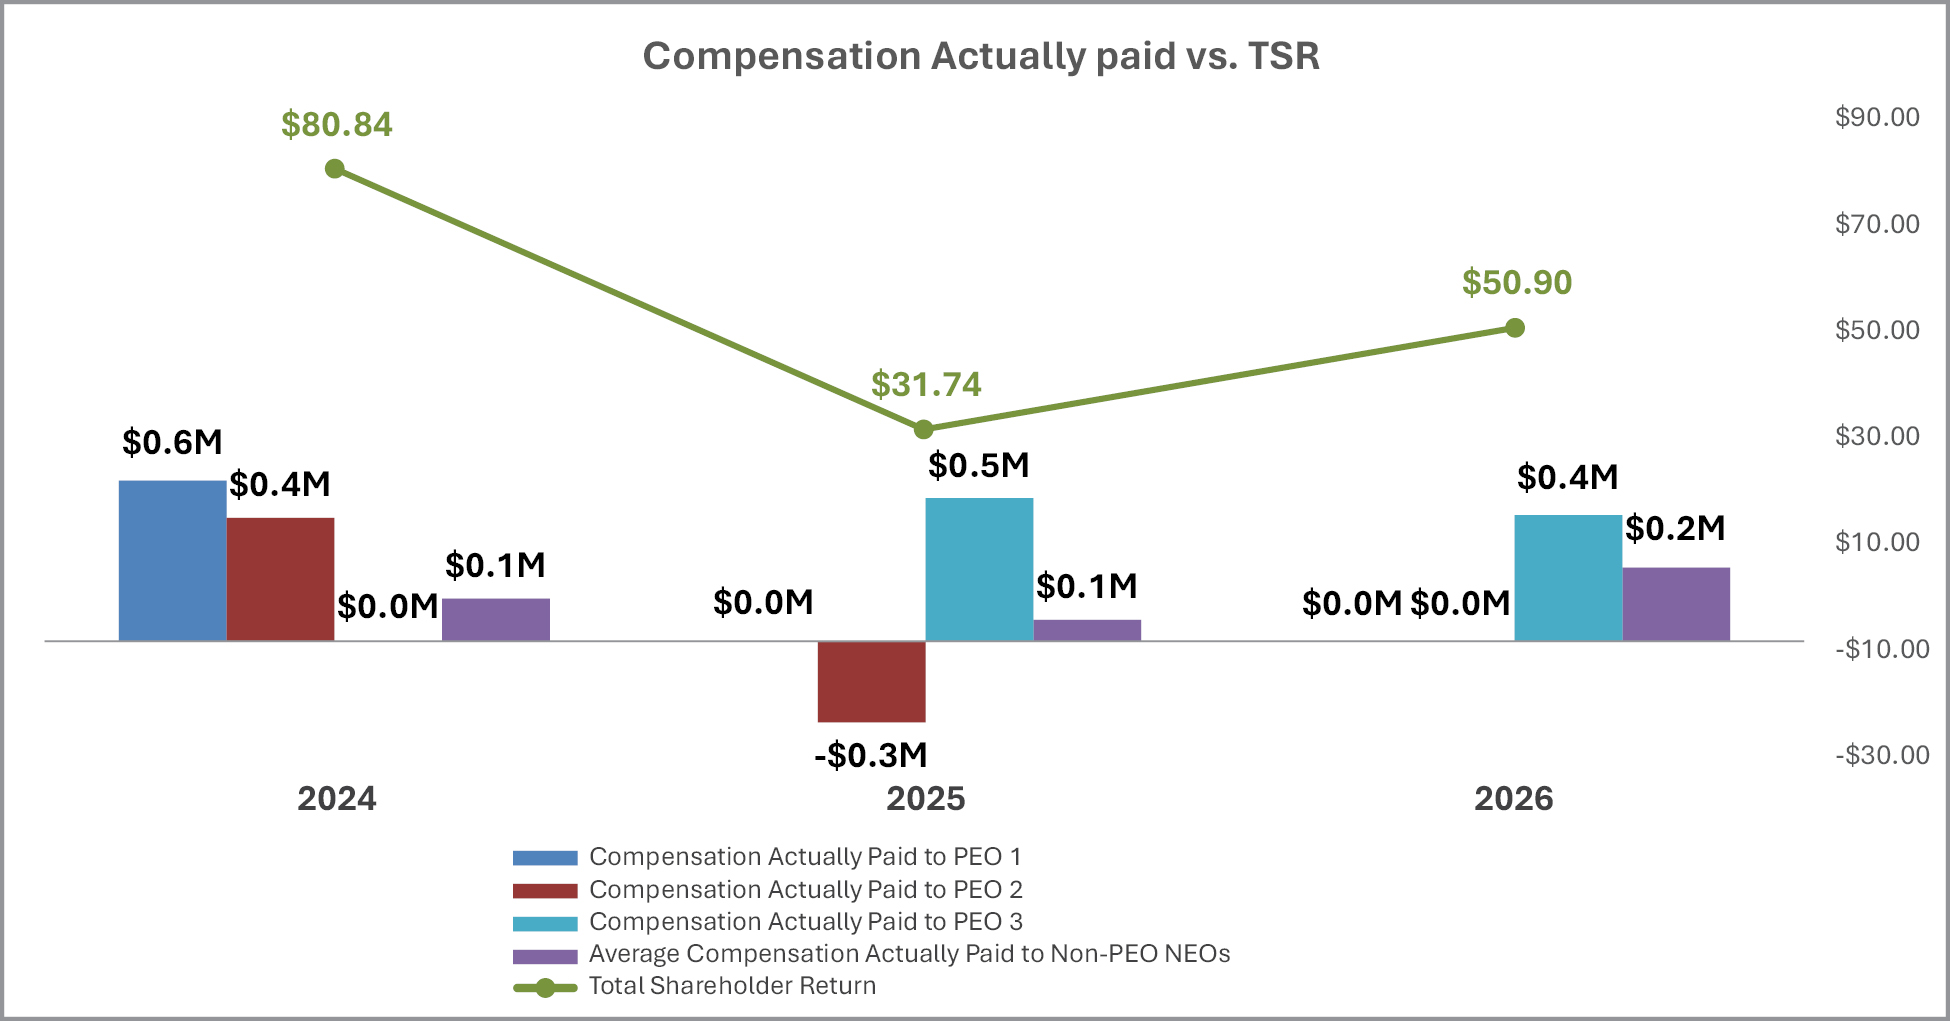
Relationship between Compensation Actually Paid for PEO and Non-PEO NEOs (Average) vs. Total Shareholder Return
The following chart shows the relationship between the compensation actually paid to our PEOs and the average of the compensation actually paid to Non-PEO NEOs, with our cumulative TSR for the fiscal years ended February 28, 2026 and February 28, 2025. TSR amounts reported in the graph assume an initial fixed investment of $100 on February 28, 2025.
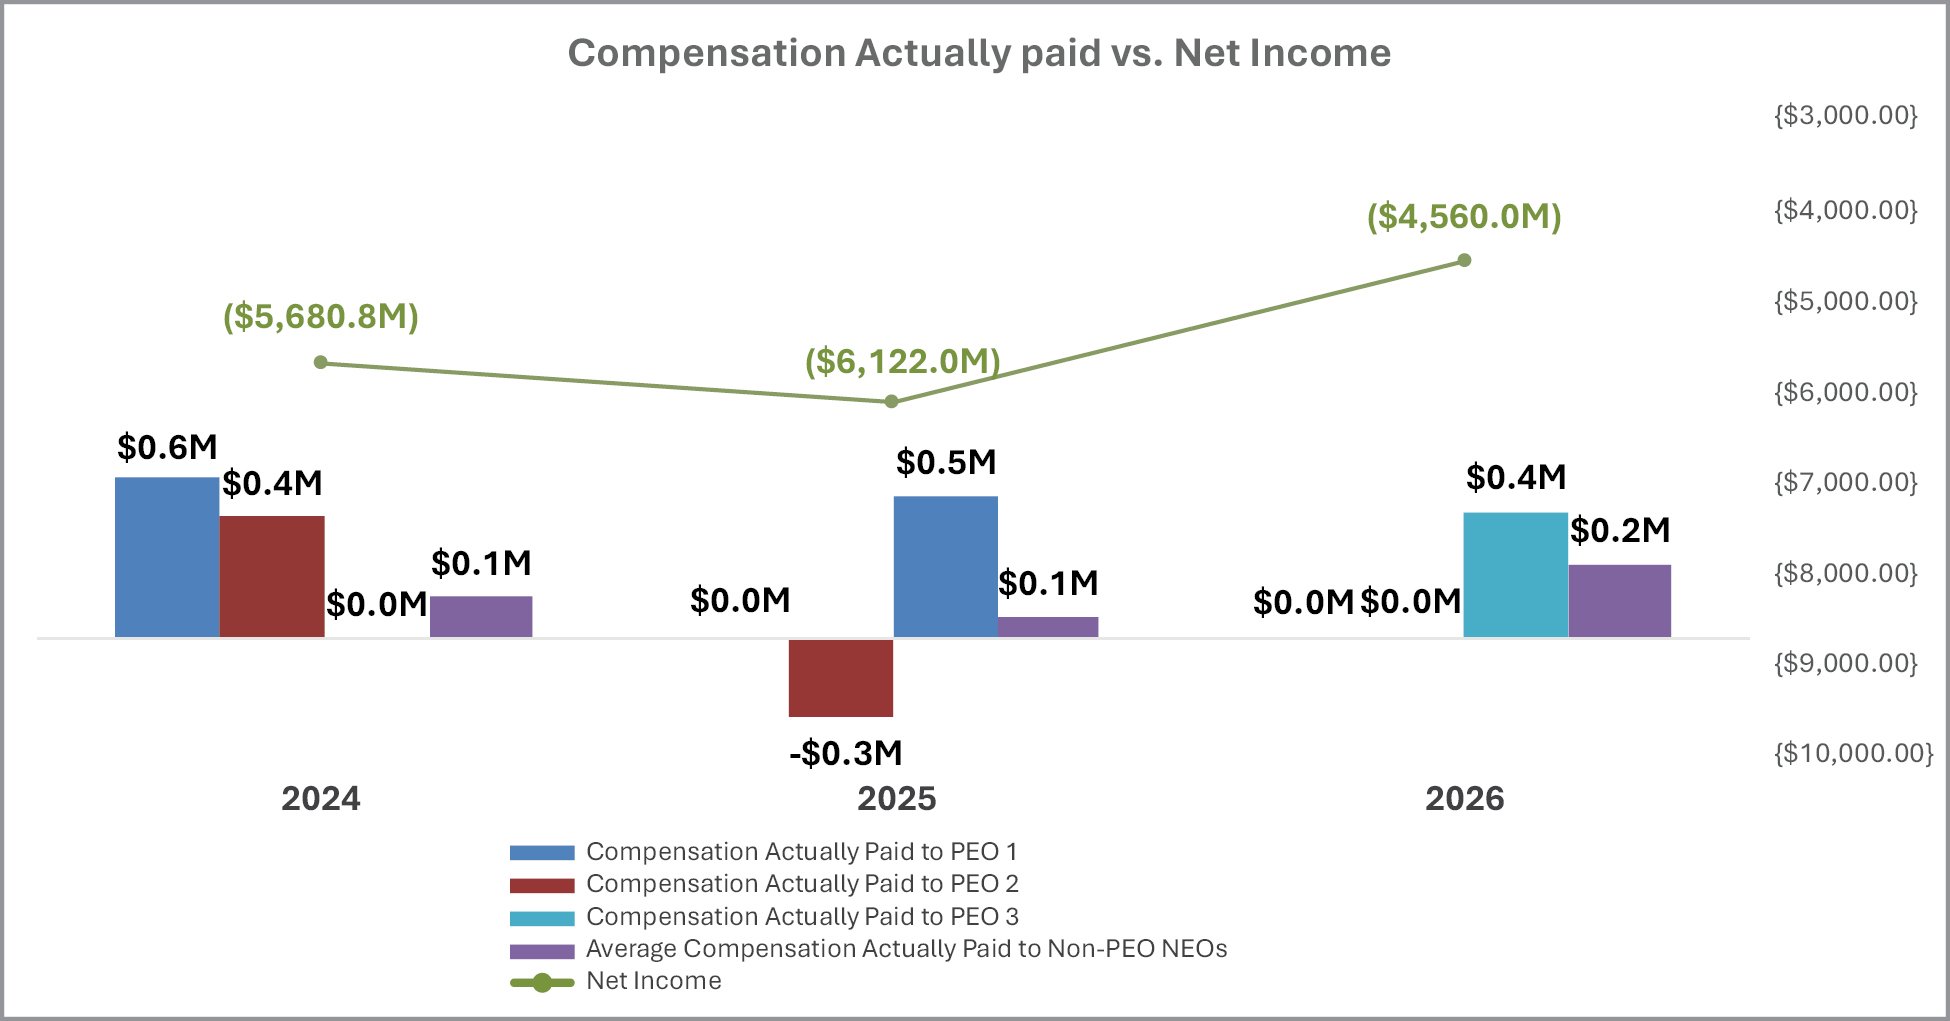
Relationship between Compensation Actually Paid for PEO and Non-PEO NEOs (Average) vs. Net Income
The following chart shows the relationship between Compensation Actually Paid to our PEOs and Average Compensation Actually Paid to our Non-PEO NEOs, and Net Income.
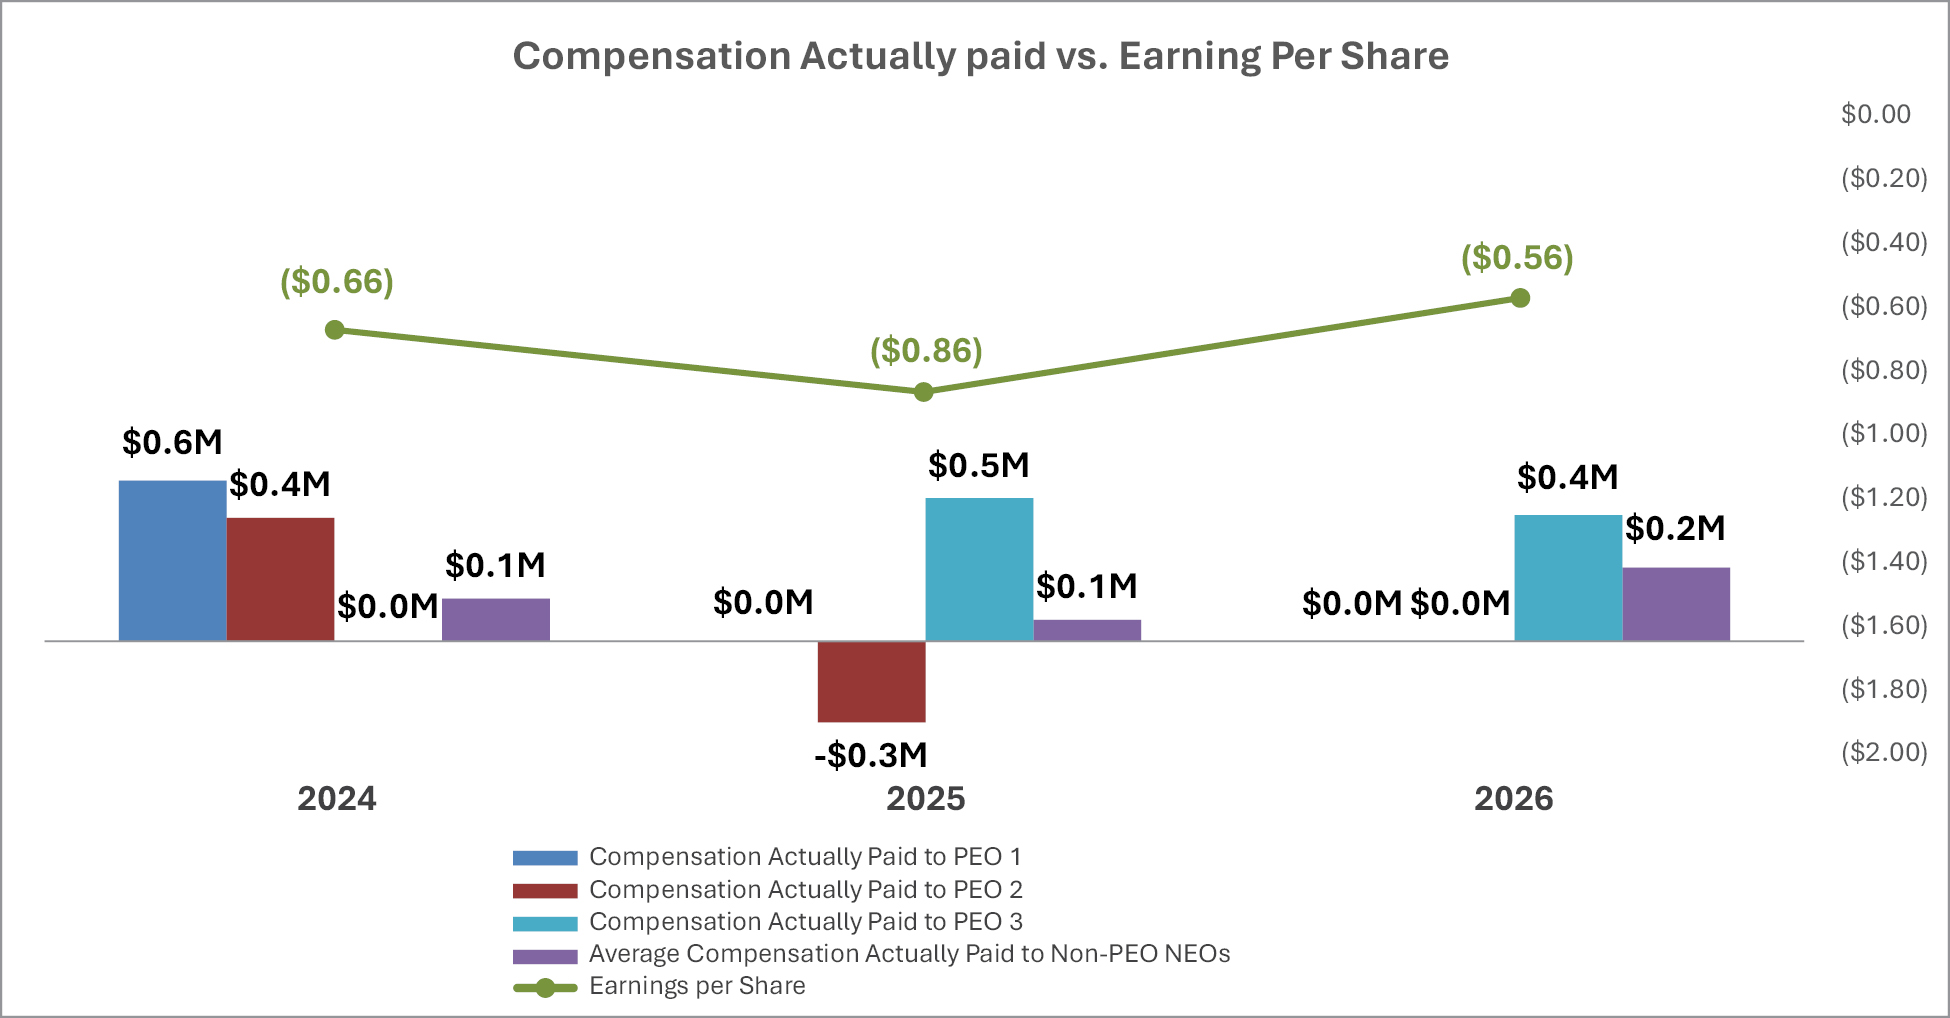
Relationship between Compensation Actually Paid for PEO and Non-PEO NEOs (Average) vs. Earnings Per Share
The following chart shows the relationship between Compensation Actually Paid to our PEOs and Average Compensation Actually Paid to our Non-PEO NEOs, and our Earnings Per Share.
| [1] | Non-PEO NEOs for fiscal year 2024 were A. Allen Arroyo Chief Financial Officer, Ryan McGrath Senior VP — Information Technology, Kara Conklin VP Franchise Development, and Donna Coupe VP Franchisee Support and Training. Non-PEO NEOs for fiscal year 2025 were Carrie Cass Chief Financial Officer and Ryan McGrath Senior VP — Operations. Non-PEO NEOs for fiscal year 2026 were Carrie Cass and Ryan McGrath. | ||||||||||||||||||||||||||||||||||||||||||||||||||||||||||||||||||||||||||||||||||||||||||||||||||||||||||||||||||||||||||||||||||||||||||||||||||||||||||||||||||||||||||||||||||||||||||||||||||||||||||||||||||||||||||||||||||||||||||||||||||||||||||||||||||||||||||||||||||||
| [2] | The amounts reported represent the “compensation actually paid” to our Non-PEO NEOs, computed in accordance with Item 402(v) of Regulation S-K, but do not reflect the actual amount of compensation earned by or paid to our Non-PEO NEOs in the applicable year. In accordance with Item 402(v) of Regulation S-K, the following adjustments were made to the amount reported for our principal in the “Total” column of the Summary Compensation Table for each year to calculate compensation actually paid. The amounts deducted or added in calculating the equity award adjustments are as follows: Average of Non-PEO NEOs:
|
||||||||||||||||||||||||||||||||||||||||||||||||||||||||||||||||||||||||||||||||||||||||||||||||||||||||||||||||||||||||||||||||||||||||||||||||||||||||||||||||||||||||||||||||||||||||||||||||||||||||||||||||||||||||||||||||||||||||||||||||||||||||||||||||||||||||||||||||||||
| [3] | The dollar amounts reported represent the amount of net income reflected in the Company’s audited financial statements for the applicable fiscal year. | ||||||||||||||||||||||||||||||||||||||||||||||||||||||||||||||||||||||||||||||||||||||||||||||||||||||||||||||||||||||||||||||||||||||||||||||||||||||||||||||||||||||||||||||||||||||||||||||||||||||||||||||||||||||||||||||||||||||||||||||||||||||||||||||||||||||||||||||||||||
| [4] | PEO 1: Robert Sarlls was the Chief Executive Officer in fiscal year 2023, effective as of effective as of May 9, 2022, until January 27, 2024). PEO 2: Starlette Johnson was the PEO in fiscal year 2024 and 2025 serving from January 27, 2024 to May 13, 2024. PEO 3: Jeffrey Geygan served as the PEO in fiscal year 2025 and 2026, effective from May 14, 2024. | ||||||||||||||||||||||||||||||||||||||||||||||||||||||||||||||||||||||||||||||||||||||||||||||||||||||||||||||||||||||||||||||||||||||||||||||||||||||||||||||||||||||||||||||||||||||||||||||||||||||||||||||||||||||||||||||||||||||||||||||||||||||||||||||||||||||||||||||||||||
| [5] | These amounts reflect compensation of Mr. Sarlls who was appointed the Company’s Chief Executive Officer effective May 9, 2022 until January 27, 2024. | ||||||||||||||||||||||||||||||||||||||||||||||||||||||||||||||||||||||||||||||||||||||||||||||||||||||||||||||||||||||||||||||||||||||||||||||||||||||||||||||||||||||||||||||||||||||||||||||||||||||||||||||||||||||||||||||||||||||||||||||||||||||||||||||||||||||||||||||||||||
| [6] | The amounts reported represent the sum of the amounts reported in the “Stock Awards” and “Option Awards” columns of the Summary Compensation Table for the applicable fiscal year. | ||||||||||||||||||||||||||||||||||||||||||||||||||||||||||||||||||||||||||||||||||||||||||||||||||||||||||||||||||||||||||||||||||||||||||||||||||||||||||||||||||||||||||||||||||||||||||||||||||||||||||||||||||||||||||||||||||||||||||||||||||||||||||||||||||||||||||||||||||||
| [7] | The amounts reported represent the “compensation actually paid” to PEOs, computed in accordance with Item 402(v) of Regulation S-K, but do not reflect the actual amount of compensation earned by or paid to PEOs in the applicable year. In accordance with Item 402(v) of Regulation S-K, the following adjustments were made to the amount reported for our principal in the “Total” column of the Summary Compensation Table for each year to calculate compensation actually paid. | ||||||||||||||||||||||||||||||||||||||||||||||||||||||||||||||||||||||||||||||||||||||||||||||||||||||||||||||||||||||||||||||||||||||||||||||||||||||||||||||||||||||||||||||||||||||||||||||||||||||||||||||||||||||||||||||||||||||||||||||||||||||||||||||||||||||||||||||||||||
| [8] | The equity award adjustments for each fiscal year include the following: (i) the addition (or subtraction, if applicable) of the year-end fair value of any equity awards granted in the year that are outstanding and unvested as of the end of the year; (ii) for any awards granted in prior years that are outstanding and unvested as of the end of the fiscal year, the addition (or subtraction, if applicable) of the change in fair value of between the end of the prior fiscal year and the end of the applicable fiscal year; (iii) for awards that are granted and vest in the same fiscal year, the addition of the fair value of such awards as of the vesting date; (iv) for awards granted in prior years that vest during the fiscal year, the addition (or subtraction, if applicable) of the change in fair value between the end of the prior fiscal year and the vesting date of such awards; (v) for awards granted in prior years that fail to meet the applicable vesting conditions during the fiscal year, the subtraction of the fair value of such awards at the end of the prior fiscal year; and (vi) the dollar value of any dividends or other earnings paid on such awards in the applicable year prior to the vesting date that are not otherwise reflected in the fair value of such award or included in any other component of the amount reported in the “Total” column of the Summary Compensation Table for the applicable year. The valuation assumptions used to calculate fair values did not materially differ from those disclosed at the time of grant. The amounts deducted or added in calculating the equity award adjustments are as follows: PEO 1:
PEO 2:
PEO 3:
____________ |
||||||||||||||||||||||||||||||||||||||||||||||||||||||||||||||||||||||||||||||||||||||||||||||||||||||||||||||||||||||||||||||||||||||||||||||||||||||||||||||||||||||||||||||||||||||||||||||||||||||||||||||||||||||||||||||||||||||||||||||||||||||||||||||||||||||||||||||||||||