| Factors Affecting Performance [Text Block] |
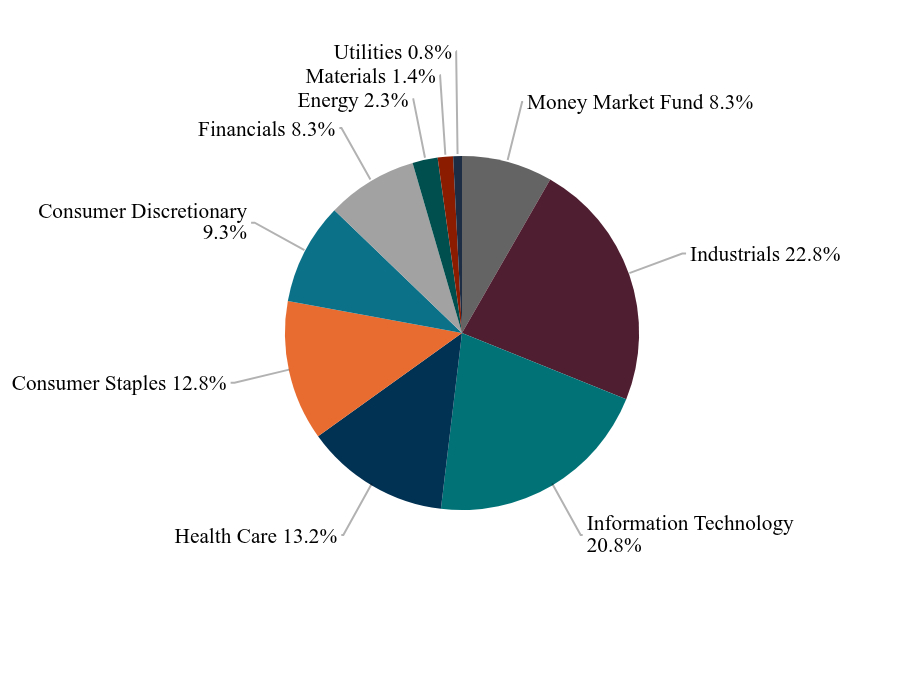
How did the Fund perform in the last year? We offer this annual report for the Monongahela All Cap Value Fund ("Fund") for the period from May 1, 2025 to April 30, 2026 (the “period”). During the period, the Fund was up 30.88%, while the S&P 500 Index (“S&P 500”) (an index of the 500 largest public companies in the US, weighted by market capitalization) was up 31.05%, and the Russell 2000 Value Index (an index that tracks the performance of small capitalization value companies) was up 46.34%. The Fund slightly underperformed its primary benchmark, the S&P 500, by 0.17%. The Fund was underweight in the Energy sector and the Communication sector relative to the S&P 500, both strong performers during the period. The Fund was overweight in the Consumer Staples sector and Consumer Discretionary sector relative to the S&P 500, both underperformers during the year. The Fund underperformed its secondary benchmark, the Russell 2000 Value Index. Overweight relative to the Russell 2000 Value Index in underperforming defensive sectors, primarily the Consumer Staples sector and Consumer Discretionary sector, and underweight in the Energy sector and Communication sector caused the Fund to lag the Russell 2000 Value Index. In addition, small capitalization stocks, which the Russell 2000 Value Index represents, in general outperformed mid capitalization stocks over the period. Two significant new positions were added: Sprout Farmers Market is one of the largest specialty retailers of fresh produce and natural foods. The stock has declined approximately 50% during the period and allowed us to purchase this very well managed growing company below our intrinsic value estimates. Teleflex Inc. is a medical technology company with a refocused emphasis on Vascular Access, Interventional, and Surgical markets. In December of 2025, the company announced the sale of three non-core divisions for $ 2 billion. We exited the following four positions: Hologic, which was acquired by Blackstone and TPG in a private transaction. Kimberly-Clark Corporation's proposed acquisition of Kenvue Inc. changed our risk profile of Kimberly-Clark Corporation Phillips 66 in the Energy sector exceeded our intrinsic value models and was sold. H&R Block Inc., whose strong franchise we believe is at risk of diminishing returns as technology efficiencies challenge their core business. |
| Line Graph [Table Text Block] |
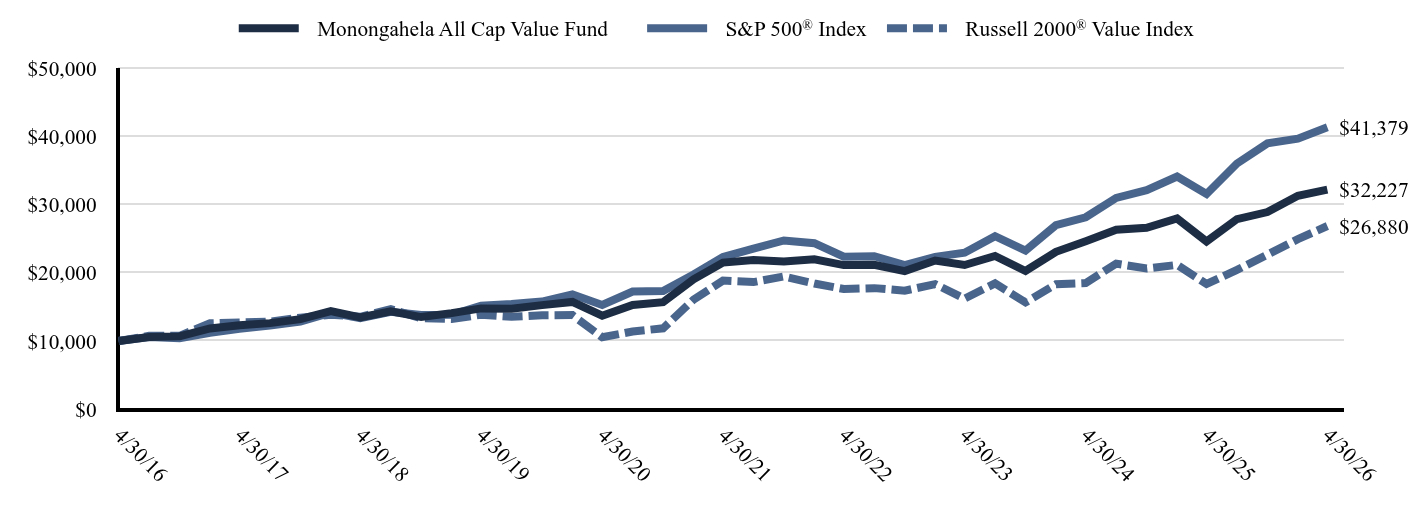 Table SummaryDate | Monongahela All Cap Value Fund | S&P 500® Index | Russell 2000® Value Index |
|---|
4/30/16 | $10,000 | $10,000 | $10,000 |
|---|
7/31/16 | $10,568 | $10,582 | $10,765 |
|---|
10/31/16 | $10,673 | $10,406 | $10,754 |
|---|
1/31/17 | $11,844 | $11,213 | $12,594 |
|---|
4/30/17 | $12,318 | $11,792 | $12,718 |
|---|
7/31/17 | $12,621 | $12,280 | $12,834 |
|---|
10/31/17 | $13,201 | $12,865 | $13,422 |
|---|
1/31/18 | $14,398 | $14,174 | $13,848 |
|---|
4/30/18 | $13,470 | $13,356 | $13,549 |
|---|
7/31/18 | $14,348 | $14,274 | $14,678 |
|---|
10/31/18 | $13,510 | $13,810 | $13,343 |
|---|
1/31/19 | $14,084 | $13,846 | $13,223 |
|---|
4/30/19 | $14,780 | $15,158 | $13,846 |
|---|
7/31/19 | $14,748 | $15,414 | $13,546 |
|---|
10/31/19 | $15,264 | $15,788 | $13,773 |
|---|
1/31/20 | $15,727 | $16,849 | $13,802 |
|---|
4/30/20 | $13,706 | $15,289 | $10,544 |
|---|
7/31/20 | $15,292 | $17,257 | $11,391 |
|---|
10/31/20 | $15,705 | $17,322 | $11,855 |
|---|
1/31/21 | $19,058 | $19,755 | $16,068 |
|---|
4/30/21 | $21,511 | $22,320 | $18,870 |
|---|
7/31/21 | $21,874 | $23,547 | $18,647 |
|---|
10/31/21 | $21,654 | $24,755 | $19,478 |
|---|
1/31/22 | $22,005 | $24,356 | $18,438 |
|---|
4/30/22 | $21,139 | $22,367 | $17,627 |
|---|
7/31/22 | $21,187 | $22,454 | $17,758 |
|---|
10/31/22 | $20,262 | $21,138 | $17,389 |
|---|
1/31/23 | $21,814 | $22,355 | $18,342 |
|---|
4/30/23 | $21,156 | $22,963 | $16,219 |
|---|
7/31/23 | $22,485 | $25,377 | $18,459 |
|---|
10/31/23 | $20,275 | $23,282 | $15,662 |
|---|
1/31/24 | $23,085 | $27,009 | $18,325 |
|---|
4/30/24 | $24,650 | $28,167 | $18,495 |
|---|
7/31/24 | $26,343 | $30,997 | $21,353 |
|---|
10/31/24 | $26,625 | $32,133 | $20,638 |
|---|
1/31/25 | $27,983 | $34,133 | $21,169 |
|---|
4/30/25 | $24,623 | $31,574 | $18,368 |
|---|
7/31/25 | $27,889 | $36,060 | $20,442 |
|---|
10/31/25 | $28,927 | $39,026 | $22,676 |
|---|
1/31/26 | $31,323 | $39,714 | $24,957 |
|---|
4/30/26 | $32,227 | $41,379 | $26,880 |
|---|
|