Shareholder Report
Apr. 30, 2026
USD ($)
Holding
semi-annual shareholder report
contains important information about the Ashmore Emerging Markets Total Return Fund (“Fund”)What were the Fund costs for the last six months?
(Based on a hypothetical $10,000 investment)
Fund (Class) | Costs of a $10,000 Investment | Costs paid as a percentage of a $10,000 investment |
| Ashmore Emerging Markets Total Return Fund (Class A/EMKAX) | $ 80 | 1.57 % |
Key Fund Statistics as of April 30, 2026
Fund net assets | $ 28,121,112 |
Total number of portfolio holdings | 275 |
Portfolio turnover rate | 21 % |
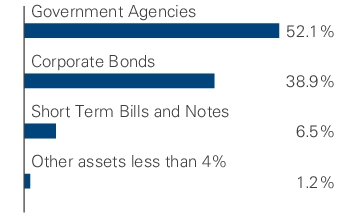
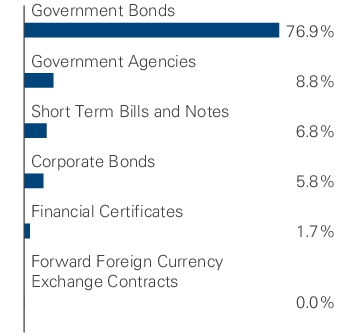
Graphical Representation of Holdings
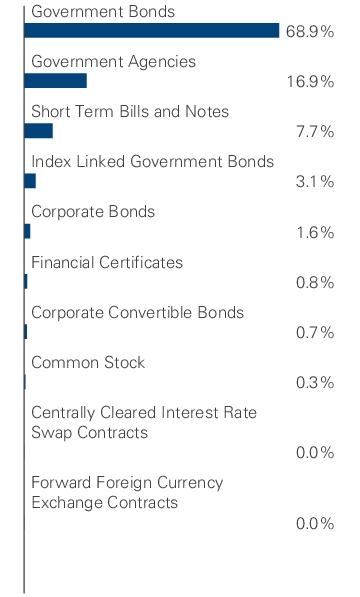
The tables below show the investment makeup of the Fund, representing the
percentage
of the total exposure of the Fund as of April 30, 202
6.ASSET TYPE ALLOCATION

What were the Fund costs for the last six months?
(Based on a hypothetical $10,000 investment)
Fund (Class) | Costs of a $10,000 Investment | Costs paid as a percentage of a $10,000 investment |
| Ashmore Emerging Markets Total Return Fund (Class C/EMKCX) | $ 120 | 2.36 % |
Key Fund Statistics as of April 30, 2026
Fund net assets | $ 28,121,112 |
Total number of portfolio holdings | 275 |
Portfolio turnover rate | 21 % |
Graphical Representation of Holdings
The tables below show the investment makeup of the Fund, representing the percentage of the total exposure of the Fund as of April 30,
2026
.ASSET TYPE ALLOCATION

What were the Fund costs for the last six months?
(Based on a hypothetical $10,000 investment)
Fund (Class) | Costs of a $10,000 Investment | Costs paid as a percentage of a $10,000 investment |
| Ashmore Emerging Markets Total Return Fund (Institutional Class/EMKIX) | $ 68 | 1.33 % |
Key Fund Statistics as of April 30, 2026
Fund net assets | $ 28,121,112 |
Total number of portfolio holdings | 275 |
Portfolio turnover rate | 21 % |
Graphical Representation of Holdings
The tables below show the investment makeup of the Fund, representing the percentage of the total exposure of the Fund as of April 30, 2026.
ASSET TYPE ALLOCATION
What were the Fund costs for the last six months?
(Based on a hypothetical $10,000 investment)
Fund (Class) | Costs of a $10,000 Investment | Costs paid as a percentage of a $10,000 investment |
| Ashmore Emerging Markets Local Currency Bond Fund (Class A/ELBAX) | $ 53 | 1.06 % |
Key Fund Statistics as of April 30, 2026
Fund net assets | $ 9,885,547 |
Total number of portfolio holdings | 201 |
Portfolio turnover rate | 38 % |
Graphical Representation of Holdings
The tables below show the investment makeup of the Fund, representing the percentage of the total exposure of the Fund as of April 30, 2026.
ASSET TYPE ALLOCATION
Material Fund Changes
On Emerging Markets Local Currency Bond Fund. The liquidation is expected to occur on or about June 26, 2026.
June 10, 2026
, the Board of Trustees approved the liquidation of the AshmoreWhat were the Fund costs for the last six months?
(Based on a hypothetical $10,000 investment)
Fund (Class) | Costs of a $10,000 Investment | Costs paid as a percentage of a $10,000 investment |
| Ashmore Emerging Markets Local Currency Bond Fund (Class C/ELBCX) | $ 92 | 1.83 % |
Key Fund Statistics as of April 30, 2026
Fund net assets | $ 9,885,547 |
Total number of portfolio holdings | 201 |
Portfolio turnover rate | 38 % |
Graphical Representation of Holdings
The tables below show the investment makeup of the Fund, representing the percentage of the total exposure of the Fund as of April 30, 2026.
ASSET TYPE ALLOCATION

Material Fund Changes
On June 10, 2026, the Board of Trustees approved the liquidation of the Ashmore Emerging Markets Local Currency Bond Fund. The liquidation is expected to occur on or about June 26, 2026.
What were the Fund costs for the last six months?
(Based on a hypothetical $10,000 investment)
Fund (Class) | Costs of a $10,000 Investment | Costs paid as a percentage of a $10,000 investment |
| Ashmore Emerging Markets Local Currency Bond Fund (Institutional Class/ELBIX) | $ 41 | 0.81 % |
Key Fund Statistics as of April 30, 2026
Fund net assets | $ 9,885,547 |
Total number of portfolio holdings | 201 |
Portfolio turnover rate | 38 % |
Graphical Representation of Holdings
The tables below show the investment makeup of the Fund, representing the percentage of the total exposure of the Fund as of April 30, 2026.
ASSET TYPE ALLOCATION

Material Fund Changes
On June 10, 2026, the Board of Trustees approved the liquidation of the Ashmore Emerging Markets Local Currency Bond Fund. The liquidation is expected to occur on or about June 26, 2026.
What were the Fund costs for the last six months?
(Based on a hypothetical $10,000 investment)
Fund (Class) | Costs of a $10,000 Investment | Costs paid as a percentage of a $10,000 investment |
| Ashmore Emerging Markets Corporate Income Fund (Class A/ECDAX) | $ 69 | 1.37 % |
Key Fund Statistics as of April 30, 2026
Fund net assets | $ 16,918,570 |
Total number of portfolio holdings | 117 |
Portfolio turnover rate | 36 % |
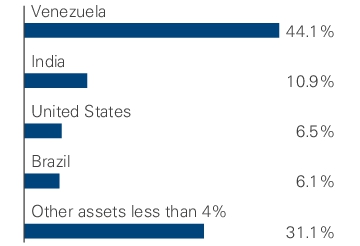
Graphical Representation of Holdings
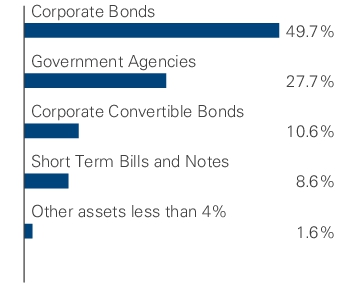
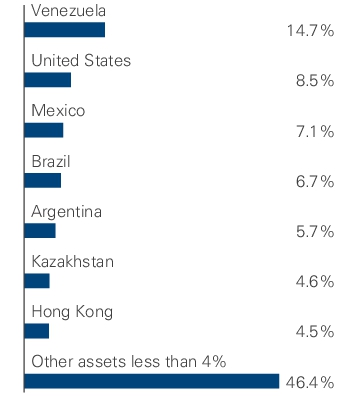
The tables below show the investment makeup of the Fund, representing the percentage of the total net assets of the Fund as of April 30, 2026.
ASSET TYPE ALLOCATION

GEOGRAPHICAL ALLOCATION

What were the Fund costs for the last six months?
(Based on a hypothetical $10,000 investment)
Fund (Class) | Costs of a $10,000 Investment | Costs paid as a percentage of a $10,000 investment |
| Ashmore Emerging Markets Corporate Income Fund (Class C/ECDCX) | $ 107 | 2.12 % |
Key Fund Statistics as of April 30, 2026
Fund net assets | $ 16,918,570 |
Total number of portfolio holdings | 117 |
Portfolio turnover rate | 36 % |
Graphical Representation of Holdings
The tables below show the investment makeup of the Fund, representing the percentage of the total net assets of the Fund as of April 30, 2026.
ASSET TYPE ALLOCATION

GEOGRAPHICAL ALLOCATION

What were the Fund costs for the last six months?
(Based on a hypothetical $10,000 investment)
Fund (Class) | Costs of a $10,000 Investment | Costs paid as a percentage of a $10,000 investment |
| Ashmore Emerging Markets Corporate Income Fund (Institutional Class/EMCIX) | $ 57 | 1.12 % |
Key Fund Statistics as of April 30, 2026
Fund net assets | $ 16,918,570 |
Total number of portfolio holdings | 117 |
Portfolio turnover rate | 36 % |
Graphical Representation of Holdings
The tables below show the investment makeup of the Fund, representing the percentage of the total net assets of the Fund as of April 30, 2026.
ASSET TYPE ALLOCATION
GEOGRAPHICAL
ALLOCATION
What were the Fund costs for the last six months?
(Based on a hypothetical $10,000 investment)
Fund (Class) | Costs of a $10,000 Investment | Costs paid as a percentage of a $10,000 investment |
| Ashmore Emerging Markets Short Duration Fund (Class A/ESFAX) | $ 93 | 1.85 % |
Key Fund Statistics as of April 30, 2026
Fund net assets | $ 29,112,696 |
Total number of portfolio holdings | 78 |
Portfolio turnover rate | 11 % |
Graphical Representation of Holdings
The tables below show the investment makeup of the Fund, representing the percentage of the total net assets of the Fund as of April 30, 2026.
ASSET TYPE ALLOCATION
GEOGRAPHICAL ALLOCATION

What were the Fund costs for the last six months?
(Based on a hypothetical $10,000 investment)
Fund (Class) | Costs of a $10,000 Investment | Costs paid as a percentage of a $10,000 investment |
| Ashmore Emerging Markets Short Duration Fund (Class C/ESFCX) | $ 131 | 2.62 % |
Key Fund Statistics as of April 30, 2026
Fund net assets | $ 29,112,696 |
Total number of portfolio holdings | 78 |
Portfolio turnover rate | 11 % |
Graphical Representation of Holdings
The tables below show the investment makeup of the Fund, representing the percentage of the total net assets of the Fund as of April 30, 2026.
ASSET TYPE ALLOCATION

GEOGRAPHICAL ALLOCATION
What were the Fund costs for the last six months?
(Based on a hypothetical $10,000 investment)
Fund (Class) | Costs of a $10,000 Investment | Costs paid as a percentage of a $10,000 investment |
| Ashmore Emerging Markets Short Duration Fund (Institutional Class/ESFIX) | $ 80 | 1.60 % |
Key Fund Statistics as of April 30, 2026
Fund net assets | $ 29,112,696 |
Total number of portfolio holdings | 78 |
Portfolio turnover rate | 11 % |
Graphical Representation of Holdings
The tables below show the investment makeup of the Fund, representing the percentage of the total net assets of the Fund as of April 30, 2026.
ASSET TYPE ALLOCATION

GEOGRAPHICAL ALLOCATION

What were the Fund costs for the last six months?
(Based on a hypothetical $10,000 investment)
Fund (Class) | Costs of a $10,000 Investment | Costs paid as a percentage of a $10,000 investment |
| Ashmore Emerging Markets Active Equity Fund (Class A/EMQAX) | $ 70 | 1.32 % |
Key Fund Statistics as of April 30, 2026
Fund net assets | $ 5,738,604 |
Total number of portfolio holdings | 54 |
Portfolio turnover rate | 106 % |
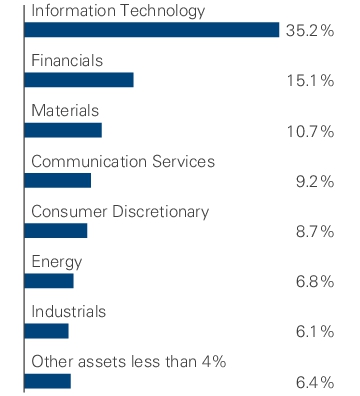
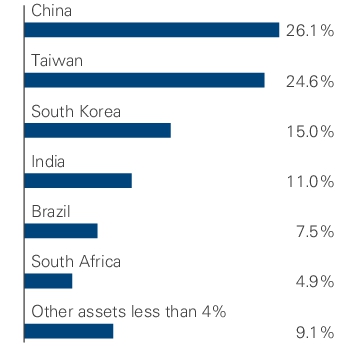
Graphical Representation of Holdings
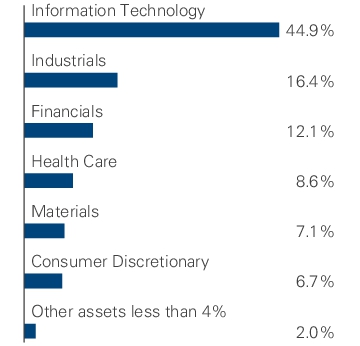
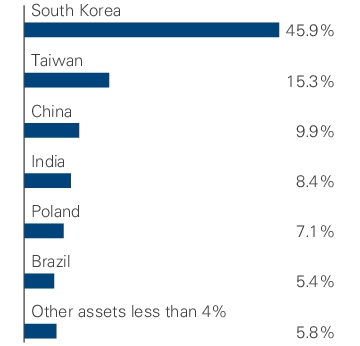
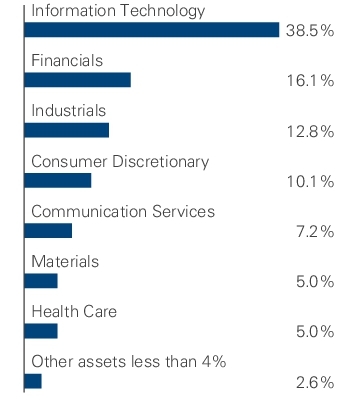
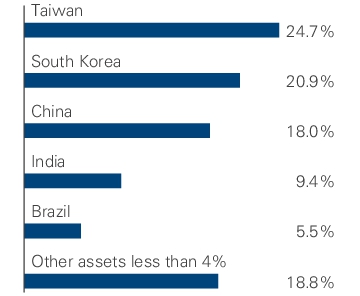
The tables below show the investment makeup of the Fund, representing the percentage of the total net assets of the Fund as of April 30, 2026.
TOP TEN HOLDINGS
| Taiwan Semiconductor Manufacturing Co. Ltd. | 15.7 % |
| Tencent Holdings Ltd. | 6.2 % |
| Delta Electronics, Inc. | 3.7 % |
| Alibaba Group Holding Ltd. | 3.4 % |
| SK Square Co. Ltd. | 2.9 % |
| Reliance Industries Ltd. | 2.8 % |
| ICICI Bank Ltd. ADR | 2.8 % |
| Petroleo Brasileiro S.A. - Petrobras ADR | 2.7 % |
| China International Capital Corp. Ltd., Class H | 2.6 % |
| Anglogold Ashanti PLC | 2.6 % |
INDUSTRY SECTOR ALLOCATION
GEOGRAPHICAL ALLOCATION
TOP TEN HOLDINGS
| Taiwan Semiconductor Manufacturing Co. Ltd. | 15.7 % |
| Tencent Holdings Ltd. | 6.2 % |
| Delta Electronics, Inc. | 3.7 % |
| Alibaba Group Holding Ltd. | 3.4 % |
| SK Square Co. Ltd. | 2.9 % |
| Reliance Industries Ltd. | 2.8 % |
| ICICI Bank Ltd. ADR | 2.8 % |
| Petroleo Brasileiro S.A. - Petrobras ADR | 2.7 % |
| China International Capital Corp. Ltd., Class H | 2.6 % |
| Anglogold Ashanti PLC | 2.6 % |
Material Fund Changes
On June 10, 2026, the Board of Trustees approved the liquidation of the Ashmore Emerging Markets Active Equity Fund. The liquidation is expected to occur on or about June 26, 2026.
What were the Fund costs for the last six months?
(Based on a hypothetical $10,000 investment)
Fund (Class) | Costs of a $10,000 Investment | Costs paid as a percentage of a $10,000 investment |
| Ashmore Emerging Markets Active Equity Fund (Class C/EMQCX) | $ 109 | 2.07 % |
Key Fund Statistics as of April 30, 2026
Fund net assets | $ 5,738,604 |
Total number of portfolio holdings | 54 |
Portfolio turnover rate | 106 % |
Graphical Representation of Holdings
The tables below show the investment makeup of the Fund, representing the percentage of the total net assets of the Fund as of April 30, 2026.
TOP TEN HOLDINGS
| Taiwan Semiconductor Manufacturing Co. Ltd. | 15.7 % |
| Tencent Holdings Ltd. | 6.2 % |
| Delta Electronics, Inc. | 3.7 % |
| Alibaba Group Holding Ltd. | 3.4 % |
| SK Square Co. Ltd. | 2.9 % |
| Reliance Industries Ltd. | 2.8 % |
| ICICI Bank Ltd. ADR | 2.8 % |
| Petroleo Brasileiro S.A. - Petrobras ADR | 2.7 % |
| China International Capital Corp. Ltd., Class H | 2.6 % |
| Anglogold Ashanti PLC | 2.6 % |
INDUSTRY SECTOR ALLOCATION

GEOGRAPHICAL ALLOCATION

TOP TEN HOLDINGS
| Taiwan Semiconductor Manufacturing Co. Ltd. | 15.7 % |
| Tencent Holdings Ltd. | 6.2 % |
| Delta Electronics, Inc. | 3.7 % |
| Alibaba Group Holding Ltd. | 3.4 % |
| SK Square Co. Ltd. | 2.9 % |
| Reliance Industries Ltd. | 2.8 % |
| ICICI Bank Ltd. ADR | 2.8 % |
| Petroleo Brasileiro S.A. - Petrobras ADR | 2.7 % |
| China International Capital Corp. Ltd., Class H | 2.6 % |
| Anglogold Ashanti PLC | 2.6 % |
Material Fund Changes
On June 10, 2026, the Board of Trustees approved the liquidation of the Ashmore Emerging Markets Active Equity Fund. The liquidation is expected to occur on or about June 26, 2026.
What were the Fund costs for the last six months?
(Based on a hypothetical $10,000 investment)
Fund (Class) | Costs of a $10,000 Investment | Costs paid as a percentage of a $10,000 investment |
| Ashmore Emerging Markets Active Equity Fund (Institutional Class/EMQIX) | $ 56 | 1.06 % |
Key Fund Statistics as of April 30, 2026
Fund net assets | $ 5,738,604 |
Total number of portfolio holdings | 54 |
Portfolio turnover rate | 106 % |
Graphical Representation of Holdings
The tables below show the investment makeup of the Fund, representing the percentage of the total net assets of the Fund as of April 30, 2026.
TOP TEN HOLDINGS
| Taiwan Semiconductor Manufacturing Co. Ltd. | 15.7 % |
| Tencent Holdings Ltd. | 6.2 % |
| Delta Electronics, Inc. | 3.7 % |
| Alibaba Group Holding Ltd. | 3.4 % |
| SK Square Co. Ltd. | 2.9 % |
| Reliance Industries Ltd. | 2.8 % |
| ICICI Bank Ltd. ADR | 2.8 % |
| Petroleo Brasileiro S.A. - Petrobras ADR | 2.7 % |
| China International Capital Corp. Ltd., Class H | 2.6 % |
| Anglogold Ashanti PLC | 2.6 % |
INDUSTRY SECTOR ALLOCATION

GEOGRAPHICAL ALLOCATION

TOP TEN HOLDINGS
| Taiwan Semiconductor Manufacturing Co. Ltd. | 15.7 % |
| Tencent Holdings Ltd. | 6.2 % |
| Delta Electronics, Inc. | 3.7 % |
| Alibaba Group Holding Ltd. | 3.4 % |
| SK Square Co. Ltd. | 2.9 % |
| Reliance Industries Ltd. | 2.8 % |
| ICICI Bank Ltd. ADR | 2.8 % |
| Petroleo Brasileiro S.A. - Petrobras ADR | 2.7 % |
| China International Capital Corp. Ltd., Class H | 2.6 % |
| Anglogold Ashanti PLC | 2.6 % |
Material Fund Changes
On June 10, 2026, the Board of Trustees approved the liquidation of the Ashmore Emerging Markets Active Equity Fund. The liquidation is expected to occur on or about June 26, 2026.
What were the Fund costs for the last six months?
(Based on a hypothetical $10,000 investment)
Fund (Class) | Costs of a $10,000 Investment | Costs paid as a percentage of a $10,000 investment |
| Ashmore Emerging Markets Equity SMA Completion Fund (Series I/EMSMX) * | $ 0 | 0.00 % |
* | Effective February 17, 2026, the Fund was restructured as a "completion fund," an integral part of separately managed account programs sponsored by an investment adviser unaffiliated with the Fund or Ashmore Investment Advisors Limited (the "Investment Manager"). Participants in these programs pay a fee to the sponsor of the program. Accordingly, no investment management fees or expenses are incurred by the Fund. |
Key Fund Statistics as of April 30, 2026
Fund net assets | $ 4,400,976 |
Total number of portfolio holdings | 32 |
Portfolio turnover rate | 108 % |
Graphical Representation of Holdings
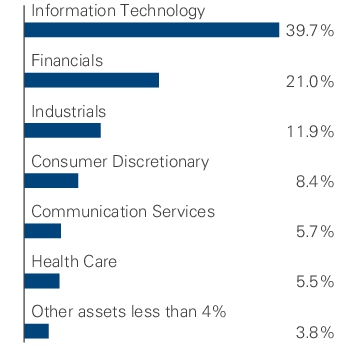
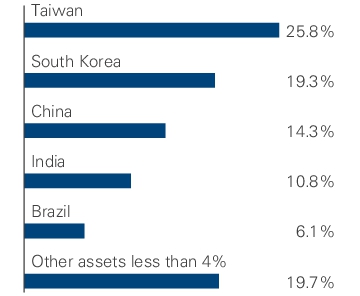
The tables below show the investment makeup of the Fund, representing the percentage of the total net assets of the Fund as of April 30, 2026.
TOP TEN HOLDINGS
| SK hynix, Inc. | 13.0 % |
| Samsung Electronics Co. Ltd. | 8.0 % |
| Samsung Electro-Mechanics Co. Ltd. | 5.9 % |
| SK Square Co. Ltd. | 4.7 % |
| Hansol Chemical Co. Ltd. | 3.7 % |
| Rede D'Or Sao Luiz S.A. | 3.4 % |
| Contemporary Amperex Technology Co. Ltd., Class A | 3.4 % |
| Elite Material Co. Ltd. | 3.3 % |
| Sieyuan Electric Co. Ltd., Class A | 3.2 % |
| Chroma ATE, Inc. | 3.1 % |
INDUSTRY SECTOR ALLOCATION
GEOGRAPHICAL ALLOCATION
TOP TEN HOLDINGS
| SK hynix, Inc. | 13.0 % |
| Samsung Electronics Co. Ltd. | 8.0 % |
| Samsung Electro-Mechanics Co. Ltd. | 5.9 % |
| SK Square Co. Ltd. | 4.7 % |
| Hansol Chemical Co. Ltd. | 3.7 % |
| Rede D'Or Sao Luiz S.A. | 3.4 % |
| Contemporary Amperex Technology Co. Ltd., Class A | 3.4 % |
| Elite Material Co. Ltd. | 3.3 % |
| Sieyuan Electric Co. Ltd., Class A | 3.2 % |
| Chroma ATE, Inc. | 3.1 % |
What were the Fund costs for the last six months?
(Based on a hypothetical $10,000 investment)
Fund (Class) | Costs of a $10,000 Investment | Costs paid as a percentage of a $10,000 investment |
| Ashmore Emerging Markets Frontier Equity Fund (Class A/EFEAX) | $ 92 | 1.81 % |
Key Fund Statistics as of April 30, 2026
Fund net assets | $ 106,413,528 |
Total number of portfolio holdings | 52 |
Portfolio turnover rate | 52 % |
Graphical Representation of Holdings
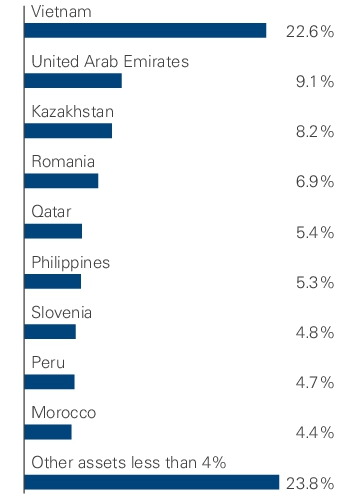
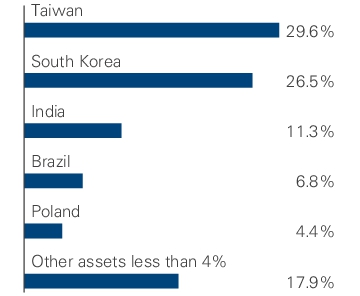
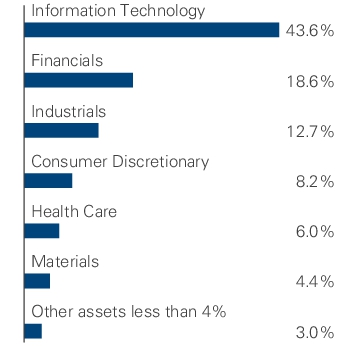
The tables below show the investment makeup of the Fund, representing the percentage of the total net assets of the Fund as of April 30, 2026.
TOP TEN HOLDINGS
| Banca Transilvania S.A. | 4.7 % |
| Halyk Savings Bank of Kazakhstan JSC GDR (Registered) | 4.6 % |
| Kaspi.KZ JSC ADR | 3.6 % |
| Credicorp Ltd. | 3.2 % |
| Vinhomes JSC | 3.0 % |
| Nova Ljubljanska Banka dd GDR (Registered) | 2.5 % |
| Qatar National Bank QPSC | 2.5 % |
| First Abu Dhabi Bank PJSC | 2.5 % |
| Attijariwafa Bank | 2.5 % |
| Vingroup JSC | 2.3 % |
INDUSTRY SECTOR ALLOCATION
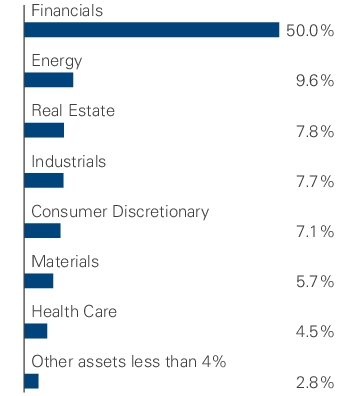
GEOGRAPHICAL ALLOCATION

TOP TEN HOLDINGS
| Banca Transilvania S.A. | 4.7 % |
| Halyk Savings Bank of Kazakhstan JSC GDR (Registered) | 4.6 % |
| Kaspi.KZ JSC ADR | 3.6 % |
| Credicorp Ltd. | 3.2 % |
| Vinhomes JSC | 3.0 % |
| Nova Ljubljanska Banka dd GDR (Registered) | 2.5 % |
| Qatar National Bank QPSC | 2.5 % |
| First Abu Dhabi Bank PJSC | 2.5 % |
| Attijariwafa Bank | 2.5 % |
| Vingroup JSC | 2.3 % |
What were the Fund costs for the last six months?
(Based on a hypothetical $10,000 investment)
Fund (Class) | Costs of a $10,000 Investment | Costs paid as a percentage of a $10,000 investment |
| Ashmore Emerging Markets Frontier Equity Fund (Class C/EFECX) | $ 130 | 2.56 % |
Key Fund Statistics as of April 30, 2026
Fund net assets | $ 106,413,528 |
Total number of portfolio holdings | 52 |
Portfolio turnover rate | 52 % |
Graphical Representation of Holdings
The tables below show the investment makeup of the Fund, representing the percentage of the total net assets of the Fund as of April 30, 2026.
TOP TEN HOLDINGS
| Banca Transilvania S.A. | 4.7 % |
| Halyk Savings Bank of Kazakhstan JSC GDR (Registered) | 4.6 % |
| Kaspi.KZ JSC ADR | 3.6 % |
| Credicorp Ltd. | 3.2 % |
| Vinhomes JSC | 3.0 % |
| Nova Ljubljanska Banka dd GDR (Registered) | 2.5 % |
| Qatar National Bank QPSC | 2.5 % |
| First Abu Dhabi Bank PJSC | 2.5 % |
| Attijariwafa Bank | 2.5 % |
| Vingroup JSC | 2.3 % |
INDUSTRY SECTOR ALLOCATION

GEOGRAPHICAL ALLOCATION
TOP TEN HOLDINGS
| Banca Transilvania S.A. | 4.7 % |
| Halyk Savings Bank of Kazakhstan JSC GDR (Registered) | 4.6 % |
| Kaspi.KZ JSC ADR | 3.6 % |
| Credicorp Ltd. | 3.2 % |
| Vinhomes JSC | 3.0 % |
| Nova Ljubljanska Banka dd GDR (Registered) | 2.5 % |
| Qatar National Bank QPSC | 2.5 % |
| First Abu Dhabi Bank PJSC | 2.5 % |
| Attijariwafa Bank | 2.5 % |
| Vingroup JSC | 2.3 % |
What were the Fund costs for the last six months?
(Based on a hypothetical $10,000 investment)
Fund (Class) | Costs of a $10,000 Investment | Costs paid as a percentage of a $10,000 investment |
| Ashmore Emerging Markets Frontier Equity Fund (Institutional Class/EFEIX) | $ 79 | 1.56 % |
Key Fund Statistics as of April 30, 2026
Fund net assets | $ 106,413,528 |
Total number of portfolio holdings | 52 |
Portfolio turnover rate | 52 % |
Graphical Representation of Holdings
The tables below show the investment makeup of the Fund, representing the percentage of the total net assets of the Fund as of April 30, 2026.
TOP TEN HOLDINGS
| Banca Transilvania S.A. | 4.7 % |
| Halyk Savings Bank of Kazakhstan JSC GDR (Registered) | 4.6 % |
| Kaspi.KZ JSC ADR | 3.6 % |
| Credicorp Ltd. | 3.2 % |
| Vinhomes JSC | 3.0 % |
| Nova Ljubljanska Banka dd GDR (Registered) | 2.5 % |
| Qatar National Bank QPSC | 2.5 % |
| First Abu Dhabi Bank PJSC | 2.5 % |
| Attijariwafa Bank | 2.5 % |
| Vingroup JSC | 2.3 % |
INDUSTRY SECTOR ALLOCATION

GEOGRAPHICAL ALLOCATION

TOP TEN HOLDINGS
| Banca Transilvania S.A. | 4.7 % |
| Halyk Savings Bank of Kazakhstan JSC GDR (Registered) | 4.6 % |
| Kaspi.KZ JSC ADR | 3.6 % |
| Credicorp Ltd. | 3.2 % |
| Vinhomes JSC | 3.0 % |
| Nova Ljubljanska Banka dd GDR (Registered) | 2.5 % |
| Qatar National Bank QPSC | 2.5 % |
| First Abu Dhabi Bank PJSC | 2.5 % |
| Attijariwafa Bank | 2.5 % |
| Vingroup JSC | 2.3 % |
What were the Fund costs for the last six months?
(Based on a hypothetical $10,000 investment)
Fund (Class) | Costs of a $10,000 Investment | Costs paid as a percentage of a $10,000 investment |
| Ashmore Emerging Markets Equity Fund (Class A/EMEAX) | $ 72 | 1.31 % |
Key Fund Statistics as of April 30, 2026
Fund net assets | $ 307,359,687 |
Total number of portfolio holdings | 68 |
Portfolio turnover rate | 39 % |
Graphical Representation of Holdings
The tables below show the investment makeup of the Fund, representing the percentage of the total net assets of the Fund as of April 30, 2026.
TOP TEN HOLDINGS
| Taiwan Semiconductor Manufacturing Co. Ltd. | 14.1 % |
| SK hynix, Inc. | 5.5 % |
| Tencent Holdings Ltd. | 5.4 % |
| HDFC Bank Ltd. ADR | 3.2 % |
| Samsung Electronics Co. Ltd. | 3.0 % |
| AIA Group Ltd. | 2.3 % |
| SK Square Co. Ltd. | 2.3 % |
| NetEase, Inc. ADR | 1.8 % |
| Rede D'Or Sao Luiz S.A. | 1.8 % |
| Hansol Chemical Co. Ltd. | 1.8 % |
INDUSTRY SECTOR ALLOCATION
GEOGRAPHICAL ALLOCATION

TOP TEN HOLDINGS
| Taiwan Semiconductor Manufacturing Co. Ltd. | 14.1 % |
| SK hynix, Inc. | 5.5 % |
| Tencent Holdings Ltd. | 5.4 % |
| HDFC Bank Ltd. ADR | 3.2 % |
| Samsung Electronics Co. Ltd. | 3.0 % |
| AIA Group Ltd. | 2.3 % |
| SK Square Co. Ltd. | 2.3 % |
| NetEase, Inc. ADR | 1.8 % |
| Rede D'Or Sao Luiz S.A. | 1.8 % |
| Hansol Chemical Co. Ltd. | 1.8 % |
What were the Fund costs for the last six months?
(Based on a hypothetical $10,000 investment)
Fund (Class) | Costs of a $10,000 Investment | Costs paid as a percentage of a $10,000 investment |
| Ashmore Emerging Markets Equity Fund (Class C/EMECX) | $ 112 | 2.06 % |
Key Fund Statistics as of April 30, 2026
Fund net assets | $ 307,359,687 |
Total number of portfolio holdings | 68 |
Portfolio turnover rate | 39 % |
Graphical Representation of Holdings
The tables below show the investment makeup of the Fund, representing the percentage of the total net assets of the Fund as of April 30, 2026.
TOP TEN HOLDINGS
| Taiwan Semiconductor Manufacturing Co. Ltd. | 14.1 % |
| SK hynix, Inc. | 5.5 % |
| Tencent Holdings Ltd. | 5.4 % |
| HDFC Bank Ltd. ADR | 3.2 % |
| Samsung Electronics Co. Ltd. | 3.0 % |
| AIA Group Ltd. | 2.3 % |
| SK Square Co. Ltd. | 2.3 % |
| NetEase, Inc. ADR | 1.8 % |
| Rede D'Or Sao Luiz S.A. | 1.8 % |
| Hansol Chemical Co. Ltd. | 1.8 % |
INDUSTRY SECTOR ALLOCATION

GEOGRAPHICAL ALLOCATION
TOP TEN HOLDINGS
| Taiwan Semiconductor Manufacturing Co. Ltd. | 14.1 % |
| SK hynix, Inc. | 5.5 % |
| Tencent Holdings Ltd. | 5.4 % |
| HDFC Bank Ltd. ADR | 3.2 % |
| Samsung Electronics Co. Ltd. | 3.0 % |
| AIA Group Ltd. | 2.3 % |
| SK Square Co. Ltd. | 2.3 % |
| NetEase, Inc. ADR | 1.8 % |
| Rede D'Or Sao Luiz S.A. | 1.8 % |
| Hansol Chemical Co. Ltd. | 1.8 % |
What were the Fund costs for the last six months?
(Based on a hypothetical $10,000 investment)
Fund (Class) | Costs of a $10,000 Investment | Costs paid as a percentage of a $10,000 investment |
| Ashmore Emerging Markets Equity Fund (Institutional Class/EMFIX) | $ 58 | 1.06 % |
Key Fund Statistics as of April 30, 2026
Fund net assets | $ 307,359,687 |
Total number of portfolio holdings | 68 |
Portfolio turnover rate | 39 % |
Graphical Representation of Holdings
The tables below show the investment makeup of the Fund, representing the percentage of the total net assets of the Fund as of April 30, 2026.
TOP TEN HOLDINGS
| Taiwan Semiconductor Manufacturing Co. Ltd. | 14.1 % |
| SK hynix, Inc. | 5.5 % |
| Tencent Holdings Ltd. | 5.4 % |
| HDFC Bank Ltd. ADR | 3.2 % |
| Samsung Electronics Co. Ltd. | 3.0 % |
| AIA Group Ltd. | 2.3 % |
| SK Square Co. Ltd. | 2.3 % |
| NetEase, Inc. ADR | 1.8 % |
| Rede D'Or Sao Luiz S.A. | 1.8 % |
| Hansol Chemical Co. Ltd. | 1.8 % |
INDUSTRY SECTOR ALLOCATION

GEOGRAPHICAL ALLOCATION

TOP TEN HOLDINGS
| Taiwan Semiconductor Manufacturing Co. Ltd. | 14.1 % |
| SK hynix, Inc. | 5.5 % |
| Tencent Holdings Ltd. | 5.4 % |
| HDFC Bank Ltd. ADR | 3.2 % |
| Samsung Electronics Co. Ltd. | 3.0 % |
| AIA Group Ltd. | 2.3 % |
| SK Square Co. Ltd. | 2.3 % |
| NetEase, Inc. ADR | 1.8 % |
| Rede D'Or Sao Luiz S.A. | 1.8 % |
| Hansol Chemical Co. Ltd. | 1.8 % |
What were the Fund costs for the last six months?
(Based on a hypothetical $10,000 investment)
Fund (Class) | Costs of a $10,000 Investment | Costs paid as a percentage of a $10,000 investment |
| Ashmore Emerging Markets Equity ESG Fund (Class A/ESAGX) | $ 74 | 1.27 % |
Key Fund Statistics as of April 30, 2026
Fund net assets | $ 19,375,982 |
Total number of portfolio holdings | 50 |
Portfolio turnover rate | 30 % |
Graphical Representation of Holdings
The tables below show the investment makeup of the Fund, representing the percentage of the total net assets of the Fund as of April 30, 2026.
TOP TEN HOLDINGS
| Taiwan Semiconductor Manufacturing Co. Ltd. | 15.4 % |
| Tencent Holdings Ltd. | 5.7 % |
| SK hynix, Inc. | 5.5 % |
| HDFC Bank Ltd. ADR | 3.8 % |
| AIA Group Ltd. | 3.8 % |
| Samsung Electronics Co. Ltd. | 3.7 % |
| SK Square Co. Ltd. | 3.0 % |
| Contemporary Amperex Technology Co. Ltd., Class A | 2.7 % |
| DB Insurance Co. Ltd. | 2.2 % |
| Rede D'Or Sao Luiz S.A. | 2.1 % |
INDUSTRY SECTOR ALLOCATION

GEOGRAPHICAL ALLOCATION

TOP TEN HOLDINGS
| Taiwan Semiconductor Manufacturing Co. Ltd. | 15.4 % |
| Tencent Holdings Ltd. | 5.7 % |
| SK hynix, Inc. | 5.5 % |
| HDFC Bank Ltd. ADR | 3.8 % |
| AIA Group Ltd. | 3.8 % |
| Samsung Electronics Co. Ltd. | 3.7 % |
| SK Square Co. Ltd. | 3.0 % |
| Contemporary Amperex Technology Co. Ltd., Class A | 2.7 % |
| DB Insurance Co. Ltd. | 2.2 % |
| Rede D'Or Sao Luiz S.A. | 2.1 % |
What were the Fund costs for the last six months?
(Based on a hypothetical $10,000 investment)
Fund (Class) | Costs of a $10,000 Investment | Costs paid as a percentage of a $10,000 investment |
| Ashmore Emerging Markets Equity ESG Fund (Class C/ESCGX) | $ 118 | 2.02 % |
Key Fund Statistics as of April 30, 2026
Fund net assets | $ 19,375,982 |
Total number of portfolio holdings | 50 |
Portfolio turnover rate | 30 % |
Graphical Representation of Holdings
The tables below show the investment makeup of the Fund, representing the percentage of the total net assets of the Fund as of April 30, 2026.
TOP TEN HOLDINGS
| Taiwan Semiconductor Manufacturing Co. Ltd. | 15.4 % |
| Tencent Holdings Ltd. | 5.7 % |
| SK hynix, Inc. | 5.5 % |
| HDFC Bank Ltd. ADR | 3.8 % |
| AIA Group Ltd. | 3.8 % |
| Samsung Electronics Co. Ltd. | 3.7 % |
| SK Square Co. Ltd. | 3.0 % |
| Contemporary Amperex Technology Co. Ltd., Class A | 2.7 % |
| DB Insurance Co. Ltd. | 2.2 % |
| Rede D'Or Sao Luiz S.A. | 2.1 % |
INDUSTRY SECTOR ALLOCATION
GEOGRAPHICAL ALLOCATION

TOP TEN HOLDINGS
| Taiwan Semiconductor Manufacturing Co. Ltd. | 15.4 % |
| Tencent Holdings Ltd. | 5.7 % |
| SK hynix, Inc. | 5.5 % |
| HDFC Bank Ltd. ADR | 3.8 % |
| AIA Group Ltd. | 3.8 % |
| Samsung Electronics Co. Ltd. | 3.7 % |
| SK Square Co. Ltd. | 3.0 % |
| Contemporary Amperex Technology Co. Ltd., Class A | 2.7 % |
| DB Insurance Co. Ltd. | 2.2 % |
| Rede D'Or Sao Luiz S.A. | 2.1 % |
What were the Fund costs for the last six months?
(Based on a hypothetical $10,000 investment)
Fund (Class) | Costs of a $10,000 Investment | Costs paid as a percentage of a $10,000 investment |
| Ashmore Emerging Markets Equity ESG Fund (Institutional Class/ESIGX) | $ 62 | 1.06 % |
Key Fund Statistics as of April 30, 2026
Fund net assets | $ 19,375,982 |
Total number of portfolio holdings | 50 |
Portfolio turnover rate | 30 % |
Graphical Representation of Holdings
The tables below show the investment makeup of the Fund, representing the percentage of the total net assets of the Fund as of April 30, 2026.
TOP TEN HOLDINGS
| Taiwan Semiconductor Manufacturing Co. Ltd. | 15.4 % |
| Tencent Holdings Ltd. | 5.7 % |
| SK hynix, Inc. | 5.5 % |
| HDFC Bank Ltd. ADR | 3.8 % |
| AIA Group Ltd. | 3.8 % |
| Samsung Electronics Co. Ltd. | 3.7 % |
| SK Square Co. Ltd. | 3.0 % |
| Contemporary Amperex Technology Co. Ltd., Class A | 2.7 % |
| DB Insurance Co. Ltd. | 2.2 % |
| Rede D'Or Sao Luiz S.A. | 2.1 % |
INDUSTRY SECTOR ALLOCATION

GEOGRAPHICAL ALLOCATION
TOP TEN HOLDINGS
| Taiwan Semiconductor Manufacturing Co. Ltd. | 15.4 % |
| Tencent Holdings Ltd. | 5.7 % |
| SK hynix, Inc. | 5.5 % |
| HDFC Bank Ltd. ADR | 3.8 % |
| AIA Group Ltd. | 3.8 % |
| Samsung Electronics Co. Ltd. | 3.7 % |
| SK Square Co. Ltd. | 3.0 % |
| Contemporary Amperex Technology Co. Ltd., Class A | 2.7 % |
| DB Insurance Co. Ltd. | 2.2 % |
| Rede D'Or Sao Luiz S.A. | 2.1 % |
What were the Fund costs for the last six months?
(Based on a hypothetical $10,000 investment)
Fund (Class) | Costs of a $10,000 Investment | Costs paid as a percentage of a $10,000 investment |
| Ashmore Emerging Markets Debt Fund (Class A/IGAEX) | $ 53 | 1.05 % |
Key Fund Statistics as of April 30, 2026
Fund net assets | $ 11,696,965 |
Total number of portfolio holdings | 102 |
Portfolio turnover rate | 11 % |
Graphical Representation of Holdings
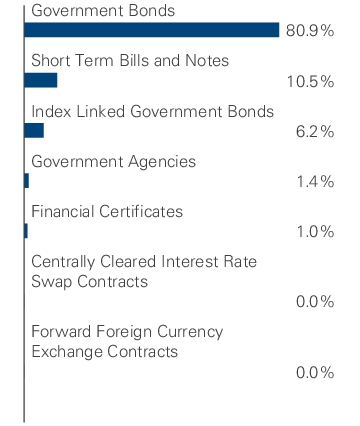
The tables below show the investment makeup of the Fund, representing the percentage of the total exposure of the Fund as of April 30, 2026.
ASSET TYPE ALLOCATION

What were the Fund costs for the last six months?
(Based on a hypothetical $10,000 investment)
Fund (Class) | Costs of a $10,000 Investment | Costs paid as a percentage of a $10,000 investment |
| Ashmore Emerging Markets Debt Fund (Class C/IGCEX) | $ 91 | 1.80 % |
Key Fund Statistics as of April 30, 2026
Fund net assets | $ 11,696,965 |
Total number of portfolio holdings | 102 |
Portfolio turnover rate | 11 % |
Graphical Representation of Holdings
The tables below show the investment makeup of the Fund, representing the percentage of the total exposure of the Fund as of April 30, 2026.
ASSET TYPE ALLOCATION
What were the Fund costs for the last six months?
(Based on a hypothetical $10,000 investment)
Fund (Class) | Costs of a $10,000 Investment | Costs paid as a percentage of a $10,000 investment |
| Ashmore Emerging Markets Debt Fund (Institutional Class/IGIEX) | $ 40 | 0.78 % |
Key Fund Statistics as of April 30, 2026
Fund net assets | $ 11,696,965 |
Total number of portfolio holdings | 102 |
Portfolio turnover rate | 11 % |
Graphical Representation of Holdings
The tables below show the investment makeup of the Fund, representing the percentage of the total exposure of the Fund as of April 30, 2026.
ASSET TYPE ALLOCATION

What were the Fund costs for the last six months?
(Based on a hypothetical $10,000 investment)
Fund (Class) | Costs of a $10,000 Investment | Costs paid as a percentage of a $10,000 investment |
| Ashmore Emerging Markets Equity ex China Fund (Class A/EMXAX) | $ 73 | 1.27 % |
Key Fund Statistics as of April 30, 2026
Fund net assets | $ 12,336,703 |
Total number of portfolio holdings | 57 |
Portfolio turnover rate | 34 % |
Graphical Representation of Holdings
The tables below show the investment makeup of the Fund, representing the percentage of the total net assets of the Fund as of April 30, 2026.
TOP TEN HOLDINGS
| Taiwan Semiconductor Manufacturing Co. Ltd. | 14.9 % |
| SK Square Co. Ltd. | 4.7 % |
| Samsung Electronics Co. Ltd. | 4.5 % |
| SK hynix, Inc. | 4.4 % |
| HDFC Bank Ltd. ADR | 3.7 % |
| Hansol Chemical Co. Ltd. | 2.3 % |
| Rede D'Or Sao Luiz S.A. | 2.3 % |
| Lotes Co. Ltd. | 2.0 % |
| DB Insurance Co. Ltd. | 1.8 % |
| Allegro.eu S.A. | 1.8 % |
INDUSTRY SECTOR ALLOCATION

GEOGRAPHICAL ALLOCATION
TOP TEN HOLDINGS
| Taiwan Semiconductor Manufacturing Co. Ltd. | 14.9 % |
| SK Square Co. Ltd. | 4.7 % |
| Samsung Electronics Co. Ltd. | 4.5 % |
| SK hynix, Inc. | 4.4 % |
| HDFC Bank Ltd. ADR | 3.7 % |
| Hansol Chemical Co. Ltd. | 2.3 % |
| Rede D'Or Sao Luiz S.A. | 2.3 % |
| Lotes Co. Ltd. | 2.0 % |
| DB Insurance Co. Ltd. | 1.8 % |
| Allegro.eu S.A. | 1.8 % |
What were the Fund costs for the last six months?
(Based on a hypothetical $10,000 investment)
Fund (Class) | Costs of a $10,000 Investment | Costs paid as a percentage of a $10,000 investment |
| Ashmore Emerging Markets Equity ex China Fund (Class C/EMXCX) | $ 115 | 2.02 % |
Key Fund Statistics as of April 30, 2026
Fund net assets | $ 12,336,703 |
Total number of portfolio holdings | 57 |
Portfolio turnover rate | 34 % |
Graphical Representation of Holdings
The tables below show the investment makeup of the Fund, representing the percentage of the total net assets of the Fund as of April 30, 2026.
TOP TEN HOLDINGS
| Taiwan Semiconductor Manufacturing Co. Ltd. | 14.9 % |
| SK Square Co. Ltd. | 4.7 % |
| Samsung Electronics Co. Ltd. | 4.5 % |
| SK hynix, Inc. | 4.4 % |
| HDFC Bank Ltd. ADR | 3.7 % |
| Hansol Chemical Co. Ltd. | 2.3 % |
| Rede D'Or Sao Luiz S.A. | 2.3 % |
| Lotes Co. Ltd. | 2.0 % |
| DB Insurance Co. Ltd. | 1.8 % |
| Allegro.eu S.A. | 1.8 % |
INDUSTRY SECTOR ALLOCATION
GEOGRAPHICAL ALLOCATION

TOP TEN HOLDINGS
| Taiwan Semiconductor Manufacturing Co. Ltd. | 14.9 % |
| SK Square Co. Ltd. | 4.7 % |
| Samsung Electronics Co. Ltd. | 4.5 % |
| SK hynix, Inc. | 4.4 % |
| HDFC Bank Ltd. ADR | 3.7 % |
| Hansol Chemical Co. Ltd. | 2.3 % |
| Rede D'Or Sao Luiz S.A. | 2.3 % |
| Lotes Co. Ltd. | 2.0 % |
| DB Insurance Co. Ltd. | 1.8 % |
| Allegro.eu S.A. | 1.8 % |
What were the Fund costs for the last six months?
(Based on a hypothetical $10,000 investment)
Fund (Class) | Costs of a $10,000 Investment | Costs paid as a percentage of a $10,000 investment |
| Ashmore Emerging Markets Equity ex China Fund (Institutional Class/EMXIX) | $ 61 | 1.06 % |
Key Fund Statistics as of April 30, 2026
Fund net assets | $ 12,336,703 |
Total number of portfolio holdings | 57 |
Portfolio turnover rate | 34 % |
Graphical Representation of Holdings
The tables below show the investment makeup of the Fund, representing the percentage of the total net assets of the Fund as of April 30, 2026.
TOP TEN HOLDINGS
| Taiwan Semiconductor Manufacturing Co. Ltd. | 14.9 % |
| SK Square Co. Ltd. | 4.7 % |
| Samsung Electronics Co. Ltd. | 4.5 % |
| SK hynix, Inc. | 4.4 % |
| HDFC Bank Ltd. ADR | 3.7 % |
| Hansol Chemical Co. Ltd. | 2.3 % |
| Rede D'Or Sao Luiz S.A. | 2.3 % |
| Lotes Co. Ltd. | 2.0 % |
| DB Insurance Co. Ltd. | 1.8 % |
| Allegro.eu S.A. | 1.8 % |
INDUSTRY SECTOR ALLOCATION

GEOGRAPHICAL ALLOCATION

TOP TEN HOLDINGS
| Taiwan Semiconductor Manufacturing Co. Ltd. | 14.9 % |
| SK Square Co. Ltd. | 4.7 % |
| Samsung Electronics Co. Ltd. | 4.5 % |
| SK hynix, Inc. | 4.4 % |
| HDFC Bank Ltd. ADR | 3.7 % |
| Hansol Chemical Co. Ltd. | 2.3 % |
| Rede D'Or Sao Luiz S.A. | 2.3 % |
| Lotes Co. Ltd. | 2.0 % |
| DB Insurance Co. Ltd. | 1.8 % |
| Allegro.eu S.A. | 1.8 % |
| [1] | Effective February 17, 2026, the Fund was restructured as a "completion fund," an integral part of separately managed account programs sponsored by an investment adviser unaffiliated with the Fund or Ashmore Investment Advisors Limited (the "Investment Manager"). Participants in these programs pay a fee to the sponsor of the program. Accordingly, no investment management fees or expenses are incurred by the Fund. |