, 2026
Dear Corteva Stockholder:
On October 1, 2025, we announced that our board of directors unanimously approved a plan to separate Corteva, Inc. (“Corteva”) into two independent, publicly traded companies through the separation of our seed operating segment into an independent, publicly traded company, Vylor Inc. (“Vylor”), and the distribution to Corteva stockholders of all of the then issued and outstanding shares of common stock of Vylor (the “spin-off”).
Upon completion of the spin-off, Corteva will continue to operate its crop protection operating segment as a pure-play, fit-for-purpose market leader in differentiated, innovative agricultural solutions, including biologicals and other nature-based products. Vylor will hold Corteva’s seed business, including its global growth platforms in licensing, gene editing, hybrid wheat, and biofuels. Vylor will be a focused, leading global provider of mission-critical, highly innovative seed solutions well-positioned to accelerate organic growth in its large and attractive end markets, benefit from favorable secular trends, and apply its proven processes to drive growth through new product development and commercial excellence. Both Corteva and Vylor are expected to have a strong, well-capitalized balance sheet underpinning a flexible capital deployment strategy focused on supporting their respective strategic growth objectives, while returning cash to stockholders through dividend payments.
We believe Corteva and Vylor will each be better positioned as stand-alone companies focused on their respective industries, and to attract a stockholder base aligned with their respective value propositions and capital allocation strategies. Consequently, we believe that the long-term value for our stockholders will be enhanced as a result of separating our current agriculture business into two independent, publicly traded companies which will be market leaders in their respective industries.
The spin-off will be effected through a pro rata distribution of all of the outstanding shares of Vylor common stock to Corteva stockholders in a transaction that is intended to be tax-free to Corteva stockholders for U.S. federal income tax purposes. Each Corteva stockholder will receive share[s] of Vylor common stock for every share[s] of Corteva common stock held as of the close of business on , 2026, the record date for the distribution of the shares of common stock of Vylor. Stockholder approval of the spin-off is not required, and you do not need to take any action to receive the shares of Vylor common stock to which you are entitled as a Corteva stockholder. In addition, you do not need to pay any consideration or surrender or exchange your existing shares of Corteva common stock in order to receive shares of Vylor common stock.
We expect Vylor common stock to be approved for listing on the New York Stock Exchange (“NYSE”) under the ticker symbol “ .” Following the spin-off, Corteva common stock will continue to trade on the NYSE under the existing ticker symbol, “CTVA.”
I encourage you to carefully read the attached information statement, which is being made available to all holders of Corteva common stock as of the close of business on , 2026. The information statement describes the spin-off and contains important business and financial information about Corteva and Vylor.
We believe that creating two independent companies provides significant opportunities for our businesses as we continue to build long-term value for our stockholders. We appreciate your continuing support of Corteva and look forward to your support of Vylor in the future.
|
|
Sincerely, |
|
|
|
Gregory R. Page |
|
Chair of the Board of Directors |
|
Corteva, Inc. |
|
, 2026
Dear Future Vylor Stockholder:
I am delighted to welcome you as a future stockholder of our company, Vylor, which will soon begin operating independently as a focused, leading global seed producer utilizing cutting-edge technology, including advanced genetics and proprietary traits that increase yield, sustainability, and crop health.
Vylor’s business has a long heritage of success, including its Pioneer seed brand, which celebrated its 100th anniversary this year. Today, we have an attractive financial profile as a result of our unique route to market and yield-advancing technologies, which are mission-critical in nature to farmers. This profile has supported our strong track record of expanding our business and margins by providing farmers industry leading technological advancements with top-performing yield and disease resistance that offer significant value to farmers.
Following the spin-off, Vylor will have a focused business mix and structure that we believe will permit us to drive stockholder value by focusing on our growth platforms, and aligning and optimizing our innovation, business and capital allocation strategies. We are confident in our ability to create value for many reasons, including the following:
|
|
|
|
|
• |
|
Grow new and existing revenue streams. Building on the successful century-long track record of our iconic Pioneer brand with its unique direct-to-farmer business model and breeding platform, Vylor will have the ability to unlock transformational demand via seed licensing arrangements in corn and soybeans, a market we estimate represents $4 billion in annual revenue across corn and soybeans in the Americas. Additionally, Vylor will be well-positioned to drive our revenue focus beyond our core germplasm and trait yield improvements through its growth platforms and emerging technologies, including gene editing, hybrid wheat and biofuels, as well as with the broad-based application of artificial intelligence. |
|
|
|
|
|
• |
|
Accelerating innovation. Our business has a long history and culture of innovation, and the rate of innovation has accelerated across our business, strengthening our competitive position. Our technology and focus on developing products that produce more and that can respond to changing growing conditions has made Vylor a technological leader in our industry. As an independent company, Vylor will accelerate innovation by leveraging its world-class plant breeding capabilities to drive germplasm innovation and harnessing its gene editing expertise to transform its portfolio and the industry. |
|
|
|
|
|
• |
|
Opportunities for acquisitions. Vylor will be well-positioned to capitalize on a deep pipeline of attractive acquisition opportunities in core and adjacent markets to accelerate growth, and we expect that value accretive acquisitions will continue to be an important part of our growth strategy as we work to actively strengthen our technological capabilities and to increase our presence in new, attractive end markets. |
|
|
|
|
|
• |
|
Proven leadership team. Vylor’s senior leadership team is intimately familiar with, and has many years of experience managing Vylor's business. We have demonstrated that we can deliver, and we have worked together to drive results through numerous challenges. |
We encourage you to learn more about us and our value enhancing strategic initiatives by reading the attached information statement. We hope it conveys our excitement and allows you to understand our plans to stand and spin Vylor successfully this year. We look forward to our future as an independent, publicly traded company and thank you in advance for your support as a future stockholder of Vylor.
|
|
Sincerely, |
|
|
|
Charles V. Magro |
|
Chief Executive Officer |
|
Information contained herein is subject to completion or amendment. A Registration Statement on Form 10 relating to these securities has been filed with the U.S. Securities and Exchange Commission under the U.S. Securities Exchange Act of 1934, as amended.
PRELIMINARY AND SUBJECT TO COMPLETION, DATED , 2026
INFORMATION STATEMENT
Vylor Inc.
Common Stock, Par Value $0.01 Per Share
This information statement is being furnished to the holders of common stock of Corteva, Inc. (“Corteva”) in connection with the distribution of shares of common stock of Vylor Inc. (“Vylor”). Vylor is a wholly-owned subsidiary of Corteva that, at the time of the distribution, will hold the Seed Business (as defined herein). Corteva will distribute to Corteva stockholders all of the then issued and outstanding shares of Vylor common stock on a pro rata basis. This distribution is subject to certain conditions, as set forth in this information statement.
Vylor is organized as a corporation under the laws of the State of Delaware.
For every share[s] of Corteva common stock held of record by you as of the close of business on , 2026, the record date for the distribution, you are entitled to receive share[s] of Vylor common stock. No fractional shares of Vylor common stock will be issued. Instead, to the extent you are entitled to any fractional shares, you will receive cash in lieu of such fractional shares. As discussed under “The Spin-Off—Trading Between the Record Date and Distribution Date,” if you sell your Corteva common stock in the “regular-way” market after the record date and before the distribution, you will also be selling your right to receive shares of Vylor common stock in connection with the distribution. We expect the shares of Corteva common stock to be distributed by Corteva to you on , 2026. We refer to the date of distribution of Vylor common stock as the “distribution date.” After the distribution, we will be an independent, publicly traded company.
No vote of Corteva stockholders is required to effect the spin-off (as defined herein). Therefore, you are not being asked for a proxy to vote on the spin-off, and you are requested not to send us a proxy. You do not need to pay any consideration, exchange or surrender your existing shares of Corteva common stock or take any other action to receive your shares of Vylor common stock. Until the distribution occurs, Vylor will be a wholly-owned subsidiary of Corteva, and consequently, Corteva will have the sole and absolute discretion to determine and/or change the terms of the spin-off (or to terminate the spin-off).
The spin-off is intended to be tax-free to Corteva stockholders for United States federal income tax purposes, except for cash received in lieu of fractional shares. The spin-off is subject to the satisfaction or waiver by Corteva of certain conditions, including the receipt of the opinions of Cravath, Swaine & Moore LLP and Ernst & Young LLP confirming that the distribution and certain transactions entered into in connection with the spin-off generally will be tax-free to Corteva and its stockholders for U.S. federal income tax purposes, except for cash received in lieu of fractional shares. Cash received in lieu of any fractional shares of Corteva common stock will generally be taxable to you.
Corteva currently owns all the outstanding shares of Vylor. Accordingly, there is no current trading market for Vylor common stock, although we expect that a limited market, commonly known as a “when-issued” trading market, will develop as early as the trading day prior to the record date for the distribution, and we expect “regular-way” trading of Vylor common stock to begin on the distribution date (or, if the distribution date is not a trading day, the first trading day after the distribution date). We intend to apply to list Vylor’s common stock on the New York Stock Exchange (the “NYSE”) under the symbol “ .”
In reviewing this information statement, you should carefully consider the matters described under the caption “Risk Factors” beginning on page 22.
Neither the U.S. Securities and Exchange Commission (the “SEC”) nor any state securities commission has approved or disapproved of these securities or determined if this information statement is truthful or complete. Any representation to the contrary is a criminal offense.
This information statement does not constitute an offer to sell or the solicitation of an offer to buy any securities.
Notice of Internet Availability with instructions for how to access this information statement is first being mailed to Corteva stockholders on or about , 2026.
The date of this information statement is , 2026.
The following is a summary of material information discussed in this information statement. This summary may not contain all the details concerning the spin-off or other information that may be important to you. To better understand the spin-off and our business and financial position, you should carefully review this entire information statement.
Unless otherwise indicated or the context otherwise requires, references in this information statement to:
•“Applicable Percentage” means, with respect to Vylor, %, and, with respect to New Corteva, %.
•“Corteva” refers to Corteva, Inc., a Delaware corporation, and, unless the context otherwise requires, its consolidated subsidiaries, in each case, prior to the spin-off;
•“Corteva common stock” refers to the common stock, par value $0.01 per share, of Corteva;
•“Corteva stockholders” refers to holders of record of shares of Corteva common stock in their capacity as such;
•“Crop Protection Business” refers to the business, operations and activities of the Crop Protection operating segment of Corteva;
•“DGCL” refers to the General Corporation Law of the State of Delaware;
•“distribution” refers to the distribution of all of the then issued and outstanding shares of Vylor common stock to Corteva stockholders as of the record date;
•“distribution date” refers to the date of the distribution, which is expected to be on , 2026;
•“EIDP” refers to EIDP, Inc. (formerly known as E. I. du Pont de Nemours and Company), a Delaware corporation;
•“EIDP preferred stock” refers to the $4.50 Series Preferred Stock and $3.50 Series Preferred Stock of EIDP;
•“Exchange Act” refers to the Securities Exchange Act of 1934, as amended;
•“internal reorganization” refers to the allocation and transfer or assignment by Corteva or its subsidiaries of the entities, assets and liabilities prior to the distribution so that (i) Vylor and its subsidiaries are allocated and transferred or assigned the entities, assets and liabilities of the Seed Business and (ii) Corteva and its subsidiaries (other than Vylor and its subsidiaries) are allocated and transferred or assigned the entities, assets and liabilities of the Crop Protection Business, as described in more detail in the section entitled “Our Relationship with New Corteva Following the Spin-Off—Separation and Distribution Agreement;”
•“New Corteva” refers to Corteva and, unless the context otherwise requires, its consolidated subsidiaries, in each case, following the spin-off;
•“Pioneer” refers to Pioneer Hi-Bred International, Inc., an Iowa corporation and a direct, wholly-owned subsidiary of EIDP (immediately prior to the Vylor contribution) and Vylor (immediately following the Vylor contribution);
•“record date” refers to the close of business on , 2026, the date set by the Corteva board of directors to determine the Corteva stockholders eligible to receive shares of Vylor common stock in the distribution;
•“Securities Act” refers to the Securities Act of 1933, as amended;
•“Seed Business” refers to the business, operations and activities of the Seed operating segment of Corteva;
•“spin-off” refers to the separation of the Crop Protection Business and the Seed Business pursuant to the spin-off transactions;
•“spin-off transactions” refers to the internal reorganization, the Vylor contribution, the Vylor issuance, the Vylor cash distribution, the EIDP distribution and the distribution (each as defined herein);
•“Vylor,” “we,” “us” and “our” refer to Vylor Inc. and, unless the context otherwise requires, its consolidated subsidiaries;
•“Vylor common stock” refers to the common stock, par value $0.01 per share, of Vylor; and
•“$” or “dollars” means United States dollars, unless otherwise stated.
You should carefully read this entire information statement, which forms a part of the registration statement on Form 10 (the “Form 10”) including Corteva’s audited Consolidated Financial Statements and corresponding notes, Vylor’s unaudited Pro Forma Consolidated Financial Statements and corresponding notes elsewhere in this information statement, Vylor’s supplemental audited Combined Financial Statements and corresponding notes and any documents incorporated by reference into this information statement.
Some of the statements in this information statement constitute forward-looking statements. See the section entitled “Cautionary Statement Concerning Forward-Looking Statements.”
You should not assume that the information contained in this information statement is accurate as of any date other than the date set forth on the cover. Changes to the information contained in this information statement may occur after that date, and we undertake no obligation to update the information, except in the normal course of our public disclosure obligations or as required by applicable law.
Certain percentages and other figures provided and used in this information statement may not add up to 100.0% due to the rounding of individual components. In this information statement, we present estimated United States dollar amounts for the industries in which we operate.
PROPOSED SPIN-OFF AND
FINANCIAL STATEMENT PRESENTATION
On October 1, 2025, Corteva announced its intention to pursue, subject to the approval of the Corteva Board of Directors and any required regulatory approvals, its separation into two independent publicly traded companies—one for each of Corteva's Seed and Crop Protection businesses.
Except as otherwise indicated or unless the context otherwise requires, the information included in this information statement assumes the completion of all the transactions referred to in this information statement in connection with the spin-off.
This information statement is being furnished solely to provide information to Corteva stockholders who will receive shares of Vylor common stock in the distribution. It is not, and is not to be construed as, an inducement or encouragement to buy or sell any of Vylor's securities or any securities of Corteva. This information statement describes Vylor's business, Vylor's relationship with Corteva and how the spin-off is expected to affect Corteva and its stockholders, and provides other information to assist you in evaluating the benefits and risks of holding or disposing of Vylor common stock that you will receive in the distribution. You should be aware of certain risks relating to the spin-off, Vylor and ownership of Vylor common stock, which are described under the section of this information statement entitled “Risk Factors.”
Financial Statement Presentation
This information statement includes certain historical consolidated financial and other data for Corteva and certain supplemental historical combined financial and other data for the Seed Business. In connection with the spin-off, Vylor will become a stand-alone, publicly traded company and the direct or indirect holder of the assets and liabilities of Corteva’s Seed Business. Vylor is the registrant under the Form 10 of which this information statement forms a part and will be the financial reporting entity following the completion of the spin-off. Corteva is currently, and will continue to be, a financial reporting entity following the spin-off. Notwithstanding the legal form of the spin-off described elsewhere in this information statement, for accounting and financial reporting purposes, Corteva’s Crop Protection Business will be presented as being spun-off from Corteva (the reverse of its legal form - a “reverse spin”). This presentation is in accordance with accounting principles generally accepted in the United States of America ("U.S. GAAP"), specifically Accounting Standards Codification ("ASC") 505-60, Spinoff and Reverse Spinoffs, as issued by the Financial Accounting Standards Board (“FASB”), and is primarily a result of, among other factors, Vylor’s relative significance to New Corteva. As such, Corteva best represents the predecessor entity to Vylor and, therefore, the historical audited Consolidated Financial Statements included in this information statement are Corteva’s historical financial statements. Corteva’s historical results are not representative of the results that Vylor would have achieved as a separate, publicly traded company nor are they indicative of the results expected for any future period. As a result, this information statement also contains the historical supplemental Combined Financial Statements of the Seed Business, which were prepared on a "carve-out" basis and have been derived from the Consolidated Financial Statements and accounting records of Corteva using the historical results of operations and historical basis of assets and liabilities of Vylor. These supplemental Combined Financial Statements reflect the Seed Business' combined historical results of operations, financial position and cash flows as they were historically managed. The supplemental Combined Financial Statements may not be indicative of what the results of operations, financial position and cash flows would have been had Vylor operated as a standalone company during the periods presented, nor do they reflect what the Vylor results of operations, financial position and cash flows may be in the future, particularly because of changes Vylor expects to experience in the future as a result of the spin-off.
This information statement also includes an unaudited Pro Forma Consolidated Balance Sheet as of March 31, 2026 and unaudited Pro Forma Consolidated Statement of Operations for the year ended December 31, 2025, which present Vylor’s combined financial position and results of operations after giving effect to the spin-off, and the other transactions described in the section entitled “Unaudited Pro Forma Consolidated Financial Statements.” The unaudited Pro Forma Consolidated Financial Statements are presented for illustrative
purposes only and are not necessarily indicative of the operating results or financial position that would have occurred if the relevant transactions had been consummated on the date indicated, nor are they indicative of future operating results.
You should read the sections of this information statement entitled “Unaudited Pro Forma Consolidated Financial Statements” and “Notes to the Unaudited Pro Forma Consolidated Financial Statements,” which are qualified in their entirety by reference to the audited Consolidated Financial Statements of Corteva and related notes thereto, the supplemental audited Combined Financial Statements of the Seed Business and related notes thereto and the financial and other information contained in this information statement, including in the sections of this information statement entitled “Risk Factors,” “Management’s Discussion and Analysis of Financial Condition and Results of Operations of Corteva” and “Management’s Discussion and Analysis of Financial Condition and Results of Operations of the Seed Business (Supplemental).”
Vylor Inc.
Vylor Inc. is a wholly-owned subsidiary of Corteva and was formed on November 13, 2025 to serve as a holding company for the Seed Business. Vylor Inc. has engaged in no business operations to date and has no assets or liabilities of any kind, other than those incident to its formation.
Trademarks, Trade Names and Service Marks
The trademarks, trade names and service marks of Vylor appearing in this information statement are, as applicable, our property, licensed to us or, prior to the completion of the spin-off, the property of Corteva. The name, mark and other trademarks, trade names and service marks of Corteva and New Corteva appearing in this information statement are the property of Corteva. Solely for convenience, trademarks, trade names and service marks referred to in this information statement may appear without the “®”, “TM” or “SM” symbols, but such references are not intended to indicate, in any way, that we will not assert, to the fullest extent possible under applicable law, our rights or the rights of the applicable licensor to these trademarks, trade names and service marks. This information statement also contains additional trademarks, trade names and service marks belonging to other parties. We do not intend our use or display of these other parties’ trademarks, trade names or service marks to imply, and such use or display should not be construed to imply, a relationship with, or endorsement or sponsorship of us by, such other parties.
Industry Information
Unless indicated otherwise, the information concerning the industry in which Vylor participates contained in this information statement is based on Vylor’s general knowledge of and expectations concerning the industry. Vylor’s competitive position and industry size are based on estimates using Vylor's internal data and estimates, data from various industry analyses, our internal research and adjustments and assumptions that we believe to be reasonable. Further, Vylor’s estimates and assumptions involve risks and uncertainties and are subject to change based on various factors, including those discussed in the section entitled “Risk Factors”. These and other factors could cause results to differ materially from those expressed in the estimates and assumptions.
INFORMATION STATEMENT SUMMARY
This summary highlights some of the information in this information statement relating to Vylor Inc., Vylor’s separation from Corteva and the distribution of shares of Vylor common stock by Corteva to its stockholders. For a more complete understanding of our business and the spin-off, you should read carefully the more detailed information set forth under the sections of this information statement entitled “Risk Factors,” “Management’s Discussion and Analysis of Financial Condition and Results of Operations of Corteva,” “Management’s Discussion and Analysis of Financial Condition and Results of Operations of the Seed Business (Supplemental)” and “The Spin-Off” and the other information included in (or incorporated by reference into) this information statement.
Explanatory Note
Primarily as a result of, among other factors, Vylor’s (which is the legal spinnee) relative significance to New Corteva, for financial reporting purposes, Vylor will be treated as the “accounting spinnor” and therefore will be the “accounting successor” to Corteva following the spin-off, notwithstanding the legal form of the spin-off described in this information statement. As a result, the historical consolidated financial statements of Corteva will become the historical financial statements of Vylor for the periods prior to the spin-off.
When we refer in this information statement to Vylor’s or Corteva’s historic business activities, we are referring to those activities as they were historically operated as part of Corteva prior to their transfer to Vylor in connection with the spin-off.
Distributing Company
Corteva is a global pure-play agriculture company that combines industry-leading innovation, high-touch customer engagement and operational execution to profitably deliver solutions for the world’s most pressing agriculture challenges. Corteva establishes market advantage through its unique distribution strategy, together with its balanced and globally diverse mix of seed, crop protection, and digital products and services. With some of the most recognized brands in agriculture and a technology pipeline well positioned to drive growth, Vylor is committed to maximizing productivity for farmers, while working with stakeholders throughout the food system as it fulfills its promise to enrich the lives of those who produce and those who consume, ensuring progress for generations to come.
On October 1, 2025, Corteva announced that its board of directors unanimously approved a plan to separate the company into two independent, publicly traded companies, one comprising the Crop Protection Business and the other comprising the Seed Business. The spin-off is subject to final approval by the Corteva board of directors and the satisfaction or waiver of certain other conditions. As a result of the spin-off, Vylor will become an independent, publicly traded company, and the direct or indirect owner of the assets and liabilities of the Seed Business. The spin-off is expected to be effected through a pro rata distribution of all of the issued and outstanding shares of Vylor common stock to holders of record of Corteva common stock as of the record date. The spin-off is intended to be tax-free to Corteva stockholders for U.S. federal income tax purposes, except for any cash received in lieu of fractional shares.
Our Company
The Seed Business to be held by Vylor is recognized by farmers as a leader in the seed technology markets globally with a century-long legacy of customer loyalty, market leadership, and financial strength originating with our iconic, flagship Pioneer® brand, the number one corn and soybean brand in the United States. Through branded sales and licensing arrangements, our business develops and supplies high quality, best-in-class germplasm combined with advanced traits to produce higher yields for farmers around the world. Our seed technology solutions fuel farmer productivity in more than [70] countries and generated annual net sales of $9.9 billion for the year ended December 31, 2025. Our strategy is built upon providing farmers with the right mix of seed technology solutions to maximize their yields and to improve their profitability, while strengthening customer relationships and supporting an abundant food and fuel supply for a growing global population and the next generation demand for biofuels.
The Seed Business is a global leader in developing and supplying advanced germplasm and traits that produce optimum yield for farms around the world. We are a leader by revenue share in many of our key seed markets, including North America corn and soybeans, Europe corn and sunflower, as well as Brazil, India, South Africa and Argentina corn. As part of our integrated seed technology platform, we offer trait technologies that improve resistance to weather, disease, insects and weeds, and trait technologies that enhance food and nutritional characteristics. We also provide digital solutions that assist farmer decision-making with a view to optimize product selection and, ultimately, maximize yield and profitability potential for farmers.
We aspire to create shareholder value as an industry leader in advanced genetics that discovers and develops groundbreaking solutions for farmers around the world by developing products that continue to provide genetic gain and grow our seed and trait licensing income. Another expected value driver is our disciplined capital and resource allocation processes, including a performance-based culture, with a strong focus on capital discipline, including through stable dividends and share repurchases, selectively assessing merger or acquisition
opportunities and continuing to advance our science-based innovation. We anticipate that our innovation investments, including those through our growth platforms in licensing, gene editing, biofuels, and hybrid wheat, will drive our continued growth through the next decade.
Our Competitive Strengths
We believe the following attributes provide us with a competitive advantage in our industry:
•Leading technology position in key markets. Our technological yield advancements make us a technological leader in many of our key seed markets, including North America corn and soybeans, Europe corn and sunflower, as well as Brazil, India, South Africa and Argentina corn. Our brand portfolio consists of some of the most recognized and premium brands in agriculture, such as our flagship premium Pioneer® brand and our Enlist®soybeans, which remain the leading soybean seed technology in the United States.
•Innovation investment. We have created one of the broadest and most innovative pipelines in the agricultural input industry. By integrating the use of gene editing and artificial intelligence in advancing these technologies, we expect to be well-positioned to advance more tailored technological solutions faster to respond to agriculture’s greatest productivity and environmental challenges.
•Strong customer relationships. Our customer service model “walks the acre,” with our agents meeting face-to-face with farmers providing them with a premium, high-touch experience. In certain cases, these relationships extend over multiple generations. Our knowledge of the customer also enhances our ability to effectively introduce new products that meet customer needs. These strong customer relationships afford us the opportunity to anticipate customer needs and utilize this information to develop solutions that increase our likelihood of maintaining our customers and continuing to serve as their trusted provider.
•Deep industry expertise. We have a strong management team that combines in-depth industry experience and decades of demonstrated leadership. Our executive management team has, combined, approximately 95 years of industry experience and has retained top talent from Corteva, providing a track record of success and continuity.
Our Strategy
Our strategy is to combine our proven innovation capability with our unmatched customer access to provide farmers with the right mix of seeds and digital solutions to maximize their yields and support their profitability, while strengthening customer relationships and contributing to an abundant food and fuel supply to support a growing global population. We plan to leverage the work already done by Corteva, while enhancing its existing strategies, operating priorities and business focus through a more streamlined, efficient and focused operating structure. We also believe that by operating as an advanced genetics company with strong market position in seed technology serving farmers globally, we can more sharply focus on the innovation needs of farmers and instill a culture that best supports our strategy.
To drive industry-leading value creation, we will continue to prioritize:
•Instilling a strong, performance-based, inclusive, customer-centric culture.
•Developing innovative solutions that improve farmer productivity and global food and fuel security.
•Delivering above-market growth via our robust new product pipeline and best-in-class routes to market.
•Driving disciplined capital and resource allocation with a strong focus on return on invested capital.
•Maintaining a best-in-class cost structure.
More broadly, we believe the following strategic priorities will continue to enable us to create significant value for our customers while delivering strong financial returns to our stockholders.
•Growing Core Revenue Streams. We will aim to expand our product portfolio by adding approximately 200 to 300 seed hybrids and varieties each year that incorporate genetic traits and agronomic characteristics intended to improve yield potential, performance consistency, and risk management for growers. We also intend to expand our portfolio to new cropping systems, such as hybrid wheat and biofuels, to drive growth beyond core germplasm and trait yield improvements. Additionally, we have developed proprietary seed trait and germplasm technologies that may be licensed to third parties.
•Accelerating Innovation. We maintain a global germplasm portfolio supported by breeding programs and testing networks designed to advance crop performance over successive growing seasons through the introduction of new proprietary seed traits that anticipate and meet evolving customer needs. Gene editing technologies are utilized within Vylor’s research and development activities to
support targeted genetic improvements in certain crops. We expect this transformational technology to expand the range of traits that may be commercialized and to support future revenue opportunities through both branded seed products and potential licensing arrangements.
•Leveraging Go-to-market Excellence. We expect to capitalize on our advantaged routes-to-market and brand strength in order to continually refine the price-for-value equation for new innovations and products. Our seed distribution model services customers primarily through our flagship Pioneer direct sales channel in key agricultural geographies, including the United States. Through this agency model, we interact directly with farmers at multiple points in the growing season, from prior to planting all the way through harvest. These regular interactions enable us to provide the advice and service farmers need while giving us real-time insights into their future ordering decisions and technology needs to inform our future innovation strategy. Our agency model is supplemented by strong retail channels through our Brevant® brand and licensing, further extending our market reach and increasing exposure of our technology.
Summary of Risk Factors
An investment in Vylor common stock is subject to several risks, including the following:
Risks Related to Our Industry
•We may not be able to obtain or maintain the necessary regulatory approvals for some of our products, which could restrict our ability to sell those products in some markets.
•The successful development and commercialization of our pipeline products will be necessary for our growth.
•The degree of public understanding and acceptance or perceived public acceptance of our biotechnology and other agricultural products and technologies can affect our sales and results of operations by affecting planting approvals, regulatory requirements and customer purchase decisions.
•Our business is subject to various competition and antitrust rules and regulations around the world, and as the size of our business grows, scrutiny of our business by legislators and regulators in these areas may intensify.
•Changes in agricultural and related policies of governments and international organizations may prove unfavorable.
•The costs of complying with evolving regulatory requirements could negatively impact our business, results of operations and financial condition.
•Climate change and unpredictable seasonal and weather factors could impact our sales and earnings.
•We participate in an industry that is highly competitive and has undergone consolidation, which could increase competitive pressures.
•Recent government funding and staff reductions could hinder our ability to receive timely regulatory approvals.
•Our sales may be adversely affected should a competitor successfully establish an intermediary platform for the sale of our products or otherwise position itself between us and our customers.
Risks Related to Our Operations
•Our business, financial condition and results of operations could be materially affected by disruptions in the global economy caused by geopolitical and military conflicts.
•Volatility in our input costs could have a significant impact on our business, results of operations and financial condition.
•Our business, results of operations and financial condition could be adversely affected by environmental, litigation and other commitments and contingencies.
•We are dependent on our relationships or contracts with third parties with respect to certain of our seed production, licenses or commercialization.
Risks Related to the Spin-Off
•The spin-off may not be completed on the contemplated timeline or at all.
•The spin-off may not achieve some or all of the intended benefits.
•The costs to complete the spin-off will be significant.
•If the spin-off were to fail to qualify as tax-free for U.S. federal income tax purposes, then New Corteva, and stockholders receiving Vylor common stock in connection with the distribution, could be subject to significant tax liabilities for which we may be required to indemnify New Corteva.
•Following the spin-off we will need to provide or arrange for certain services to be provided that are currently provided by Corteva.
•We will incur indebtedness in connection with the spin-off and the Vylor cash distribution, and the degree to which we will be leveraged following the spin-off may materially and adversely affect our business, financial condition and results of operations.
•We and New Corteva will be allocated, and we and New Corteva will mutually indemnify each other for, certain liabilities in connection with the spin-off, the payments in respect of which could be significant and could negatively impact our business.
•The spin-off, including certain internal reorganization transactions undertaken by Corteva in connection therewith, may expose us to potential liabilities arising out of state and federal fraudulent conveyance laws and legal distribution requirements.
Risks Related to Vylor Common Stock
•We cannot be certain that an active trading market for Vylor common stock will develop or be sustained after the spin-off, and following the spin-off, our stock price may fluctuate significantly.
•A significant number of shares of Vylor common stock may be sold following the spin-off, which may cause our stock price to decline.
The above list of risk factors is not exhaustive. Please read the information in the section entitled “Risk Factors” for a more thorough description of these and other risks.
Our Relationship with New Corteva Following the Spin-Off
The spin-off will separate the Seed Business and the Crop Protection Business into two independent, publicly traded companies.
On , 2026 the Corteva board of directors approved the distribution of all of the issued and outstanding shares of common stock of Vylor, the newly formed holding company that, at the time of the distribution, will hold the Seed Business, to Corteva stockholders on the basis of share[s] of Vylor common stock for every share[s] of Corteva common stock held as of the close of business on , 2026, the record date for the distribution. As a result of the distribution, we will become an independent, publicly traded company. The spin-off is intended to be tax-free to Corteva stockholders for U.S. federal income tax purposes, except for any cash received in lieu of fractional shares.
The distributions are subject to the satisfaction or waiver of certain conditions. The Corteva board of directors has the discretion to abandon the intended distribution and to alter its terms. See the section entitled “The Spin-Off—Conditions to the Distribution.” As a result, Vylor cannot provide any assurances that the distribution will be completed.
Following the spin-off, we and Corteva (which we refer to, after the spin-off, as New Corteva) will operate separately, each as an independent, publicly traded company. To effect the spin-off and govern our ongoing relationship with New Corteva thereafter, we intend to enter into certain agreements with Corteva that will, among other matters, provide for the allocation between us and New Corteva of Corteva’s assets, employees, liabilities and obligations (including investments, property, employee benefits, intellectual property and tax-related assets and liabilities), and provide a framework for our relationship with New Corteva following the spin-off. The terms of the agreements described within the section entitled "Certain Agreements with Corteva" that will be in effect immediately prior to, or following, the spin-off have not yet been finalized; changes to these agreements, some of which may be material, may be made prior to the spin-off. Following the spin-off, however, no changes to such agreements may be made without the mutual agreement of New Corteva and Vylor.
Regulatory Approvals
We must complete the necessary registration under U.S. federal securities laws of Vylor common stock to be issued in the distribution, as well as the applicable listing requirements of the NYSE for such shares.
Other than these requirements, we do not believe that any other material governmental or regulatory filings or approvals will be necessary to consummate the distribution.
Corteva stockholders are not entitled to appraisal rights in connection with the spin-off.
Corporate Information
Vylor was organized in the State of Delaware on November 13, 2025. The current address of Vylor’s Company Secretary offices is 1000 N. West Street, Suite 900, Wilmington, Delaware 19801. Vylor can be contacted by calling (302) 485-3400.
SUMMARY OF THE SPIN-OFF
The following is a summary of the material terms of the spin-off.
|
|
Distributing company |
Corteva, Inc. |
|
|
Distributed company |
Vylor, a Delaware corporation and a wholly-owned subsidiary of Corteva that will be the holding company for the Seed Business. Following the distribution, Vylor will be an independent, publicly traded company. |
|
|
Distribution ratio |
Each holder of record of Corteva common stock as of the close of business on , 2026, the record date for the distribution, will be entitled to receive share[s] of Vylor common stock for every share[s] of Corteva common stock held of record as of such time. Corteva stockholders will also be entitled to receive cash in lieu of any fractional shares, as described below. |
|
|
Distributed securities |
In the distribution, Corteva will distribute to all holders of record of Corteva common stock as of the record date, all of the then issued and outstanding shares of Vylor common stock. Following the distribution, New Corteva will not retain any ownership in Vylor. |
|
|
|
The actual number of shares of Vylor common stock that will be distributed will depend on the number of shares of Corteva common stock outstanding as of the record date. |
|
|
|
Immediately following the distribution, Corteva stockholders will own shares in both Vylor and New Corteva. |
|
|
Fractional shares |
Corteva will not distribute any fractional shares of Vylor common stock. Instead, if you are a holder of record of shares of Corteva common stock, Computershare Trust Company, N.A. (“Computershare”), the distribution agent, will aggregate all fractional shares that would have otherwise been issued in the distribution into whole shares and sell the whole shares in the open market at then prevailing market prices on behalf of all Corteva stockholders entitled to receive a fractional share. The distribution agent will then distribute the aggregate cash proceeds of the sales, net of costs and expenses of such sale and distribution, pro rata to those stockholders (net of any required withholding for taxes applicable to each stockholder) who otherwise would have been entitled to receive a fractional share in the distribution. Corteva stockholders who receive cash in lieu of fractional shares will not be entitled to any interest on the amount of payment made to you in lieu of fractional shares. Any cash received in lieu of fractional shares will be taxable to Corteva stockholders as described in the section entitled “Material U.S. Federal Income Tax Consequences of the Spin-Off.” |
|
|
Record date |
The record date for the distribution is the close of business on , 2026. |
|
|
Distribution date |
The distribution date is expected to be on , 2026. |
|
Distribution |
On the distribution date, Corteva will distribute shares of Vylor common stock to all holders of record of Corteva common stock as of the record date based on the distribution ratio. The shares of Vylor common stock will be issued electronically in direct registration or book-entry form and no certificates will be issued. |
|
|
Commencing on or shortly following the distribution date, the distribution agent will mail to stockholders who hold their shares directly with Corteva (holders of record) a direct registration account statement that reflects the shares of Vylor common stock that have been registered in their name. |
|
|
|
For shares of Corteva common stock that are held through a bank, the bank will credit the stockholder’s account with the Vylor common stock they are entitled to receive in the distribution. |
|
|
|
|
|
Corteva stockholders will not be required to pay any consideration, to surrender or exchange their shares of Corteva common stock or to take any other action to receive their shares of Vylor common stock in the distribution. |
|
|
|
If you are a Corteva stockholder as of the record date and decide to sell your shares on or before the distribution date, you may choose to sell your Corteva common stock with or without your entitlement to receive Vylor common stock in the distribution. Beginning on or shortly before the record date and continuing through the last trading day prior to the distribution, Corteva expects that there will be two markets in Corteva common stock: a “regular-way” market and an “ex-distribution” market. Shares of Corteva common stock that are traded in the “regular-way” market will trade with an entitlement to receive the Vylor common stock that is distributed pursuant to the distribution. Shares that trade in the “ex-distribution” market will trade without an entitlement to receive the shares of Vylor common stock distributed pursuant to the distribution. Consequently, if you sell your shares of Corteva common stock in the “regular-way” market on or prior to the last trading day prior to the distribution date, you will also be selling your right to receive Vylor common stock in the distribution. |
|
|
Conditions to the distribution |
The distribution is subject to the satisfaction (or, to the extent permitted by applicable law, waiver by the Corteva board of directors in its absolute and sole discretion) of the following conditions: |
|
|
|
•the SEC having declared effective the Form 10 under the Exchange Act (or the Form 10 having otherwise become effective pursuant to and in accordance with Section 12(d) of the Exchange Act), no stop order relating to the Form 10 being in effect, no proceedings seeking such a stop order being pending before or threatened by the SEC and this information statement (or notice of internet availability hereof) having been distributed to Corteva stockholders; •the listing of Vylor common stock on the NYSE having been approved, subject to official notice of issuance; •Corteva having received the tax opinions or tax memoranda, as applicable, of Cravath, Swaine & Moore LLP and Ernst & Young LLP (the “Tax Opinions”), confirming that the distribution and certain transactions entered in connection with the spin-off generally will be tax free to Corteva and its stockholders for U.S. federal income tax purposes (as described in the section entitled “Risk Factors— Risks Related to the Spin-Off”); •each of Vylor, EIDP and Corteva having received an opinion from an independent financial advisory firm to the effect that, assuming the spin-off transactions are consummated, Vylor, EIDP and New Corteva, as applicable, would be solvent, adequately capitalized and be able to pay its debts as they become due and that Vylor, EIDP and Corteva, as applicable, would have adequate surplus to declare the Vylor cash distribution, the EIDP distribution and the Distribution, as applicable, in each case, after giving effect to the spin-off transactions; •no order, injunction or decree issued by any governmental entity of competent jurisdiction or other legal restraint or prohibition preventing consummation of the distribution or any of the related transactions shall be pending, threatened, issued or in effect, and no other outside event having occurred or failed to occur that prevents the consummation of all or a portion of the distribution; •the internal reorganization having been effectuated; |
|
•the Vylor contribution and Vylor issuance having been completed; •(i) the financing for the Vylor financing arrangements having been available on terms acceptable to Corteva, (ii) Vylor having completed the Vylor financing arrangements and having received the proceeds in respect thereof and (iii) Vylor having completed the Vylor cash distribution |
|
|
|
•the EIDP distribution having been completed; •the Corteva board of directors having declared the distribution and having approved all related transactions, which approval may be given or withheld in the Corteva board of director’s absolute and sole discretion (and such declaration or approval not having been withdrawn); •Corteva, as our sole stockholder immediately prior to the distribution, having caused our board of directors to consist of the individuals identified in the section entitled “Management” as our directors, and those directors having resigned from the Corteva board of directors, as applicable; •each of us, New Corteva and our respective subsidiaries, having entered into all ancillary agreements to which we, New Corteva or such subsidiary is contemplated to be a party; and •no events or developments having occurred or existing that, in the sole and absolute judgment of the Corteva board of directors, make it inadvisable to effect the distribution or would result in the distribution and related transactions not being in the best interest of Corteva or its stockholders. |
|
|
Stock exchange listing |
We intend to apply to list Vylor common stock on the NYSE under the symbol “ .” |
|
|
|
We anticipate that as early as the trading day prior to the record date, trading in shares of Vylor common stock will begin on a “when-issued” basis and that this “when-issued” trading market will continue through the last trading day prior to the distribution date. See the section entitled “The Spin-Off—Trading Between the Record Date and Distribution Date.” |
|
|
Transfer agent |
After the distribution, the transfer agent and registrar for Vylor common stock will be Computershare. |
|
|
Vylor’s indebtedness |
For additional information relating to our anticipated indebtedness following the spin-off, see the section entitled “Description of Material Indebtedness” included elsewhere in this information statement. |
|
|
Risks relating to Vylor, ownership of Vylor common stock and the
distribution |
Our business is subject to both general and specific risks, including risks relating to our business, to our relationship with New Corteva following the spin-off and to us being a separate, publicly traded company. You should read carefully the section entitled “Risk Factors.” |
|
|
|
|
Tax considerations |
Assuming the spin-off qualifies as tax-free for U.S. federal income tax purposes under the Code, no gain or loss will be recognized by Corteva stockholders, and no amount will be included in the income of a Corteva stockholder, upon the receipt of shares of Vylor common stock pursuant to the distribution. However, any cash payments made in lieu of fractional shares pursuant to the distribution will generally be taxable to the stockholder. For a more detailed description, see the section entitled “Material U.S. Federal Income Tax Consequences of the Spin-Off.” |
|
|
Certain agreements with Corteva |
Prior to the distribution, we expect to enter into the Separation and Distribution Agreement with Corteva to facilitate the spin-off and provide a framework for the relationship between us and New Corteva after the spin-off. We also plan on entering into certain other agreements with Corteva, including the Tax Matters Agreement, the Employee Matters Agreement, the Transition Services Agreements, the Intellectual Property Matters Agreement, and certain other agreements relating to intellectual property, services, supply, real estate and other commercial matters. These agreements will collectively provide the terms of the allocation between us and New Corteva of the assets, liabilities and obligations of Corteva (including its investments, property and employee benefits and tax-related assets and liabilities) and will govern the relationship between us and New Corteva subsequent to the spin-off. For additional information regarding the Separation and Distribution Agreement and other transaction agreements, see the sections entitled “Risk Factors—Risks Related to the Spin-Off” and “Our Relationship with New Corteva Following the Spin-Off.” |
QUESTIONS AND ANSWERS ABOUT THE SPIN-OFF
|
|
What is Vylor and why is
Corteva separating its
Seed Business and distributing
Vylor common stock? |
Vylor is currently a wholly-owned subsidiary of Corteva that will hold the Seed Business following the spin-off. Our separation from Corteva and the distribution of Vylor common stock to Corteva’s stockholders is intended to provide Corteva stockholders with equity investments in two separate companies that will be able to focus on their respective businesses, with Vylor being a leading, advanced seed genetics company and New Corteva being a leading, differentiated crop protection technology company. The spin-off is expected to enhance the long-term performance of each business for the reasons discussed in the sections entitled “The Spin-Off—Background of the Spin-Off” and “The Spin-Off—Reasons for the Spin-Off.” |
|
|
Why am I receiving this information
statement? |
We are making this information statement available to you because you are a Corteva stockholder as of the record date. As a Corteva stockholder as of the record date, you are entitled to receive share[s] of Vylor common stock for every share[s] of Corteva common stock that you held as of such time. This information statement will help you understand how the spin-off will affect your investment in Corteva and your investment in Vylor after the spin-off. |
|
|
|
|
What are the reasons for the
spin-off? |
The Corteva board of directors believes that the spin-off is in the best interests of Corteva and its stockholders and is the best available opportunity to enhance the long-term value of Corteva’s businesses. |
|
|
|
As described in the section entitled “The Spin-Off—Background of the Spin-Off,” the Corteva board of directors considered a wide variety of factors in evaluating, and in deciding to proceed with, the spin-off, including the risk that the spin-off is abandoned and not completed. Among other things, the Corteva board of directors considered the following potential benefits of the spin-off: |
|
|
|
•Attractive Investment Profile. The creation of separate companies with strong, focused businesses and each with a distinct financial profile and clear investment thesis is expected to drive significant long-term value for all stockholders and also reduce the complexities surrounding investor understanding, enabling investors to invest in each company separately based on its distinct characteristics. |
|
|
|
•Distinct Position. The spin-off is expected to create two independent companies with tailored growth strategies and differentiated technologies, resulting in: Vylor, a leading global seed and genetics company with a century-long heritage of success utilizing cutting-edge technology, including advanced genetics and proprietary traits that increase yield, sustainability, and crop health; and New Corteva, a leading global crop protection technology company that is a fit-for-purpose market leader in differentiated, innovative agricultural solutions, including biologicals and other nature-based products. Each company will provide investors with a distinct investment option that may be more attractive to current investors, allowing each company to attract different investors than the current investment option available to Corteva stockholders of one combined company. |
|
|
|
|
|
•Ability to Pursue Strategic Opportunities. Each company’s business is expected to be better situated to pursue future acquisitions, joint ventures and other strategic opportunities as well as internal expansion that is more closely aligned with such company’s strategic goals and expected growth opportunities. We will be focused on long-term growth by leveraging our world-class plant breeding capabilities to drive germplasm innovation, harnessing our gene editing expertise to transform our portfolio, and capitalizing on a deep pipeline of attractive acquisition opportunities in core and adjacent markets. New Corteva will be focused on enhancing near- and medium-term operational efficiency to navigate evolving market conditions, driving organic investment in differentiated solutions, continued innovation to bring advanced sustainable solutions to farmers, and disciplined strategic opportunities to expand market positions in attractive portfolios or geographies. |
|
|
|
•Focused Capital Allocation. Each independent, publicly traded company will have a capital structure and targeted investment-grade credit rating that is tailored for a business model designed to support its expected future capital needs and will be able to make capital allocation decisions to support its growth outlook, strategic direction and value proposition. In addition, after the spin-off, the respective business within each company will no longer need to compete internally for capital and other corporate resources with the business allocated to the other company. |
|
|
|
•Enhanced Means to Evaluate Financial Performance. Investors should be better able to evaluate the business condition, strategy and financial performance of each company within the context of its particular industry and markets, due in part to (i) the improved visibility of each company’s standalone results and performance drivers, (ii) the establishment of independent capital structures tailored to support each company’s future capital needs and (iii) the allocation of certain assets and liabilities in connection with the spin-off, as more fully described in the section entitled “Our Relationship with New Corteva Following the Spin-Off.” |
|
|
|
•Direct Access to Capital Markets. Each company’s business will have direct access to the capital markets, facilitating each company’s ability to pursue strategic goals and expected growth opportunities. |
|
|
|
•Ability to Adapt to Industry Changes. Each company is expected to be able to maintain a sharper focus on its core business and growth opportunities, which will allow each company to respond better and more quickly to developments in its industry. |
|
|
|
•Dedicated Management Team with Enhanced Strategic Focus. Each company’s management team will be able to design and implement corporate policies and strategies that are tailored to such company’s specific business characteristics and to focus on maximizing the value of its business. |
|
|
|
•Improved Management Incentive Tools. The spin-off will permit the creation of equity securities, including options and restricted stock units, for each publicly traded company with values more closely linked to the performance of such company’s business than would be readily available under the current configuration of businesses within Corteva as a single public company. The Corteva board of directors believes such equity-based compensation arrangements should provide enhanced incentives for performance and improve the ability for each publicly traded company to attract, retain and motivate qualified personnel. |
|
|
|
|
|
•Expected Higher Combined Market Value. Based on the poential benefits set forth above, it is expected that, over time following the completion of the spin-off, the aggregate market value of Vylor and New Corteva will be higher, on a fully distributed basis, and assuming the same market conditions, than if Corteva were to remain under its current configuration. |
|
|
|
The Corteva board of directors also considered a number of potentially negative factors, including the loss of synergies and joint purchasing power from ceasing to operate as part of a larger, more diversified company, risks relating to the creation of a new public company, such as increased costs from operating as a separate public company, potential disruptions to the businesses and its customer and distribution channels, the loss or dilution of brand identities, possible increased administrative costs and one-time separation costs, restrictions on each company’s ability to pursue certain opportunities that may have otherwise been available in order to preserve the tax-free nature of the spin-off for U.S. federal income tax purposes, the fact that each company will be less diversified than the current configuration of Corteva’s businesses prior to the spin-off, and the potential inability to realize the anticipated benefit of the spin-off. |
|
|
|
The Corteva board of directors concluded that the potential benefits of pursuing the spin-off outweighed the potential negative factors in connection therewith. The anticipated benefits of the spin-off are based on a number of assumptions, and there can be no assurance that, following the spin-off, any of the benefits described above or otherwise will be realized to the extent anticipated or at all. In the event the spin-off does not result in such benefits, the costs associated with the spin-off could have an adverse effect on each company individually or in the aggregate. For additional information see the section entitled “Risk Factors.” |
|
|
|
The Corteva board of directors also considered these potential benefits and potential negative factors in light of the risk that the spin-off is abandoned or otherwise not completed, resulting in the Crop Protection Business and Seed Business continuing as a combined company. The Corteva board of directors believes that the potential benefits to Corteva stockholders of the spin-off discussed above will provide Corteva stockholders with greater long-term value than retaining one investment in the combined company. |
|
|
|
In view of the wide variety of factors considered in connection with the evaluation of the spin-off and the complexity of these matters, the Corteva board of directors did not find it useful to, and did not attempt to, quantify, rank or otherwise assign relative weights to the factors considered. The individual members of the Corteva board of directors may have given different weights to different factors. |
|
|
Why is the separation of the Seed Business structured as a distribution? |
Corteva currently believes the spin-off is the most efficient way to separate its Seed Business from Corteva for various reasons, including that the spin-off will (i) offer a high degree of certainty of completion in a timely manner, lessening disruption to current business operations; (ii) provide a high degree of assurance that decisions regarding New Corteva’s and Vylor’s capital structure will align with each company’s business objectives and provide the continued financial flexibility and financial stability to support each company’s long-term growth and generate stockholder returns; and (iii) be tax-free to Corteva stockholders for U.S. federal income tax purposes (except for any cash received in lieu of fractional shares). Corteva believes that the spin-off will enhance the value of both New Corteva and Vylor. See the section entitled “The Spin-Off—Reasons for the Spin-Off.” |
|
|
|
|
What do I have to do to participate in
the distribution? |
You are not required to take any action to receive shares of Vylor common stock that you are entitled to receive, although you are urged to read this entire information statement (and any documents incorporated by reference into this information statement) carefully. No approval of the distribution by Corteva stockholders is required and Corteva is not seeking your approval. Therefore, Vylor is not asking you for a proxy to vote on the spin-off, and Vylor requests that you do not send Vylor a proxy. You will not be required to pay any consideration for the shares of Vylor common stock you are entitled to receive in the distribution nor will you be required to surrender or exchange any shares of Corteva common stock to participate in the distribution. For more detailed information on the treatment of fractional shares, see the section entitled “—How will fractional shares be treated in the distribution?” |
|
|
What is the record date for the
distribution? |
Corteva will determine record ownership as of the close of business on , 2026, which we refer to as the “record date.” |
|
|
What will happen to my shares of EIDP preferred stock? |
EIDP will continue to be a subsidiary of Corteva (which we refer to, after the spin-off, as New Corteva) and will remain a reporting issuer with the SEC. The rights of holders of the EIDP preferred stock will be unaffected by the spin-off. |
|
|
What will I receive in the distribution? |
If you hold shares of Corteva common stock as of the record date, on the distribution date you will receive share[s] of Vylor common stock for every share[s] of Corteva common stock that you held as of such time, as well as a cash payment in lieu of any fractional shares (as discussed below). You will receive only whole shares of Vylor common stock in the distribution. For a more detailed description, see the section entitled “The Spin-Off.” |
|
|
How will fractional shares be treated in
the distribution? |
No fractional shares of Vylor common stock will be distributed. Consequently, you will not receive any fractional shares of Vylor common stock and instead will receive a cash payment in lieu of any fractional shares you would otherwise have been entitled to receive in the distribution. |
|
|
|
Vylor has engaged Computershare as its distribution agent. The distribution agent will aggregate all fractional shares that would have otherwise been issued in the distribution into whole shares and will sell the whole shares in the open market at then prevailing market prices on behalf of all Vylor stockholders entitled to receive a fractional share. The distribution agent will then distribute the aggregate cash proceeds of the sales, net of costs and expenses of such sale and distribution (net of any required withholding for taxes applicable to such stockholders). You will not be entitled to any interest on the amount of payment made to you in lieu of fractional shares. |
|
|
Will the number of Corteva shares
I own change as a result of the
distribution? |
No, the number of shares you own will not change as a result of the distribution. Immediately following the distribution, you will hold the same number of shares of Corteva (which we refer to, after the spin-off, as New Corteva) that you held immediately prior to the distribution. Your proportionate interest will also not change, so you will own the same proportionate amount of New Corteva immediately following the spin-off that you owned of Corteva immediately prior to the spin-off. |
|
|
How many shares of Vylor common
stock will be distributed? |
The actual number of shares of Vylor common stock that will be distributed will depend on the number of shares of Corteva common stock outstanding as of the record date. The shares of Vylor common stock that are distributed will constitute all the then issued and outstanding shares of Vylor common stock immediately prior to the distribution and Corteva (which we refer to, after the spin-off, as New Corteva) will not retain any ownership interest in Vylor following the distribution. For a more detailed description, see the section entitled “Description of Our Capital Stock.” |
|
|
|
|
When will the distribution occur? |
It is expected that the distribution will be effected at on the distribution date, subject to the satisfaction or waiver of certain conditions. On the distribution date, the whole shares of Vylor common stock will be credited in book-entry accounts for each stockholder entitled to receive the shares of Vylor common stock in the distribution. We expect the distribution agent to take approximately two weeks after the distribution date to fully distribute to stockholders any cash they are entitled to receive in lieu of fractional shares. See “—How will I receive my shares of Vylor common stock?” for additional information. |
|
|
If I sell my shares of Corteva
common stock on or before the
distribution date, will I still be
entitled to receive shares of Vylor common stock in the distribution? |
If you are a Corteva stockholder as of the record date and decide to sell your shares on or before the distribution date, you may choose to sell your Corteva common stock with or without your entitlement to receive Vylor common stock in the distribution. Beginning on or shortly before the record date and continuing through the last trading day prior to the distribution date, Corteva expects that there will be two markets in Corteva common stock: a “regular-way” market and an “ex-distribution” market. Shares of Corteva common stock that are traded in the “regular-way” market will trade with an entitlement to receive the Vylor common stock that is distributed pursuant to the distribution. Shares that trade in the “ex-distribution” market will trade without an entitlement to receive the shares of Vylor common stock distributed pursuant to the distribution. Consequently, if you sell your shares of Corteva common stock in the “regular-way” market on or prior to the last trading day prior to the distribution date, you will also be selling your right to receive Vylor common stock in the distribution. |
|
|
|
You should discuss these alternatives with your financial advisors, such as a bank, broker or tax advisor. See the section entitled “The Spin-Off—Trading Between the Record Date and Distribution Date.” |
|
|
How will I receive my shares of Vylor common stock? |
Stockholders of record: If you are a holder of record (meaning you own your shares of Corteva common stock directly through an account with Corteva’s transfer agent, Computershare), the distribution agent will credit the whole shares of Vylor common stock you receive in the distribution to your book-entry account with our transfer agent on the distribution date. Approximately two weeks after the distribution date, the distribution agent will mail you a book-entry account statement that reflects the number of whole shares of Vylor common stock you own, along with a check for any cash in lieu of fractional shares you are entitled to receive. You will be able to access information regarding your book-entry account holding the shares of Vylor common stock at Computershare using the same credentials that you use to access your Corteva account. You may also contact Computershare at 1-833-388-2882 or 1-781-575-3120 (outside the U.S.). |
|
|
|
Beneficial stockholders: If you own your shares of Corteva common stock beneficially through a bank, broker or other nominee, your bank, broker or other nominee will credit your account with the whole shares of Vylor common stock you receive in the distribution on or shortly after the distribution date. Your bank, broker or other nominee will also be responsible for transmitting to you any cash payment you are entitled to receive in lieu of fractional shares. Please contact your bank, broker or other nominee for further information about your account and the payment of any cash you are entitled to receive in lieu of fractional shares. |
|
|
|
The shares of Vylor common stock will not be certificated. As a result, no physical stock certificates will be issued to any stockholders. See the section entitled “The Spin-Off—When and How You Will Receive the Distribution” for a more detailed explanation. |
|
|
|
|
What are the conditions to the
distribution? |
The distribution will be subject to the satisfaction (or, to the extent permitted by applicable law, waiver by the Corteva board of directors in its absolute and sole discretion) of the following conditions: |
|
|
|
•the SEC having declared effective the Form 10 under the Exchange Act (or the Form 10 having otherwise become effective pursuant to and in accordance with Section 12(d) of the Exchange Act), no stop order relating to the Form 10 being in effect, no proceedings seeking such a stop order being pending before or threatened by the SEC and this information statement (or notice of internet availability hereof) having been distributed to Corteva stockholders; |
|
|
|
•the listing of Vylor common stock on the NYSE having been approved, subject to official notice of issuance; |
|
|
|
•Corteva having received the Tax Opinions confirming that the distribution and certain transactions entered in connection with the spin-off generally will be tax free to Corteva and its stockholders for U.S. federal income tax purposes (as described in the section entitled “Risk Factors— Risks Related to the Spin-Off”); |
|
|
|
•each of Vylor, EIDP and Corteva having received an opinion from an independent financial advisory firm to the effect that, assuming the spin-off transactions are consummated, Vylor, EIDP and New Corteva, as applicable, would be solvent, adequately capitalized and be able to pay its debts as they become due and that Vylor, EIDP and Corteva, as applicable, would have adequate surplus to declare the Vylor cash distribution, the EIDP distribution and the Distribution, as applicable, in each case, after giving effect to the spin-off transactions; |
|
|
|
•no order, injunction or decree issued by any governmental entity of competent jurisdiction or other legal restraint or prohibition preventing consummation of the distribution or any of the related transactions shall be pending, threatened, issued or in effect, and no other outside event having occurred or failed to occur that prevents the consummation of all or a portion of the distribution; |
|
|
|
•the internal reorganization having been effectuated; |
|
|
|
•the Vylor contribution and Vylor issuance having been completed; |
|
|
|
•(i) the financing for the Vylor financing arrangements having been available on terms acceptable to Corteva, (ii) Vylor having completed the Vylor financing arrangements and having received the proceeds in respect thereof and (iii) Vylor having completed the Vylor cash distribution |
|
|
|
•the EIDP distribution having been completed; |
|
|
|
•the Corteva board of directors having declared the distribution and having approved all related transactions, which approval may be given or withheld in the Corteva board of director’s absolute and sole discretion (and such declaration or approval not having been withdrawn); |
|
|
|
•Corteva, as our sole stockholder immediately prior to the distribution, having caused our board of directors to consist of the individuals identified in the section entitled “Management” as our directors, and those directors having resigned from the Corteva board of directors, as applicable; |
|
|
|
•each of us, New Corteva and our respective subsidiaries, having entered into all ancillary agreements to which we, New Corteva or such subsidiary is contemplated to be a party; and |
|
|
|
|
|
•no events or developments having occurred or existing that, in the sole and absolute judgment of the Corteva board of directors, make it inadvisable to effect the distribution or would result in the distribution and related transactions not being in the best interest of Corteva or its stockholders. |
|
|
|
The satisfaction or waiver of such conditions will not create any obligation on Corteva’s part to effect the distribution, and the Corteva board of directors has the ability, in its sole and absolute discretion, to amend, modify or abandon the distribution and related transactions at any time prior to the distribution date. We intend to share details on any waivers or material changes of such conditions, if applicable, in our reports filed with the SEC. For a more detailed description, see the section of this information statement entitled “The Spin-Off—Conditions to the Distribution.” |
|
|
Can Corteva decide to cancel the
distribution even if all the conditions
have been met? |
Yes. The distribution is subject to the satisfaction or waiver of certain conditions. See the section entitled “The Spin-Off—Conditions to the Distribution.” Even if all such conditions are met, Corteva has the ability, in its sole discretion, not to complete the distribution if, at any time prior to the distribution, the Corteva board of directors determines, in its sole discretion, that the distribution is not in the best interests of Corteva or its stockholders, that a sale or other alternative is in the best interests of Corteva or its stockholders, or that market conditions or other circumstances are such that it is not advisable at that time to separate the Seed Business from Corteva. |
|
|
What are the U.S. federal income tax consequences of the distribution to
me? |
Following the spin-off, we and Corteva (which we refer to, after the spin-off, as New Corteva) will operate separately, each as an independent, publicly traded company. To effect the spin-off and govern our ongoing relationship with New Corteva thereafter, we intend to enter into certain agreements with Corteva that will, among other matters, provide for the allocation between us and New Corteva of Corteva’s assets, employees, liabilities and obligations (including investments, property, employee benefits, intellectual property and tax-related assets and liabilities), and provide a framework for our relationship with New Corteva following the spin-off. The terms of the agreements described within the section entitled "Our Relationship with New Corteva Following the Spin-Off" that will be in effect immediately prior to, or following, the spin-off have not yet been finalized; changes to these agreements, some of which may be material, may be made prior to the spin-off. Following the spin-off, however, no changes to such agreements may be made without the mutual agreement of New Corteva and Vylor. |
|
|
How will the distribution affect my tax
basis in my shares of Corteva
common stock? |
Assuming that the spin-off is tax-free to Corteva and Corteva stockholders (except for taxes related to any cash received in lieu of fractional shares in the distribution), your tax basis in the Corteva common stock held by you immediately prior to the distribution will be allocated between your shares of New Corteva common stock and the Vylor common stock that you receive in the distribution in proportion to the relative fair market values of each of New Corteva and Vylor immediately following the distribution. For a more detailed description, see the section entitled “Material U.S. Federal Income Tax Consequences of the Spin-Off.” |
|
|
Will my shares of Corteva common
stock continue to trade following the distribution? |
Your shares of Corteva common stock (which we refer to, after the spin-off, as New Corteva) will continue to trade on the NYSE. |
|
|
How will the spin-off affect the
operations of New Corteva? |
We expect that after the spin-off, New Corteva will continue to operate the Crop Protection Business. |
|
|
How will Vylor common stock
trade? |
We intend to apply to list Vylor common stock on the NYSE under the symbol “ .” |
|
|
|
|
|
We anticipate that trading in Vylor common stock will begin on a “when-issued” basis as early as the trading day prior to the record date for the distribution and will continue through the last trading day prior to the distribution date. When-issued trading in the context of a separation refers to a sale or purchase made conditionally on or before the distribution date because the securities of the separated entity have not yet been distributed. When-issued trades generally settle within one day after the distribution date. On the distribution date (or, if the distribution date is not a trading day, the first trading day after the distribution date), any when-issued trading of Vylor common stock will end and “regular-way” trading will begin. Regular-way trading refers to trading after the security has been distributed and typically involves a trade that settles on the second full trading day following the date of the trade. See the section entitled “The Spin-Off—Trading Between the Record Date and Distribution Date.” We cannot predict the trading prices for Vylor common stock before, on or after the distribution date. |
|
|
What indebtedness will Vylor have
following the spin-off? |
At the time of the spin-off, we expect to have approximately $ billion of indebtedness. See the sections entitled “Description of Material Indebtedness” and “Unaudited Pro Forma Consolidated Financial Statements” for additional information. |
|
|
Will the spin-off affect the trading
price of my Corteva common
stock? |
We expect the trading price of shares of New Corteva common stock immediately following the distribution to be lower than the trading price of Corteva common stock immediately prior to the distribution because the trading price will no longer reflect the value of the Seed Business. Furthermore, until the market has fully analyzed the value of New Corteva without the Seed Business and the value of Vylor as an independent company, the trading price of shares of both companies may fluctuate. There can be no assurance that, following the distribution, the combined trading prices of the common stock of Vylor and New Corteva will equal or exceed what the trading price of Corteva common stock would have been in the absence of Corteva’s pursuit of the spin-off, and it is possible the aggregate equity value of the two independent companies will be less than Corteva’s equity value prior to the distribution. |
|
|
Are there risks associated with owning
shares of Vylor common stock? |
Yes. Our business is subject to both general and specific risks, including risks relating to our business, our relationship with New Corteva following the spin-off and of us being a separate, publicly traded company. Accordingly, you should read carefully the information set forth in the section entitled “Risk Factors” in this information statement. |
|
|
What will govern my rights as a Vylor stockholder? |
The rights of Vylor stockholders will be governed by Delaware law, as well as our amended and restated certificate of incorporation and our amended and restated bylaws. For additional details regarding Vylor common stock and Vylor stockholder rights, see the section of this information statement entitled “Description of Our Capital Stock.” |
|
|
Who will manage Vylor after the spin-off? |
After the spin-off, Vylor’s Chief Executive Officer will be Charles V. Magro, who currently serves as Corteva’s Chief Executive Officer, and Vylor’s Executive Vice President and Chief Financial Officer will be David P. Johnson, who currently serves as Corteva’s Executive Vice President and Chief Financial Officer. These two executives, along with the rest of their expected senior leadership team, have extensive experience managing Vylor’s businesses, as well as governance, management and administration of a publicly traded company. |
|
|
|
For additional information regarding Corteva’s expected named executive officers and other members of its management team, see the section of this information statement entitled “Management.” |
|
|
Does Vylor intend to pay cash
dividends? |
We expect that we will pay a quarterly dividend following the spin-off. The declaration, payment, timing and amount of any dividend following the spin-off will be subject to the sole discretion of our board of directors and will depend upon many factors, including our financial condition and prospects, our capital requirements and access to capital markets, covenants associated with certain of our debt obligations, industry practice, legal requirements and other factors that our board of directors may deem relevant, and there can be no assurances that we will continue to pay a dividend in the future. There can also be no assurance that, after the spin-off, the combined annual dividends, if any, on our common stock and the common stock of New Corteva will be equal to the annual dividends on Corteva common stock prior to the spin-off. |
|
|
What will Vylor’s relationship be
with New Corteva following the spin-off? |
Prior to the distribution, we expect to enter into the Separation and Distribution Agreement with Corteva to facilitate the spin-off and provide a framework for the relationship between us and New Corteva after the spin-off. We also plan on entering into certain other agreements with Corteva, including the Tax Matters Agreement, the Employee Matters Agreement, the Transition Services Agreements, the Intellectual Property Matters Agreement, and certain other agreements relating to intellectual property, services, supply, real estate and other commercial matters. These agreements will collectively provide the terms of the allocation between us and New Corteva of the assets, liabilities and obligations of Corteva (including its investments, property and employee benefits and tax-related assets and liabilities) and will govern the relationship between us and New Corteva subsequent to the spin-off. For additional information regarding the Separation and Distribution Agreement and other transaction agreements, see the sections entitled “Risk Factors—Risks Related to the Spin-Off” and “Our Relationship with New Corteva Following the Spin-Off.” |
|
|
Do I have appraisal rights in
connection with the spin-off? |
Corteva stockholders are not entitled to appraisal rights in connection with the spin-off. |
|
|
Who is the transfer agent and registrar
for Vylor common stock? |
Following the spin-off, Computershare will serve as transfer agent and registrar for Vylor common stock. |
|
|
|
Computershare currently serves as Corteva’s transfer agent and registrar. In addition, Computershare will serve as the distribution agent in the distribution and will assist Corteva in the distribution of Vylor common stock to Corteva stockholders. |
|
|
Where can I get more information? |
If you have any questions relating to the mechanics of the distribution, you should contact Computershare, as the distribution agent at: |
|
|
|
1-833-388-2882 or 1-781-575-3120 (outside the U.S.) |
|
|
|
Before the spin-off, if you have any questions relating to Corteva, you should contact Corteva at: |
|
|
|
Investor Relations |
|
|
|
1-302-485-3400 |
|
|
|
After the spin-off, if you have any questions relating to New Corteva, you should contact New Corteva at: |
|
|
|
Investor Relations |
|
|
|
1-302-485-3400 |
|
|
|
After the spin-off, if you have any questions relating to Vylor, you should contact Vylor at: |
|
|
|
Investor Relations |
RISK FACTORS
You should carefully consider the following risks and other information in this information statement in evaluating us and Vylor common stock. The risk factors generally have been separated into five groups: risks related to our industry, risks related to our operations, risks related to our intellectual property, risks related to the spin-off and risks related to Vylor common stock.
Any of the following risks, as well as additional risks and uncertainties not currently known to us or that we currently deem immaterial, could materially and adversely affect our business, results of operations or financial condition. Our operations could be affected by various risks, many of which are beyond our control. Based on current information, we believe that the following identifies the most significant risks that could affect our business, results of operations or financial condition. Past financial performance may not be a reliable indicator of future performance and historical trends should not be used to anticipate results or trends in future periods. See the section entitled “Cautionary Statement Concerning Forward-Looking Statements” for more details.
Risks Related to Our Industry
Vylor may not be able to obtain or maintain the necessary regulatory approvals for some of its products, which could restrict its ability to sell those products in some markets.
Regulatory and legislative requirements affect the development, manufacture and distribution of Vylor’s products, including the testing and planting of seeds containing Vylor’s biotechnology traits, and the import of crops grown from those seeds, and non-compliance can harm Vylor’s sales and profitability.
Seed products incorporating biotechnology derived traits, whether through gene modification or gene editing, as well as seed applied technology products must be extensively tested for safety, efficacy and environmental impact before they can be registered for production, use, sale or commercialization in a given market. In certain jurisdictions, Vylor must periodically renew its approvals for biotechnology products, which typically require Vylor to demonstrate compliance with then-current standards which generally are more stringent since the prior registration. The regulatory approvals process is lengthy, costly, complex and in some markets unpredictable, with requirements that can vary by product, technology, industry and country. The regulatory approvals process for products that incorporate novel modes of action or new technologies can be particularly unpredictable and uncertain due to the then-current state of regulatory guidelines and objectives, as well as governmental policy considerations and non-governmental organization and other stakeholder considerations. The uncertainty and increased length of regulatory approvals and frameworks may reduce Vylor’s return on its research and development investments, impede its ability to meet sales, profitability, or yield improvement metrics, or cause it to fail to meet its strategic objectives related to gene editing and other technology investments.
Furthermore, the detection of biotechnology traits, including gene edited traits, not approved in the country in which Vylor sells or cultivates its product, or in a country to which Vylor imports its product, may affect Vylor’s ability to supply or export its products, or even result in crop destruction, product recalls or trade disruption, which could result in lawsuits and termination of licenses related to biotechnology traits. Delays in obtaining regulatory approvals to import, including those related to the importation of crops grown from seeds containing certain traits or treated with specific chemicals in seed applied technologies, may influence the rate of adoption of new products in globally traded crops.
Additionally, the regulatory environment may be impacted by the activities of non-governmental organizations and special interest groups and stakeholder reaction to actual or perceived impacts of new and existing technology, products or processes on safety, health and the environment. Obtaining and maintaining regulatory approvals requires submitting a significant amount of information and data, which may require participation from technology providers. In addition, there has been an increase in recent years in the number of lawsuits filed by those who identify themselves as public or environmental interest groups seeking to invalidate pesticide product registrations, including those for Enlist One®, and/or challenge the way federal or state governmental entities apply the rules and regulations governing pesticide produce use. The invalidation of crop protection registrations or further restrictions on use may reduce the demand for seed products developed to tolerate these crop protection technologies.
Regulatory standards and trial procedures are continuously changing. The pace of change together with the lack of regulatory harmony could result in unintended noncompliance. Responding to these changes and meeting existing and new requirements may involve significant costs or capital expenditures or require changes in business practice that could result in reduced profitability. The failure to receive necessary permits or approvals, or the invalidation thereof, could have near- and long-term effects on Vylor’s ability to produce and sell some current and future products.
The successful development and commercialization of Vylor’s pipeline products will be necessary for Vylor’s growth.
Vylor uses advanced breeding technologies to produce hybrids and varieties with superior performance in farmers’ fields and uses biotechnology to introduce traits that enhance specific characteristics of its crops. Vylor also uses advanced analytics, software tools, mobile communications and new planting and monitoring equipment to provide agronomic recommendations to growers.
New product concepts may be abandoned for many reasons, including greater anticipated development costs, technical difficulties, lack of efficacy, regulatory obstacles or inability to market under regulatory frameworks, competition, inability to prove the original concept, lack of demand and the need to divert focus, from time to time, to other initiatives with perceived opportunities for better returns. The processes of breeding, biotechnology trait discovery and development and trait integration are lengthy, and a very small percentage of the genes and germplasm Vylor tests is selected for commercialization. Furthermore, the length of time and the risk associated with the breeding and biotech pipelines are interlinked because both are required as a package for commercial success in markets where biotech traits are approved for growers, since seed hybrids and varieties could require editing or modification to tolerate higher doses and/or new varieties of herbicides and pesticides as weeds and insects develop resistance. Commercial transitions to Vylor’s new technologies can take several years to complete, and weed and insect resistance may develop faster than Vylor can respond with new technologies or enhancements to existing technologies. In countries where biotech traits are not approved for widespread use, Vylor’s seed sales depend on the quality of its germplasm. Even when initial commercialization efforts have been promising, there are no guarantees that anticipated levels of product acceptability within Vylor’s markets will be achieved or that higher quality products will not be developed by Vylor’s competitors in the future.
Speed in discovering, developing, protecting and responding to new technologies, including through the use of gene editing, artificial intelligence and new technology-based distribution channels that accelerate Vylor’s product development timelines and could facilitate its ability to engage with customers and end users, and in bringing related products to market is a significant competitive advantage. Commercial success frequently depends on being the first company to the market, and many of Vylor’s competitors are also making considerable investments in similar new biotechnology products, improved germplasm products and agronomic recommendation products.
The degree of public understanding and acceptance or perceived public acceptance of Vylor’s biotechnology and other agricultural products and technologies can affect Vylor’s sales and results of operations by affecting planting approvals, regulatory requirements and customer purchase decisions.
Concerns and claims regarding the safe use of seeds with biotechnology traits, whether through gene editing or gene modification, and seed applied technology in general, and their potential impact on health and the environment, reflect a growing trend in societal demands for increasing levels of product safety and environmental protection. These include concerns and claims that increased use of seed applied technology products and the use of biotechnology traits meant to reduce the resistance of weeds or pests to control by crop protection products could increase or accelerate such resistance and otherwise negatively impact health and the environment. These and other concerns could manifest themselves in delays or failures in obtaining or retaining regulatory approvals, delayed product launches, lack of market acceptance, product discontinuation, litigation, continued pressure for and adoption of more stringent regulatory intervention, termination of supply agreements, legal claims, preferred purchases and stockholder proposals. These and other concerns could also influence public perceptions, the viability or continued sales of certain of Vylor’s products, Vylor’s reputation and the cost to comply with regulations. As a result, such concerns could have a material adverse effect on Vylor’s business, results of operations, financial condition and cash flows.
Vylor’s business is subject to various competition and antitrust rules and regulations around the world, and as the size of its business grows, scrutiny of its business by legislators and regulators in these areas may intensify.
On December 6, 2025, President Trump issued an executive order titled “Addressing Security Risks from Price Fixing and Anti‑Competitive Behavior in the Food Supply Chain.” The order directs the U.S. Department of Justice (“DOJ”) and the U.S. Federal Trade Commission (“FTC”) to establish Food Supply Chain Security Task Forces focused on investigating anti‑competitive conduct across food supply sectors, including seeds, and, critically, assessing whether control by foreign entities is increasing U.S. food prices or creating national or economic security risks. While the ultimate impact of the executive order will depend on the actions ultimately resulting from the U.S. regulatory authorities, actions taken by such authorities may increase the regulation and regulatory costs associated with the agriculture industry in the future and restrict Vylor from pursuing certain growth opportunities, including mergers or acquisitions.
Scrutiny from regulators in the U.S. and abroad may intensify as Vylor’s business presence grows or as industry concentration increases. This scrutiny and related investigations, even absent an enforcement action, may result in damage to Vylor’s reputation, significant defense expense, as well as become a distraction to management. If antitrust or competition enforcement actions are brought against Vylor, such actions could result in regulators imposing fines, penalties, or restrictions on Vylor’s business practices in a manner that could significantly impact its results of operations.
Changes in agricultural and related policies of governments and international organizations may prove unfavorable.
In many markets there are various pressures to reduce government subsidies to farmers, which may inhibit the growth in these markets of products used in agriculture. In addition, government programs that provide financial support or create incentives for farmers, including those established by the U.S. Farm Bill, can be temporary in nature, or may be modified or discontinued. However, it is difficult to predict accurately whether, and if so when, such changes will occur. Vylor expects that the policies of governments and international organizations will continue to affect the planting choices made by growers as well as the income available to growers to purchase products used in agriculture and, accordingly, the operating results of the agriculture industry.
The costs of complying with evolving regulatory requirements could negatively impact Vylor’s business, results of operations and financial condition. Actual or alleged violations of environmental laws or permit requirements could result in restrictions or prohibitions on plant operations, substantial civil or criminal sanctions, as well as the assessment of strict liability and/or joint and several liability.
Vylor is subject to extensive federal, state, local and foreign laws, regulations, rules and ordinances relating to pollution, protection of the environment, wastewater discharges, the storage, handling, transportation, treatment, disposal and remediation of hazardous substances and waste materials and the use of genetically modified seeds and seed applied technologies by growers.
Environmental and health and safety laws, regulations and standards expose Vylor to the risk of substantial costs and liabilities. As is typical for businesses like Vylor’s, soil and groundwater contamination has occurred in the past at certain sites and may be identified at other sites in the future. Disposal of waste from Vylor’s business at off-site locations also exposes it to potential remediation costs.
Costs and capital expenditures relating to environmental, health or safety matters are subject to evolving regulatory requirements and depend on the timing of the promulgation and enforcement of specific standards which impose the requirements. Moreover, changes in environmental regulations could inhibit or interrupt Vylor’s operations, or require modifications to its production processes in the future. Accordingly, environmental, health or safety regulatory matters could result in significant unanticipated costs or liabilities, which may be materially higher than Vylor’s accruals.
Climate change and unpredictable seasonal and weather factors could impact Vylor’s sales and earnings.
The agriculture industry is subject to seasonal and weather factors, which can vary unpredictably from period to period. Weather factors can affect the presence of disease and can affect supply chains and the quality, volume and cost of seed produced for sale as well as demand and product mix. Seed yields can be higher or lower than planned, which could lead to higher inventory and related write-offs. Climate change may increase the frequency or intensity of extreme weather such as storms, floods, heat waves, droughts and other events that could affect the quality, volume and cost of seed produced for sale as well as demand and product mix. Climate change may also affect the availability and suitability of arable land and contribute to unpredictable shifts in the average growing season, pest pressures and types of crops produced.
Vylor participates in an industry that is highly competitive and has undergone consolidation, which could increase competitive pressures.
Vylor currently faces significant competition in the markets in which it operates. In most segments of the market, the number of products available to the grower is steadily increasing as new products are introduced. At the same time, certain products are coming off patent and are thus available to generic producers for commercialization. Upon the loss or expiration of patent protection for one of Vylor’s products or of a product that Vylor licenses, or upon the “at- risk” launch (despite pending patent infringement litigation against the generic product) by a generic manufacturer of a generic version of one of Vylor’s patented products or of a product that Vylor licenses, Vylor can lose a major portion of revenues for that product, which can have a material adverse effect on Vylor’s business. Additionally, data analytic tools and web-based new direct purchase models offer increased transparency and comparability, which creates price pressures. Vylor cannot predict the pricing or promotional actions of its competitors. Aggressive marketing or pricing by Vylor’s competitors could adversely affect Vylor’s business, results of operations and financial condition. As a result, Vylor continues to face significant competitive challenges.
Recent government funding and staff reductions could hinder our ability to receive timely regulatory approvals.
Vylor’s genetically modified and gene edited seed products are subject to regulatory oversight under the Coordinated Framework for the Regulation of Biotechnology, which includes the regulatory authority of the USDA addressing plant safety, as well as the authority of the FDA for food and feed safety. Vylor’s seed applied technology products and certain biotechnology-developed seed products that express pesticidal traits are also regulated by the EPA to verify that there is no unreasonable adverse effect to the environment. For Vylor’s seed applied technology products, the EPA is responsible for registering and overseeing the approval and marketing of these products, while the USDA and the FDA monitor levels of residue of these products permitted on or in crops. See the section entitled “Business – Regulatory Considerations” for additional information on the regulation of our business.
Significant staff or funding reductions, along with any extended shutdown of the federal government, may significantly impact the timelines for reviewing our regulatory submissions. Longer-term structural changes at relevant federal agencies, including shifts in enforcement focus, review processes, evidentiary standards and resource allocation, may extend the time it takes to commercialize our products, thereby having a material adverse effect on our business, results of operations, and the value of our intellectual property.
Our sales may be adversely affected should a competitor successfully establish an intermediary platform for the sale of Vylor’s products or otherwise position itself between Vylor and its customers.
Vylor services customers in part through the Pioneer direct sales channel in key agricultural geographies, including the United States. In addition, Vylor supplements this approach with strong retail channels, including distributors, agricultural cooperatives and dealers, and with digital and data solutions that assist farmer decision-making with a view to optimize their product selection and maximize their yield and profitability. While our indirect channels extend our reach and increase exposure of our products to other potential customers, including smaller farmers or farmers in less concentrated areas, there can be no assurance that Vylor will continue to be successful in this regard. If a competitor were to successfully establish an intermediary platform for distribution of Vylor’s products, it may disrupt Vylor’s distribution model. In such a circumstance, Vylor’s sales may be adversely affected.
Risks Related to Our Operations
Our business, financial condition and results of operations could be materially affected by disruptions in the global economy caused by geopolitical and military conflicts.
Military conflict or related geopolitical tensions and disputes, including increased trade barriers or restrictions on global trade, could result in, among other things, cyberattacks, further supply disruptions, and changes to foreign exchange rates and financial markets, any of which may adversely affect our business and supply chains. Such geopolitical instability and uncertainty has negatively impacted our ability to sell to, ship products to, collect payments from, and support customers in certain regions. Logistics restrictions, including closures of air space and shipping ports, the reduction of the availability of farmable land, and the destruction of facilities could further increase these adverse impacts and negatively impact demand for our products in impacted regions. The global economy was negatively impacted by the military conflict between Russia and Ukraine and we experienced shortages in materials, the inability to insure shipments, and increased costs for transportation, energy and other inputs due in part to the negative impact of this conflict. The current military conflict between the U.S., Israel and Iran and further military conflict or related geopolitical tensions, including increased trade barriers or restrictions on global trade, could result in, among other things, cyberattacks, further supply disruptions, and changes to foreign exchange rates and financial markets, any of which may adversely affect our business and supply chains. Similar or more severe disruptions, trade barriers, business risks, asset seizures, and volatility in foreign exchange and financial markets could occur if tensions or conflicts between countries escalate. Further expansion of economic disruption or in the scope of global or regional conflicts could have a material adverse effect on our results of operations.
Volatility in Vylor’s input costs could have a significant impact on Vylor’s business, results of operations and financial condition.
Vylor’s input costs are variable and primarily based on the costs associated with growers’ production of Vylor’s products. For example, corn and soybean commodity prices may be impacted by factors such as seasonal weather conditions and overall supply and demand. In addition, production processes consume significant amounts of energy, water, and other inputs, the costs of which are subject to worldwide supply and demand as well as other factors beyond Vylor’s control. Vylor refers to these costs collectively as input costs. Significant variations in input costs affect Vylor’s operating results from period to period.
Vylor enters into over-the-counter and exchange traded derivative commodity instruments to hedge its exposure to price fluctuations on commodities. In addition, Vylor takes actions to offset the effects of higher input costs through selling price increases, productivity improvements and cost reduction programs. Success in offsetting higher input costs with price increases is largely influenced by competitive and economic conditions and could vary significantly depending on the market served. If Vylor is not able to fully offset the effects of higher input costs, it could have a significant impact on its financial results.
Vylor’s operations outside the United States are subject to risks and restrictions, which could negatively affect Vylor’s business, results of operations and financial condition.
Vylor’s operations outside the United States are subject to risks and restrictions, including fluctuations in foreign currency exchange rates; inflation; exchange and price control regulations; corruption risks; competitive restrictions; changes in local political or economic conditions; import and trade restrictions; import or export licensing requirements and trade policy; and other potentially detrimental domestic and foreign governmental practices or policies affecting U.S. companies doing business abroad. In addition, Vylor’s international operations are sometimes in countries with unstable governments, economic or fiscal challenges, military or political conflicts, local epidemics or pandemics, significant levels of crime and organized crime, or developing legal systems. This may increase the risk to Vylor’s employees, subcontractors or other parties, and of other liabilities, such as property loss or damage to Vylor’s products, and may affect Vylor’s ability to safely operate in, import into, or receive raw materials from these countries.
Additionally, Vylor’s ability, or the ability of its customers, to export its products and its sales outside the United States has been, and may continue to be, adversely affected by significant changes in trade, tax or other policies, including other countries retaliating by purchasing less from the United States and the imposition of their own trade restrictions and/or increased tariffs in response to substantial changes to U.S. tariff, trade and tax policies. Furthermore, significant changes in trade, tax, and other related policies or enforcement may pose business and financial risks, including raising the cost of manufacturing inputs and altering customer demands.
Although Vylor has operations throughout the world, Vylor’s sales outside the United States in 2025 were principally to customers in Brazil, Eurozone countries, and Canada. Further, Vylor’s largest currency exposures are the Brazilian real, Canadian dollar, Euro and Turkish lira. Inflation, market uncertainty or an economic downturn in these geographic areas could reduce demand for Vylor’s products and result in decreased sales volume, which could have a negative impact on Vylor’s results of operations. In addition, changes in exchange rates may affect Vylor’s results of operations, financial condition and cash flows in future periods. Vylor actively manages currency exposures that are associated with net monetary asset positions.
Vylor’s business, results of operations and financial condition could be adversely affected by industrial espionage and other disruptions to its supply chain, information technology or network systems.
Business and/or supply chain disruptions, plant and/or power outages and information technology system and/or network disruptions, regardless of cause including acts of sabotage, employee error or other actions, geopolitical activity, military conflict, local epidemics or pandemics, weather events and natural disasters, could seriously harm Vylor’s operations as well as the operations of its customers and suppliers. For example, an epidemic in locations where Vylor has significant operations, sales, or key suppliers could have a material adverse effect on Vylor’s results of operations.
Business and/or supply chain disruptions may also be caused by security breaches, which could include, for example, ransomware attacks and attacks on information technology and infrastructure by hackers, viruses, breaches due to employee error or actions or other disruptions. Vylor and/or its suppliers may fail to effectively prevent, detect and recover from these or other security breaches and, as a consequence, such breaches could result in misuse of Vylor’s assets, business disruptions, loss of property including trade secrets and confidential business information, legal claims or proceedings, reporting errors, processing inefficiencies, negative media attention, loss of sales and interference with regulatory and data privacy compliance.
Like most major corporations, Vylor is the target of industrial espionage, including cyber-attacks, from time to time. Vylor has determined that these incidents have resulted, and could result in the future, in unauthorized parties gaining access to certain confidential business information. Although management does not believe that Vylor has experienced any material losses to date related to industrial espionage and security breaches, including cybersecurity incidents, there can be no assurance that Vylor will not suffer such losses in the future.
Vylor actively manages the risks within its control that could lead to business disruptions and security breaches. As these threats continue to evolve, particularly around cybersecurity and artificial intelligence, Vylor may be required to expend significant resources to enhance its control environment, processes, practices and other protective measures. Despite these efforts, such events could also have a material adverse effect on Vylor’s business, financial condition, results of operations and reputation. Additionally, any losses from such an event may be excluded from, or in excess of, the coverage provided by Vylor’s insurance policies.
Vylor’s business, results of operations and financial condition could be adversely affected by environmental, litigation and other commitments and contingencies.
As a result of Vylor’s operations, Vylor incurs environmental operating costs for pollution abatement activities including waste collection and disposal, installation and maintenance of air pollution controls and wastewater treatment, emissions testing and monitoring and obtaining permits. Vylor also incurs environmental operating costs related to environmental related research and development activities including environmental field and treatment studies as well as product testing. In addition, Vylor maintains and periodically reviews and adjusts its accruals for probable environmental remediation and restoration costs.
Vylor expects to continue to incur environmental operating costs since it will operate product handling and distribution facilities that are subject to a broad array of environmental laws and regulations. These rules are subject to change by the implementing governmental agency, which Vylor monitors closely. Vylor’s environmental policy requires that its operations fully meet or exceed legal and regulatory requirements. In addition, Vylor expects to continue certain voluntary programs, and could consider additional voluntary actions, to reduce air emissions, minimize the generation of hazardous waste, decrease the volume of water use and discharges, and increase the efficiency of energy use. Costs to comply with complex environmental laws and regulations, as well as internal voluntary programs and goals, are significant and Vylor expects these costs will continue to be significant for the foreseeable future. Over the long-term, such expenditures are subject to considerable uncertainty and could fluctuate significantly.
Vylor accrues for environmental matters when it is probable that a liability has been incurred and the amount can be reasonably estimated. As remediation activities vary substantially in duration and cost from site to site, it is difficult to develop precise estimates of future site remediation costs. Vylor expects to base such estimates on several factors, including the complexity of the geology, the nature and extent of contamination, the type of remedy, the outcome of discussions with regulatory agencies and other Potentially Responsible Parties (“PRPs”) at multi-party sites and the number of, and financial viability of, other PRPs. Considerable uncertainty exists with respect to environmental remediation costs and, under adverse changes in circumstances, the potential liability may be materially higher than Vylor’s accruals.
Vylor faces risks arising from various unasserted and asserted litigation matters arising out of the normal course of its business operations, including intellectual property, commercial, product liability, environmental and antitrust lawsuits. It is not possible to predict the outcome of these various proceedings and any potential impact on Vylor. An adverse outcome in any one or more of these matters may result in losses not fully covered by Vylor’s insurance policies and could be material to Vylor’s financial results. Various factors or developments can lead to changes in current estimates of liabilities. Such factors and developments may include, but are not limited to, additional data, safety or risk assessments, as well as a final adverse judgment, significant settlement or changes in applicable law. A future adverse ruling or unfavorable development could result in future charges that could have a material adverse effect on Vylor.
In the ordinary course of business, Vylor may make certain commitments, including representations, warranties and indemnities relating to current and past operations and issuing guarantees of third-party obligations. If Vylor were required to make payments as a result, such payments could exceed the amounts accrued, thereby adversely affecting Vylor’s financial condition and results of operations.
Vylor is dependent on its relationships or contracts with third parties with respect to certain of its seed production, licenses or commercialization.
Vylor is dependent on third parties in the research, development and commercialization of its products and enters into transactions including, but not limited to, grower agreements and licensing agreements in connection with Vylor’s business. The majority of Vylor’s corn hybrids and soybean varieties sold to customers contain biotechnology traits that Vylor licenses from third parties under long-term license agreements. If Vylor loses its rights under such licenses, it could negatively impact Vylor’s ability to obtain future licenses on competitive terms, commercialize new products and generate sales from existing products. Vylor may elect to out-license its technology, including germplasm. There can be no guarantee that such licensing will not ultimately strengthen Vylor’s competition thereby adversely impacting Vylor’s results of operations.
While Vylor relies heavily on third parties for multiple aspects of its business and commercialization activities, Vylor does not control many aspects of such third parties’ activities. Third parties may not complete activities on schedule or in accordance with Vylor’s
expectations. Failure by one or more of these third parties to meet their contractual or other obligations to Vylor or to comply with applicable laws or regulations, or any disruption in the relationship between Vylor and one or more of these third parties could delay or prevent the development, approval or commercialization of Vylor’s products and could also result in non-compliance or reputational harm, all with potential negative implications for Vylor’s business.
In addition, Vylor’s agreements with third parties may obligate it to meet certain contractual or other obligations to third parties. For example, Vylor may be obligated to meet certain thresholds or abide by certain boundary conditions. If Vylor were to fail to meet such obligations to the third parties, its relationship with such third parties may be disrupted. Such a disruption could negatively impact certain of Vylor’s licenses on which it depends, could cause reputational harm, and could negatively affect Vylor’s business, results of operations and financial condition.
Vylor’s customers may be unable to pay their debts to Vylor, which could adversely affect Vylor’s results of operations and cash flows.
Vylor offers its customers barter programs and financing programs with credit terms generally less than one year from invoicing in alignment with the growing season. Due to these credit practices as well as the seasonality of Vylor’s operations, Vylor may need to issue short-term debt at certain times of the year to fund its cash flow requirements. Vylor’s customers may be exposed to a variety of conditions that could adversely affect their ability to pay their debts or deliver the products subject to their respective barter contracts. For example, customers in economies experiencing an economic downturn or in a region experiencing adverse growing conditions may be unable to repay their obligations or deliver product under their barter contracts to Vylor, which could adversely affect Vylor’s results of operations and cash flows.
If Vylor fails to effectively manage acquisitions, divestitures, strategic investments, restructurings, cost savings initiatives and other portfolio actions, such actions may not have the results anticipated.
From time-to-time, Vylor will evaluate acquisition candidates that may strategically fit Vylor’s business and/or growth objectives, along with making investments in strategic technologies through its Vylor Catalyst platform. If Vylor is unable to successfully integrate and develop acquired businesses, Vylor could fail to achieve expected increases in revenues and operating results, as well as anticipated investment returns, synergies and cost savings, which could have a material adverse effect on Vylor’s financial results. Vylor continually reviews its portfolio of assets for contributions to its objectives and alignment with its strategy. However, Vylor may not be successful in separating underperforming or non-strategic assets and gains or losses on the divestiture of, or lost operating income from, such assets may affect Vylor’s earnings. Moreover, Vylor might incur asset impairment charges related to its investments and acquisitions, or divestitures that reduce its earnings. In addition, if the execution of these transactions, investments, or portfolio actions is not successful, it could adversely impact Vylor’s financial condition, results of operations and cash flows.
Vylor's use of artificial intelligence and machine learning technologies may result in reputational harm or liability.
Vylor has incorporated and may continue to incorporate artificial intelligence and machine learning technologies into our research and development platforms, marketing and agronomic programs, and analysis software. These solutions and features are advantageous to developing, enhancing, and maximizing the capabilities of our differentiated technologies and to our future growth over time. Although Vylor relies and expects to rely on these technologies, there can be no assurance that we will realize the desired or anticipated benefits from artificial intelligence and machine learning technologies or any at all. We may also fail to properly implement or utilize these technologies. Our competitors or other third parties may incorporate artificial intelligence and machine learning technologies into their products, platforms, software and services or otherwise within their business more quickly or more successfully than us, which could impair our ability to compete effectively and adversely affect our results of operations.
Additionally, our use of artificial intelligence and machine learning technologies may expose us to additional claims, demands and proceedings by private parties and regulatory authorities and subject us to legal liability as well as brand and reputational harm. For example, if outputs from artificial intelligence and machine learning technologies (or outputs that they assist in producing) are or are alleged to be deficient, inaccurate, or biased, or if such technologies or their development or deployment, including the collection, use, storage, disclosure or other processing of data used to train, create or operate such technologies, actually or allegedly infringe upon, misappropriate or otherwise violate third-party intellectual property rights, compromise confidential or proprietary information, including trade secrets, personal information or agronomic or research data, create cybersecurity vulnerabilities, or violate applicable laws, regulations, contractual obligations or other actual or asserted legal obligations to which we are or may become subject, then our business, financial condition and results of operations may be adversely affected.
The legal, regulatory, and policy environments around artificial intelligence and machine learning technologies are evolving rapidly, and we may become subject to new and evolving legal and other obligations. These and other developments may require us to make
significant changes to our use of artificial intelligence and machine learning technologies, including by limiting or restricting our use of these technologies, and may require us to make significant changes to our policies and practices, which may necessitate expenditure of significant time, expense, and other resources. We may also be required to develop, enhance or maintain governance, review, testing, monitoring and other controls relating to our use of artificial intelligence and machine learning technologies, including controls intended to support appropriate human oversight of such technologies and their outputs. Artificial intelligence and machine learning technologies also present emerging ethical issues, and if our use of these technologies becomes controversial, we may experience brand or reputational harm.
Vylor’s liquidity, business, results of operations and financial condition could be impaired if it is unable to raise capital through the capital markets or short-term debt borrowings.
Any limitation on Vylor’s ability to raise money in the capital markets or through short-term debt borrowings could have a substantial negative effect on Vylor’s liquidity. Vylor’s ability to affordably access the capital markets and/or borrow short-term debt in amounts adequate to finance its activities could be impaired as a result of a variety of factors, including factors that are not specific to Vylor, such as a severe disruption of the financial markets and, in the case of debt securities or borrowings, interest rate fluctuations. Due to the seasonality of Vylor’s business and the credit programs Vylor may offer its customers, net working capital investment and corresponding debt levels will fluctuate over the course of the year.
Vylor regularly extends credit to its customers to enable them to purchase products at the beginning of the growing season. Customer receivables may be used as collateral for short-term financing programs. Any material adverse effect upon Vylor’s ability to own or sell such customer receivables, including seasonal factors that may impact the amount of customer receivables Vylor owns, may materially impact Vylor’s access to capital.
Vylor has additional agreements with financial institutions to establish programs that provide financing for select customers of Vylor’s seed products in the United States, Latin America, Europe and Asia. The programs are renewed on an annual basis. In most cases, Vylor guarantees the extension of such credit to such customers. If Vylor is unable to renew these agreements or access the debt markets to support customer financing, Vylor’s sales may be negatively impacted, which could result in increased borrowing needs to fund working capital.
Vylor’s earnings, operations and business, among other things, will impact its credit ratings, costs and availability of financing. There can be no assurance that Vylor will maintain its prospective credit ratings. A decrease in the ratings assigned to Vylor by the ratings agencies may negatively impact Vylor’s liquidity and access to the debt capital markets and increase Vylor’s cost of borrowing and the financing of its seasonal working capital.
Global or regional health pandemics or epidemics could negatively impact Vylor’s business, financial condition and results of operations.
Vylor’s business, financial condition, and results of operations could be negatively impacted by human or animal pandemics or epidemics. The severity, magnitude and duration of pandemics or epidemics is uncertain, rapidly changing and difficult to predict. Future pandemics or epidemics and resulting illness, travel restrictions and workforce and operational disruptions could impact Vylor’s global supply chain, its operations and its routes to market or those of its suppliers, contract growers, or customers/distributors. These disruptions or Vylor’s failure to effectively respond to them could increase product or distribution costs, alter the timing of recognizing manufacturing costs, or impact the delivery of products to customers or their ability to pay.
Government pandemic or epidemic responses can significantly impact economic activity and markets around the world. Future outbreaks or pandemics could negatively impact customer demand and Vylor’s business, financial condition, and results of operations in numerous ways, including but not limited to increased market volatility that impacts Vylor’s hedging, financial forecasting, and liquidity, including its access to capital markets and delays or modifications to Vylor’s strategic plans and productivity initiatives.
Risks Related to Our Intellectual Property
Enforcing Vylor’s intellectual property rights, or defending against intellectual property claims asserted by others, could materially affect Vylor’s business, results of operations and financial condition.
Intellectual property rights, including patents, plant variety protection, trade secrets, confidential information, trademarks, trade names and other forms of trade dress, are important to Vylor’s business. Vylor endeavors to protect its intellectual property rights in jurisdictions in which its products are produced or used and in jurisdictions into which its products are imported. However, Vylor may be unable to obtain protection for its intellectual property in key jurisdictions. Further, changes in government policies and regulations,
including changes made in reaction to pressure from non-governmental organizations, or the public generally, could impact the extent of intellectual property protection afforded by such jurisdictions.
Competitors are increasingly challenging intellectual property positions and the outcomes to these challenges, including those with Inari, can be highly uncertain and negatively impact the value of Vylor’s intellectual property and investment return on its research and development. Additionally, Vylor has been subject to claims that its products violate third party intellectual property rights. Defending such claims, even those without merit, is time-consuming and expensive. In addition, any such claim could result in Vylor’s having to enter into, or continue, license agreements, develop non-infringing products or engage in litigation that could be costly. If challenges are resolved adversely, it could negatively impact Vylor’s ability to obtain licenses on competitive terms, develop and commercialize new products, generate sales from existing products or reduce its reliance on licensed technologies.
Vylor has designed and implemented internal controls to restrict use of, access to and distribution of its intellectual property. Despite these precautions, Vylor’s intellectual property is vulnerable to infringement, misappropriation and other unauthorized access, including through employee or licensee error or actions, theft and cybersecurity incidents, and other security breaches. When unauthorized access and use or counterfeit products are discovered, Vylor may report such situations to governmental authorities for investigation, as appropriate, and takes measures to mitigate any potential impact. Protecting intellectual property related to biotechnology is particularly challenging because theft is difficult to detect and biotechnology can be self-replicating.
In addition, because of the rapid pace of technological change, the confidentiality of patent applications in some jurisdictions and/or the uncertainty in predicting the outcome of complex proceedings relating to ownership and the scope of patents relating to certain emerging technologies, competitors may be issued patents related to Vylor’s business unexpectedly. These patents could reduce the value of Vylor’s commercial or pipeline products or, to the extent they cover key technologies on which Vylor has relied, require Vylor to seek to obtain licenses (and Vylor cannot ensure it would be able to obtain such a license on acceptable terms) or cease using the technology, no matter how valuable to Vylor’s business.
Legislation and jurisprudence on patent protection is evolving and changes in laws could affect Vylor’s ability to obtain or maintain patent protection for, and otherwise enforce Vylor’s patents related to, its products.
Vylor’s business may be adversely affected by the availability of counterfeit products.
A counterfeit product is one that has been deliberately and fraudulently mislabeled as to its identity and source. A counterfeit Vylor product, therefore, is one manufactured by someone other than Vylor, but which appears to be the same as an authentic Vylor product. The prevalence of counterfeit products is a significant and growing industry-wide issue due to a variety of factors, including, but not limited to, the following: the widespread use of the Internet, which has greatly facilitated the ease by which counterfeit products can be advertised, purchased and delivered to individual consumers; the availability of sophisticated technology that makes it easier for counterfeiters to make counterfeit products; and the relatively modest risk of penalties faced by counterfeiters compared to the large profits that can be earned by them from the sale of counterfeit products. Further, laws against counterfeiting vary greatly from country to country, and the enforcement of existing laws varies greatly from jurisdiction to jurisdiction. For example, in some countries, counterfeiting is not a crime; in others, it may result in only minimal sanctions. In addition, those involved in the distribution of counterfeit products use complex transport routes to evade customs controls by disguising the true source of their products.
Vylor’s global reputation makes its products prime targets for counterfeiting organizations. Counterfeit seed products may result in lower quality, non-uniform, and low-yielding crops because of the lack of regulation of their contents. Failure to mitigate the threat of counterfeit products could adversely impact Vylor’s business by, among other things, causing the loss of consumer confidence in Vylor’s name and in the integrity of its products, potentially resulting in lost sales and an increased threat of litigation.
Vylor undertakes significant efforts to counteract the threats associated with counterfeit products, including, among other things, working with regulatory authorities and multinational coalitions to combat the counterfeiting of products and supporting efforts by law enforcement authorities to prosecute counterfeiters; assessing new and existing technologies to seek to make it more difficult for counterfeiters to copy Vylor’s products and easier for consumers to distinguish authentic from counterfeit products; and working collaboratively with wholesalers, customs offices and law enforcement agencies to increase inspection coverage, monitor distribution channels and improve surveillance of distributors. No assurance can be given, however, that Vylor’s efforts and the efforts of others will be entirely successful, and the presence of counterfeit products may continue to increase.
Risks Related to the Spin-Off
The spin-off may not be completed on the contemplated timeline or at all.
The spin-off will be subject to the satisfaction or waiver of certain customary conditions. In addition, the timing of the spin-off will depend on the readiness of each business to operate as an independent public company and the finalization of appropriate capital structures for each.
There can be no assurance that all required conditions to complete the spin-off will be satisfied or, to the extent permitted by applicable law, waived. A failure to satisfy or waive these conditions, or the occurrence of unanticipated developments, could delay, prevent or otherwise adversely affect the completion of the spin-off. These potential developments, many of which are outside of our control, may include disruptions in general economic or financial market conditions, material adverse changes in business or industry conditions, unanticipated costs, difficulties or delays in obtaining required regulatory or tax approvals or clearances, and actions or challenges relating to the spin-off.
The spin-off may not achieve some or all of the intended benefits.
We believe that, following the spin-off, we will be better positioned to, among other things, allocate financial, operational and capital resources in a manner that reflects the distinct growth outlooks and strategic priorities of our business, pursue differentiated strategies and operating models aligned with our markets and value propositions, sharpen strategic and operational focus across core strengths, establish a tailored capital structure that supports the future capital needs of our business, and adapt more effectively to evolving industry dynamics. However, we may be unable to achieve some or all of these benefits. Following the spin-off, we will bear the full costs and responsibilities of operating as an independent public company, and these dis-synergies may exceed expectations. Moreover, we will be a smaller, less diversified enterprise than Corteva and, as a result, we may be more exposed to industry-specific risks and changing market conditions than we were before the spin-off. The spin-off may also prompt existing stockholders to divest holdings that no longer align with their investment objectives, potentially affecting the trading value of our common stock. Further, there can be no assurance that the combined value of the common stock of the two companies will be equal to or greater than the value of Corteva’s common stock had the spin-off not occurred.
The transfer to us of certain contracts, permits and other assets and rights may require the consents or approvals of, or provide other rights to, third parties and governmental authorities. If such consents or approvals are not obtained, we may not be entitled to the full benefit of such contracts, permits and other assets and rights, which could increase our expenses or otherwise harm our business and financial performance.
The Separation and Distribution Agreement will provide that certain contracts, permits and other assets and rights are to be transferred from Corteva or its subsidiaries to us or our subsidiaries in connection with the spin-off. The transfer of certain of these contracts, permits and other assets and rights may require consents or approvals of third parties or governmental authorities or provide other rights to third parties. In addition, in some circumstances, we and New Corteva may be joint beneficiaries of contracts, and we and/or New Corteva may need the consents of third parties in order to split or separate the existing contracts or the relevant portion of the existing contracts to us and New Corteva. Some parties may use consent requirements or other rights to seek to terminate contracts or obtain more favorable contractual terms from us, which, for example, could take the form of price increases. This could require us to expend additional resources in order to obtain the services or assets previously provided under the applicable contract or require us to seek arrangements with new third parties or obtain letters of credit or other forms of credit support. If we are unable to obtain the required consents or approvals, we may be unable to obtain the benefits, permits, assets and contractual commitments that are intended to be allocated to us as part of the spin-off, and we may be required to seek alternative arrangements to obtain services and assets that may be more costly and/or of lower quality. The termination or modification of these contracts or permits or the failure to timely complete the transfer or separation of these contracts, permits or other assets or rights could negatively affect our business, financial condition, results of operations and cash flows.
The costs to complete the spin-off will be significant.
We have incurred, and expect to incur, significant expenses in connection with the spin-off. One-time costs incurred for the spin-off by Vylor are expected to be approximately $385 million, exclusive of any financing costs, and consist primarily of financial advisory, information technology, legal, consulting and other professional advisory fees associated with the preparation and execution of the spin-off. While we have assumed a certain level of expense would be incurred in connection with the spin-off, there are many factors beyond our control that could affect the total amount or the timing of anticipated expenses.
There may also be additional unanticipated significant costs incurred in connection with the spin-off. For example, executing the spin-off will require significant time and attention from our senior management and employees, which could disrupt our ongoing business, negatively impact our relationships with employees, suppliers, customers, distributors, licensors and other stakeholders and adversely
affect our financial results and results of operations. Moreover, although we expect to receive an investment grade credit rating, a downgrade in Vylor’s credit rating as compared to Corteva’s credit rating may lead to increased borrowing costs for Vylor. In addition, there may be increased borrowing costs associated with the reallocation or taking on of new debt in connection with the spin-off.
If the spin-off were to fail to qualify as tax-free for U.S. federal income tax purposes, then New Corteva, and stockholders receiving Vylor common stock in connection with the distribution, could be subject to significant tax liabilities for which Vylor may be required to indemnify New Corteva.
It is a condition to the distribution that Corteva receives the Tax Opinions. The Tax Opinions will rely on certain facts, assumptions and undertakings, and certain representations from Corteva and Vylor, regarding the past and future conduct of the Seed Business and the Crop Protection Business, respectively, and other matters. Notwithstanding the receipt of the Tax Opinions, the Internal Revenue Service (“IRS”) could determine on audit that the spin-off (or a portion thereof) should be treated as a taxable transaction if it determines that any of these facts, assumptions, undertakings or representations are not correct or have been violated, or that the spin-off should be taxable for other reasons, including if the IRS were to disagree with the conclusions of the Tax Opinions. Additionally, while Corteva does not currently intend to waive any of the conditions to the distribution described in this information statement, Corteva may waive any of the conditions to the distribution (including the receipt by Corteva of the Tax Opinions) and proceed with the distribution even if all such conditions have not been satisfied. In the event of any waivers or material changes of the conditions to the distribution, we intend to communicate such waiver to stockholders through our reports filed with the SEC.
If the spin-off (or any portion thereof) ultimately is determined to be taxable under U.S. federal, state, local tax and/or foreign tax law, then New Corteva and Corteva stockholders could incur significant income tax liabilities under U.S. federal, state, local and/or foreign tax law.
Specifically, if the distribution ultimately is determined to be taxable, then a Corteva stockholder that received shares of Vylor common stock in connection therewith would be treated as having received a distribution of property in an amount equal to the fair market value of such shares (including any fractional shares sold on behalf of such stockholder) on the distribution date and could incur significant income tax liabilities. Such distribution would be taxable to such stockholder as a dividend to the extent of New Corteva’s current and accumulated earnings and profits, which would include any earnings and profits attributable to the gain recognized by New Corteva on the taxable distribution and could include earnings and profits attributable to certain internal transactions preceding the distribution. Any amount that exceeded New Corteva’s earnings and profits would be treated first as a non-taxable return of capital to the extent of such stockholder’s tax basis in its shares of Corteva common stock with any remaining amount being taxed as a gain on the Corteva stock. In the event the distribution is ultimately determined to be taxable, New Corteva would recognize corporate-level taxable gain on the distribution in an amount equal to the excess, if any, of the fair market value of Vylor common stock distributed to Corteva stockholders on the distribution date over Corteva’s tax basis in such stock. For more detailed discussion, see the section entitled “Material U.S. Federal Income Tax Consequences of the Spin-Off.”
Generally, taxes resulting from the failure of the spin-off to qualify for non-recognition treatment for U.S. federal income tax purposes would be imposed on New Corteva or Corteva stockholders. Under the Tax Matters Agreement that we expect to enter into with Corteva (which we refer to, after the spin-off, as New Corteva), Vylor will be obligated to indemnify New Corteva against such taxes imposed on New Corteva in certain circumstances. For a more detailed discussion, see the section entitled “Our Relationship with New Corteva Following the Spin-Off—Tax Matters Agreement.”
We will agree to numerous restrictions to preserve the tax-free treatment of the spin-off for U.S. federal income tax purposes, which may reduce our strategic and operating flexibility.
Our ability to engage in certain transactions could be limited or restricted after the distribution to preserve, for U.S. federal income tax purposes, the tax-free nature of the spin-off. Even if the distribution otherwise qualifies for tax-free treatment to Corteva stockholders, the distribution may result in corporate-level taxable gain to New Corteva under Section 355(e) of the Code if a transaction results in a change of ownership of 50 percent or greater in Vylor as part of a plan or series of related transactions that includes the distribution. The process for determining whether an acquisition or issuance triggering these provisions has occurred, the extent to which any such acquisition or issuance results in a change of ownership and the cumulative effect of any such acquisition or issuance together with any prior acquisitions or issuances is complex, inherently factual and subject to interpretation of the facts and circumstances of a particular case. Any acquisitions or issuances of Vylor common stock within a two-year period after the distribution date generally are presumed to be part of such a plan that includes the distribution, although such presumption may be rebutted. As a result of these limitations, under the Tax Matters Agreement that we expect to enter into with Corteva (which we refer to, after the spin-off, as New Corteva), for the two-year period following the distribution date, we are prohibited, except in certain circumstances, from, among other things:
•entering into any transaction resulting in the acquisition by another party of a certain percentage of our assets, whether by merger or otherwise;
•dissolving, merging, consolidating or liquidating;
•undertaking or permitting any transaction relating to Vylor stock, including issuances, redemptions or repurchases other than certain, limited, permitted issuances and repurchases;
•affecting the relative voting rights of Vylor stock, whether by amending Vylor’s certificate of incorporation or otherwise; or
•ceasing to actively conduct our business.
These restrictions may significantly limit our ability to pursue certain strategic transactions or other transactions that we may believe to otherwise be in the best interests of our stockholders or that might increase the value of our business.
Following the spin-off we will need to provide or arrange for certain services to be provided that are currently provided by Corteva.
We have historically relied on Corteva (which we refer to, after the spin-off, as New Corteva) to provide us with a range of services. Following the spin-off, New Corteva’s support will be limited to the transition and other services described under “Our Relationship with New Corteva Following the Spin-Off.” These arrangements do not encompass all services previously provided to us by Corteva and are generally time-limited. As a result, following the spin-off and upon the expiration of such arrangements, we will need to provide internally or obtain from unaffiliated third parties certain services we currently receive from Corteva. These services include certain information technology, research and development insurance, compliance, and site services activities, the effective and appropriate performance of which is critical to our operations. We may be unable to replace these services in a timely manner or on terms and conditions as favorable as those we currently receive from Corteva. In particular, information technology networks and systems are complex and duplicating these networks and systems will be challenging. Because certain portions of our business previously received these services from Corteva, we may be unable to successfully establish the infrastructure or implement the changes necessary to effectively perform these activities within the context of our consolidated business, or we may incur additional costs in doing so that could adversely affect our business. In addition, if New Corteva does not continue to perform effectively the transition services and the other services that are called for under the services and other related agreements entered into in connection with the spin-off, we may not be able to operate our business effectively and our profitability may decline. If we fail to obtain the quality of administrative services necessary to operate effectively or incur greater costs in obtaining these services, our profitability, financial condition and results of operations may be materially and adversely affected.
We may be held liable to New Corteva if we fail to perform under our agreements with New Corteva, and the performance of such services may negatively affect our business and operations.
In connection with the spin-off, we and Corteva (which we refer to, after the spin-off, as New Corteva), and/or certain of our respective affiliates, will enter into various agreements, including but not limited to, the Tax Matters Agreement, the Employee Matters Agreement, the Transition Services Agreements, the Intellectual Property Matters Agreement, and certain other commercial agreements. See the section entitled “Our Relationship with New Corteva Following the Spin-Off.” These agreements will provide for the performance of certain services or the provision of goods by each of Vylor and New Corteva for the benefit of the other for a period of time after the spin-off. If we do not satisfactorily perform our obligations under these agreements, we may be held liable for any resulting losses suffered by New Corteva subject to certain limits. In addition, during the transition support periods under the transition arrangements, our management and employees may be required to divert their attention away from our business in order to provide services to New Corteva, which could adversely affect our business.
Following the spin-off, we may not be adequately prepared to meet the requirements of an independent, publicly traded company on a timely or cost-effective basis.
As an independent public company, we will separately become subject to the reporting requirements of the Exchange Act, the Sarbanes-Oxley Act of 2002, as amended, and the Dodd-Frank Wall Street Reform and Consumer Protection Act, as amended, and we will be required to prepare our financial statements according to the rules and regulations required by the SEC. These reporting and other obligations will place significant demands on our management and on administrative and operational resources. Moreover, to comply with these requirements, we anticipate that we will need to migrate our systems, including information technology systems, implement additional financial and management controls, reporting systems and procedures, and hire additional accounting and finance staff. We expect to incur additional annual expenses related to these requirements, and those expenses may be significant. If we are unable to upgrade our financial and management controls, reporting systems, information technology and procedures in a timely and effective
fashion, our ability to comply with our financial reporting requirements and other rules that apply to reporting companies under the Exchange Act could be impaired.
None of historical Corteva’s financial information, the Seed Business supplemental financial information or our unaudited pro forma financial information are necessarily representative of the results we would have achieved as an independent, publicly traded company and may not be a reliable indicator of our future results.
Primarily as a result of, among other factors, Vylor’s relative significance to New Corteva, Vylor will be treated as the “accounting spinnor” and therefore will be the “accounting successor” to Corteva for accounting purposes, notwithstanding the legal form of the spin-off described in this information statement. Therefore, following the spin-off, the historical consolidated financial statements of Corteva will represent the historical financial statements of Vylor and New Corteva will be presented as discontinued operations. The historical information about Vylor in this information statement refers to Vylor’s businesses as part of Corteva. Vylor’s historical and pro forma financial information included in this information statement is derived from the consolidated financial statements and accounting records of Corteva. The historical financial information of Corteva, the Seed Business supplemental financial information, and the unaudited pro forma financial information included herein may not reflect what our financial condition, results of operations and cash flows would have been had we been an independent, publicly traded company comprised solely of the Seed Business during the periods presented or what our financial condition, results of operations and cash flows will be in the future when we are an independent company. This is primarily because:
•Prior to the spin-off, the Seed Business was operated under the umbrella of Corteva’s corporate organization. This integration has historically permitted our business (or portions thereof) to enjoy economies of scope and scale in costs, employees, vendor relationships and customer relationships. Although we expect to enter into the Transition Services Agreements that will govern certain commercial and other relationships between us and New Corteva after the spin-off, those temporary arrangements may not capture the benefits we have enjoyed in the past as a result of this integration. The loss of these benefits could have an adverse effect on our business, results of operations and financial condition following the spin-off.
•We will enter into transactions with New Corteva that did not exist prior to the spin-off. See the section entitled “Our Relationship with New Corteva Following the Spin-Off” for information regarding these transactions.
•Other significant changes may occur in our cost structure, management, financing and business operations as a result of the spin-off and our operating as a company separate from Corteva.
In addition, the unaudited pro forma financial information included in this information statement is based on the best information available, which in part includes a number of estimates and assumptions. These estimates and assumptions may prove to be inaccurate, and accordingly, our unaudited pro forma financial information should not be assumed to be indicative of what our financial condition or results of operations actually would have been as a standalone company during the time periods presented nor to be a reliable indicator of what our financial condition or results of operations actually may be in the future.
For additional information about the unaudited pro forma financial statements, see the sections entitled “Unaudited Pro Forma Consolidated Financial Statements,” “Notes to the Unaudited Pro Forma Consolidated Financial Statements” and “Management’s Discussion and Analysis of Financial Condition and Results of Operations of the Seed Business (Supplemental).”
We will incur indebtedness in connection with the spin-off and the Vylor cash distribution, and the degree to which we will be leveraged following the spin-off may materially and adversely affect our business, financial condition and results of operations.
In connection with the spin-off and the payment of the Vylor cash distribution to EIDP, we intend to incur indebtedness. Our capital structure remains under review and will be finalized prior to the spin-off. We may also incur additional indebtedness in the future. Such debt obligations could potentially have important consequences to us and our debt and equity investors, including:
•requiring a substantial portion of our cash flow from operations to make interest payments;
•making it more difficult to satisfy debt service and other obligations;
•reducing the amount of borrowings that may be obtained through offering certain of our assets as security;
•increasing the risk of a future credit ratings downgrade of our debt, which could increase future debt costs and limit the future availability of debt financing;
•increasing our vulnerability to general adverse economic and industry conditions;
•reducing the cash flow available to fund capital expenditures and other corporate purposes and to grow our business;
•limiting our flexibility in planning for, or reacting to, changes in our business and our industry; and
•placing us at a competitive disadvantage relative to our competitors that may not be as highly leveraged with debt.
The Seed Business has historically relied upon Corteva to provide credit support or fund its working capital requirements and other cash requirements. After the spin-off, we will be responsible for servicing our own debt and obtaining and maintaining sufficient working capital and other funds to satisfy our cash requirements.
Our ability to make payments on or refinance our indebtedness (including the debt incurred in connection with the spin-off, as well as any future debt that we may incur) and to obtain and maintain sufficient working capital will depend on our ability to generate cash in the future from our own operations, financings, or asset sales following the spin-off. Our ability to generate cash is further subject to general economic, financial, competitive, legislative, regulatory, and other factors that are beyond our control. We may not generate sufficient funds to service our debt and meet our business needs, such as funding working capital or the expansion of our operations. If we are not able to repay or refinance our debt as it becomes due, we may be forced to take disadvantageous actions, including reducing spending on marketing, retail trade incentives, advertising and new product innovation, reducing financing in the future for working capital, capital expenditures and general corporate purposes, selling assets or dedicating an unsustainable level of our cash flow from operations to the payment of principal and interest on our indebtedness. In addition, our ability to withstand competitive pressures and to react to changes in our industry could be impaired. The lenders who hold our debt could also accelerate amounts due in the event that we default, which could potentially trigger a default or acceleration of the maturity of our other debt.
To the extent that we incur additional indebtedness, the foregoing risks could increase. In addition, our actual cash requirements in the future may be greater than expected. Our cash flow from operations may not be sufficient to repay all of the outstanding debt as it becomes due, and we may not be able to borrow money, sell assets or otherwise raise funds on acceptable terms, or at all, to refinance our debt.
After the spin-off, our access to and cost of financing may be different from the historical access to and cost of financing available to Corteva, which may adversely affect our business, financial condition, or results of operations and cash flows.
After the spin-off, our access to and cost of debt financing will be different from the historical access to and cost of debt financing under Corteva. Differences in access to and cost of debt financing may result in differences in the interest rate charged to us on financings, as well as the amount of indebtedness, types of financing structures and debt markets that may be available to us. If we incur additional debt, the terms of such debt may impose additional and more stringent restrictions on our operations than we are currently subject to. Such restrictions could limit our ability to plan for or react to market conditions, meet capital needs or make acquisitions or otherwise restrict our activities or business plans.
Restrictions under the Intellectual Property Matters Agreement will limit our ability to develop and commercialize certain products and services and/or prosecute, maintain and enforce certain intellectual property.
We will be dependent on New Corteva to maintain and enforce the intellectual property licensed to us under the Intellectual Property Matters Agreement we expect to enter into with Corteva (which we refer to, after the spin-off, as New Corteva). For example, New Corteva will be responsible for filing, prosecuting and maintaining (at their discretion) their intellectual property licensed to us. New Corteva will also have the first right to enforce their intellectual property licensed to us. If New Corteva fails to fulfill its obligations or chooses not to enforce the intellectual property licensed to us under the Intellectual Property Matters Agreement, we may not be able to prevent competitors from making, using and selling competitive products and services.
In addition, our use of the intellectual property licensed to us under the Intellectual Property Matters Agreement is restricted to certain fields, which could limit our ability to develop and commercialize certain products and services. For example, the licenses granted to us under the Intellectual Property Matters Agreement will not extend to all fields of use that we may in the future decide to enter into. These restrictions may make it more difficult, time consuming and/or expensive for us to develop and commercialize certain new products and services, or may result in certain of our products or services being later to market than those of our competitors.
We and New Corteva will be allocated, and we and New Corteva will mutually indemnify each other for, certain liabilities in connection with the spin-off, the payments in respect of which could be significant and could negatively impact our business.
Pursuant to the Separation and Distribution Agreement and certain other agreements that we expect to enter into with Corteva (which we refer to, after the spin-off, as New Corteva) in connection with the spin-off, we will be allocated, and must indemnify New Corteva
for, certain liabilities for uncapped amounts, which could include, among other items, associated defense costs, settlement amounts and judgments. Payments pursuant to these indemnities could be significant and could negatively impact our business.
Third parties could also seek to hold us responsible for any of the liabilities allocated to New Corteva. New Corteva will agree in such agreements to indemnify us for any such liabilities, but such indemnities may not be sufficient to protect us against the full amount of all such liabilities. Even if we ultimately succeed in recovering from New Corteva any amounts for which we are held liable, we may be temporarily required to bear these losses ourselves. Each of these risks could negatively affect our business, financial condition, results of operations and cash flows.
For additional information, see the section entitled “Our Relationship with New Corteva Following the Spin-Off.”
Our customers, prospective customers, suppliers or other companies with whom we conduct business may need assurances that our financial stability on a standalone basis is sufficient to satisfy their requirements for doing or continuing to do business with them.
Some of our customers, prospective customers, suppliers or other companies with whom we conduct business may need assurances that our financial stability on a standalone basis is sufficient to satisfy their requirements for doing or continuing to do business with them, and may require us to provide additional credit support, such as letters of credit or other financial guarantees. Any failure of parties to be satisfied with our financial stability could have a material adverse effect on our business, financial condition, results of operations and cash flows.
We may have received better terms from unaffiliated third parties than the terms received in the commercial agreements we will enter into with Corteva.
In connection with the spin-off, we will enter into certain commercial agreements with New Corteva, including, but not limited to, certain services, supply and real estate related agreements, which will govern the provision of services and use of assets following the spin-off that were previously provided within Corteva. These agreements will be negotiated in the context of the spin-off, while Vylor remains part of Corteva. Accordingly, the agreements may not reflect terms that would have resulted from negotiations among unaffiliated third parties, and we may have received better terms from third parties. For additional information, see the section entitled “Our Relationship with New Corteva Following the Spin-Off.”
Although we have not identified any conflicts of interest, following the spin-off, certain of our directors and employees may have actual or potential conflicts of interest because of their financial or equity interests in New Corteva, or because of their previous positions with Corteva.
Because of their current or former positions with Corteva, certain of our expected executive officers and directors are expected to own equity interests in both us and New Corteva. Continuing ownership of New Corteva shares and equity awards could create, or appear to create, potential conflicts of interest if we and New Corteva face decisions that could have implications for both us and New Corteva. For example, our officers and directors could be motivated or seen to be motivated to make decisions benefiting New Corteva that would not have been made if they had no ownership of New Corteva shares or equity awards, which may in turn cause harm to our reputation. We have not currently identified any conflicts of interest; however, potential conflicts of interest could arise in connection with the resolution of any dispute between us and New Corteva regarding the terms of the agreements governing the spin-off and our relationship with New Corteva following the spin-off. See the section entitled “Our Relationship with New Corteva Following the Spin-Off” for information about some of these agreements. Potential conflicts of interest may also arise out of any commercial arrangements that we or New Corteva, and/or our respective affiliates, may enter into in the future. For example, due to the existing relationships between our officers and directors who have historically been employed by Corteva, our officers and directors may make or be seen to be making decisions benefiting New Corteva that would not have been made if we had no such officers or directors. A dispute regarding a potential or actual conflict of interest involving us and New Corteva could negatively impact our businesses, results of operations, cash flows and financial condition. In addition, public perception of such an actual or apparent conflict of interest could pose reputational risks and expose us to increased scrutiny from investors and regulators.
In connection with the spin-off, we will adopt a written code of conduct that will apply to our directors and executive officers, as well as employees, which will be designed to promote honest and ethical conduct, including the handling of actual or apparent conflicts of interests between personal and professional relationships. See the section entitled “Management—Codes of Conduct and Financial Ethics.” The board will also adopt a set of governance principles in connection with the spin-off to assist with governance practices, including a requirement that directors disclose actual or potential conflicts of interest and recuse themselves from discussion and abstain from voting of such matter. See the section entitled “Management—Corporate Governance Guidelines” for additional information on the governance principles. In addition, each of our expected officers and directors are expected to confirm their ongoing obligation to
notify management of their outside activities, which will enable management to monitor any potential conflicts of interest, whether with New Corteva or other third parties.
Until the spin-off occurs, Corteva has the sole discretion to change the terms of the spin-off.
Until the spin-off occurs, Corteva will have the sole and absolute discretion to determine and change the terms of the spin-off, including the establishment of the record date and distribution date. These changes could be unfavorable to us. In addition, Corteva may decide at any time not to proceed with the spin-off.
The spin-off, including certain internal reorganization transactions undertaken by Corteva in connection therewith, may expose us to potential liabilities arising out of state and federal fraudulent conveyance laws and legal distribution requirements.
Although each of the Corteva board of directors, EIDP board of directors and Vylor board of directors will receive a solvency opinion from an independent appraisal firm as described in the section entitled “The Spin-Off—Conditions to the Distribution,” the spin-off, including certain internal reorganization transactions undertaken by Corteva in connection therewith, could be challenged under various state and federal fraudulent conveyance laws. Fraudulent conveyances or transfers are generally defined to include transfers made or obligations incurred with the actual intent to hinder, delay or defraud current or future creditors or transfers made or obligations incurred for less than reasonably equivalent value when the debtor was insolvent, or that rendered the debtor insolvent, inadequately capitalized or unable to pay its debts as they become due. Any unpaid creditor could claim that Corteva, EIDP or Vylor did not receive fair consideration or reasonably equivalent value in the spin-off or related transactions and that the spin-off or related transactions left Corteva, EIDP or Vylor, as applicable, insolvent, inadequately capitalized or unable to pay its debts as they become due, or that Corteva, EIDP or Vylor intended or believed that it would incur debts beyond its ability to pay such debts as they mature. If a court were to agree with such a plaintiff, then such court could void the spin-off or related transactions as a fraudulent transfer or impose substantial liabilities on us, which could adversely affect our financial condition and our results of operations. Among other things, the court could return to New Corteva or its creditors some of our assets or your shares of Vylor common stock or provide New Corteva or its creditors with a claim for money damages against us in an amount equal to the difference between the consideration received by Corteva and the fair market value of us at the time of the distribution or the related transactions. Additionally, the solvency opinions received by Corteva, EIDP and Vylor will be based on the facts and circumstances known at the time of their issuance. Any subsequent changes to the environmental, litigation or other liabilities allocated to New Corteva in the spin-off could subject us to increased litigation risk, increased reliance on indemnification from New Corteva, or other potential liabilities.
The distribution, the EIDP distribution, the Vylor issuance and the Vylor cash distribution are also subject to review under state corporate distribution statutes. Under the DGCL, a corporation may only pay dividends to its stockholders either (i) out of its surplus (net assets minus capital) or (ii) if there is no such surplus, out of its net profits for the fiscal year in which the dividend is declared and/or the preceding fiscal year. Although Corteva intends to make the distribution out of Corteva’s surplus and to receive an opinion that Corteva has adequate surplus under Delaware law to declare the dividend of Vylor common stock in connection with the distribution, there can be no assurance that a court will not later determine that some or all of the distribution was unlawful. Similarly, although EIDP intends to make the EIDP distribution out of EIDP’s surplus and to receive an opinion that EIDP has adequate surplus under Delaware law to declare the EIDP distribution, there can be no assurance that a court will not later determine that some or all of the EIDP distribution was unlawful. Additionally, although Vylor intends to make the Vylor issuance and the Vylor cash distribution out of Vylor’s surplus and to receive an opinion that Vylor has adequate surplus under Delaware law to declare the Vylor issuance and the Vylor cash distribution, there can be no assurance that a court will not later determine that some or all of the Vylor issuance and the Vylor cash distribution was unlawful.
Risks Related to Vylor Common Stock
We cannot be certain that an active trading market for Vylor common stock will develop or be sustained after the spin-off, and following the spin-off, our stock price may fluctuate significantly.
A public market for Vylor common stock does not currently exist. We expect that a limited market, commonly known as a “when-issued” trading market, will develop as early as the trading day prior to the record date for the distribution, and we expect “regular-way” trading of Vylor common stock to begin on the distribution date (or, if the distribution date is not a trading day, the first trading day after the distribution date). However, we cannot guarantee that an active trading market will develop or be sustained for Vylor common stock after the spin-off. If an active trading market does not develop, you may have difficulty selling your shares of common stock at an attractive price, or at all. In addition, we cannot predict the prices at which shares of Vylor common stock may trade after the spin-off.
Similarly, Corteva cannot predict the effect of the spin-off on the trading prices of its common stock. We cannot predict the price at which Vylor common stock will trade after the spin-off. After the distribution of the shares of Vylor common stock, the combined
trading prices of Vylor common stock and New Corteva common stock may not equal or exceed the “regular-way” trading price of a share of Corteva common stock immediately prior to the distribution of Vylor common stock. The price at which Vylor common stock trades may fluctuate significantly, particularly until an orderly public market develops. Trading prices for Vylor common stock will be determined in the public markets and may fluctuate significantly due to a number of factors, some of which may be beyond our control, including:
•our business profile and market capitalization may not fit the investment objectives of Corteva’s current stockholders, causing a shift in our initial investor base, and Vylor common stock may not be included in some indices in which Corteva common stock is included, causing certain holders to be mandated to sell their shares of Vylor common stock;
•our quarterly or annual earnings, or those of other companies in our industry;
•the failure of securities analysts to cover Vylor common stock after the spin-off;
•actual or anticipated fluctuations in our operating results;
•changes in earnings estimates by securities analysts or our ability to meet those estimates or our earnings guidance;
•the operating and stock price performance of other comparable companies;
•overall market fluctuations and domestic and worldwide economic conditions; and
•other factors described in these “Risk Factors” and elsewhere in this information statement.
Stock markets in general have experienced volatility that has often been unrelated to the operating performance of a particular company. These broad market fluctuations may adversely affect the trading price of Vylor common stock.
A significant number of shares of Vylor common stock may be sold following the spin-off, which may cause our stock price to decline.
Any sales of substantial amounts of shares of Vylor common stock in the public market or the perception that such sales might occur, in connection with the spin-off or otherwise, may cause the market price of Vylor common stock to decline. Upon completion of the spin-off, we expect that we will have an aggregate of approximately million shares of Vylor common stock issued and outstanding. These shares will be freely tradable without restriction or further registration under the Securities Act of 1933, as amended (the “Securities Act”), unless the shares are owned by one of our “affiliates,” as that term is defined in Rule 405 under the Securities Act.
We are unable to predict whether large amounts of Vylor common stock will be sold in the open market following the spin-off. We are also unable to predict whether a sufficient number of buyers would be in the market at that time. In addition, a portion of Vylor common stock is held by index funds tied to stock indices. If we are not included in these indices at the time of spin-off, these index funds may be required to sell Vylor common stock.
We cannot guarantee the timing, amount or payment of dividends on Vylor common stock in the future.
There can be no assurance that we will have sufficient surplus under Delaware law to be able to pay any dividends. We expect that we will pay a quarterly dividend following the spin-off. However, there can be no assurance we will be able to pay such dividends. The declaration, payment, timing and amount of any dividend will be subject to the sole discretion of our board of directors and will depend upon many factors, including our financial condition and prospects, our capital requirements and access to capital markets, covenants associated with certain of our debt obligations, industry practice, legal requirements and other factors that our board of directors may deem relevant, and there can be no assurances that we will continue to pay a dividend in the future. In addition, there can be no assurance that, after the spin-off, the combined annual dividends, if any, on Vylor common stock and New Corteva common stock will be equal to the annual dividends on Corteva common stock prior to the spin-off. For additional information, see the section entitled “Dividend Policy.”
Your percentage of ownership in us may be diluted in the future.
In the future, your percentage ownership in us may be diluted because of equity issuances for acquisitions, capital market transactions or otherwise, including, without limitation, equity awards that we may grant to our directors, officers and employees. Our employees may have options to purchase shares of Vylor common stock after the spin-off as a result of conversion of their Corteva stock options (in whole or in part) to our stock options. Such options will have a dilutive effect on our earnings per share, which could adversely affect
the market price of our common stock. From time to time, we will issue additional stock-based awards to our employees under our employee benefits plans.
In addition, our amended and restated certificate of incorporation will authorize our board of directors to issue, without the approval of our stockholders, one or more classes or series of preferred stock having such designations, powers, preferences and relative, participating, optional and other special rights, including preferences over Vylor common stock with respect to dividends and distributions, as our board of directors generally may determine. The terms of one or more classes or series of preferred stock could dilute the voting power or reduce the value of Vylor common stock. For example, we could grant the holders of preferred stock the right to elect some number of our directors in all events or on the happening of specified events or to veto specified transactions. Similarly, the repurchase or redemption rights or liquidation preferences we could assign to holders of preferred stock could affect the residual value of Vylor common stock. For additional information, see the section entitled “Description of Our Capital Stock.”
Certain provisions in our amended and restated certificate of incorporation and bylaws, Delaware law and the transaction agreements we expect to enter into with Corteva (which we refer to, after the spin-off, as New Corteva) in connection with the spin-off may prevent or delay an acquisition of us, which could decrease the trading price of Vylor common stock.
Our amended and restated certificate of incorporation and bylaws will contain, and Delaware law contains, provisions that are intended to deter coercive takeover practices and inadequate takeover bids by making such practices or bids unacceptably expensive to the bidder and to encourage prospective acquirers to negotiate with our board of directors rather than to attempt a hostile takeover. These provisions include, among others:
•the inability of our stockholders to act by written consent;
•the limited ability of our stockholders to call a special meeting;
•the right of our board of directors to issue preferred stock without stockholder approval;
•rules regarding how stockholders may present proposals or nominate directors for election at stockholder meetings; and
•the ability of our directors, but not our stockholders, to expand the size of our board of directors and to fill vacancies on our board of directors (including those resulting from an enlargement of our board of directors).
In addition, following the spin-off, we will be subject to Section 203 of the DGCL. Section 203 of the DGCL provides that, subject to limited exceptions, persons that (without prior approval from our board of directors) acquire, or are affiliated with a person that acquires, more than 15 percent of the outstanding voting stock of a Delaware corporation shall not engage in any business combination with that corporation, including by merger, consolidation or acquisitions of additional shares, for a three-year period following the date on which that person or its affiliate becomes the holder of more than 15 percent of the corporation’s outstanding voting stock.
We believe these provisions will protect our stockholders from coercive or otherwise unfair takeover tactics by requiring potential acquirers to negotiate with our board of directors and by providing our board of directors with more time to assess any acquisition proposal. These provisions are not intended to make us immune from takeovers. However, these provisions will apply even if an acquisition proposal or offer may be considered beneficial by some stockholders and could delay or prevent an acquisition that our board of directors determines is not in our and our stockholders’ best interests. These provisions may also prevent or discourage attempts to remove and replace incumbent directors. See the section entitled “Description of Our Capital Stock” for a more detailed description of these provisions.
Several of the agreements that we expect to enter into with Corteva (which we refer to, after the spin-off, as New Corteva) will require New Corteva’s consent to any assignment by us of our rights and obligations, or a change of control of us, under the agreements. The consent rights set forth in these agreements might discourage, delay or prevent a change of control that you may consider favorable. See the section entitled “Our Relationship with New Corteva Following the Spin-Off” for a more detailed description of these agreements and provisions.
In addition, an acquisition or further issuance of our stock could trigger the application of Section 355(e) of the Code. For a discussion of Section 355(e), see the section entitled “Material U.S. Federal Income Tax Consequences of the Spin-Off.” Under the Tax Matters Agreement, we would be required to indemnify New Corteva for the tax imposed under Section 355(e) of the Code resulting from an acquisition or issuance of our stock, even if we did not participate in or otherwise facilitate the acquisition, and this indemnity obligation might discourage, delay or prevent a change of control that you may consider favorable.
Our amended and restated bylaws will provide that the Court of Chancery of the State of Delaware will be the exclusive forum for certain legal actions between us and our stockholders and that the federal district courts of the United States will be the sole and exclusive forum for the resolution of any complaint asserting a cause of action arising under the Securities Act or any rules or regulations promulgated thereunder, which could limit our stockholders’ ability to obtain a judicial forum viewed by the stockholders as more favorable for disputes with us or our directors, officers or employees.
Our amended and restated bylaws will provide that, unless we consent in writing to the selection of an alternative forum, the Court of Chancery of the State of Delaware will be the sole and exclusive forum for any (i) derivative action or proceeding brought on behalf of us, (ii) any action asserting a claim of breach of a fiduciary duty owed by any of our directors, officers or other employees to us or our stockholders, (iii) any action asserting a claim arising pursuant to any provision of the DGCL or (iv) any action asserting a claim governed by the internal affairs doctrine. Our amended and restated bylaws will also provide that unless we consent in writing to the selection of an alternative forum, the federal district courts of the United States will be the sole and exclusive forum for the resolution of any complaint asserting a cause of action arising under the Securities Act or any rules or regulations promulgated thereunder. The choice of forum provisions may limit a stockholder’s ability to bring a claim in a judicial forum that it finds favorable for disputes with us or our directors, officers or other employees, which may discourage such lawsuits against us or our directors, officers and other employees. Alternatively, if a court were to find the choice of forum provisions contained in our amended and restated bylaws to be inapplicable or unenforceable in an action, we may incur additional costs associated with resolving such action in other jurisdictions. Our amended and restated bylaws will provide that the exclusive forum provision will not preclude or contract the scope of exclusive federal jurisdiction for actions brought under the Exchange Act or any rules or regulations promulgated thereunder.
CAUTIONARY STATEMENT CONCERNING FORWARD-LOOKING STATEMENTS
This information statement and other materials Vylor and Corteva have filed or will file with the SEC contain, or will contain, certain “forward-looking statements” that involve risks and uncertainties. Forward-looking statements are based on current assumptions regarding future business and financial performance. These statements by their nature address matters that are uncertain to different degrees. Forward-looking statements provide current expectations of future events based on certain assumptions and include any statement that does not directly relate to a historical or current fact. You can identify forward-looking statements by the use of words such as “plans,” “expects,” “will,” “anticipates,” “believes,” “intends,” “projects,” “estimates,” “outlook” or other words of similar meaning. All statements that address expectations or projections about the future, including statements about ‘our financial results or outlook; strategy for growth; product development; regulatory approvals; market position; capital allocation strategy; liquidity; sustainability targets and initiatives; the anticipated benefits of acquisitions, restructuring actions, or cost savings initiatives; the anticipated benefits, impacts, and timing of the proposed spin-off; and the outcome of contingencies, such as litigation and environmental matters, are forward-looking statements.
Forward-looking statements and other estimates are based on certain assumptions and expectations of future events which may not be accurate or realized. Forward-looking statements and other estimates also involve risks and uncertainties, many of which are beyond our control. While the list of factors presented below is considered representative, no such list should be considered to be a complete statement of all potential risks and uncertainties. Unlisted factors may present significant additional obstacles to the realization of forward-looking statements. Consequences of material differences in results as compared with those anticipated in the forward-looking statements could include, among other things, business disruption, operational problems, financial loss, legal liability to third parties and similar risks, any of which could have a material adverse effect on our business, results of operations and financial condition. Some of the important factors that could cause our actual results to differ materially from those projected in any such forward-looking statements include:
•failure to obtain or maintain the necessary regulatory approvals for some of our products;
•failure to successfully develop and commercialize our pipeline;
•effect of the degree of public understanding and acceptance or perceived public acceptance of our biotechnology and other agricultural products;
•failure to comply with competition and antitrust laws;
•effect of changes in agricultural and related policies of governments and international organizations;
•costs of complying with evolving regulatory requirements and the effect of actual or alleged violations of environmental laws or permit requirements;
•effect of climate change and unpredictable seasonal and weather factors;
•effect of competition in our industry;
•risks related to recent funding and staff reductions at U.S. government agencies;
•competitor’s establishment of an intermediary platform for distribution of our products;
•risks related to geopolitical and military conflict;
•effect of volatility in our input costs;
•risks related to our global operations;
•effect of industrial espionage and other disruptions to our supply chain, information technology or network systems;
•risks related to environmental, litigation, and other commitments and contingencies;
•impact of our dependence on third parties with respect to certain of its seed production or licenses and commercialization;
•failure of our customers to pay their debts to us, including customer financing programs;
•failure to effectively manage acquisitions, divestitures, alliances, restructurings, cost savings initiatives, and other portfolio actions;
•risks related to our use of artificial intelligence and machine learning technologies;
•failure to raise capital through the capital markets or short-term borrowings on terms acceptable to us;
•risks related to pandemics or epidemics;
•risks related to our intellectual property;
•risks related to the spin-off, including, but not limited to, whether the objectives of the spin-off will be achieved; the terms, structure, benefits and costs of any action or transaction resulting from the spin-off; the timing of the spin-off or any related action and whether the spin-off will be consummated at all; the risk that the spin-off could divert the attention and time of our management; the risk of any unexpected costs or expenses resulting from the spin-off process or the spin-off itself; and the risk of any litigation as a result of, or relating to, the spin-off; and
•risks related to our common stock.
Additionally, there may be other risks and uncertainties that we are unable to currently identify or that we do not currently expect to have a material impact on its business. Where, in any forward-looking statement or other estimate, an expectation or belief as to future results or events is expressed, such expectation or belief is based on the current plans and expectations of management and expressed in good faith and believed to have a reasonable basis, but there can be no assurance that the expectation or belief will result or be achieved or accomplished. We disclaim and do not undertake any obligation to update or revise any forward-looking statement, except as required by applicable law. A detailed discussion of some of the significant risks and uncertainties which may cause results and events to differ materially from such forward-looking statements is included in the section titled “Risk Factors.”
THE SPIN-OFF
Background of the Spin-Off
Corteva conducts its leading global agriculture operations through the Seed Business and the Crop Protection Business and has approximately 21,500 employees. On October 1, 2025, Corteva announced that its board of directors unanimously approved a plan to separate the company into two independent, publicly traded companies, one comprising the Crop Protection Business and the other comprising the Seed Business. The spin-off is subject to final approval by the Corteva board of directors and the satisfaction or waiver of certain other conditions. The spin-off will allow both businesses to maximize long-term value creation by focusing on their respective value-enhancing priorities. The spin-off will result in two independent, publicly traded companies that the Corteva board of directors believes will lead their respective markets, both with technology and innovation at their core and operating models and capital allocation priorities tailored to support their respective growth outlooks, strategic directions and value propositions.
As part of the spin-off, and prior to the distribution, Corteva will complete the internal reorganization. As a result of the internal reorganization, the Seed Business will be consolidated under Pioneer.
Following the internal reorganization, EIDP will contribute to Vylor all of its interest in Pioneer (the “Vylor contribution”) in exchange for:
•the issuance by Vylor to EIDP of such number of shares of Vylor common stock as will be required so that the total number of shares of Vylor common stock held by Corteva immediately after the EIDP distribution (as defined below) is equal to the total number of shares of Vylor common stock distributable in the distribution (the “Vylor Issuance”); and
•the payment of a cash distribution by Vylor to EIDP in an aggregate amount equal to $ (the “Vylor cash distribution”).
In connection with the spin-off, we expect to incur indebtedness in an aggregate principal amount of $ , consisting of (the “Vylor financing arrangements”), as more fully described in the section entitled “Description of Material Indebtedness.” We will use a portion of the proceeds from the Vylor financing arrangements to make the Vylor cash distribution.
Subsequently, EIDP will distribute to Corteva all the then issued and outstanding shares of Vylor common stock (the “EIDP distribution”).
Following the EIDP distribution, Corteva will distribute all the then issued and outstanding shares of Vylor common stock to holders of record of Corteva common stock as of the close of business on , 2026, the record date for the distribution. The distribution is expected to be completed on , 2026. As a result of the distribution, Vylor will become an independent, publicly traded company.
On , 2026, the Corteva board of directors approved, subject to the satisfaction or waiver of certain conditions, the distribution of all the then issued and outstanding shares of Vylor common stock to holders of record of Corteva common stock as of the record date, on the basis of share[s] of Vylor common stock for every share[s] of Corteva common stock held of record as of such time. The distribution of Vylor common stock as described in this information statement is subject to the satisfaction or waiver of certain conditions. For a more detailed description of these conditions, see the section entitled “The Spin-Off—Conditions to the Distribution.” Corteva stockholders will also be entitled to receive cash in lieu of any fractional shares of Vylor common stock that they would have otherwise been entitled to receive in the distribution. Corteva stockholders will not be required to make any payment, surrender or exchange their Corteva common stock or take any other action to receive their shares of Vylor common stock in the distribution. The spin-off is intended to be tax-free to Corteva stockholders for U.S. federal income tax purposes, except for any cash received in lieu of fractional shares.
The Corteva board of directors has the discretion to abandon the intended spin-off and to alter the terms of the spin-off. As a result, we cannot provide any assurances that the spin-off will be completed.
Reasons for the Spin-Off
The Corteva board of directors has met regularly to review Corteva’s businesses and has evaluated the strategic opportunities available to itself as a combined company, as well as its individual businesses. The Corteva board of directors believes that the separation of Corteva into two independent, publicly traded companies through the separation of the Seed Business and the Crop Protection Business is the best available opportunity to enhance the value of Corteva. The Corteva board of directors has considered a wide variety of factors in evaluating the spin-off, including the risk that the spin-off is abandoned and not completed. The Corteva board of directors believes that the potential benefits to Corteva stockholders of the separation of each of its two businesses into independent companies with their
own distinct business and capital structures and ability to focus on their respective specific growth plans will provide Corteva stockholders with certain opportunities and benefits not available to the combined company.
The Corteva board of directors believes that the spin-off is in the best interests of Corteva and its stockholders. Among other things, the Corteva board of directors considered the following potential benefits of the spin-off:
•Attractive Investment Profile. The creation of separate companies with strong, focused businesses and each with a distinct financial profile and clear investment thesis is expected to drive significant long-term value for all stockholders and also reduce the complexities surrounding investor understanding, enabling investors to invest in each company separately based on its distinct characteristics.
•Distinct Position. The spin-off is expected to create two independent companies with tailored growth strategies and differentiated technologies, resulting in: Vylor, a leading global seed and genetics company with a century-long heritage of success utilizing cutting-edge technology, including advanced genetics and proprietary traits that increase yield, sustainability, and crop health; and New Corteva, a leading global crop protection technology company that is a fit-for-purpose market leader in differentiated, innovative agricultural solutions, including biologicals and other nature-based products. Each company will provide investors with a distinct investment option that may be more attractive to current investors, allowing each company to attract different investors than the current investment option available to Corteva stockholders of one combined company.
•Ability to Pursue Strategic Opportunities. Each company’s business is expected to be better situated to pursue future acquisitions, joint ventures and other strategic opportunities as well as internal expansion that is more closely aligned with such company’s strategic goals and expected growth opportunities. We will be focused on long-term growth by leveraging our world-class plant breeding capabilities to drive germplasm innovation, harnessing our gene editing expertise to transform our portfolio, and capitalizing on a deep pipeline of attractive acquisition opportunities in core and adjacent markets. New Corteva will be focused on enhancing near- and medium-term operational efficiency to navigate evolving market conditions, driving organic investment in differentiated solutions, continued innovation to bring advanced sustainable solutions to farmers, and disciplined strategic opportunities to expand market positions in attractive portfolios or geographies.
•Focused Capital Allocation. Each independent, publicly traded company will have a capital structure and targeted investment-grade credit rating that is tailored for a business model designed to support its expected future capital needs and will be able to make capital allocation decisions to support its growth outlook, strategic direction and value proposition. In addition, after the spin-off, the respective business within each company will no longer need to compete internally for capital and other corporate resources with the business allocated to the other company.
•Enhanced Means to Evaluate Financial Performance. Investors should be better able to evaluate the business condition, strategy and financial performance of each company within the context of its particular industry and markets, due in part to (i) the improved visibility of each company’s standalone results and performance drivers, (ii) the establishment of independent capital structures tailored to support each company’s future capital needs and (iii) the allocation of certain assets and liabilities in connection with the spin-off, as more fully described in the section entitled “Our Relationship with New Corteva Following the Spin-Off.”
•Direct Access to Capital Markets. Each company’s business will have direct access to the capital markets, facilitating each company’s ability to pursue strategic goals and expected growth opportunities.
•Ability to Adapt to Industry Changes. Each company is expected to be able to maintain a sharper focus on its core business and growth opportunities, which will allow each company to respond better and more quickly to developments in its industry.
•Dedicated Management Team with Enhanced Strategic Focus. Each company’s management team will be able to design and implement corporate policies and strategies that are tailored to such company’s specific business characteristics and to focus on maximizing the value of its business.
•Improved Management Incentive Tools. The spin-off will permit the creation of equity securities, including options and restricted stock units, for each publicly traded company with values more closely linked to the performance of such company’s business than would be readily available under the current configuration of businesses within Corteva as a single public company. The Corteva board of directors believes such equity-based compensation arrangements should provide enhanced incentives for performance and improve the ability for each publicly traded company to attract, retain and motivate qualified personnel.
•Expected Higher Combined Market Value. Based on the potential benefits set forth above, it is expected that, over time following the completion of the spin-off, the aggregate market value of Vylor and New Corteva will be higher, on a fully distributed basis, and assuming the same market conditions, than if Corteva were to remain under its current configuration.
The Corteva board of directors also considered a number of potentially negative factors, including the loss of synergies and joint purchasing power from ceasing to operate as part of a larger, more diversified company, risks relating to the creation of a new public
company, such as increased costs from operating as a separate public company, potential disruptions to the businesses and its customer and distribution channels, the loss or dilution of brand identities, possible increased administrative costs and one-time separation costs, restrictions on each company’s ability to pursue certain opportunities that may have otherwise been available in order to preserve the tax-free nature of the spin-off for U.S. federal income tax purposes, the fact that each company will be less diversified than the current configuration of Corteva’s businesses prior to the spin-off and the potential inability to realize the anticipated benefit of the spin-off.
The Corteva board of directors concluded that the potential benefits of pursuing the spin-off outweighed the potential negative factors in connection therewith. The anticipated benefits of the spin-off are based on a number of assumptions, and there can be no assurance that, following the spin-off, any of the benefits described above or otherwise will be realized to the extent anticipated or at all. In the event the spin-off does not result in such benefits, the costs associated with the spin-off could have an adverse effect on each company individually or in the aggregate. For additional information see the section entitled “Risk Factors.”
The Corteva board of directors also considered these potential benefits and potential negative factors in light of the risk that the spin-off is abandoned or otherwise not completed, resulting in the Crop Protection Business and Seed Business continuing as a combined company. The Corteva board of directors believes that the potential benefits to Corteva stockholders of the spin-off discussed above will provide Corteva stockholders with greater long-term value than retaining one investment in the combined company.
In view of the wide variety of factors considered in connection with the evaluation of the spin-off and the complexity of these matters, the Corteva board of directors did not find it useful to, and did not attempt to, quantify, rank or otherwise assign relative weights to the factors considered. The individual members of the Corteva board of directors may have given different weights to different factors.
The Number of Shares of Vylor Common Stock You Will Receive
Holders of record of Corteva common stock as of the record date, will be entitled to receive share[s] of Vylor common stock on the distribution date for every share[s] of Corteva common stock held of record by such holder as of such time. Corteva will not distribute any fractional shares of Vylor common stock. Instead, the distribution agent will aggregate all fractional shares into whole shares, sell the whole shares in the open market at then prevailing market prices and distribute the aggregate cash proceeds (net of costs and expenses of such sale and distribution) of the sales pro rata (based on the fractional share such stockholder would otherwise have been entitled to receive) to each stockholder who otherwise would have been entitled to receive a fractional share in the distribution (net of any required withholding for taxes applicable to such stockholder). The distribution agent, in its sole discretion, without any influence by Corteva or us, will determine when, how, through which broker-dealer and at what price to sell the whole shares. Neither we nor Corteva will be able to guarantee any minimum sale price in connection with the sale of these shares. Recipients of cash in lieu of fractional shares will not be entitled to any interest on the amount of payment made to you in lieu of fractional shares.
The aggregate net cash proceeds of these sales will be taxable for U.S. federal income tax purposes. See the section entitled “Material U.S. Federal Income Tax Consequences of the Spin-Off” for an explanation of the material U.S. federal income tax consequences of the spin-off. If you are a holder of record of shares of Corteva common stock as of the record date, you will receive a check from the distribution agent in an amount equal to your pro rata share (if any) of the aggregate net cash proceeds of the sales. We estimate that it will take approximately two weeks from the distribution date for the distribution agent to complete the distributions of the aggregate net cash proceeds. If you hold shares of Corteva common stock through a bank or brokerage firm, your bank or brokerage firm will receive, on your behalf, your pro rata share (if any) of the aggregate net cash proceeds of the sales and will be responsible for transmitting to you your share of such proceeds.
When and How You Will Receive the Distribution
With the assistance of the distribution agent, subject to the satisfaction or waiver of certain conditions, the distribution of Vylor common stock is expected to occur on , 2026, the distribution date, to all holders of outstanding Corteva common stock as of the record date. Computershare will serve as the distribution agent in connection with the distribution, and will also serve as the transfer agent and registrar for the Vylor common stock. Corteva stockholders will be entitled to receive cash in lieu of any fractional shares of Vylor common stock which they would have otherwise been entitled to receive in the distribution (net of any required withholding for taxes applicable to such stockholder).
If you are a holder of record of shares of Corteva common stock as of the record date, the shares of Vylor common stock that you are entitled to receive in the distribution will be issued to you electronically, as of the distribution date, in direct registration or book-entry form. The distribution agent will credit the whole shares of Vylor common stock you receive in the distribution to a book-entry account with our transfer agent on the distribution date. Approximately two weeks after the distribution date, the distribution agent will mail you a direct registration account statement that reflects the shares of Vylor common stock that have been registered in book-entry form in
your name as well as a check reflecting any cash you are entitled to receive in lieu of fractional shares. “Direct registration form” refers to a method of recording share ownership when no physical share certificates are issued to stockholders, as is the case in this distribution.
Most Corteva stockholders own their shares beneficially through a bank, broker or other nominee. In such cases, the bank, broker or other nominee would be said to hold the shares in “street name” and the shares of Vylor common stock you are entitled to receive in the distribution will be issued electronically to your bank or broker and your ownership would be recorded on the bank or brokerage firm’s books. If you hold your Corteva common stock through a bank, broker or other nominee, your bank or brokerage firm will credit your account for the shares of Vylor common stock that you are entitled to receive in the distribution, and will be responsible for transmitting to you any cash in lieu of fractional shares you are entitled to receive. If you have any questions concerning the mechanics of the distribution and you hold your shares of Corteva in street name, please contact your bank or brokerage firm.
If you sell your Corteva common stock in the “regular-way” market on or prior to the last trading day prior to the distribution date, you will be selling your right to receive shares of Vylor common stock in the distribution.
The shares of Vylor common stock will not be certificated. As a result, no physical stock certificates will be issued to any stockholders.
Transferability of Shares You Receive
The shares of Vylor common stock distributed to Corteva stockholders in connection with the distribution will be transferable without registration under the Securities Act, except for shares received by persons who may be deemed to be our affiliates. Persons who may be deemed to be our affiliates after the distribution generally include individuals or entities that control, are controlled by or are under common control with us, which may include certain of our executive officers, directors or principal stockholders. Securities held by Vylor affiliates will be subject to resale restrictions under the Securities Act. Vylor affiliates will be permitted to sell shares of Vylor common stock only pursuant to an effective registration statement or an exemption from the registration requirements of the Securities Act, such as the exemption afforded by Rule 144 under the Securities Act.
Results of the Distribution
After the distribution, we will be an independent, publicly traded company. The actual number of shares to be distributed will be determined by Corteva as of the record date based on the distribution ratio. The distribution will not affect the number of outstanding shares of Corteva common stock (which will, following the distribution, reflect ownership of New Corteva) or any rights of Corteva stockholders. Corteva will not distribute any fractional shares of Vylor common stock.
Prior to the distribution, we expect to enter into the Separation and Distribution Agreement with Corteva to facilitate the spin-off and provide a framework for the relationship between us and New Corteva after the spin-off. We also plan on entering into certain other agreements with Corteva, including the Tax Matters Agreement, the Employee Matters Agreement, the Transition Services Agreements, the Intellectual Property Matters Agreement, the Trademark License Agreement and certain other agreements relating to intellectual property, services, supply, real estate and other commercial matters. These agreements will collectively provide the terms of the allocation between us and New Corteva of the assets, liabilities and obligations of Corteva (including its investments, property and employee benefits and tax-related assets and liabilities) and will govern the relationship between us and New Corteva subsequent to the spin-off. For additional information regarding the Separation and Distribution Agreement and other transaction agreements, see the sections entitled “Risk Factors—Risks Related to the Spin-Off” and “Our Relationship with New Corteva Following the Spin-Off.”
Market for Vylor Common Stock
There is currently no public trading market for Vylor common stock. We intend to apply to list Vylor common stock on the NYSE under the symbol “ .” We have not and will not set the initial price of Vylor common stock. The initial price will be established by the public markets.
We cannot predict the price at which Vylor common stock will trade after the spin-off. After the distribution, the combined trading prices of Vylor common stock and New Corteva common stock may not equal or exceed the “regular-way” trading price of a share of Corteva common stock immediately prior to the distribution. The price at which Vylor common stock trades may fluctuate significantly, particularly until an orderly public market develops. Trading prices for Vylor common stock will be determined in the public markets and may be influenced by many factors. See the section entitled “Risk Factors—Risks Related to Vylor Common Stock.”
Trading Between the Record Date and Distribution Date
Beginning on or shortly before the record date and continuing through the last trading day prior to the distribution date, Corteva expects that there will be two markets in Corteva common stock: a “regular-way” market and an “ex-distribution” market. Shares of Corteva
common stock that trade in the “regular-way” market will trade with an entitlement to receive the shares of Vylor common stock distributed pursuant to the distribution. Shares of Corteva common stock that trade on the “ex-distribution” market will trade without an entitlement to receive the Vylor common stock distributed pursuant to the distribution. Therefore, if you sell Corteva common stock in the “regular-way” market on or prior to the last trading day prior to the distribution date, you will also be selling your right to receive Vylor common stock in the distribution. If you own Corteva common stock as of the record date and sell those shares on the “ex-distribution” market on or prior to the last trading day prior to the distribution date, you will receive the shares of Vylor common stock that you are entitled to receive pursuant to your ownership of Corteva common stock as of the record date.
Furthermore, we anticipate that trading in Vylor common stock will begin on a “when-issued” basis as early as the trading day prior to the record date for the distribution and will continue through the last trading day prior to the distribution date. “When-issued” trading in the context of a separation refers to a sale or purchase made conditionally on or before the distribution date because the securities of the separated entity have not yet been distributed. The “when-issued” trading market will be a market for Vylor common stock that will be distributed to holders of Corteva common stock on the distribution date. If you owned Corteva common stock as of the record date, you would be entitled to Vylor common stock distributed pursuant to the distribution. You may trade this entitlement to shares of Vylor common stock, without Corteva common stock you own, on the “when-issued” market. We anticipate that trading on a “when-issued” basis will continue through the last trading day prior to the distribution date. At the open of trading on the distribution date (or, if the distribution date is not a trading day, the first trading day after the distribution date), “regular-way” trading will begin.
Conditions to the Distribution
The distribution will be subject to the satisfaction (or, to the extent permitted by applicable law, waiver by the Corteva board of directors in its absolute and sole discretion) of the following conditions:
•the SEC having declared effective the Form 10 under the Exchange Act (or the Form 10 having otherwise become effective pursuant to and in accordance with Section 12(d) of the Exchange Act), no stop order relating to the Form 10 being in effect, no proceedings seeking such a stop order being pending before or threatened by the SEC and this information statement (or notice of internet availability hereof) having been distributed to Corteva stockholders;
•the listing of Vylor common stock on the NYSE having been approved, subject to official notice of issuance;
•Corteva having received the Tax Opinions confirming that the distribution and certain transactions entered in connection with the spin-off generally will be tax free to Corteva and its stockholders for U.S. federal income tax purposes (as described in the section entitled “Risk Factors— Risks Related to the Spin-Off”);
•each of Vylor, EIDP and Corteva having received an opinion from an independent financial advisory firm to the effect that, assuming the spin-off transactions are consummated, Vylor, EIDP and New Corteva, as applicable, would be solvent, adequately capitalized and be able to pay its debts as they become due and that Vylor, EIDP and Corteva, as applicable, would have adequate surplus to
declare the Vylor cash distribution, the EIDP distribution and the Distribution, as applicable, in each case, after giving effect to the spin-off transactions;
•no order, injunction or decree issued by any governmental entity of competent jurisdiction, or other legal restraint or prohibition preventing consummation of the distribution or any of the related transactions shall be pending, threatened, issued or in effect, and no other outside event having occurred or failed to occur that prevents the consummation of all or a portion of the distribution;
•the internal reorganization having been effectuated;
•the Vylor contribution and Vylor issuance having been completed;
•the financing for the Vylor financing arrangements having been available on terms acceptable to Corteva, (ii) Vylor having completed the Vylor financing arrangements and having received the proceeds in respect thereof and (iii) Vylor having completed the Vylor cash distribution;
•the EIDP distribution having been completed;
•the Corteva board of directors having declared the distribution and having approved all related transactions, which approval may be given or withheld in the Corteva board of director’s absolute and sole discretion (and such declaration or approval not having been withdrawn);
•Corteva, as our sole stockholder immediately prior to the distribution, having caused our board of directors to consist of the individuals identified in the section entitled “Management” as our directors, and those directors having resigned from the Corteva board of directors, as applicable;
•each of us, New Corteva and our respective applicable subsidiaries having entered into all ancillary agreements to which we, New Corteva or such subsidiary is contemplated to be a party; and
•no events or developments having occurred or existing that, in the sole and absolute judgment of the Corteva board of directors, make it inadvisable to effect the distribution or would result in the distribution and related transactions not being in the best interest of Corteva or its stockholders.
The satisfaction or waiver of such conditions will not create any obligation on Corteva’s part to effect the distribution, and the Corteva board of directors has the ability, in its sole and absolute discretion, to amend, modify or abandon the distribution and related transactions at any time prior to the distribution date. We intend to share details on any waivers or material changes of such conditions, if applicable, in our reports filed with the SEC.
Regulatory Approvals
We must complete the necessary registration under U.S. federal securities laws of Vylor common stock, as well as the applicable listing requirements of the NYSE for such shares.
Other than the requirements discussed above, we do not believe that any other material governmental or regulatory filings or approvals will be necessary to consummate the distribution.
No Appraisal Rights
Corteva stockholders are not entitled to appraisal rights in connection with the spin-off.
Reasons for Furnishing this Information Statement
This information statement is being furnished solely to provide information to Corteva stockholders who will receive shares of Vylor common stock in the distribution. This information statement is not, and is not to be construed as, an inducement or encouragement to buy, hold or sell any of our securities or any securities of Corteva. You should be aware of certain risks relating to the spin-off, Vylor and ownership of Vylor common stock, which are described under the section of this information statement entitled “Risk Factors.”
We believe that the information contained in this information statement is accurate as of the date set forth on the cover of this information statement. Changes to the information contained in this information statement may occur after that date, and neither Corteva, nor we undertake any obligation to update the information except in the normal course of Corteva’s or our respective public disclosure obligations and practices or as required by applicable law.
DIVIDEND POLICY
We have not yet determined the extent to which we will pay dividends on our common stock. This section will be populated, in an amendment to the Form 10, to provide information in regard to our future dividend policy.
CAPITALIZATION
The following table sets forth Vylor’s cash and cash equivalents and capitalization as of March 31, 2026, on a historical and on a pro forma basis giving effect to the spin-off as described in “Unaudited Pro Forma Consolidated Financial Statements” and “Notes to the Unaudited Pro Forma Consolidated Financial Statements,” as if they occurred on March 31, 2026. Despite the fact that Vylor is being spun off from Corteva in the spin-off and will be the legal spinnee in the transaction, for accounting purposes, primarily as a result of, among other factors, Vylor’s relative significance to New Corteva, Vylor will be considered the “accounting spinnor” and accounting successor to Corteva. As such, the historical financial information of Vylor prior to the spin-off will reflect the financial information of Corteva, with the historical cash and cash equivalents and capitalization for the Seed Business being derived from the Corteva Consolidated Balance Sheet as of March 31, 2026. Explanations for the pro forma adjustments can be found in “Unaudited Pro Forma Consolidated Financial Statements” and “Notes to the Unaudited Pro Forma Consolidated Financial Statements.” The following table should be reviewed in conjunction with “Unaudited Pro Forma Consolidated Financial Statements,” “Management’s Discussion and Analysis of Financial Condition and Results of Operations of Corteva,” “Management’s Discussion and Analysis of Financial Condition and Results of Operations of the Seed Business (Supplemental),” the audited Consolidated Financial Statements of Corteva and accompanying notes included elsewhere in this document, and the supplemental Combined Financial Statements of the Seed Business and accompanying notes included elsewhere in this document.
|
|
|
|
|
(In millions) |
As of March 31, 2026 |
|
Historical 1 |
Pro Forma |
Cash and cash equivalents |
|
|
|
|
Borrowings and capital lease obligations: |
|
|
|
|
Short-term |
|
|
|
|
Long-term |
|
|
|
|
Total borrowings and capital lease obligations |
|
|
|
|
Equity: |
|
|
|
|
Common stock |
|
|
|
|
Preferred stock |
|
|
|
|
Additional paid-in capital |
|
|
|
|
Accumulated deficit |
|
|
|
|
Accumulated other comprehensive loss |
|
|
|
|
Noncontrolling interests |
|
|
|
|
Total equity |
|
|
|
|
Total capitalization |
|
|
|
|
1. Represents cash and cash equivalents, debt and equity of Corteva, and is not indicative of the Seed Business’ future capitalization.
UNAUDITED PRO FORMA CONSOLIDATED FINANCIAL STATEMENTS
On October 1, 2025, Corteva, Inc. ("Corteva") announced its intention to pursue, subject to the approval of the Corteva Board of Directors and any required regulatory approvals, its separation into two independent publicly traded companies - one comprising its current Crop Protection Business ("New Corteva") and the other comprising its current Seed Business (“Vylor,” “our,” “we,” or "the Seed Business") - by distributing all outstanding shares of Vylor (inclusive of the Seed Business) common stock to Corteva stockholders (the "Separation") in a transaction that is intended to be a tax-free spin-off for U.S. federal income tax purposes. Immediately following the distribution, Corteva’s stockholders would own 100 percent of the shares of Vylor common stock. Irrespective of the legal form of the spin-off described elsewhere in this information statement, for accounting and financial reporting purposes, Corteva’s Crop Protection Business will be presented as being spun off from Corteva. This presentation is in accordance with U.S. GAAP and is primarily a result of, among other factors, Vylor’s relative significance to New Corteva.
The unaudited Pro Forma Consolidated Financial Statements consist of an unaudited Pro Forma Consolidated Statement of Operations for the three months ended March 31, 2026 and the year ended December 31, 2025 and an unaudited Pro Forma Consolidated Balance Sheet as of March 31, 2026. The unaudited Pro Forma Consolidated Financial Statements should be read in conjunction with the audited Consolidated Financial Statements of Corteva and the related notes, the historical supplemental audited Combined Financial Statements of the Seed Business and the related notes and the sections of this information statement entitled “Management’s Discussion and Analysis of Financial Condition and Results of Operations of Corteva” and “Management’s Discussion and Analysis of Financial Condition and Results of Operations of the Seed Business (Supplemental).” The unaudited Pro Forma Consolidated Statements of Operations have been prepared to give effect to the Pro Forma Transactions (as defined below) as if the Pro Forma Transactions had occurred or became effective as of January 1, 2025, the beginning of our most recently completed fiscal year, except that the Pro Forma Consolidated Statements of Income are also presented for the years ended December 31, 2024 and 2023 to reflect the presentation of the Crop Protection Business as discontinued operations. The unaudited Pro Forma Consolidated Balance Sheet has been prepared to give effect to the Pro Forma Transactions as though the Pro Forma Transactions had occurred or became effective as of March 31, 2026.
The unaudited Pro Forma Consolidated Financial Statements presented below do not purport to represent what our financial position and results of operations would have been had the Pro Forma Transactions occurred on the dates indicated and are not necessarily indicative of our future financial position and future results of operations. In addition, the unaudited Pro Forma Consolidated Financial Statements are provided for illustrative and informational purposes only. The Pro Forma Transactions are based on available information and assumptions we believe are reasonable; however, such adjustments are subject to change.
The unaudited Pro Forma Consolidated Financial Statements have been adjusted to give effect to the following adjustments (collectively, the “Pro Forma Transactions”):
•the disposition, for accounting purposes, of Corteva’s Crop Protection Business, which we expect to qualify as discontinued operations and is, therefore, reflected in the unaudited Pro Forma Consolidated Financial Statements in accordance with the guidance in Accounting Standards Codification ("ASC") 205-20, Presentation of Financial Statements – Discontinued Operations (“ASC 205-20”);
•the effect of our anticipated capital structure following the spin-off, including the incurrence of principal indebtedness of an assumed amount equal to $[•] million and the expected distribution of an aggregate amount equal to $[•] million of cash to New Corteva;
•the inclusion of approximately $[•] million of non-recurring selling, general and administrative costs and $[•] million of related tax benefit expected to be incurred in conjunction with the spin-off;
•the pro rata distribution of [•]% of our issued and outstanding common stock by Corteva in connection with the spin-off; and
•the impact of the Separation and Distribution Agreement, Tax Matters Agreement, Employee Matters Agreement, Transition Services Agreements, Commercial Agreements, Intellectual Property Matters Agreement and other ancillary agreements between Vylor and New Corteva and the provisions contained therein.
We have included estimated pro forma adjustments within the Other Transaction Accounting Adjustments column that we expect to incur in conjunction with the spin-off, as further described in Note 2 - Other Transaction Accounting Adjustments, to the unaudited Pro Forma Consolidated Financial Statements. A final determination regarding our capital structure has not yet been made, and the Separation and Distribution Agreement, Tax Matters Agreement, Employee Matters Agreement, Transition Services Agreements, Commercial Agreements, Intellectual Property Matters Agreement and other ancillary agreements have not been finalized. To the extent any revisions or modifications to the agreements or any new agreements give rise to material changes, additional pro forma adjustments may be necessary to reflect the impact on our capital structure and the final form of those agreements once executed.
The unaudited Pro Forma Consolidated Financial Statements constitute forward-looking information and are subject to certain risks and uncertainties that could cause actual results to differ materially from those anticipated. See the section of this information statement entitled “Cautionary Statement Concerning Forward-Looking Statements.”
Unaudited Pro Forma Consolidated Balance Sheet
As of March 31, 2026
|
|
|
|
|
|
|
|
|
|
|
|
|
|
(In millions, except share and per share amounts) |
Historical Corteva |
|
Separation of Crop Protection business |
|
Other
transaction
accounting
adjustments |
|
|
Pro Forma as of March 31, 2026 |
|
|
Note 1 |
|
Note 1 |
|
Note 2 |
|
|
|
|
Assets |
|
|
|
|
|
|
|
|
|
Current assets |
|
|
|
|
|
|
|
|
|
Cash and cash equivalents |
$ |
1,964 |
|
$ |
(1,528 |
) |
[•] |
|
(a) |
$ |
436 |
|
Marketable securities |
|
2 |
|
|
(1 |
) |
|
|
|
|
1 |
|
Accounts and notes receivable—net |
|
9,088 |
|
|
(5,501 |
) |
|
91 |
|
(f) |
|
3,678 |
|
Inventories |
|
5,202 |
|
|
(2,595 |
) |
|
19 |
|
(f) |
|
2,626 |
|
Other current assets |
|
1,129 |
|
|
(568 |
) |
|
|
|
|
561 |
|
Total current assets |
|
17,385 |
|
|
(10,193 |
) |
|
110 |
|
|
|
7,302 |
|
Investment in nonconsolidated affiliates |
|
165 |
|
|
(88 |
) |
|
|
|
|
77 |
|
Property, plant and equipment |
|
9,617 |
|
|
(5,074 |
) |
|
|
|
|
4,543 |
|
Less: Accumulated depreciation |
|
5,434 |
|
|
(3,334 |
) |
|
|
|
|
2,100 |
|
Net property, plant and equipment |
|
4,183 |
|
|
(1,740 |
) |
|
|
|
|
2,443 |
|
Goodwill |
|
10,409 |
|
|
(5,135 |
) |
|
|
|
|
5,274 |
|
Other intangible assets |
|
8,147 |
|
|
(1,005 |
) |
|
|
|
|
7,142 |
|
Deferred income taxes |
|
395 |
|
|
(312 |
) |
|
|
|
|
83 |
|
Other assets |
|
2,033 |
|
|
(1,436 |
) |
|
156 |
|
(e) |
|
753 |
|
Total Assets |
$ |
42,717 |
|
$ |
(19,909 |
) |
$ |
266 |
|
|
$ |
23,074 |
|
Liabilities and Equity |
|
|
|
|
|
|
|
|
|
Current liabilities |
|
|
|
|
|
|
|
|
|
Short-term borrowings |
$ |
1,674 |
|
$ |
(1,547 |
) |
|
|
|
$ |
127 |
|
Accounts payable |
|
4,187 |
|
|
(2,485 |
) |
|
|
|
|
1,702 |
|
Income taxes payable |
|
229 |
|
|
(155 |
) |
|
|
|
|
74 |
|
Deferred revenue |
|
2,773 |
|
|
(146 |
) |
|
|
|
|
2,627 |
|
Accrued and other current liabilities |
|
2,991 |
|
|
(1,376 |
) |
|
270 |
|
(d) |
|
1,885 |
|
Total current liabilities |
|
11,854 |
|
|
(5,709 |
) |
|
270 |
|
|
|
6,415 |
|
Long-term debt |
|
1,682 |
|
|
(1,682 |
) |
[•] |
|
(b) |
|
— |
|
Other noncurrent liabilities |
|
|
|
|
|
|
|
|
|
Deferred income tax liabilities |
|
290 |
|
|
623 |
|
|
|
|
|
913 |
|
Pension and other post-employment benefits |
|
2,388 |
|
|
(2,307 |
) |
|
|
|
|
81 |
|
Other noncurrent obligations |
|
1,898 |
|
|
(1,409 |
) |
[•] |
|
(e) |
|
489 |
|
Total noncurrent liabilities |
|
6,258 |
|
|
(4,775 |
) |
|
— |
|
|
|
1,483 |
|
Commitments and contingent liabilities |
|
|
|
|
|
|
|
|
|
Stockholders’ equity |
|
|
|
|
|
|
|
|
|
Common stock, $0.01 par value;1,666,667,000 shares authorized;
issued at March 31, 2026 - 670,044,000 |
|
7 |
|
|
— |
|
|
|
|
|
7 |
|
Additional paid-in capital |
|
26,859 |
|
|
(10,198 |
) |
|
(4 |
) |
(g) |
|
16,657 |
|
Retained earnings (accumulated deficit) |
|
436 |
|
|
(436 |
) |
|
|
|
|
— |
|
Accumulated other comprehensive income (loss) |
|
(2,940 |
) |
|
1,447 |
|
|
|
|
|
(1,493 |
) |
Total Corteva stockholders’ equity |
|
24,362 |
|
|
(9,187 |
) |
|
(4 |
) |
|
|
15,171 |
|
Noncontrolling interests |
|
243 |
|
|
(238 |
) |
|
|
|
|
5 |
|
Total equity |
|
24,605 |
|
|
(9,425 |
) |
|
(4 |
) |
|
|
15,176 |
|
Total Liabilities and Equity |
$ |
42,717 |
|
$ |
(19,909 |
) |
$ |
266 |
|
|
$ |
23,074 |
|
See accompanying Notes to the Unaudited Pro Forma Consolidated Financial Statements.
Unaudited Pro Forma Consolidated Statement of Operations
for the Three Months Ended March 31, 2026
|
|
|
|
|
|
|
|
|
|
|
|
|
|
|
(In millions, except per share amounts) |
Historical Corteva |
|
Separation of Crop Protection business |
|
Other
transaction
accounting
adjustments |
|
|
Pro Forma Three Months Ended March 31, 2026 |
|
|
|
Note 1 & 3 |
|
Note 1 |
|
Note 2 |
|
|
|
|
|
Net sales |
$ |
4,905 |
|
$ |
(1,882 |
) |
$ |
20 |
|
(f) |
$ |
3,043 |
|
|
Cost of goods sold |
|
2,372 |
|
|
(1,064 |
) |
|
52 |
|
(f) |
|
1,360 |
|
|
Research and development expense |
|
341 |
|
|
(102 |
) |
|
|
|
|
239 |
|
|
Selling, general and administrative expenses |
|
877 |
|
|
(337 |
) |
|
2 |
|
(f) |
|
542 |
|
|
Amortization of intangibles |
|
160 |
|
|
(39 |
) |
|
|
|
|
121 |
|
|
Restructuring and asset-related charges—net |
|
92 |
|
|
(63 |
) |
|
|
|
|
29 |
|
|
Separation costs |
|
52 |
|
|
(1 |
) |
|
|
|
|
51 |
|
|
Other income (expense) - net |
|
(117 |
) |
|
15 |
|
|
3 |
|
(f) |
|
(99 |
) |
|
Interest expense |
|
36 |
|
|
(34 |
) |
[•] |
|
(c) |
|
2 |
|
|
Income (loss) from continuing operations before income taxes |
|
858 |
|
|
(227 |
) |
|
(31 |
) |
|
|
600 |
|
|
Provision for (benefit from) income taxes on continuing operations |
|
133 |
|
|
(22 |
) |
|
(6 |
) |
(h) |
|
105 |
|
|
Income (loss) from continuing operations after income taxes |
|
725 |
|
|
(205 |
) |
|
(25 |
) |
|
|
495 |
|
|
Net income (loss) from continuing operations attributable to noncontrolling interests |
|
3 |
|
|
(2 |
) |
|
|
|
|
1 |
|
|
Net income (loss) from continuing operations attributable to Corteva |
$ |
722 |
|
$ |
(203 |
) |
$ |
(25 |
) |
|
$ |
494 |
|
|
Earnings (loss) per share of common stock: |
|
|
|
|
|
|
|
|
|
|
Basic earnings (loss) per share of common stock from continuing operations |
$ |
1.07 |
|
|
|
|
|
|
[•] |
|
(i) |
Diluted earnings (loss) per share of common stock from continuing operations |
$ |
1.07 |
|
|
|
|
|
|
[•] |
|
(j) |
Weighted average number of common shares outstanding: |
|
|
|
|
|
|
|
|
|
|
Basic |
|
672.5 |
|
|
|
|
|
|
[•] |
|
(i) |
Diluted |
|
673.6 |
|
|
|
|
|
|
[•] |
|
(j) |
See accompanying Notes to the Unaudited Pro Forma Consolidated Financial Statements.
Unaudited Pro Forma Consolidated Statement of Operations
for the Year Ended December 31, 2025
|
|
|
|
|
|
|
|
|
|
|
|
|
|
|
(In millions, except per share amounts) |
Historical Corteva |
|
Separation of Crop Protection business |
|
Other
transaction
accounting
adjustments |
|
|
Pro Forma Year Ended December 31, 2025 |
|
|
|
Note 1 & 3 |
|
Note 1 |
|
Note 2 |
|
|
Note 3 |
|
|
Net sales |
$ |
17,401 |
|
$ |
(7,503 |
) |
$ |
169 |
|
(f) |
$ |
10,067 |
|
|
Cost of goods sold |
|
9,172 |
|
|
(4,596 |
) |
|
166 |
|
(f) |
|
4,742 |
|
|
Research and development expense |
|
1,474 |
|
|
(495 |
) |
|
|
|
|
979 |
|
|
Selling, general and administrative expenses |
|
3,492 |
|
|
(1,350 |
) |
|
17 |
|
(f) |
|
2,159 |
|
|
Amortization of intangibles |
|
644 |
|
|
(155 |
) |
|
|
|
|
489 |
|
|
Restructuring and asset-related charges—net |
|
146 |
|
|
(143 |
) |
|
|
|
|
3 |
|
|
Separation costs |
|
35 |
|
|
— |
|
|
270 |
|
(d) |
|
305 |
|
|
Other income (expense) - net |
|
(570 |
) |
|
(159 |
) |
|
10 |
|
(f) |
|
(719 |
) |
|
Interest expense |
|
180 |
|
|
(175 |
) |
[•] |
|
(c) |
|
5 |
|
|
Income (loss) from continuing operations before income taxes |
|
1,688 |
|
|
(748 |
) |
|
(274 |
) |
|
|
666 |
|
|
Provision for (benefit from) income taxes on continuing operations |
|
484 |
|
|
(152 |
) |
|
(43 |
) |
(h) |
|
289 |
|
|
Income (loss) from continuing operations after income taxes |
|
1,204 |
|
|
(596 |
) |
|
(231 |
) |
|
|
377 |
|
|
Net income (loss) from continuing operations attributable to noncontrolling interests |
|
11 |
|
|
(10 |
) |
|
|
|
|
1 |
|
|
Net income (loss) from continuing operations attributable to Corteva |
$ |
1,193 |
|
$ |
(586 |
) |
$ |
(231 |
) |
|
$ |
376 |
|
|
Earnings (loss) per share of common stock: |
|
|
|
|
|
|
|
|
|
|
Basic earnings (loss) per share of common stock from continuing operations |
$ |
1.75 |
|
|
|
|
|
|
$ [•] |
|
(i) |
Diluted earnings (loss) per share of common stock from continuing operations |
$ |
1.75 |
|
|
|
|
|
|
$ [•] |
|
(j) |
Weighted average number of common shares outstanding: |
|
|
|
|
|
|
|
|
|
|
Basic |
|
680.0 |
|
|
|
|
|
|
[•] |
|
(i) |
Diluted |
|
681.4 |
|
|
|
|
|
|
[•] |
|
(j) |
See accompanying Notes to the Unaudited Pro Forma Consolidated Financial Statements.
NOTES TO THE UNAUDITED PRO FORMA CONSOLIDATED FINANCIAL STATEMENTS
NOTE 1—BASIS OF PRESENTATION, INCLUDING SEPARATION OF CROP PROTECTION BUSINESS
The accompanying unaudited pro forma consolidated financial information was prepared in accordance with Article 11 of Regulation S-X.
As described elsewhere in this information statement, for periods prior to the spin-off, our financial statements are represented by the historical financial statements of Corteva. Therefore, historical Corteva in the pro forma financial information above represents Corteva, Inc. and its consolidated subsidiaries (including Vylor and its combined subsidiaries), as defined elsewhere in this information statement, before giving effect to the planned spin-off. The unaudited Pro Forma Consolidated Statements of Operations have been prepared to give effect to the Pro Forma Transactions as if the Pro Forma Transactions had occurred or became effective as of January 1, 2025, the beginning of our most recently completed fiscal year, except that the Pro Forma Consolidated Statements of Income are also presented for the years ended December 31, 2024 and 2023 to reflect the presentation of the Crop Protection Business as discontinued operations. The unaudited Pro Forma Consolidated Balance Sheet has been prepared to give effect to the Pro Forma Transactions as though the Pro Forma Transactions had occurred as of March 31, 2026. Within Note 5 - Management Adjustments, to the unaudited Pro Forma Consolidated Financial Statements, further discussion is also provided on expected income statement impacts that will occur only upon the effective date of the spin-off.
As discussed above and elsewhere in this information statement, the spin-off is being treated as a reverse spin for financial accounting and reporting purposes under U.S. GAAP and, as a result, Corteva’s Crop Protection Business is presented as being spun-off from Corteva. The Crop Protection Business is a component of Corteva that has operations and cash flows that are clearly distinguished for operational and financial reporting purposes. The spin-off will result in the Crop Protection Business becoming a stand-alone, publicly traded company and represents a strategic shift that will have a major effect on our financial results as we are exiting a significant line of business. The spin-off is not expected to result in the recognition of a gain or loss and will be effected through a pro rata distribution of all of the outstanding shares of Vylor common stock to holders of Corteva common stock; however, we will incur separation related expenses which are further discussed in Note 2 - Other Transaction Accounting Adjustments, to the unaudited Pro Forma Consolidated Financial Statements. While we will be a party to the Separation and Distribution Agreement and other agreements, including the Tax Matters Agreement, Employee Matters Agreement, Transition Services Agreements, Commercial Agreements, Intellectual Property Matters Agreement and other ancillary agreements, we have determined that we will not have significant continuing involvement in the operations of New Corteva after the spin-off nor do we expect significant continuing cash flows from New Corteva after the spin-off.
We do not expect to incur material transition services costs or income associated with the transition services agreements into which Vylor intends to enter with New Corteva. As such, no estimates of expenses or income have been presented in the unaudited Pro Forma Consolidated Statements of Operations for the three months ended March 31, 2026 and the year ended December 31, 2025.
The spin-off of the Crop Protection Business for accounting purposes is presented in accordance with the guidance in ASC 205-20. As a result, the Crop Protection Business is reflected as discontinued operations in the unaudited pro forma consolidated financial information for all periods presented. Furthermore, the unaudited Pro Forma Consolidated Statements of Operations are presented solely on a continuing operations basis and reflect the elimination of the Crop Protection Business for all periods presented. Consistent with the requirements of ASC 205-20, the unaudited Pro Forma Consolidated Statements of Operations also do not allocate any of Corteva’s general corporate overhead expenses to the Crop Protection Business. Refer to Note 4 - Discontinued Operations, to the Unaudited Pro Forma Consolidated Financial Statements, for discontinued operations information for the years ended December 31, 2024 and 2023 in accordance with Regulation S-X item 11-02(c)(2)(ii).
NOTE 2—OTHER TRANSACTION ACCOUNTING ADJUSTMENTS
a)Cash and cash equivalents: Reflects the estimated proceeds from the issuance of a $[•] million [•]-year term loan expected to be incurred in connection with the spin-off, net of an estimated $[•] million expected to be distributed to New Corteva and approximately $[•] million of debt issuance costs. See note (b) below.
b)Long-term debt: Vylor is expected to incur significant debt in connection with the spin-off transaction. The expected debt balance and form of debt at the time of the distribution will be determined by senior management based on a review of a number of factors, including forecast liquidity and capital requirements, expected operating results and general economic and market conditions.
c)Interest expense: The adjustment of $[•] million and $[•] million is to record estimated interest expense for the three months ended March 31, 2026 and the year ended December 31, 2025, respectively, which assumes debt related to the spin-off transaction is incurred beginning on January 1, 2025 and the associated debt was outstanding through March 31, 2026. These adjustments represent approximately $[•] million and $[•] million of interest expense based on a weighted-average interest rate of approximately [•] for the three months ended March 31, 2026 and the year ended December 31, 2025, respectively. The interest rate is expected to be based on the Secured Overnight Financing Rate (determined in a customary manner) plus a spread. A 1/8 percent variance in the estimated interest rate would change the interest expense by approximately $[•] million for the three months ended March 31, 2026 and $[•] million for the year ended December 31, 2025.
d)As a result of the spin-off, we expect to incur approximately $270 million of selling, general and administrative separation-related expenses which have not yet been recognized as of the period presented in the unaudited pro forma consolidated financial information above, primarily related to external third-party advisors, external counsel, bank success fees and tax costs associated with the legal entity separation. For pro forma purposes, these estimates of expenses, which management believes are reasonable, have been presented in the unaudited Pro Forma Consolidated Statement of Operations for the year ended December 31, 2025, assuming the spin-off occurred as of January 1, 2025, and have been included within accrued and other current liabilities on the unaudited Pro Forma Consolidated Balance Sheet as of March 31, 2026. Separation-related expenses of $52 million and $35 million for the three months ended March 31, 2026 and the year ended December 31, 2025, respectively, are included in the historical Corteva results above.
e)The Tax Matters Agreement requires certain payments between Vylor and New Corteva for pre-separation tax liabilities and receivables. Accordingly, increases to assets of approximately $156 million, net, have been recorded within other current assets on the unaudited Pro Forma Consolidated Balance Sheet. These adjustments are based on current estimates of pre-separation tax liabilities and receivables and may vary from our current expectations.
f)We expect to enter into certain long-term commercial agreements with New Corteva including certain revenue and commission sharing arrangements. Included in the unaudited Pro Forma Consolidated Statement of Operations for the three months ended March 31, 2026 are adjustments to net sales of $20 million, cost of goods sold of $52 million, selling, general and administrative expenses of $2 million, and other income (expense) - net of $3 million. Included in the unaudited Pro Forma Consolidated Statement of Operations for the year ended December 31, 2025 are adjustments to net sales of $169 million, cost of goods sold of $166 million, selling, general and administrative expenses of $17 million, and other income (expense) - net of $10 million. Included in the unaudited Pro Forma Consolidated Balance Sheet as of March 31, 2026 are adjustments of $91 million to accounts and notes receivable – net and $19 million to inventories.
g)Additional paid-in capital: Represents the additional paid-in capital impact of the unaudited Pro Forma Consolidated Balance Sheet adjustments included in notes (a), (b), (d), (e) and (f).
h)Income tax expense: Reflects $6 million and $43 million for the three months ended March 31, 2026 and the year ended December 31, 2025, respectively, of preliminary income tax pro forma adjustments. This adjustment was determined by applying the respective statutory tax rates to pre-tax pro forma adjustments in the applicable jurisdictions and is subject to change if the pro forma adjustments change.
NOTE 3—EARNINGS PER SHARE
i)Pro forma basic earnings per share and pro forma weighted-average basic shares outstanding for the three months ended March 31, 2026 and the year ended December 31, 2025 reflect the number of shares of Vylor common stock which are expected to be outstanding upon completion of the distribution. We have assumed the number of outstanding shares of common stock based on the number of Corteva common shares outstanding at March 31, 2026 and December 31, 2025, and an assumed pro rata distribution ratio of one share of Vylor common stock for each share of Corteva common stock. The actual number of shares of Vylor common stock outstanding may be different from this estimated amount.
j)Pro forma diluted earnings per share and pro forma weighted-average diluted shares outstanding reflect the estimated number of shares of Vylor common stock that are expected to be outstanding upon completion of the distribution and reflect the potential issuance of shares of Vylor common stock under our equity plans, based on the distribution ratio of one share of Vylor common stock for every share of Corteva common stock. The actual number of shares of Vylor common stock outstanding may be different from this estimated amount.
NOTE 4—DISCONTINUED OPERATIONS
As noted above, the disposition of Corteva’s Crop Protection Business is expected to qualify as discontinued operations and thus requires retrospective presentation in accordance with ASC 205-20. Unaudited Pro Forma Consolidated Statements of Operations have been included for the years ended December 31, 2024 and 2023. Pro forma earnings per share and weighted-average shares outstanding for the years ended December 31, 2024 and 2023 reflect the estimated number of shares of Vylor common stock that are expected to be outstanding upon completion of the distribution and reflect the potential issuance of shares of Vylor common stock under our equity plans, based on the distribution ratio of one share of Vylor common stock for every share of Corteva common stock for basic and diluted, respectively.
|
|
|
|
|
|
|
|
|
|
(In millions, except per share amounts) |
Historical Corteva |
|
Separation of Crop Protection business |
|
Pro Forma Year Ended December 31, 2024 |
|
|
Note 1 |
|
Note 1 |
|
|
|
Net sales |
$ |
16,908 |
|
$ |
(7,363 |
) |
$ |
9,545 |
|
Cost of goods sold |
|
9,529 |
|
|
(4,648 |
) |
|
4,881 |
|
Research and development expense |
|
1,402 |
|
|
(500 |
) |
|
902 |
|
Selling, general and administrative expenses |
|
3,196 |
|
|
(1,226 |
) |
|
1,970 |
|
Amortization of intangibles |
|
685 |
|
|
(160 |
) |
|
525 |
|
Restructuring and asset-related charges—net |
|
288 |
|
|
(218 |
) |
|
70 |
|
Other income (expense) - net |
|
(300 |
) |
|
209 |
|
|
(91 |
) |
Interest expense |
|
233 |
|
|
(231 |
) |
|
2 |
|
Income (loss) from continuing operations before income taxes |
|
1,275 |
|
|
(171 |
) |
|
1,104 |
|
Provision for (benefit from) income taxes on continuing operations |
|
412 |
|
|
(77 |
) |
|
335 |
|
Income (loss) from continuing operations after income taxes |
|
863 |
|
|
(94 |
) |
|
769 |
|
Net income (loss) from continuing operations attributable to noncontrolling interests |
|
12 |
|
|
(10 |
) |
|
2 |
|
Net income (loss) from continuing operations attributable to Corteva |
$ |
851 |
|
$ |
(84 |
) |
$ |
767 |
|
Earnings (loss) per share of common stock: |
|
|
|
|
|
|
Basic earnings (loss) per share of common stock from continuing operations |
$ |
1.23 |
|
|
|
[•] |
|
Diluted earnings (loss) per share of common stock from continuing operations |
$ |
1.22 |
|
|
|
[•] |
|
Weighted average number of common shares outstanding: |
|
|
|
|
|
|
Basic |
|
693.7 |
|
|
|
[•] |
|
Diluted |
|
696.0 |
|
|
|
[•] |
|
|
|
|
|
|
|
|
|
|
|
(In millions, except per share amounts) |
Historical Corteva |
|
Separation of Crop Protection business |
|
Pro Forma Year Ended December 31, 2023 |
|
|
Note 1 |
|
Note 1 |
|
|
|
Net sales |
$ |
17,226 |
|
$ |
(7,754 |
) |
$ |
9,472 |
|
Cost of goods sold |
|
9,920 |
|
|
(4,934 |
) |
|
4,986 |
|
Research and development expense |
|
1,337 |
|
|
(501 |
) |
|
836 |
|
Selling, general and administrative expenses |
|
3,176 |
|
|
(1,240 |
) |
|
1,936 |
|
Amortization of intangibles |
|
683 |
|
|
(145 |
) |
|
538 |
|
Restructuring and asset-related charges—net |
|
336 |
|
|
(237 |
) |
|
99 |
|
Other income (expense) - net |
|
(448 |
) |
|
324 |
|
|
(124 |
) |
Interest expense |
|
233 |
|
|
(232 |
) |
|
1 |
|
Income (loss) from continuing operations before income taxes |
|
1,093 |
|
|
(141 |
) |
|
952 |
|
Provision for (benefit from) income taxes on continuing operations |
|
152 |
|
|
84 |
|
|
236 |
|
Income (loss) from continuing operations after income taxes |
|
941 |
|
|
(225 |
) |
|
716 |
|
Net income (loss) from continuing operations attributable to noncontrolling interests |
|
12 |
|
|
(10 |
) |
|
2 |
|
Net income (loss) from continuing operations attributable to Corteva |
$ |
929 |
|
$ |
(215 |
) |
$ |
714 |
|
Earnings (loss) per share of common stock: |
|
|
|
|
|
|
Basic earnings (loss) per share of common stock from continuing operations |
$ |
1.31 |
|
|
|
[•] |
|
Diluted earnings (loss) per share of common stock from continuing operations |
$ |
1.30 |
|
|
|
[•] |
|
Weighted average number of common shares outstanding: |
|
|
|
|
|
|
Basic |
|
709.0 |
|
|
|
[•] |
|
Diluted |
|
711.9 |
|
|
|
[•] |
|
NOTE 5—MANAGEMENT ADJUSTMENTS
Vylor anticipates a reduction to certain general corporate overhead costs, including costs associated with labor and benefits for shared resources transferred to New Corteva that Vylor does not intend to backfill after the spin-off as well as non-personnel third-party support costs. These costs were excluded from discontinued operations in Note 1 above as they represent general corporate overhead costs that were historically allocated to New Corteva and do not meet the requirements to be presented as discontinued operations.
The cost reductions that Vylor plans to realize are based on the expected organizational and cost structure after the spin-off. In developing these estimates, a detailed assessment was prepared of the resources and associated costs required to support the business after the spin-off. Estimated non-personnel third-party support costs were determined by estimating third-party spend in each function, and include the costs associated with outside services supporting executive management, finance, legal, information technology, employee benefits administration, treasury, risk management and procurement. From a timeframe standpoint, these cost reductions will begin to materialize at the effective date of the spin-off. Management believes the costs which were used as the basis for the management adjustments below are reasonable and representative of the cost reductions Vylor will realize after the spin-off.
One-time and non-recurring expenses associated with spin-off have also been estimated. These non-recurring costs primarily include costs to establish stand-alone information technology systems and will be incurred subsequent to the spin-off date.
Management believes the presentation of these adjustments are necessary to enhance an understanding of the pro forma effects of the transaction. The pro forma financial information below reflects all adjustments that are, in the opinion of management, necessary to provide a fair statement of the pro forma financial information, aligned with the assessment described above.
These management adjustments include forward-looking information that is subject to the safe harbor protections of the Exchange Act. The tax effect has been determined by applying the relevant statutory tax rates to the aforementioned adjustments.
The table below includes the management adjustments:
|
|
|
|
(In millions, except per share amounts) |
Three Months Ended
March 31, 2026 |
|
Pro forma income from continuing operations attributable to Corteva* |
$ |
494 |
|
Management adjustments |
|
|
Corporate support functions labor-based reductions |
|
13 |
|
One-time and non-recurring expenses associated with the spin-off |
|
(2 |
) |
Tax effect |
|
(3 |
) |
Pro forma income (loss) from continuing operations after management adjustments |
$ |
502 |
|
|
|
|
Basic earnings (loss) per share of common stock: |
|
|
Basic earnings (loss) per share of common stock from continuing operations |
[•] |
|
Diluted earnings (loss) per share of common stock from continuing operations |
[•] |
|
Weighted average number of common shares outstanding: |
|
|
Basic |
[•] |
|
Diluted |
[•] |
|
|
|
|
|
(In millions, except per share amounts) |
Year Ended
December 31, 2025 |
|
Pro forma income from continuing operations attributable to Corteva* |
$ |
376 |
|
Management adjustments |
|
|
Corporate support functions labor-based reductions |
|
58 |
|
One-time and non-recurring expenses associated with the spin-off |
|
(25 |
) |
Tax effect |
|
(8 |
) |
Pro forma income (loss) from continuing operations after management adjustments |
$ |
401 |
|
|
|
|
Basic earnings (loss) per share of common stock: |
|
|
Basic earnings (loss) per share of common stock from continuing operations |
[•] |
|
Diluted earnings (loss) per share of common stock from continuing operations |
[•] |
|
Weighted average number of common shares outstanding: |
|
|
Basic |
[•] |
|
Diluted |
[•] |
|
* As shown in the unaudited Pro Forma Consolidated Statement of Operations.
NOTE 6—RECONCILIATION OF PRO FORMA OPERATING EBITDA
Non-GAAP Financial Measure
Vylor presents certain financial measures that do not conform to U.S. GAAP and are considered non-GAAP measures. One such measure is pro forma operating EBITDA. Management uses operating EBITDA internally for planning and forecasting, including allocating resources and evaluating incentive compensation. Management believes that this non-GAAP measure best reflects the ongoing performance of the company during the periods presented and provides more relevant and meaningful information to investors as it provides insight with respect to ongoing operating results of the company and a more useful comparison of year over year results. This non-GAAP measure supplements Vylor's U.S. GAAP disclosures and should not be viewed as an alternative to U.S. GAAP measures of performance. Furthermore, such a non-GAAP measure may not be consistent with similar measures provided or used by other companies. A reconciliation for this non-GAAP measure to U.S. GAAP is provided below.
Pro forma operating EBITDA is defined as pro forma earnings (loss) (i.e., pro forma income (loss) from continuing operations before income taxes) before interest, depreciation, amortization, non-operating benefits (costs), foreign exchange gains (losses), and net unrealized gain or loss from mark-to-market activity for certain foreign currency derivative instruments that do not qualify for hedge accounting, excluding the impact of significant items and separation costs. Non-operating benefits (costs) consists of non-operating pension and OPEB credits (costs). Net unrealized gain or loss from mark-to-market activity for certain foreign currency derivative instruments that do not qualify for hedge accounting represents the non-cash net gain (loss) from changes in fair value of certain undesignated foreign currency derivative contracts. Upon settlement, which is within the same calendar year of execution of the contract, the realized gain (loss) from the changes in fair value of the non-qualified foreign currency derivative contracts will be reported in the
relevant non-GAAP financial measures, allowing quarterly results to reflect the economic effects of the foreign currency derivative contracts without the resulting unrealized mark to fair value volatility.
In many instances, the pro forma balances below that are used to reconcile pro forma net income (loss) from continuing operations to operating EBITDA differ from those in the comparable reconciliation presented in the Combined Financial Statements, which are presented on a carve-out basis, due to the differing bases of accounting used.
Reconciliation of Pro Forma Net Income (Loss) from Continuing Operations to Operating EBITDA
|
|
|
|
|
(In millions) |
Three Months Ended March 31, 2026 |
|
Pro forma net income from continuing operations - Vylor |
|
$ |
495 |
|
Provision for (benefit from) income taxes on continuing operations - Vylor |
|
|
105 |
|
Pro forma income (loss) before income taxes from continuing operations - Vylor |
|
$ |
600 |
|
Depreciation and amortization |
|
|
192 |
|
Interest - net |
|
|
(10 |
) |
Exchange (gains) losses - net |
|
|
116 |
|
Non-operating (benefits) costs - net |
|
|
— |
|
Mark-to-market (gains) losses on certain foreign currency contracts not designated as hedges |
|
|
1 |
|
Significant items (benefit) charge |
|
|
29 |
|
Separation costs |
|
|
51 |
|
Pro forma operating EBITDA - Vylor |
|
$ |
979 |
|
|
|
|
|
|
(In millions) |
Year Ended December 31, 2025 |
|
Pro forma net income from continuing operations - Vylor |
|
$ |
377 |
|
Provision for (benefit from) income taxes on continuing operations - Vylor |
|
|
289 |
|
Pro forma income (loss) before income taxes from continuing operations - Vylor |
|
$ |
666 |
|
Depreciation and amortization |
|
|
781 |
|
Interest - net |
|
|
(45 |
) |
Exchange (gains) losses - net |
|
|
143 |
|
Non-operating (benefits) costs - net |
|
|
3 |
|
Mark-to-market (gains) losses on certain foreign currency contracts not designated as hedges |
|
|
— |
|
Significant items (benefit) charge |
|
|
650 |
|
Separation costs |
|
|
305 |
|
Pro forma operating EBITDA - Vylor |
|
$ |
2,503 |
|
MANAGEMENT’S DISCUSSION AND ANALYSIS OF FINANCIAL CONDITION AND RESULTS OF OPERATIONS OF CORTEVA
The following discussion of Corteva’s financial condition and results of operations for the three months ended March 31, 2026 and 2025 and the years ended December 31, 2025, 2024 and 2023 reflects the audited Consolidated Financial Statements and unaudited interim Consolidated Financial Statements of Corteva. This discussion should be read in conjunction with the audited Consolidated Financial Statements of Corteva and the notes thereto and the unaudited interim Consolidated Financial Statements of Corteva and the notes thereto, each included elsewhere in this information statement, as well as the information contained in the sections of this information statement entitled “Unaudited Pro Forma Consolidated Financial Statements,” “Notes to Unaudited Pro Forma Consolidated Financial Statements,” “Management’s Discussion and Analysis of Financial Condition and Results of Operations of the Seed Business (Supplemental)” and “Business.” The following discussion and analysis includes forward-looking statements. These forward-looking statements are subject to risks, uncertainties and other factors that could cause our actual results to differ materially from those expressed or implied by the forward-looking statements. Factors that could cause or contribute to these differences include, but are not limited to, those discussed elsewhere in this information statement. See in particular the sections of this information statement entitled “Cautionary Statement Concerning Forward-Looking Statements” and “Risk Factors” for further considerations.
For purposes of this “Management’s Discussion and Analysis of Financial Condition and Results of Operations of Corteva” and unless otherwise indicated or the context otherwise requires, “we,” “our,” “us,” "the company," and “Corteva” refer to Corteva, Inc. and its consolidated subsidiaries prior to giving effect to the spin-off.
Basis of Presentation
Irrespective of the legal form of the spin-off in which Vylor (inclusive of the Seed Business) is the legal spinnee in the transaction, Vylor will be treated as the accounting spinnor and, therefore, will be the accounting successor to Corteva subsequent to the spin-off. Corteva’s Crop Protection segment will be presented as being spun-off from Corteva. Vylor has been identified as the accounting spinnor given, among other factors, Vylor’s relative significance to New Corteva. Therefore, the historical financial statements presented herein and in our future filings, with respect to periods prior to the spin-off, will be represented by the historical consolidated financial statements of Corteva, and the pro forma financial statements will present New Corteva as discontinued operations.
Unless otherwise noted, the following is historical financial information of Corteva and does not account for the spin-off. The financial information discussed below and included in this information statement may not be indicative of what the results of operations, financial position and cash flows would have been had Vylor operated as a standalone company during the periods presented, nor do they reflect what the Vylor results of operations, financial position and cash flows may be in the future. See the section of this information statement entitled “Unaudited Pro Forma Consolidated Financial Statements” and “Management’s Discussion and Analysis of Financial Condition and Results of Operations of the Seed Business (Supplemental).”
Priorities
The company believes the following priorities will continue to create significant value for its customers and shareholders over the mid-term:
•Focus on Execution – the company will focus on a value creation framework including: (1) the delivery of top tier technology in our prioritized core markets and crops with a continued focus on differentiation and yield advantage; (2) a continued move towards market share gains in Seed trait out-licensing market; (3) operational improvements focused on driving cost and productivity benefits; and (4) completing the intended separation into two industry-leading public companies in the second half of 2026.
•Deliver Innovation to Farmers, Faster – Corteva aims to deliver greater value and productivity to growers through more differentiated and sustainably advantaged solutions, which in turn promise to strengthen global food security and help farmers address the impacts of climate change.
•Deploy capital with discipline – the company aims to prioritize investment, organic and inorganic growth, and returning cash to shareholders.
Recent Developments
Proposed Separation
On October 1, 2025, the company announced its intent to pursue, subject to the approval of the Board of Directors and any required regulatory approvals, its separation into two independent publicly traded companies - one for each of its Seed and Crop Protection businesses. The transaction is intended to be a tax-free spin-off for U.S. federal income tax purposes.
2026 Restructuring Actions
On March 15, 2026, management of the company approved a restructuring program designed to align the company’s organizational structure and geographic footprint with the operational needs of each function as the company prepares for the intended separation of its businesses (the “2026 Restructuring Actions”). The restructuring actions primarily consist of workforce reductions across commercial and functional support areas and are intended to right‑size the organization and support the future standalone operating models. The restructuring actions are expected to be substantially complete by December 2026.
The company expects to incur aggregate pre‑tax restructuring and asset‑related charges of approximately $70 million to $80 million in connection with the 2026 Restructuring Actions, consisting solely of severance and related benefit costs. Reductions in workforce are subject to local regulatory requirements. For the three months ended March 31, 2026, the company recorded pre‑tax restructuring and asset‑related charges of $78 million, which consist entirely of severance and related benefit costs and are classified as corporate‑related charges. At March 31, 2026, the restructuring liability was $78 million.
The 2026 Restructuring Actions are expected to contribute to the company's ongoing cost and productivity improvement efforts through achieving an estimated $115 million to $125 million of savings on a run rate basis by 2027. See Note 4 - Restructuring and Asset Related Charges - Net, to the interim Consolidated Financial Statements, for further details.
Crop Protection Operations Strategy Restructuring Program
On November 5, 2023, management of the company approved a plan to further optimize its Crop Protection network of manufacturing and external partners (the "Crop Protection Operations Strategy Restructuring Program"). The plan includes the exit of the company’s production activities at its site in Pittsburg, California, as well as ceasing operations in select manufacturing lines at other locations. In October 2024, management of the company amended the Crop Protection Operations Strategy Restructuring Program to include updates to its previous estimates and decommissioning and demolition costs associated with the ceasing of operations, primarily at the Pittsburg, California site. Furthermore, on June 12, 2026, the company disclosed that its management recently committed to the next phase of the plan to include the intended cessation of the company's production activities at its site in Asturias, Spain. The intended cessation is subject to a consultation process with the applicable works council and union representatives at the facility. Management revisions were also made to previous estimates associated with the company's exit of its Pittsburg, California production activities.
The company expects to record aggregate pre-tax restructuring and asset related charges of $750 million to $815 million, comprised of $100 million to $125 million of severance and related benefit costs, $350 million to $372 million of asset-related and impairment charges, and $300 million to $318 million of costs related to exiting the company's production activities and ceasing operations (inclusive of decommissioning and demolition costs and contract terminations). Decommissioning and demolition costs are expensed on an as-incurred basis. Reductions in workforce are subject to local regulatory requirements. Through the year ended December 31, 2025, the company recorded net pre-tax restructuring and asset related charges of $611 million inception-to-date under the Crop Protection Operations Strategy Restructuring Program, consisting of $102 million of severance and related benefit costs, $340 million of asset-related and impairment charges, $70 million of decommissioning and demolition costs and $99 million of costs related to contract terminations. Through the first quarter of 2026, the company recorded net pre-tax restructuring and asset related charges of $625 million inception-to-date under the Crop Protection Operations Strategy Restructuring Program, consisting of $102 million of severance and related benefit costs, $340 million of asset related and impairment charges, $82 million of decommissioning and demolition costs, and $101 million of costs related to contract terminations.
Cash payments related to these charges are anticipated to be $400 million to $443 million, which primarily relate to the payment of severance and related benefits, decommissioning and demolition costs and contract terminations. Through December 31, 2025, the company paid $177 million associated with these charges. Through the first quarter of 2026, the company paid $228 million associated with these charges. The restructuring actions associated with these charges are expected to be substantially complete by the end of 2028.
The Crop Protection Operations Strategy Restructuring Program is expected to contribute to the company’s ongoing cost and productivity improvement efforts through achieving an estimated $180 million of savings on a run rate basis by 2027. Future actions by the company or changes in circumstances from current assumptions, including any site disposition gains or losses, may cause actual results and future cash payments to differ. See Note 5 - Restructuring and Asset Related Charges - Net, to the Corteva Consolidated Financial Statements, for additional information.
Overview - Three months ended March 31, 2026
The following is a summary of results from continuing operations for the three months ended March 31, 2026:
•The company reported net sales of $4,905 million, up 11 percent versus the same quarter last year, reflecting a 6 percent increase in volume, a 4 percent favorable impact from currency and a 1 percent increase in price.
•Cost of goods sold totaled $2,372 million in the first quarter of 2026, up from $2,342 million in the first quarter of 2025, which was driven by volume growth, with a partial offset from net cost and productivity benefits and net royalty improvement.
•Restructuring and asset related charges - net were $92 million in the first quarter of 2026, an increase from $22 million in the first quarter of 2025. The charges for the three months ended March 31, 2026 were primarily comprised of severance and related benefit costs associated with the 2026 Restructuring Actions, and contract termination charges and decommissioning and demolition costs associated with the Crop Protection Operations Strategy Restructuring Program.
•Income (loss) from continuing operations after income taxes was $725 million, as compared to $667 million in the same quarter last year.
•Operating EBITDA was $1,438 million for the three months ended March 31, 2026, up from $1,189 million for the three months ended March 31, 2025, primarily driven by volume growth, pricing gains, net cost and productivity benefits, net royalty improvement and favorable currency effects, partially offset by higher selling expense and higher compensation. Refer to the company's non-GAAP financial measures for further discussion.
In addition to the financial highlights above, the following event occurred during the three months ended March 31, 2026:
•The company returned approximately $370 million to shareholders during the three months ended March 31, 2026 under its previously announced share repurchase programs and through common stock dividends.
Results of Operations - Three months ended March 31, 2026 and 2025
Net Sales
Net sales were $4,905 million and $4,417 million for the three months ended March 31, 2026 and 2025, respectively. The increase was primarily driven by a 6 percent increase in volume, a 4 percent favorable impact from currency and a 1 percent increase in price.
Improvements in volume, with gains in all regions, were driven by Crop Protection due to strong demand for new products, while Seed experienced volume growth in North America from seasonal timing shifts in seed deliveries. The improvement in pricing, led by Seed, was driven by favorable product mix and continued execution on the company's price for value strategy, while a decline in Crop Protection pricing due to competitive market dynamics in Latin America served as an offset. The favorable currency impacts were led by the Euro and Brazilian Real.
|
|
|
|
|
|
|
|
|
|
|
|
|
|
|
|
|
|
|
|
Three Months Ended March 31, |
|
|
2026 |
|
2025 |
|
|
Net Sales
($ Millions) |
|
% |
|
Net Sales
($ Millions) |
|
% |
|
Worldwide |
|
$ |
|
4,905 |
|
|
|
100 |
% |
|
$ |
|
4,417 |
|
|
|
100 |
% |
North America 1 |
|
|
|
2,439 |
|
|
|
50 |
% |
|
|
|
2,210 |
|
|
|
50 |
% |
EMEA 2 |
|
|
|
1,655 |
|
|
|
34 |
% |
|
|
|
1,477 |
|
|
|
33 |
% |
Latin America |
|
|
|
506 |
|
|
|
10 |
% |
|
|
|
442 |
|
|
|
10 |
% |
Asia Pacific |
|
|
|
305 |
|
|
|
6 |
% |
|
|
|
288 |
|
|
|
7 |
% |
|
|
|
|
|
|
|
|
|
|
|
|
|
|
|
|
|
|
|
|
|
|
|
|
|
|
|
Q1 2026 vs. Q1 2025 |
|
Percent Change Due To: |
|
($ In millions) |
Net Sales Change |
|
Price & |
|
|
|
|
|
|
Portfolio / |
|
|
$ |
|
% |
|
Product Mix |
|
Volume |
|
Currency |
|
Other |
|
North America 1 |
|
$ |
|
229 |
|
|
|
10 |
% |
|
|
1 |
% |
|
|
9 |
% |
|
|
— |
% |
|
|
— |
% |
EMEA 2 |
|
|
|
178 |
|
|
|
12 |
% |
|
|
2 |
% |
|
|
2 |
% |
|
|
8 |
% |
|
|
— |
% |
Latin America |
|
|
|
64 |
|
|
|
14 |
% |
|
|
(2 |
)% |
|
|
6 |
% |
|
|
10 |
% |
|
|
— |
% |
Asia Pacific |
|
|
|
17 |
|
|
|
6 |
% |
|
|
1 |
% |
|
|
4 |
% |
|
|
1 |
% |
|
|
— |
% |
Total |
|
$ |
|
488 |
|
|
|
11 |
% |
|
|
1 |
% |
|
|
6 |
% |
|
|
4 |
% |
|
|
— |
% |
1.Represents U.S. & Canada
2.Europe, Middle East and Africa ("'EMEA")
Cost of Goods Sold (“COGS”)
COGS was $2,372 million (48 percent of net sales) and $2,342 million (53 percent of net sales) for the three months ended March 31, 2026 and 2025, respectively, which was driven by volume growth, with a partial offset from lower input costs and net cost and productivity benefits.
Research and Development Expense (“R&D”)
R&D expense was $341 million (7 percent of net sales) and $335 million (8 percent of net sales) for the three months ended March 31, 2026 and 2025, respectively. The increase in R&D expense is in support of the company's long-term investment plans and was primarily driven by unfavorable currency impacts and increases in salaries, depreciation, and field, lab and facilities costs, partially offset by cost recoveries received from third parties.
Selling, General and Administrative Expenses (“SG&A”)
SG&A expenses were $877 million (18 percent of net sales) and $751 million (17 percent of net sales) for the three months ended March 31, 2026 and 2025, respectively. The change was primarily driven by unfavorable currency impacts and an increase in bad debt expense, variable compensation, commissions, consulting fees, and personnel and information technology costs.
Amortization of Intangibles
Intangible asset amortization was $160 million and $162 million for the three months ended March 31, 2026 and 2025, respectively. See Note 10 - Other Intangible Assets, to the interim Consolidated Financial Statements, for additional information.
Restructuring and Asset Related Charges - Net
Restructuring and asset related charges - net were $92 million and $22 million for the three months ended March 31, 2026 and 2025, respectively. The charges in the first quarter of 2026 primarily relate to severance and related benefits costs associated with the 2026 Restructuring Actions, and contract termination charges and decommissioning and demolition costs associated with the Crop Protection Operations Strategy Restructuring Program. The charges in the first quarter of 2025 primarily relate to charges associated with the Crop Protection Operations Strategy Restructuring Program, consisting of severance and related benefit costs, asset related charges, and decommissioning and demolition costs.
See Note 4 - Restructuring and Asset Related Charges - Net, to the interim Consolidated Financial Statements, for additional information.
Other Income (Expense) - Net
Other income (expense) - net was $(117) million and $15 million for the three months ended March 31, 2026 and 2025, respectively. Higher other expense was driven by an increase in net exchange losses compared to prior year and higher miscellaneous expenses, which are largely driven by a settlement charge associated with the Crop Protection loyalty program multi-district litigation plaintiffs and tax expense related to intellectual property realignment.
See Note 5 - Supplementary Information, to the interim Consolidated Financial Statements, for additional information.
Interest Expense
Interest expense was $36 million and $36 million for the three months ended March 31, 2026 and 2025, respectively. The results reflect lower short-term borrowings offset by higher interest for long-term debt.
Provision for (Benefit from) Income Taxes on Continuing Operations
The company’s provision for income taxes on continuing operations was $133 million for the three months ended March 31, 2026 on pre-tax income from continuing operations of $858 million, resulting in an effective tax rate of 15.5 percent. The effective tax rate was favorably impacted by $35 million of net tax benefits related to intellectual property realignment, as well as $47 million of net tax benefits associated with changes in deferred taxes and accruals for certain prior year tax positions. Those favorable impacts were partially offset by withholding taxes on repatriation of cash held outside of the U.S. primarily from current year earnings.
The company's provision for income taxes on continuing operations was $117 million for the three months ended March 31, 2025 on pre-tax income from continuing operations of $784 million, resulting in an effective tax rate of 14.9 percent. The effective tax rate was favorably impacted by a $55 million deferred tax benefit associated with a change in a legal entity’s U.S. tax characterization, as well as net tax benefits associated with changes in accruals for certain prior year tax positions. Those favorable impacts were partially offset by withholding taxes on repatriation of cash held outside of the U.S. primarily from current year earnings.
Income (Loss) from Discontinued Operations After Tax
Income (loss) from discontinued operations after tax was $(2) million and $(11) million for the three months ended March 31, 2026 and 2025, respectively. The after-tax charge for the three months ended March 31, 2026 and 2025 was driven by charges recognized relating to the MOU with Chemours and DuPont, relating to PFAS environmental remediation activities primarily at Chemours' Fayetteville Works facility, along with other environmental matters.
Refer to Note 12 - Commitments and Contingent Liabilities, to the interim Consolidated Financial Statements, for additional information.
Recent Accounting Pronouncements - Three months ended March 31, 2026 and 2025
See Note 2 - Recent Accounting Guidance, to the interim Consolidated Financial Statements, for a description of recent accounting pronouncements.
Segment Reviews - Three months ended March 31, 2026 and 2025
The company operates in two reportable segments: Seed and Crop Protection.
Seed
The company’s Seed segment is a global leader in developing and supplying commercial seed combining superior germplasm with advanced traits to produce high yield potential for farmers around the world. The segment offers seed and trait technologies that improve resistance to weather, diseases, pests and herbicides used to manage weeds. Its digital solutions provide data driven insights that assist farmer decision-making with a view to optimize product selection and, ultimately, help maximize yield and profitability. The segment competes in a wide variety of agricultural markets.
Crop Protection
The Crop Protection segment serves the global agricultural input industry with products that protect against weeds, insects and other pests, and disease, and that improve overall crop health both above and below ground via nitrogen management and seed-applied technologies. The segment offers crop protection solutions and digital solutions that provide farmers the tools they need to improve productivity and profitability, and help keep fields free of weeds, insects and diseases. The segment is a leader in global herbicides, insecticides, nitrogen stabilizers, pasture and range management herbicides and biologicals.
Summarized below are comments on individual segment net sales and segment operating EBITDA for the three months ended March 31, 2026, compared with the same period in 2025. The company defines segment operating EBITDA as earnings (loss) (i.e., income (loss) from continuing operations before income taxes) before interest, depreciation, amortization, corporate expenses, non-operating benefits (costs), foreign exchange gains (losses), and net unrealized gain or loss from mark-to-market activity for certain foreign currency derivative instruments that do not qualify for hedge accounting, excluding the impact of significant items and separation costs. Non-operating benefits (costs) consists of non-operating pension and OPEB credits (costs), tax indemnification adjustments and environmental remediation and legal costs associated with legacy businesses and sites. Tax indemnification adjustments relate to changes in indemnification balances, as a result of the application of the terms of the Tax Matters Agreement, between Corteva and Dow and/or DuPont that are recorded by the company as pre-tax income or expense. See Note 17 - Segment Information, to the interim Consolidated Financial Statements, for details related to significant pre-tax benefits (charges) excluded from segment operating EBITDA. All references to prices are based on local price unless otherwise specified.
A reconciliation of segment operating EBITDA to income (loss) from continuing operations after income taxes for the three months ended March 31, 2026 and 2025 is included in Note 17 - Segment Information, to the interim Consolidated Financial Statements.
|
|
|
|
|
|
|
|
|
Seed |
Three Months Ended March 31, |
|
(In millions) |
2026 |
|
2025 |
|
Net sales |
|
$ |
3,023 |
|
|
$ |
2,707 |
|
Segment operating EBITDA |
|
$ |
1,034 |
|
|
$ |
842 |
|
|
|
|
|
|
|
|
|
|
|
|
|
|
|
|
|
|
|
|
|
|
|
|
|
|
|
Seed |
Q1 2026 vs. Q1 2025 |
|
Percent Change Due To: |
|
|
Net Sales Change |
|
Price & |
|
|
|
|
|
|
Portfolio / |
|
($ In millions) |
$ |
|
% |
|
Product Mix |
|
Volume |
|
Currency |
|
Other |
|
North America |
|
$ |
|
173 |
|
|
|
11 |
% |
|
|
2 |
% |
|
|
9 |
% |
|
|
— |
% |
|
|
— |
% |
EMEA |
|
|
|
102 |
|
|
|
12 |
% |
|
|
4 |
% |
|
|
1 |
% |
|
|
7 |
% |
|
|
— |
% |
Latin America |
|
|
|
39 |
|
|
|
21 |
% |
|
|
8 |
% |
|
|
— |
% |
|
|
13 |
% |
|
|
— |
% |
Asia Pacific |
|
|
|
2 |
|
|
|
2 |
% |
|
|
7 |
% |
|
|
(3 |
)% |
|
|
(2 |
)% |
|
|
— |
% |
Total |
|
$ |
|
316 |
|
|
|
12 |
% |
|
|
3 |
% |
|
|
6 |
% |
|
|
3 |
% |
|
|
— |
% |
|
|
|
|
|
|
|
|
|
|
|
|
|
|
|
|
|
|
|
|
|
|
|
|
|
|
Seed |
Q1 2026 vs. Q1 2025 |
|
Percent Change Due To: |
|
|
Net Sales Change |
|
Price & |
|
|
|
|
|
|
Portfolio / |
|
($ In millions) |
$ |
|
% |
|
Product Mix |
|
Volume |
|
Currency |
|
Other |
|
Corn |
|
$ |
|
304 |
|
|
|
15 |
% |
|
|
4 |
% |
|
|
7 |
% |
|
|
4 |
% |
|
|
— |
% |
Soybeans |
|
|
|
1 |
|
|
|
— |
% |
|
|
1 |
% |
|
|
(2 |
)% |
|
|
1 |
% |
|
|
— |
% |
Other oilseeds |
|
|
|
22 |
|
|
|
10 |
% |
|
|
5 |
% |
|
|
1 |
% |
|
|
4 |
% |
|
|
— |
% |
Other |
|
|
|
(11 |
) |
|
|
(10 |
)% |
|
|
(10 |
)% |
|
|
(3 |
)% |
|
|
3 |
% |
|
|
— |
% |
Total |
|
$ |
|
316 |
|
|
|
12 |
% |
|
|
3 |
% |
|
|
6 |
% |
|
|
3 |
% |
|
|
— |
% |
Seed
Seed net sales were $3,023 million in the first quarter of 2026, up 12 percent from $2,707 million in the first quarter of 2025. The sales increase over the prior period was driven by a 6 percent increase in volume, a 3 percent increase in price, and a 3 percent favorable impact from currency.
Price gains in all regions demonstrate demand for top technology and the strength of the portfolio. Volume increases in North America and EMEA are due to timing shifts and favorable weather in the northern hemisphere. Favorable currency impacts were led by the Euro.
Segment operating EBITDA was $1,034 million in the first quarter of 2026, up 23 percent from $842 million in first quarter of 2025. Volume, price execution, net cost and productivity benefits, and net royalty improvement more than offset higher selling expense and compensation. Segment operating EBITDA margin improved by approximately 310 basis points versus the prior-year period.
|
|
|
|
|
|
|
|
|
Crop Protection |
Three Months Ended March 31, |
|
(In millions) |
2026 |
|
2025 |
|
Net sales |
|
$ |
1,882 |
|
|
$ |
1,710 |
|
Segment Operating EBITDA |
|
$ |
434 |
|
|
$ |
377 |
|
|
|
|
|
|
|
|
|
|
|
|
|
|
|
|
|
|
|
|
|
|
|
|
|
|
|
Crop Protection |
|
Q1 2026 vs. Q1 2025 |
|
Percent Change Due To: |
|
|
Net Sales Change |
|
Price & |
|
|
|
|
|
|
Portfolio / |
|
($ In millions) |
$ |
|
% |
|
Product Mix |
|
Volume |
|
Currency |
|
Other |
|
North America |
|
$ |
|
56 |
|
|
|
9 |
% |
|
|
— |
% |
|
|
8 |
% |
|
|
1 |
% |
|
|
— |
% |
EMEA |
|
|
|
76 |
|
|
|
12 |
% |
|
|
(1 |
)% |
|
|
3 |
% |
|
|
10 |
% |
|
|
— |
% |
Latin America |
|
|
|
25 |
|
|
|
10 |
% |
|
|
(9 |
)% |
|
|
10 |
% |
|
|
9 |
% |
|
|
— |
% |
Asia Pacific |
|
|
|
15 |
|
|
|
8 |
% |
|
|
(3 |
)% |
|
|
9 |
% |
|
|
2 |
% |
|
|
— |
% |
Total |
|
$ |
|
172 |
|
|
|
10 |
% |
|
|
(2 |
)% |
|
|
6 |
% |
|
|
6 |
% |
|
|
— |
% |
|
|
|
|
|
|
|
|
|
|
|
|
|
|
|
|
|
|
|
|
|
|
|
|
|
|
Crop Protection |
|
Q1 2026 vs. Q1 2025 |
|
Percent Change Due To: |
|
|
Net Sales Change |
|
Price & |
|
|
|
|
|
|
Portfolio / |
|
($ In millions) |
$ |
|
% |
|
Product Mix |
|
Volume |
|
Currency |
|
Other |
|
Herbicides |
|
$ |
|
167 |
|
|
|
19 |
% |
|
|
(1 |
)% |
|
|
14 |
% |
|
|
6 |
% |
|
|
— |
% |
Insecticides |
|
|
|
41 |
|
|
|
12 |
% |
|
|
(3 |
)% |
|
|
11 |
% |
|
|
4 |
% |
|
|
— |
% |
Fungicides |
|
|
|
30 |
|
|
|
10 |
% |
|
|
(1 |
)% |
|
|
3 |
% |
|
|
8 |
% |
|
|
— |
% |
Biologicals |
|
|
|
(14 |
) |
|
|
(17 |
)% |
|
|
(4 |
)% |
|
|
(17 |
)% |
|
|
4 |
% |
|
|
— |
% |
Other |
|
|
|
(52 |
) |
|
|
(41 |
)% |
|
|
(2 |
)% |
|
|
(36 |
)% |
|
|
(3 |
)% |
|
|
— |
% |
Total |
|
$ |
|
172 |
|
|
|
10 |
% |
|
|
(2 |
)% |
|
|
6 |
% |
|
|
6 |
% |
|
|
— |
% |
Crop Protection
Crop Protection net sales were $1,882 million in the first quarter of 2026, up 10 percent from $1,710 million in the first quarter of 2025. The sales increase over the prior period was driven by a 6 percent increase in volume and a 6 percent favorable impact from currency, partially offset by a 2 percent decrease in price.
Volume improvement was driven by demand for new products and spinosyns, coupled with timing shifts in North America and EMEA. Price declines, primarily in Latin America and Asia Pacific, are due to continued competitive market dynamics in those regions. Favorable currency impacts were led by the Euro and Brazilian Real..
Segment operating EBITDA was $434 million in the first quarter of 2026, up 15 percent from $377 million in the first quarter of 2025. Volume growth, productivity savings, and favorable currency more than offset price pressure, higher selling expense and a charge related to intellectual property realignment. Segment operating EBITDA margin improved by approximately 100 basis points versus the prior-year period.
Non-GAAP Financial Measures - Three months ended March 31, 2026 and 2025
The company presents certain financial measures that do not conform to U.S. GAAP and are considered non-GAAP measures. These measures include Operating EBITDA and operating earnings (loss) per share. Management uses these measures internally for planning and forecasting, including allocating resources and evaluating incentive compensation. Management believes that these non-GAAP measures best reflect the ongoing performance of the company during the periods presented and provide more relevant and meaningful information to investors as they provide insight with respect to ongoing operating results of the company and a more useful comparison of year over year results. These non-GAAP measures supplement the company’s U.S. GAAP disclosures and should not be viewed as an alternative to U.S. GAAP measures of performance. Furthermore, such non-GAAP measures may not be consistent with similar measures provided or used by other companies. Reconciliations for these non-GAAP measures to U.S. GAAP are provided below.
Operating EBITDA is defined as earnings (loss) (i.e., income (loss) from continuing operations before income taxes) before interest, depreciation, amortization, non-operating benefits (costs), foreign exchange gains (losses), and net unrealized gain or loss from mark-to-market activity for certain foreign currency derivative instruments that do not qualify for hedge accounting, excluding the impact of significant items and separation costs. Non-operating benefits (costs) consists of non-operating pension and OPEB credits (costs), tax indemnification adjustments and environmental remediation and legal costs associated with legacy businesses and sites. Tax indemnification adjustments relate to changes in indemnification balances, as a result of the application of the terms of the Tax Matters Agreement, between Corteva and Dow and/or DuPont that are recorded by the company as pre-tax income or expense. Operating earnings (loss) per share is defined as “earnings (loss) per common share from continuing operations - diluted” excluding the after-tax impact of significant items, the after-tax impact of separation costs, the after-tax impact of non-operating benefits (costs), the after-tax impact of amortization expense associated with intangible assets existing as of the Corteva Separation from DowDuPont, and the after-tax impact of net unrealized gain or loss from mark-to-market activity for certain foreign currency derivative instruments that do not qualify for hedge accounting. Although amortization of the company's intangible assets is excluded from these non-GAAP measures, management believes it is important for investors to understand that such intangible assets contribute to revenue generation. Amortization of intangible assets that relate to past acquisitions will recur in future periods until such intangible assets have been fully amortized. Any future acquisitions may result in amortization of additional intangible assets. Net unrealized gain or loss from mark-to-market activity for certain foreign currency derivative instruments that do not qualify for hedge accounting represents the non-cash net gain (loss) from changes in fair value of certain undesignated foreign currency derivative contracts. Upon settlement, which is within the same calendar year of execution of the contract, the realized gain (loss) from the changes in fair value of the non-qualified foreign currency derivative contracts will be reported in the relevant non-GAAP financial measures, allowing quarterly results to reflect the economic effects of the foreign currency derivative contracts without the resulting unrealized mark to fair value volatility.
The company also uses Free Cash Flow as a non-GAAP measure to evaluate and discuss its liquidity position and ability to generate cash. Free Cash Flow is defined as cash provided by (used for) operating activities – continuing operations, less capital expenditures. Management believes that Free Cash Flow provides investors with meaningful information regarding the company’s ongoing ability to generate cash through core operations, and the company’s ability to service its indebtedness, pay dividends (when declared), make share repurchases, and meet its ongoing cash needs for its operations.
Reconciliation of Income (Loss) from Continuing Operations after Income Taxes to Operating EBITDA
|
|
|
|
|
|
|
|
|
|
Three Months Ended March 31, |
|
(In millions) |
2026 |
|
2025 |
|
Income (loss) from continuing operations after income taxes (GAAP) |
|
$ |
725 |
|
|
$ |
667 |
|
Provision for (benefit from) income taxes on continuing operations |
|
|
133 |
|
|
|
117 |
|
Income (loss) from continuing operations before income taxes (GAAP) |
|
$ |
858 |
|
|
$ |
784 |
|
Depreciation and amortization |
|
|
297 |
|
|
|
296 |
|
Interest income |
|
|
(34 |
) |
|
|
(32 |
) |
Interest expense |
|
|
36 |
|
|
|
36 |
|
Exchange (gains) losses - net |
|
|
67 |
|
|
|
27 |
|
Non-operating (benefits) costs - net |
|
|
(18 |
) |
|
|
10 |
|
Mark-to-market (gains) losses on certain foreign currency contracts not designated as hedges |
|
|
3 |
|
|
|
9 |
|
Significant items (benefit) charge |
|
|
177 |
|
|
|
59 |
|
Separation costs |
|
|
52 |
|
|
|
— |
|
Operating EBITDA (Non-GAAP) |
|
$ |
1,438 |
|
|
$ |
1,189 |
|
Significant Items
|
|
|
|
|
|
|
|
|
|
Three Months Ended March 31, |
|
(In millions) |
2026 |
|
2025 |
|
Restructuring and asset related charges - net |
|
$ |
(92 |
) |
|
$ |
(22 |
) |
Litigation settlement 1 |
|
|
(85 |
) |
|
|
— |
|
AltEn facility remediation charges 2 |
|
|
— |
|
|
|
(37 |
) |
Total pre-tax significant items benefit (charge) |
|
$ |
(177 |
) |
|
$ |
(59 |
) |
Total tax (provision) benefit impact of significant items 3 |
|
|
42 |
|
|
|
14 |
|
Tax only significant item benefit (charge) 4 |
|
|
— |
|
|
|
55 |
|
Total significant items benefit (charge), after tax |
|
$ |
(135 |
) |
|
$ |
10 |
|
1.Relates to a settlement charge associated with the Crop Protection loyalty program multi-district litigation plaintiffs. See Note 12 - Commitments and Contingent Liabilities, to the interim Consolidated Financial Statements, for additional information.
2.Relates to a charge to increase the remediation accrual at the AltEn facility relating to Corteva's estimated voluntary contribution to the solid waste and wastewater remedial action plans. See Note 12 - Commitments and Contingent Liabilities, to the interim Consolidated Financial Statements, for additional information.
3.Unless specifically addressed above, the income tax effect on significant items was calculated based upon the enacted tax laws and statutory income tax rates applicable in the tax jurisdiction(s) of the underlying non-GAAP adjustment.
4.The tax only significant item benefit for the three months ended March 31, 2025 reflects a deferred tax benefit associated with a change in a legal entity's U.S. tax characterization.
Reconciliation of Income (Loss) from Continuing Operations Attributable to Corteva and Earnings (Loss) Per Share of Common Stock from Continuing Operations - Diluted to Operating Earnings (Loss) and Operating Earnings (Loss) Per Share
|
|
|
|
|
|
|
|
|
|
Three Months Ended March 31, |
|
(In millions) |
2026 |
|
2025 |
|
Income (loss) from continuing operations attributable to Corteva common stockholders (GAAP) |
|
$ |
722 |
|
|
$ |
663 |
|
Less: Non-operating benefits (costs), after tax |
|
|
(1 |
) |
|
|
(8 |
) |
Less: Amortization of intangibles (existing as of Corteva Separation), after tax |
|
|
(106 |
) |
|
|
(109 |
) |
Less: Mark-to-market gains (losses) on certain foreign currency contracts not designated as hedges, after tax |
|
|
(3 |
) |
|
|
(7 |
) |
Less: Significant items benefit (charge), after tax |
|
|
(135 |
) |
|
|
10 |
|
Less: Separation costs, after tax |
|
|
(42 |
) |
|
|
— |
|
Operating Earnings (Loss) (Non-GAAP) |
|
$ |
1,009 |
|
|
$ |
777 |
|
|
|
|
|
|
|
|
|
|
|
Three Months Ended March 31, |
|
|
2026 |
|
2025 |
|
Earnings (loss) per share of common stock from continuing operations attributable to Corteva common stockholders - diluted (GAAP) |
|
$ |
1.07 |
|
|
$ |
0.97 |
|
Less: Non-operating benefits (costs), after tax |
|
|
— |
|
|
|
(0.01 |
) |
Less: Amortization of intangibles (existing as of Corteva Separation), after tax |
|
|
(0.16 |
) |
|
|
(0.16 |
) |
Less: Mark-to-market gains (losses) on certain foreign currency contracts not designated as hedges, after tax |
|
|
(0.01 |
) |
|
|
(0.01 |
) |
Less: Significant items benefit (charge), after tax |
|
|
(0.20 |
) |
|
|
0.02 |
|
Less: Separation costs, after tax |
|
|
(0.06 |
) |
|
|
— |
|
Operating Earnings (Loss) Per Share (Non-GAAP) |
|
$ |
1.50 |
|
|
$ |
1.13 |
|
Diluted Shares Outstanding (In millions) |
|
|
673.6 |
|
|
|
686.6 |
|
Overview - Year ended December 31, 2025
The following is a summary of results from continuing operations for the year ended December 31, 2025:
•The company reported net sales of $17,401 million, an increase of 3 percent versus the year ended December 31, 2024, reflecting a 1 percent increase in price and a 3 percent increase in volume, partially offset by a 1 percent unfavorable currency impact.
•Cost of goods sold ("COGS") totaled $9,172 million, down from $9,529 million for the year ended December 31, 2024, primarily driven by ongoing cost and productivity actions, raw material deflation, lower commodity prices, and a reduction in net royalty expense, with a partial offset from higher volumes.
•Restructuring and asset related charges - net were $146 million, a decrease from $288 million for the year ended December 31, 2024. The charges for the year ended December 31, 2025 primarily relate to asset related charges, severance and related benefit costs, contract termination charges, and decommissioning and demolition costs associated with the Crop Protection Operations Strategy Restructuring Program.
•Income from continuing operations after income taxes was $1,204 million, as compared to $863 million for the year ended December 31, 2024.
•Operating EBITDA was $3,848 million, up from $3,376 million for the year ended December 31, 2024, primarily driven by volume growth, favorable Seed price and product mix, ongoing cost and productivity benefits and net royalty improvement, partially offset by continued investment in research and development, additional commissions and compensation expense, competitive Crop Protection pricing and unfavorable currency effects. See page 79 for further discussion of the company's Non-GAAP financial measures.
In addition to the financial highlights above, the following events occurred during the year ended December 31, 2025:
•The company returned approximately $1.5 billion to shareholders during the year ended December 31, 2025 under its previously announced share repurchase programs and through common stock dividends.
•On July 29, 2025, the company's Board of Directors approved an approximately 6 percent increase in the quarterly common stock dividend from $0.17 per share to $0.18 per share.
Results of Operations - Years ended December 31, 2025, 2024, and 2023
Net Sales
|
|
|
|
|
|
|
|
|
|
|
|
|
|
For the Year Ended December 31, |
|
(In millions) |
2025 |
|
2024 |
|
2023 |
|
Net sales |
|
$ |
17,401 |
|
|
$ |
16,908 |
|
|
$ |
17,226 |
|
2025 versus 2024
Net sales were $17,401 million for the year ended December 31, 2025, compared to $16,908 million for the year ended December 31, 2024. The increase was primarily driven by a 1 percent increase in price and a 3 percent increase in volume, partially offset by a 1 percent unfavorable currency impact. Improvements in Crop Protection volume were driven by demand for new products and biologicals, while Seed experienced volume growth primarily due to increased corn area in North America and Brazil. Pricing improvements were driven by Seed, led by North America and EMEA with continued execution on the company's price for value strategy, partially offset by a decline in Crop Protection pricing primarily due to the market dynamics in Latin America. The unfavorable currency impacts were led by the Canadian Dollar and Turkish Lira.
2024 versus 2023
Net sales were $16,908 million for the year ended December 31, 2024, compared to $17,226 million for the year ended December 31, 2023. The decrease was primarily driven by a 1 percent decrease in price and a 3 percent unfavorable currency impact, partially offset by a 2 percent increase in volume. Lower pricing reflects the continued competitive price environment in Crop Protection, particularly in Latin America, partially offset by improvement in Seed pricing driven by strong demand for top technology offerings and operational execution globally. Crop Protection volume growth was the result of demand recovery in Latin America and growth of new products. Seed volume growth was driven by the expected recovery in Brazil Safrinha corn and North America soybeans and cotton, which more than offset corn area reduction and challenges in other geographies. The unfavorable currency impacts were led by the Brazilian Real and Turkish Lira.
|
|
|
|
|
|
|
|
|
|
|
|
|
|
|
|
|
For the Year Ended December 31, |
($ In millions) |
2025 |
2024 |
2023 |
|
Net Sales |
% of Net Sales |
Net Sales |
% of Net Sales |
Net Sales |
% of Net Sales |
Worldwide |
|
$ |
17,401 |
|
100 % |
|
$ |
16,908 |
|
100 % |
|
$ |
17,226 |
|
100 % |
North America |
|
|
9,024 |
|
52 % |
|
|
8,660 |
|
51 % |
|
|
8,590 |
|
50 % |
EMEA |
|
|
3,110 |
|
18 % |
|
|
3,124 |
|
19 % |
|
|
3,367 |
|
19 % |
Latin America |
|
|
3,928 |
|
22 % |
|
|
3,776 |
|
22 % |
|
|
3,906 |
|
23 % |
Asia Pacific |
|
|
1,339 |
|
8 % |
|
|
1,348 |
|
8 % |
|
|
1,363 |
|
8 % |
|
|
|
|
|
|
|
|
|
|
|
|
|
|
|
Year Ended December 31, 2025 vs. 2024 |
Percent Change Due To: |
($ In millions) |
Net Sales Change |
Price & |
|
|
|
Portfolio / |
|
$ |
% |
Product Mix |
Volume |
Currency |
Other |
North America |
|
$ |
364 |
|
4 % |
|
2 % |
|
3 % |
|
(1)% |
|
— % |
EMEA |
|
|
(14) |
|
— % |
|
2 % |
|
— % |
|
(2)% |
|
— % |
Latin America |
|
|
152 |
|
4 % |
|
(3)% |
|
7 % |
|
— % |
|
— % |
Asia Pacific |
|
|
(9) |
|
(1)% |
|
2 % |
|
— % |
|
(2)% |
|
(1)% |
Total |
|
$ |
493 |
|
3 % |
|
1 % |
|
3 % |
|
(1)% |
|
— % |
|
|
|
|
|
|
|
|
|
|
|
|
|
|
|
Year Ended December 31, 2024 vs. 2023 |
Percent Change Due To: |
|
Net Sales Change |
Price & |
|
|
|
Portfolio / |
($ In millions) |
$ |
% |
Product Mix |
Volume |
Currency |
Other |
North America |
|
$ |
70 |
|
1 % |
|
1 % |
|
— % |
|
— % |
|
— % |
EMEA |
|
|
(243) |
|
(7)% |
|
5 % |
|
(7)% |
|
(3)% |
|
(2)% |
Latin America |
|
|
(130) |
|
(3)% |
|
(12)% |
|
16 % |
|
(8)% |
|
1 % |
Asia Pacific |
|
|
(15) |
|
(1)% |
|
2 % |
|
(1)% |
|
(2)% |
|
— % |
Total |
|
$ |
(318) |
|
(2)% |
|
(1)% |
|
2 % |
|
(3)% |
|
— % |
Cost of Goods Sold ("COGS")
|
|
|
|
|
|
|
|
|
|
|
|
|
|
For the Year Ended December 31, |
|
(In millions) |
2025 |
|
2024 |
|
2023 |
|
Cost of goods sold |
|
$ |
9,172 |
|
|
$ |
9,529 |
|
|
$ |
9,920 |
|
2025 versus 2024
COGS was $9,172 million (53 percent of net sales) for the year ended December 31, 2025 compared to $9,529 million (56 percent of net sales) for the year ended December 31, 2024. The decrease was primarily driven by ongoing cost and productivity actions, a reduction in net royalty expense, lower commodity prices and raw material deflation, with a partial offset from higher volumes.
2024 versus 2023
COGS was $9,529 million (56 percent of net sales) for the year ended December 31, 2024 compared to $9,920 million (58 percent of net sales) for the year ended December 31, 2023. The decrease was primarily driven by favorable currency effects, ongoing cost and productivity actions, Crop Protection raw material deflation, and a reduction in net royalty expense, partially offset by an increase in volumes and higher commodity costs.
Research and Development Expense ("R&D")
|
|
|
|
|
|
|
|
|
|
|
|
|
|
For the Year Ended December 31, |
|
(In millions) |
2025 |
|
2024 |
|
2023 |
|
Research and development expense |
|
$ |
1,474 |
|
|
$ |
1,402 |
|
|
$ |
1,337 |
|
2025 versus 2024
R&D expense was $1,474 million (8 percent of net sales) for the year ended December 31, 2025 and $1,402 million (8 percent of net sales) for the year ended December 31, 2024. The increase in R&D expense is in support of the company's long-term growth plans and was primarily driven by higher employee compensation costs due to variable compensation increases, as well as higher contractor, consulting and field, lab and facilities costs.
2024 versus 2023
R&D expense was $1,402 million (8 percent of net sales) for the year ended December 31, 2024 and $1,337 million (8 percent of net sales) for the year ended December 31, 2023. The increase in R&D expense is in support of the company’s long-term growth plans and was primarily driven by an increase in salaries due to higher headcount, variable compensation and contractor costs, partially offset by favorable currency impacts.
Selling, General and Administrative Expenses ("SG&A")
|
|
|
|
|
|
|
|
|
|
|
|
|
|
For the Year Ended December 31, |
|
(In millions) |
2025 |
|
2024 |
|
2023 |
|
Selling, general and administrative expenses |
|
$ |
3,492 |
|
|
$ |
3,196 |
|
|
$ |
3,176 |
|
2025 versus 2024
SG&A expenses were $3,492 million (20 percent of net sales) for the year ended December 31, 2025 and $3,196 million (19 percent of net sales) for the year ended December 31, 2024. The increase was primarily driven by an increase in commissions, variable
compensation, bad debt expense, legal support fees and personnel and information technology costs, partially offset by favorable currency impacts.
2024 versus 2023
SG&A expenses were $3,196 million (19 percent of net sales) for the year ended December 31, 2024 and $3,176 million (18 percent of net sales) for the year ended December 31, 2023. The increase was primarily driven by an increase in salaries and variable compensation, commissions, bad debt expense, legal support fees and portfolio impact from the Stoller and Symborg acquisitions, partially offset by favorable currency impacts and lower consulting and professional fees and marketing costs.
Amortization of Intangibles
|
|
|
|
|
|
|
|
|
|
|
|
|
|
For the Year Ended December 31, |
|
(In millions) |
2025 |
|
2024 |
|
2023 |
|
Amortization of intangibles |
|
$ |
644 |
|
|
$ |
685 |
|
|
$ |
683 |
|
2025 versus 2024
Intangible asset amortization was $644 million for the year ended December 31, 2025 and $685 million for the year ended December 31, 2024. The decrease was primarily driven by lower amortization on certain intangible assets arising from the Merger that became fully amortized in 2024.
2024 versus 2023
Intangible asset amortization was $685 million for the year ended December 31, 2024 and $683 million for the year ended December 31, 2023. The increase was primarily driven by the impact of amortization relating to the intangible assets recognized in connection with the Stoller and Symborg acquisitions, which were completed on March 1, 2023, partially offset by lower amortization on certain intangible assets arising from the Merger that became fully amortized in 2024.
See Note 12 - Goodwill and Other Intangible Assets, to the Corteva Consolidated Financial Statements, for additional information.
Restructuring and Asset Related Charges - Net
|
|
|
|
|
|
|
|
|
|
|
|
|
|
For the Year Ended December 31, |
|
(In millions) |
2025 |
|
2024 |
|
2023 |
|
Restructuring and asset related charges - net |
|
$ |
146 |
|
|
$ |
288 |
|
|
$ |
336 |
|
2025
Restructuring and asset related charges - net were $146 million for the year ended December 31, 2025, which was primarily comprised of a $150 million charge associated with the Crop Protection Operations Strategy Restructuring Program consisting of $11 million of severance and related benefit costs, $13 million of asset related charges, $60 million in decommissioning and demolition costs and $66 million of contract termination charges.
2024
Restructuring and asset related charges - net were $288 million for the year ended December 31, 2024, which was primarily comprised of a $232 million charge associated with the Crop Protection Operations Strategy Restructuring Program and a $55 million net charge from non-cash accelerated prepaid royalty amortization expense related to the Roundup Ready 2 Yield® and Roundup Ready 2 Xtend® herbicide tolerance traits. The $232 million charge associated with the Crop Protection Operations Strategy Restructuring Program was primarily comprised of $91 million of severance and related benefit costs, $101 million of asset related charges, $10 million in decommissioning and demolition costs and $30 million of contract termination charges.
2023
Restructuring and asset related charges - net were $336 million for the year ended December 31, 2023, which was primarily comprised of a $217 million charge related to the Crop Protection Operations Strategy Restructuring Program, a $72 million net charge related to non-cash accelerated prepaid royalty amortization expense related to the Roundup Ready 2 Yield® and Roundup Ready 2 Xtend® herbicide tolerance traits and $42 million related to severance and related benefit costs, asset related charges and contract termination charges (including early lease terminations) associated with the 2022 Restructuring Actions. The $217 million net charge associated with the Crop Protection Operations Strategy Restructuring Program was primarily comprised of $214 million of asset related charges, which includes non-cash impairment charges of $152 million consisting of $92 million and $60 million related to operating lease assets
and property, plant and equipment, respectively, associated with the exit of the company’s production activities at its site in Pittsburg, California.
See Note 5 - Restructuring and Asset Related Charges - Net, to the Corteva Consolidated Financial Statements, for additional information.
Other Income (Expense) - Net
|
|
|
|
|
|
|
|
|
|
|
|
|
|
For the Year Ended December 31, |
|
(In millions) |
2025 |
|
2024 |
|
2023 |
|
Other income (expense) - net |
|
$ |
(570 |
) |
|
$ |
(300 |
) |
|
$ |
(448 |
) |
2025 versus 2024
Other income (expense) - net was $(570) million and $(300) million for the years ended December 31, 2025 and 2024, respectively. Higher other expense was primarily driven by the resolution of litigation matters and the one-time receipt of an indemnification payment negotiated with the former Stoller owners during the first quarter of 2024. These increases were partially offset by the receipt of insurance proceeds, the absence of charges related to estimated settlement reserves, a more favorable net exchange loss, a favorable tax indemnification adjustment and lower non-operating pension and OPEB costs.
2024 versus 2023
Other income (expense) - net was $(300) million and $(448) million for the years ended December 31, 2024 and 2023, respectively. Lower other expense was primarily driven by decreases in net exchange losses and charges related to estimated settlement reserves, as well as the receipt of insurance proceeds and an indemnification payment negotiated with the former Stoller owners, partially offset by a decrease in interest income.
See Note 6 - Supplementary Information, to the Corteva Consolidated Financial Statements, for additional information.
Interest Expense
|
|
|
|
|
|
|
|
|
|
|
|
|
|
For the Year Ended December 31, |
|
(In millions) |
2025 |
|
2024 |
|
2023 |
|
Interest expense |
|
$ |
180 |
|
|
$ |
233 |
|
|
$ |
233 |
|
2025 versus 2024
Interest expense was $180 million and $233 million for the years ended December 31, 2025 and 2024, respectively. The change was primarily driven by lower short-term borrowings and lower interest rates.
2024 versus 2023
Interest expense was $233 million and $233 million for the years ended December 31, 2024 and 2023, respectively. The impact of lower short-term borrowings and lower interest rates was offset by higher interest related to the senior notes issued in 2023 and higher foreign currency borrowings.
Provision for (Benefit from) Income Taxes on Continuing Operations
|
|
|
|
|
|
|
|
|
|
|
|
|
|
For the Year Ended December 31, |
|
(In millions) |
2025 |
|
2024 |
|
2023 |
|
Provision for (benefit from) income taxes on continuing operations |
|
$ |
484 |
|
|
$ |
412 |
|
|
$ |
152 |
|
Effective tax rate |
|
|
28.7 |
% |
|
|
32.3 |
% |
|
|
13.9 |
% |
2025
For the year ended December 31, 2025, the company’s effective tax rate of 28.7 percent on pre-tax income from continuing operations of $1,688 million was unfavorably impacted by a $132 million charge on the establishment of a valuation allowance recorded against the net deferred tax asset position of a legal entity in Brazil, unfavorable geographic mix of earnings, a $27 million charge associated with repatriation of cash held outside of the U.S. primarily from current year earnings, and the unfavorable tax impact of certain net exchange losses recognized on the re-measurement of the net monetary asset positions. These items were partially offset by a $(55) million deferred tax benefit associated with a change in a legal entity’s U.S. tax characterization, a $(47) million benefit related to U.S.
tax credits for increasing research activities, a $(29) million benefit related to a capital loss (net of valuation allowance), as well as net tax benefits associated with changes in accruals for certain prior year tax positions.
2024
For the year ended December 31, 2024, the company’s effective tax rate of 32.3 percent on pre-tax income from continuing operations of $1,275 million was unfavorably impacted by a $120 million charge on the establishment of a valuation allowance recorded against the net deferred tax asset position of a legal entity in Brazil, unfavorable geographic mix of earnings, a $22 million charge associated with repatriation of cash held outside of the U.S. primarily from current year earnings, and the unfavorable tax impact of certain net exchange losses recognized on the re-measurement of the net monetary asset positions. These items were partially offset by a $(59) million benefit related to U.S. tax credits for increasing research activities and $(32) million in net tax benefits associated with changes to deferred taxes and accruals for certain prior year tax positions.
2023
For the year ended December 31, 2023, the company’s effective tax rate of 13.9 percent on pre-tax income from continuing operations of $1,093 million was favorably impacted by a $(65) million benefit related to U.S. tax credits for increasing research activities, changes to deferred taxes and a tax currency change for legal entities within Switzerland in the amount of $(62) million and $(24) million, respectively, as well as favorable geographic mix of earnings. These items were partially offset by the unfavorable tax impact of certain net exchange losses recognized on the re-measurement of the net monetary asset positions, which were not deductible in their local jurisdictions, a $46 million charge associated with intellectual property realignment, and a $32 million charge associated with repatriation of cash held outside of the U.S. primarily from current year earnings.
Income (Loss) from Discontinued Operations After Income Taxes
|
|
|
|
|
|
|
|
|
|
|
|
|
|
For the Year Ended December 31, |
|
(In millions) |
2025 |
|
2024 |
|
2023 |
|
Income (loss) from discontinued operations after income taxes |
|
$ |
(99 |
) |
|
$ |
56 |
|
|
$ |
(194 |
) |
2025
Income (loss) from discontinued operations after income taxes was $(99) million for the year ended December 31, 2025. The after-tax charge was driven by charges recognized relating to the MOU with Chemours and DuPont, including a charge associated with the NJ Statewide Settlement as well as PFAS environmental remediation activities primarily at Chemours' Fayetteville Works facility, along with other environmental matters.
2024
Income (loss) from discontinued operations after income taxes was $56 million for the year ended December 31, 2024. The after-tax benefit was driven by charges pursuant to the MOU with Chemours and DuPont relating to PFAS remediation activities primarily at Chemours' Fayetteville Works facility and litigation activity, which were more than offset by a favorable adjustment of certain prior year tax positions for previously divested businesses, the derecognition of an indemnification liability associated with the Water District Settlement Fund contribution, and insurance proceeds related to legacy matters.
2023
Income (loss) from discontinued operations after income taxes was $(194) million for the year ended December 31, 2023, which was primarily comprised of charges associated with the settlement of certain PFAS related legal matters that are subject to the MOU with Chemours and DuPont, including the Nationwide Water District Settlement and the State of Ohio for natural resources damage claims, and charges associated with PFAS environmental remediation activities primarily at Chemours' Fayetteville Works facility.
See Note 15 - Commitments and Contingent Liabilities, to the Corteva Consolidated Financial Statements, for further discussion.
Recent Accounting Pronouncements - Years ended December 31, 2025, 2024, and 2023
See Note 3 - Recent Accounting Guidance, to the Corteva Consolidated Financial Statements, for a description of recent accounting pronouncements.
Segment Reviews - Years ended December 31, 2025, 2024, and 2023
The company operates in two reportable segments: Seed and Crop Protection. The company’s Seed segment is a global leader in developing and supplying commercial seed combining superior germplasm with advanced traits to produce high yield potential for
farmers around the world. The segment offers seed and trait technologies that improve resistance to weather, diseases, pests and herbicides used to manage weeds. Its digital solutions provide data driven insights that assist farmer decision-making with a view to optimize product selection and, ultimately, help maximize yield and profitability. The segment competes in a wide variety of agricultural markets. The Crop Protection segment serves the global agricultural input industry with products that protect against weeds, insects and other pests, and disease, and that improve overall crop health both above and below ground via nitrogen management and seed-applied technologies. The segment offers crop protection solutions and digital solutions that provide farmers the tools they need to improve productivity and profitability, and help keep fields free of weeds, insects and diseases. The segment is a leader in global herbicides, insecticides, nitrogen stabilizers, pasture and range management herbicides and biologicals.
Summarized below are comments on individual segment net sales and segment operating EBITDA for the years ended December 31, 2025, 2024 and 2023. The company defines segment operating EBITDA as earnings (loss) (i.e., income (loss) from continuing operations before income taxes) before interest, depreciation, amortization, corporate expenses, non-operating benefits (costs), foreign exchange gains (losses), and net unrealized gain or loss from mark-to-market activity for certain foreign currency derivative instruments that do not qualify for hedge accounting, excluding the impact of significant items and separation costs. Non-operating benefits (costs) consists of non-operating pension and OPEB credits (costs), tax indemnification adjustments and environmental remediation and legal costs associated with legacy businesses and sites. Tax indemnification adjustments relate to changes in indemnification balances, as a result of the application of the terms of the Tax Matters Agreement, between Corteva and Dow and/or DuPont that are recorded by the company as pre-tax income or expense. See Note 22 - Segment Information, to the Corteva Consolidated Financial Statements, for details related to significant pre-tax benefits (costs) excluded from segment operating EBITDA. All references to prices are based on local price unless otherwise specified.
A reconciliation of segment operating EBITDA to income (loss) from continuing operations after income taxes for the years ended December 31, 2025, 2024 and 2023 is included in Note 22 - Segment Information, to the Corteva Consolidated Financial Statements.
|
|
|
|
|
|
|
|
|
|
|
|
|
Seed |
For the Year Ended December 31, |
|
(In millions) |
2025 |
|
2024 |
|
2023 |
|
Net sales |
|
$ |
9,898 |
|
|
$ |
9,545 |
|
|
$ |
9,472 |
|
Segment operating EBITDA |
|
$ |
2,636 |
|
|
$ |
2,219 |
|
|
$ |
2,117 |
|
|
|
|
|
|
|
|
|
|
|
|
|
|
|
Seed |
2025 vs. 2024 |
Percent Change Due To: |
|
Net Sales Change |
Price & |
|
|
|
Portfolio / |
($ In millions) |
$ |
% |
Product Mix |
Volume |
Currency |
Other |
North America |
|
$ |
238 |
|
4 % |
|
2 % |
|
2 % |
|
— % |
|
— % |
EMEA |
|
|
(21) |
|
(1)% |
|
5 % |
|
(1)% |
|
(5)% |
|
— % |
Latin America |
|
|
91 |
|
6 % |
|
2 % |
|
3 % |
|
1 % |
|
— % |
Asia Pacific |
|
|
45 |
|
11 % |
|
7 % |
|
7 % |
|
(3)% |
|
— % |
Total |
|
$ |
353 |
|
4 % |
|
3 % |
|
2 % |
|
(1)% |
|
— % |
|
|
|
|
|
|
|
|
|
|
|
|
|
|
|
|
|
|
|
|
|
|
|
|
|
|
Seed |
2025 vs. 2024 |
|
Percent Change Due To: |
|
|
Net Sales Change |
|
Price & |
|
|
|
|
|
|
Portfolio / |
|
($ In millions) |
$ |
|
% |
|
Product Mix |
|
Volume |
|
Currency |
|
Other |
|
Corn |
|
$ |
|
506 |
|
|
|
8 |
% |
|
|
3 |
% |
|
|
6 |
% |
|
|
(1 |
)% |
|
|
— |
% |
Soybeans |
|
|
|
(49 |
) |
|
|
(3 |
)% |
|
|
2 |
% |
|
|
(4 |
)% |
|
|
(1 |
)% |
|
|
— |
% |
Other oilseeds |
|
|
|
(9 |
) |
|
|
(1 |
)% |
|
|
3 |
% |
|
|
(1 |
)% |
|
|
(3 |
)% |
|
|
— |
% |
Other |
|
|
|
(95 |
) |
|
|
(20 |
)% |
|
|
1 |
% |
|
|
(20 |
)% |
|
|
(1 |
)% |
|
|
— |
% |
Total |
|
$ |
|
353 |
|
|
|
4 |
% |
|
|
3 |
% |
|
|
2 |
% |
|
|
(1 |
)% |
|
|
— |
% |
|
|
|
|
|
|
|
|
|
|
|
|
|
|
|
|
|
|
|
|
|
|
|
|
|
|
Seed |
2024 vs. 2023 |
|
Percent Change Due To: |
|
|
Net Sales Change |
|
Price & |
|
|
|
|
|
|
Portfolio / |
|
($ In millions) |
$ |
|
% |
|
Product Mix |
|
Volume |
|
Currency |
|
Other |
|
North America |
|
$ |
|
265 |
|
|
|
5 |
% |
|
|
4 |
% |
|
|
1 |
% |
|
|
— |
% |
|
|
— |
% |
EMEA |
|
|
|
(41 |
) |
|
|
(3 |
)% |
|
|
9 |
% |
|
|
(3 |
)% |
|
|
(5 |
)% |
|
|
(4 |
)% |
Latin America |
|
|
|
(114 |
) |
|
|
(7 |
)% |
|
|
(7 |
)% |
|
|
8 |
% |
|
|
(8 |
)% |
|
|
— |
% |
Asia Pacific |
|
|
|
(37 |
) |
|
|
(8 |
)% |
|
|
9 |
% |
|
|
(15 |
)% |
|
|
(2 |
)% |
|
|
— |
% |
Total |
|
$ |
|
73 |
|
|
|
1 |
% |
|
|
3 |
% |
|
|
1 |
% |
|
|
(2 |
)% |
|
|
(1 |
)% |
|
|
|
|
|
|
|
|
|
|
|
|
|
|
|
|
|
|
|
|
|
|
|
|
|
|
Seed |
2024 vs. 2023 |
|
Percent Change Due To: |
|
|
Net Sales Change |
|
Price & |
|
|
|
|
|
|
Portfolio / |
|
($ In millions) |
$ |
|
% |
|
Product Mix |
|
Volume |
|
Currency |
|
Other |
|
Corn |
|
$ |
|
49 |
|
|
|
1 |
% |
|
|
2 |
% |
|
|
2 |
% |
|
|
(3 |
)% |
|
|
— |
% |
Soybeans |
|
|
|
69 |
|
|
|
4 |
% |
|
|
2 |
% |
|
|
2 |
% |
|
|
— |
% |
|
|
— |
% |
Other oilseeds |
|
|
|
(55 |
) |
|
|
(8 |
)% |
|
|
8 |
% |
|
|
(7 |
)% |
|
|
(4 |
)% |
|
|
(5 |
)% |
Other |
|
|
|
10 |
|
|
|
2 |
% |
|
|
8 |
% |
|
|
(5 |
)% |
|
|
(1 |
)% |
|
|
— |
% |
Total |
|
$ |
|
73 |
|
|
|
1 |
% |
|
|
3 |
% |
|
|
1 |
% |
|
|
(2 |
)% |
|
|
(1 |
)% |
Seed
Seed net sales were $9,898 million in 2025, up 4 percent from $9,545 million in 2024. The sales increase was driven by a 3 percent increase in price and a 2 percent increase in volume, partially offset by a 1 percent unfavorable currency impact.
Pricing gains in most regions, led by North America, demonstrate demand for top technology and the strength of the portfolio, coupled with increased out-licensing income. Volume growth was driven primarily by increased corn area and share gains in North America and Brazil, partially offset by lower soybean area in North America. The unfavorable currency impacts were led by the Turkish Lira and Canadian Dollar.
Seed operating EBITDA was $2,636 million in 2025, up 19 percent from $2,219 million in 2024. Commercial execution and market share gains in North America and Brazil, product mix, reduction of net royalty expense and ongoing cost and productivity actions more than offset increased compensation, research and development expense, bad debt expense, selling expenses and the unfavorable impact of currency. Segment operating EBITDA margin improved by approximately 340 basis points versus the prior-year period.
Seed net sales were $9,545 million in 2024, up 1 percent from $9,472 million in 2023. The sales increase was driven by a 3 percent increase in price and 1 percent increase in volume partially offset by a 2 percent unfavorable currency impact and a 1 percent unfavorable portfolio impact.
The increase in price was driven by improvement in many products in all regions, excluding Latin America. Global corn and soybean pricing were up 2 percent. Pricing actions more than offset currency impacts in EMEA. Volume growth was driven primarily by the expected recovery in Brazil Safrinha corn and growth in North America soybeans and cotton, partially offset by reduced planted areas in EMEA, Asia Pacific and corn in Argentina. Unfavorable currency impacts were led by the Brazilian Real and Turkish Lira.
Seed operating EBITDA was $2,219 million in 2024, up 5 percent from $2,117 million in 2023. Price execution and market share gains in North America, reduction of net royalty expense and ongoing cost and productivity actions more than offset the investment in R&D, higher commodity costs, and the unfavorable impact of currency. Segment operating EBITDA margin improved by approximately 90 basis points versus the prior-year period.
|
|
|
|
|
|
|
|
|
|
|
|
|
Crop Protection |
For the Year Ended December 31, |
|
(In millions) |
2025 |
|
2024 |
|
2023 |
|
Net sales |
|
$ |
7,503 |
|
|
$ |
7,363 |
|
|
$ |
7,754 |
|
Segment operating EBITDA |
|
$ |
1,350 |
|
|
$ |
1,272 |
|
|
$ |
1,374 |
|
|
|
|
|
|
|
|
|
|
|
|
|
|
|
|
|
|
|
|
|
|
|
|
|
|
|
Crop Protection |
2025 vs. 2024 |
|
Percent Change Due To: |
|
|
Net Sales Change |
|
Price & |
|
|
|
|
|
|
Portfolio / |
|
($ In millions) |
$ |
|
% |
|
Product Mix |
|
Volume |
|
Currency |
|
Other |
|
North America |
|
$ |
|
126 |
|
|
|
5 |
% |
|
|
1 |
% |
|
|
4 |
% |
|
|
— |
% |
|
|
— |
% |
EMEA |
|
|
|
7 |
|
|
|
— |
% |
|
|
— |
% |
|
|
1 |
% |
|
|
(1 |
)% |
|
|
— |
% |
Latin America |
|
|
|
61 |
|
|
|
3 |
% |
|
|
(7 |
)% |
|
|
11 |
% |
|
|
(1 |
)% |
|
|
— |
% |
Asia Pacific |
|
|
|
(54 |
) |
|
|
(6 |
)% |
|
|
— |
% |
|
|
(4 |
)% |
|
|
(1 |
)% |
|
|
(1 |
)% |
Total |
|
$ |
|
140 |
|
|
|
2 |
% |
|
|
(2 |
)% |
|
|
5 |
% |
|
|
(1 |
)% |
|
|
— |
% |
|
|
|
|
|
|
|
|
|
|
|
|
|
|
|
|
|
|
|
|
|
|
|
|
|
|
Crop Protection |
2025 vs. 2024 |
|
Percent Change Due To: |
|
|
Net Sales Change |
|
Price & |
|
|
|
|
|
|
Portfolio / |
|
($ In millions) |
$ |
|
% |
|
Product Mix |
|
Volume |
|
Currency |
|
Other |
|
Herbicides |
|
$ |
|
131 |
|
|
|
4 |
% |
|
|
— |
% |
|
|
4 |
% |
|
|
— |
% |
|
|
— |
% |
Insecticides |
|
|
|
(46 |
) |
|
|
(3 |
)% |
|
|
(4 |
)% |
|
|
2 |
% |
|
|
(1 |
)% |
|
|
— |
% |
Fungicides |
|
|
|
59 |
|
|
|
5 |
% |
|
|
— |
% |
|
|
7 |
% |
|
|
(1 |
)% |
|
|
(1 |
)% |
Biologicals |
|
|
|
43 |
|
|
|
9 |
% |
|
|
(7 |
)% |
|
|
16 |
% |
|
|
— |
% |
|
|
— |
% |
Other |
|
|
|
(47 |
) |
|
|
(10 |
)% |
|
|
(6 |
)% |
|
|
(3 |
)% |
|
|
(1 |
)% |
|
|
— |
% |
Total |
|
$ |
|
140 |
|
|
|
2 |
% |
|
|
(2 |
)% |
|
|
5 |
% |
|
|
(1 |
)% |
|
|
— |
% |
|
|
|
|
|
|
|
|
|
|
|
|
|
|
|
|
|
|
|
|
|
|
|
|
|
|
Crop Protection |
2024 vs. 2023 |
|
Percent Change Due To: |
|
|
Net Sales Change |
|
Price & |
|
|
|
|
|
|
Portfolio / |
|
($ In millions) |
$ |
|
% |
|
Product Mix |
|
Volume |
|
Currency |
|
Other |
|
North America |
|
$ |
|
(195 |
) |
|
|
(7 |
)% |
|
|
(3 |
)% |
|
|
(4 |
)% |
|
|
— |
% |
|
|
— |
% |
EMEA |
|
|
|
(202 |
) |
|
|
(12 |
)% |
|
|
1 |
% |
|
|
(10 |
)% |
|
|
(3 |
)% |
|
|
— |
% |
Latin America |
|
|
|
(16 |
) |
|
|
(1 |
)% |
|
|
(15 |
)% |
|
|
21 |
% |
|
|
(8 |
)% |
|
|
1 |
% |
Asia Pacific |
|
|
|
22 |
|
|
|
2 |
% |
|
|
(1 |
)% |
|
|
6 |
% |
|
|
(3 |
)% |
|
|
— |
% |
Total |
|
$ |
|
(391 |
) |
|
|
(5 |
)% |
|
|
(5 |
)% |
|
|
3 |
% |
|
|
(3 |
)% |
|
|
— |
% |
|
|
|
|
|
|
|
|
|
|
|
|
|
|
|
|
|
|
|
|
|
|
|
|
|
|
Crop Protection |
2024 vs. 2023 |
|
Percent Change Due To: |
|
|
Net Sales Change |
|
Price & |
|
|
|
|
|
|
Portfolio / |
|
($ In millions) |
$ |
|
% |
|
Product Mix |
|
Volume |
|
Currency |
|
Other |
|
Herbicides |
|
$ |
|
(435 |
) |
|
|
(11 |
)% |
|
|
(5 |
)% |
|
|
(4 |
)% |
|
|
(2 |
)% |
|
|
— |
% |
Insecticides |
|
|
|
117 |
|
|
|
7 |
% |
|
|
(5 |
)% |
|
|
17 |
% |
|
|
(5 |
)% |
|
|
— |
% |
Fungicides |
|
|
|
(31 |
) |
|
|
(3 |
)% |
|
|
(9 |
)% |
|
|
12 |
% |
|
|
(6 |
)% |
|
|
— |
% |
Biologicals |
|
|
|
(15 |
) |
|
|
(3 |
)% |
|
|
(8 |
)% |
|
|
6 |
% |
|
|
(7 |
)% |
|
|
6 |
% |
Other |
|
|
|
(27 |
) |
|
|
(5 |
)% |
|
|
— |
% |
|
|
(3 |
)% |
|
|
(2 |
)% |
|
|
— |
% |
Total |
|
$ |
|
(391 |
) |
|
|
(5 |
)% |
|
|
(5 |
)% |
|
|
3 |
% |
|
|
(3 |
)% |
|
|
— |
% |
Crop Protection
Crop Protection net sales were $7,503 million in 2025, up 2 percent from $7,363 million in 2024. The sales increase was driven by a 5 percent increase in volume, partially offset by a 2 percent decrease in price and a 1 percent unfavorable impact from currency.
Volume growth was driven by demand for new products, herbicides and biologicals, while price declined primarily due to market dynamics in Latin America, partially offset by North America price increases. The unfavorable currency impacts were led by the Turkish Lira and Brazilian Real.
Segment operating EBITDA was $1,350 million in 2025, up 6 percent from $1,272 million from 2024. Raw material deflation, productivity savings and volume growth more than offset the unfavorable impact from currency, price pressure and higher compensation and bad debt expense. Segment operating EBITDA margin improved by approximately 70 basis points versus the prior-year period.
Crop Protection net sales were $7,363 million in 2024, down 5 percent from $7,754 million in 2023. The sales decrease was driven by a 5 percent decrease in price and a 3 percent unfavorable impact from currency, partially offset by a 3 percent increase in volume.
The price decline was primarily due to market dynamics in Latin America. Unfavorable currency impacts were led by the Brazilian Real and Turkish Lira. The increase in volumes was driven by growth in Latin America on demand for new products and spinosyns, partially offset by unfavorable weather impacts in EMEA as well as just-in-time purchasing behavior in North America.
Segment operating EBITDA was $1,272 million in 2024, down 7 percent from $1,374 million in 2023. Pricing pressure and the unfavorable impact of currency more than offset productivity savings, raw material deflation, and volume growth. Segment operating EBITDA margin contracted by approximately 45 basis points versus the prior-year period.
Non-GAAP Financial Measures - Years ended December 31, 2025, 2024, and 2023
The company presents certain financial measures that do not conform to U.S. GAAP and are considered non-GAAP measures. These measures include operating EBITDA and operating earnings (loss) per share. Management uses these measures internally for planning and forecasting, including allocating resources and evaluating incentive compensation. Management believes that these non-GAAP measures best reflect the ongoing performance of the company during the periods presented and provide more relevant and meaningful information to investors as they provide insight with respect to ongoing operating results of the company and a more useful comparison of year-over-year results. These non-GAAP measures supplement the company's U.S. GAAP disclosures and should not be viewed as an alternative to U.S. GAAP measures of performance. Furthermore, such non-GAAP measures may not be consistent with similar measures provided or used by other companies. Reconciliations for these non-GAAP measures to U.S. GAAP are provided below.
Operating EBITDA is defined as earnings (loss) (i.e., income (loss) from continuing operations before income taxes) before interest, depreciation, amortization, non-operating benefits (costs), foreign exchange gains (losses), and net unrealized gain or loss from mark-to-market activity for certain foreign currency derivative instruments that do not qualify for hedge accounting, excluding the impact of significant items and separation costs. Non-operating benefits (costs) consists of non-operating pension and OPEB credits (costs), tax indemnification adjustments and environmental remediation and legal costs associated with legacy businesses and sites. Tax indemnification adjustments relate to changes in indemnification balances, as a result of the application of the terms of the Tax Matters Agreement, between Corteva and Dow and/or DuPont that are recorded by the company as pre-tax income or expense. Operating earnings (loss) per share is defined as "earnings (loss) per common share from continuing operations - diluted" excluding the after-tax impact of significant items, the after-tax impact of separation costs, the after-tax impact of non-operating benefits (costs), the after-tax impact of amortization expense associated with intangible assets existing as of the Corteva Separation from DowDuPont, and the after-tax impact of net unrealized gain or loss from mark-to-market activity for certain foreign currency derivative instruments that do not qualify for hedge accounting. Although amortization of the company's intangible assets is excluded from these non-GAAP measures, management believes it is important for investors to understand that such intangible assets contribute to revenue generation. Amortization of intangible assets that relate to past acquisitions will recur in future periods until such intangible assets have been fully amortized. Any future acquisitions may result in amortization of additional intangible assets. Net unrealized gain or loss from mark-to-market activity for certain foreign currency derivative instruments that do not qualify for hedge accounting represents the non-cash net gain (loss) from changes in fair value of certain undesignated foreign currency derivative contracts. Upon settlement, which is within the same calendar year of execution of the contract, the realized gain (loss) from the changes in fair value of the non-qualified foreign currency derivative contracts will be reported in the relevant non-GAAP financial measures, allowing quarterly results to reflect the economic effects of the foreign currency derivative contracts without the resulting unrealized mark to fair value volatility.
The company also uses Free Cash Flow as a non-GAAP measure to evaluate and discuss its liquidity position and ability to generate cash. Free Cash Flow is defined as cash provided by (used for) operating activities – continuing operations, less capital expenditures. Management believes that Free Cash Flow provides investors with meaningful information regarding the company’s ongoing ability to generate cash through core operations, and the company’s ability to service its indebtedness, pay dividends (when declared), make share repurchases, and meet its ongoing cash needs for its operations.
Reconciliation of Income (Loss) from Continuing Operations after Income Taxes to Operating EBITDA
|
|
|
|
|
|
|
|
|
|
|
|
|
|
For the Year Ended December 31, |
|
(In millions) |
2025 |
|
2024 |
|
2023 |
|
Income (loss) from continuing operations after income taxes (GAAP) |
|
$ |
1,204 |
|
|
$ |
863 |
|
|
$ |
941 |
|
Provision for (benefit from) income taxes on continuing operations |
|
|
484 |
|
|
|
412 |
|
|
|
152 |
|
Income (loss) from continuing operations before income taxes (GAAP) |
|
$ |
1,688 |
|
|
$ |
1,275 |
|
|
$ |
1,093 |
|
Depreciation and amortization |
|
|
1,203 |
|
|
|
1,227 |
|
|
|
1,211 |
|
Interest income |
|
|
(136 |
) |
|
|
(132 |
) |
|
|
(283 |
) |
Interest expense |
|
|
180 |
|
|
|
233 |
|
|
|
233 |
|
Exchange (gains) losses - net |
|
|
181 |
|
|
|
284 |
|
|
|
397 |
|
Non-operating (benefits) costs - net |
|
|
39 |
|
|
|
174 |
|
|
|
151 |
|
Mark-to-market (gains) losses on certain foreign currency contracts not designated as hedges |
|
|
— |
|
|
|
— |
|
|
|
— |
|
Significant items (benefit) charge |
|
|
658 |
|
|
|
315 |
|
|
|
579 |
|
Separation costs |
|
|
35 |
|
|
|
— |
|
|
|
— |
|
Operating EBITDA (Non-GAAP) |
|
$ |
3,848 |
|
|
$ |
3,376 |
|
|
$ |
3,381 |
|
Significant Items
|
|
|
|
|
|
|
|
|
|
|
|
|
|
For the Year Ended December 31, |
|
(In millions) |
2025 |
|
2024 |
|
2023 |
|
Restructuring and asset related charges - net |
|
$ |
146 |
|
|
$ |
288 |
|
|
$ |
336 |
|
Bayer resolution 1 |
|
|
610 |
|
|
|
— |
|
|
|
— |
|
Estimated settlement expense 2 |
|
|
— |
|
|
|
101 |
|
|
|
204 |
|
Inventory write-offs 3 |
|
|
— |
|
|
|
(2 |
) |
|
|
7 |
|
Spare parts write-off 4 |
|
|
— |
|
|
|
— |
|
|
|
12 |
|
(Gain) loss on sale of business, assets and equity investments 3,4 |
|
|
(37 |
) |
|
|
(7 |
) |
|
|
(14 |
) |
Seed sale associated with Russia Exit 3,5 |
|
|
— |
|
|
|
— |
|
|
|
(18 |
) |
Acquisition-related costs 6 |
|
|
— |
|
|
|
6 |
|
|
|
45 |
|
Employee Retention Credit |
|
|
— |
|
|
|
— |
|
|
|
(3 |
) |
AltEn facility remediation charges 7 |
|
|
37 |
|
|
|
— |
|
|
|
10 |
|
Insurance proceeds 8 |
|
|
(98 |
) |
|
|
(71 |
) |
|
|
— |
|
Total pre-tax significant items (benefit) charge |
|
$ |
658 |
|
|
$ |
315 |
|
|
$ |
579 |
|
Total tax (benefit) provision impact of significant items 9 |
|
|
(153 |
) |
|
|
(80 |
) |
|
|
(131 |
) |
Tax only significant item (benefit) charge 10 |
|
|
77 |
|
|
|
116 |
|
|
|
(45 |
) |
Total significant items (benefit) charge, after tax |
|
$ |
582 |
|
|
$ |
351 |
|
|
$ |
403 |
|
1.Consists of a charge relating to the resolution of litigation with Bayer. See Note 15 - Commitments and Contingent Liabilities, to the Corteva Consolidated Financial Statements, for additional information.
2.Consists of estimated Lorsban® related charges.
3.Incremental (gains) losses associated with activities related to the 2022 Restructuring Actions. Within (gain) loss on sale of business, assets and equity investments, such benefits are $(14) million, $(7) million and $(14) million for the years ended December 31, 2025, 2024 and 2023, respectively.
4.Incremental (gains) losses associated with activities related to the Crop Protection Operations Strategy Restructuring Program. Within (gain) loss on sale of business, assets and equity investments, a $(23) million benefit was recorded for the year ended December 31, 2025.
5.Includes a benefit of $(18) million for the year ended December 31, 2023, relating to the sale of seeds already under production in Russia when the decision to exit the country was made and that the company was contractually required to purchase. It consists of $71 million of net sales and $53 million of cost of goods sold for the year ended December 31, 2023.
6.Relates to acquisition-related costs, including transaction and third-party integration costs associated with the completed acquisitions of Stoller and Symborg as well as the recognition of the inventory fair value step-up.
7.Relates to a charge to increase the remediation accrual at the AltEn facility relating to Corteva's estimated voluntary contribution to the solid waste and wastewater remedial action plans. See Note 15 - Commitments and Contingent Liabilities, to the Corteva Consolidated Financial Statements, for additional information.
8.Includes proceeds received related to prior significant items.
9.Unless specifically addressed above, the income tax effect on significant items was calculated based upon the enacted tax laws and statutory income tax rates applicable in the tax jurisdiction(s) of the underlying non-GAAP adjustment.
10.The tax only significant item for the year ended December 31, 2025 relates to the establishment of a valuation allowance recorded against the net deferred tax asset position of a legal entity in Brazil (Crop Protection Business) in the amount of $132 million, as well as a deferred tax benefit associated with a change in a legal entity's U.S. tax characterization in the amount of $(55) million. The tax only significant item charge for the year ended December 31, 2024 relates to the establishment of a valuation allowance recorded against the net deferred tax asset position of a legal entity in Brazil (Seed Business) in the amount of $120 million, as well as a change in estimate related to intellectual property realignment. The tax only significant item benefit for the year ended December 31, 2023 relates to the impact of changes to deferred taxes and a tax currency change for legal entities within Switzerland of $(62) million and $(24) million, respectively, as well as adjustments due to intellectual property realignment of $46 million and a change in estimate related to a worthless stock deduction in the U.S.
Reconciliation of Income (Loss) from Continuing Operations Attributable to Corteva and Earnings (Loss) Per Share of Common Stock from Continuing Operations - Diluted to Operating Earnings (Loss) and Operating Earnings (Loss) Per Share
|
|
|
|
|
|
|
|
|
|
|
|
|
|
For the Year Ended December 31, |
|
(In millions) |
2025 |
|
2024 |
|
2023 |
|
Income (loss) from continuing operations attributable to Corteva common stockholders (GAAP) |
|
$ |
1,193 |
|
|
$ |
851 |
|
|
$ |
929 |
|
Less: Non-operating benefits (costs), after tax |
|
|
(36 |
) |
|
|
(127 |
) |
|
|
(111 |
) |
Less: Amortization of intangibles (existing as of Corteva Separation), after tax |
|
|
(434 |
) |
|
|
(459 |
) |
|
|
(471 |
) |
Less: Mark-to-market gains (losses) on certain foreign currency contracts not designated as hedges, after tax |
|
|
— |
|
|
|
— |
|
|
|
— |
|
Less: Significant items benefit (charge), after tax |
|
|
(582 |
) |
|
|
(351 |
) |
|
|
(403 |
) |
Less: Separation costs, after tax |
|
|
(31 |
) |
|
|
— |
|
|
|
— |
|
Operating Earnings (Loss) (Non-GAAP) |
|
$ |
2,276 |
|
|
$ |
1,788 |
|
|
$ |
1,914 |
|
|
|
|
|
|
|
|
|
|
|
|
|
|
|
For the Year Ended December 31, |
|
(Dollars per Share) |
2025 |
|
2024 |
|
2023 |
|
Earnings (loss) per share of common stock from continuing operations attributable to Corteva common stockholders - diluted (GAAP) |
|
$ |
1.75 |
|
|
$ |
1.22 |
|
|
$ |
1.30 |
|
Less: Non-operating benefits (costs), after tax |
|
|
(0.05 |
) |
|
|
(0.18 |
) |
|
|
(0.16 |
) |
Less: Amortization of intangibles (existing as of Separation), after tax |
|
|
(0.64 |
) |
|
|
(0.67 |
) |
|
|
(0.66 |
) |
Less: Mark-to-market gains (losses) on certain foreign currency contracts not designated as hedges, after tax |
|
— |
|
|
|
— |
|
|
|
— |
|
Less: Significant items benefit (charge), after tax |
|
|
(0.85 |
) |
|
|
(0.50 |
) |
|
|
(0.57 |
) |
Less: Separation costs, after tax |
|
|
(0.05 |
) |
|
|
— |
|
|
|
— |
|
Operating Earnings (Loss) Per Share (Non-GAAP) |
|
$ |
3.34 |
|
|
$ |
2.57 |
|
|
$ |
2.69 |
|
Diluted Shares Outstanding (In millions) |
|
681.4 |
|
|
|
696.0 |
|
|
|
711.9 |
|
Reconciliation of Cash Provided by (Used for) Operating Activities – Continuing Operations to Free Cash Flow
|
|
|
|
|
|
|
|
|
|
|
|
|
|
For the Year Ended December 31, |
|
(In millions) |
2025 |
|
2024 |
|
2023 |
|
Cash provided by (used for) operating activities - continuing operations |
|
$ |
3,457 |
|
|
$ |
2,296 |
|
|
$ |
1,809 |
|
Less: Capital expenditures |
|
|
(591 |
) |
|
|
(597 |
) |
|
|
(595 |
) |
Free Cash Flow (Non-GAAP) |
|
$ |
2,866 |
|
|
$ |
1,699 |
|
|
$ |
1,214 |
|
Liquidity & Capital Resources - Three months ended March 31, 2026 and 2025
|
|
|
|
|
|
|
|
|
|
|
|
|
(In millions) |
March 31, 2026 |
|
December 31, 2025 |
|
March 31, 2025 |
|
Cash, cash equivalents and marketable securities |
|
$ |
1,966 |
|
|
$ |
4,530 |
|
|
$ |
2,009 |
|
Total debt |
|
$ |
3,356 |
|
|
$ |
2,580 |
|
|
$ |
4,083 |
|
The increase in debt balances from December 31, 2025 was primarily due to higher short-term debt, which was used to fund the company's working capital needs, capital spending, dividend payments and share repurchases. See further information in Note 11 - Short-Term Borrowings, Long-Term Debt and Available Credit Facilities, to the interim Consolidated Financial Statements.
The company believes its ability to generate cash from operations and access to capital markets and commercial paper markets will be adequate to meet anticipated cash requirements to fund its operations, including seasonal working capital, capital spending, dividend payments, share repurchases, pension obligations and litigation costs, net of recoveries. Corteva’s strong financial position, liquidity and credit ratings will provide access as needed to capital markets and commercial paper markets to fund seasonal working capital needs. The company’s liquidity needs can be met through a variety of sources, including cash provided by operating activities, commercial paper, syndicated credit lines, bilateral credit lines, long-term debt markets, bank financing and committed receivable repurchase facilities. Corteva considers the borrowing costs and lending terms when selecting the source to fund its operations and working capital needs.
The company had access to approximately $6.7 billion, $6.2 billion and $6.1 billion at March 31, 2026, December 31, 2025 and March 31, 2025, respectively, in committed and uncommitted unused credit lines, which includes the uncommitted revolving credit lines relating to the foreign currency loans. These facilities provide support to meet the company’s short-term liquidity needs and for general corporate purposes, which may include funding of discretionary and non-discretionary contributions to certain benefit plans, severance payments, repayment and refinancing of debt, working capital, capital expenditures, repurchases and redemptions of securities, acquisitions and Corteva’s costs and expenses, including the settlement of litigation and environmental remediation. These facilities are provided to the company by highly rated and well capitalized global financial institutions.
In June 2024, the Revolving Credit Facilities were refinanced for purposes of extending the maturity dates for the five-year and three-year revolving credit facilities to June 2029 and June 2027, respectively, and lowering the facility amount of the five-year revolving credit facility to $2.85 billion and the three-year revolving credit facility to $1.90 billion. Borrowings under the Revolving Credit Facilities will have an interest rate equal to Adjusted Term SOFR, which is Term SOFR plus 0.10 percent, plus the applicable margin. The Revolving Credit Facilities may serve as a substitute to the company’s commercial paper program, and can be used, from time to time, for general corporate purposes including, but not limited to, the funding of seasonal working capital needs. The Revolving Credit Facilities contain customary representations and warranties, affirmative and negative covenants and events of default that are typical for companies with similar credit ratings. Additionally, the Revolving Credit Facilities contain a financial covenant requiring that the ratio of total indebtedness to total capitalization for Corteva and its consolidated subsidiaries not exceed 0.60. At March 31, 2026, the company was in compliance with these covenants.
In February 2026, the company amended its January 2023 (as amended in July 2023, January 2024, February 2024 and February 2025) 364-day revolving credit agreement (the “364-Day Revolving Credit Facility”), increasing the facility amount from $750 million to $1.25 billion, extending the expiration date to February 2027 and amending the interest rate to Term SOFR plus the applicable margin. In February 2025, the company amended the 364-Day Revolving Credit Facility, decreasing the facility amount from $1 billion to $750 million and extending the expiration date to February 2026. The 364-Day Revolving Credit Facility includes a provision under which the company may convert any advances outstanding prior to the maturity date into term loans having a maturity date up to one year later. The 364-Day Revolving Credit Facility contains customary representations and warranties, affirmative and negative covenants and events of default that are typical for companies with similar credit ratings. Additionally, the 364-Day Revolving Credit Facility contains a financial covenant requiring that the ratio of total indebtedness to total capitalization for Corteva and its consolidated subsidiaries not exceed 0.60. At March 31, 2026, the company was in compliance with these covenants.
In May 2025, the company issued $500 million of 5.125 percent Senior Notes due in May 2032 (the “May 2025 Debt Offering”). The proceeds were used to repay the $500 million senior notes that matured in July 2025.
The company’s indenture covenants include customary limitations on liens, sale and leaseback transactions, and mergers and consolidations affecting manufacturing plants, mineral producing properties or research facilities located in the U.S. and the consolidated subsidiaries owning such plants, properties and facilities subject to certain limitations. The outstanding long-term debt also contains customary default provisions.
The company has meaningful seasonal working capital needs based in part on providing financing to its customers. Working capital is funded through multiple methods including cash, commercial paper, the Revolving Credit Facilities, the 364-Day Revolving Credit Facility, and factoring.
The company has factoring agreements with third-party financial institutions to sell its trade receivables under both recourse and non-recourse agreements in exchange for cash proceeds in an effort to reduce its receivables risk. For arrangements that include an element of recourse, the company provides a guarantee of the trade receivables in the event of customer default. Refer to Note 8 - Accounts and Notes Receivable - Net, to the interim Consolidated Financial Statements, for more information.
The company also organizes agreements with third-party financial institutions who directly provide financing for select customers of the company’s Seed and Crop Protection products in each region. Terms of the third-party loans are less than a year and programs are renewed on an annual basis. In some cases, the company guarantees a portion of the extension of such credit to such customers. Refer to Note 12 - Commitments and Contingent Liabilities, to the interim Consolidated Financial Statements, for more information on the company’s guarantees.
In establishing the future capital structures of the two independent companies expected to be created through the Proposed Separation, the company evaluated making discretionary contributions to its principal U.S. pension plan. In April 2026, the Board of Directors approved a contribution to the principal U.S. pension plan of approximately $1.5 billion to be made on or before July 31, 2026. The company continues to expect both companies at separation to have strong balance sheets and investment grade credit ratings.
The company’s cash, cash equivalents and marketable securities at March 31, 2026, December 31, 2025 and March 31, 2025 are $2.0 billion, $4.5 billion and $2.0 billion, respectively, of which $1.6 billion, $2.1 billion and $1.7 billion at March 31, 2026, December 31, 2025 and March 31, 2025, respectively, was held by subsidiaries in foreign countries, including United States territories. Cash, cash equivalents and marketable securities are concentrated subject to local restrictions with highly rated and well capitalized global financial institutions. The underlying credit worthiness and exposures to these counterparties are monitored on a regular basis in line with the company’s overall risk management procedures. Upon actual repatriation, such earnings could be subject to withholding taxes, foreign and/or U.S. state income taxes, and taxes resulting from the impact of foreign currency movements. The cash held by foreign subsidiaries is generally used to finance the subsidiaries’ operational activities and future foreign investments. At March 31, 2026, management believed that sufficient liquidity is available in the U.S. with global operating cash flows, borrowing capacity from existing committed credit facilities, and access to capital markets and commercial paper markets.
Liquidity & Capital Resources - Years ended December 31, 2025, 2024, and 2023
The company continually reviews its sources of liquidity and debt portfolio and occasionally may make adjustments to one or both to ensure adequate liquidity.
|
|
|
|
|
|
|
|
|
(In millions) |
December 31, 2025 |
|
December 31, 2024 |
|
Cash, cash equivalents and marketable securities |
|
$ |
4,530 |
|
|
$ |
3,169 |
|
Total debt |
|
$ |
2,580 |
|
|
$ |
2,703 |
|
The company's credit ratings impact its access to the debt capital markets and cost of capital. The company remains committed to a strong financial position and strong investment-grade rating. The company's long-term and short-term credit ratings assigned to EIDP are as follows:
|
|
|
|
|
Long-term |
Short-term |
Outlook |
Standard & Poor's 1 |
A- |
A-2 |
Watch Negative |
Moody’s Investors Service |
Baa1 |
P-2 |
Watch Negative |
Fitch Ratings 1 |
A |
F1 |
Watch Negative |
1. In addition, Corteva, Inc. has been assigned a long-term issuer credit rating of A- with Watch Negative outlook by Standard & Poor's and an Issuer Default Rating of A with Watch Negative outlook by Fitch Ratings.
The company believes its cash on hand, as well as its ability to generate cash from operations and access to capital markets and commercial paper markets, will be adequate to meet anticipated cash requirements to fund its operations, including seasonal working capital, capital spending, dividend payments, share repurchases, pension obligations and litigation costs, net of recoveries. Corteva's strong financial position, liquidity and credit ratings will provide access as needed to capital markets and commercial paper markets to fund seasonal working capital needs. The company's liquidity needs can be met through a variety of sources, including cash provided by operating activities, commercial paper, syndicated credit lines, bilateral credit lines, long-term debt markets, bank financing and committed receivable repurchase facilities. Corteva considers the borrowing costs and lending terms when selecting the source to fund its operations and working capital needs.
The company had access to approximately $6.2 billion and $6.3 billion at December 31, 2025 and 2024 in committed and uncommitted unused credit lines, which includes the uncommitted revolving credit lines relating to the Foreign Currency Loans. These facilities provide support to meet the company’s short-term liquidity needs and for general corporate purposes, which may include funding of discretionary and non-discretionary contributions to certain benefit plans, severance payments, repayment and refinancing of debt, working capital, capital expenditures, repurchases and redemptions of securities, funding of acquisitions and funding Corteva's costs and expenses, including the settlement of litigation. These facilities are provided to the company by highly rated and well capitalized global financial institutions.
In May 2025, the company issued $500 million of 5.125 percent Senior Notes due in May 2032 (the “May 2025 Debt Offering”). The proceeds were used to repay the $500 million senior notes that matured in July 2025.
In May 2023, the company issued $600 million of 4.50 percent Senior Notes due in 2026 and $600 million of 4.80 percent Senior Notes due in 2033 (the “May 2023 Debt Offering”).
In January 2023, the company amended and restated its May 2022 364-day revolving credit agreement (the “364-Day Revolving Credit Facility”) increasing the facility amount to $1 billion and extending the expiration date to January 2024. Borrowings under the 364-Day Revolving Credit Facility have an interest rate equal to Adjusted Term SOFR, which is Term SOFR plus 0.10 percent, plus the applicable margin. The 364-Day Revolving Credit Facility includes a provision under which the company may convert any advances outstanding
prior to the maturity date into term loans having a maturity date up to one year later. In February 2023, the company drew down $1 billion under the 364-Day Revolving Credit Facility, which was used for general corporate purposes, including funding seasonal working capital needs, capital spending, dividend payments, share repurchases and to partially fund the Stoller and Symborg acquisitions. In May 2023, the company repaid the $1 billion loan using the proceeds from the May 2023 Debt Offering and subsequently, in July 2023 reduced the available credit from $1 billion to $500 million. In February 2024, the company amended and restated the 364-Day Revolving Credit Facility, increasing the facility amount to $1 billion and extending the expiration date to February 2025. In February 2025, the company amended and restated the 364-Day Revolving Credit Facility, decreasing the facility amount from $1 billion to $750 million and extending the expiration date to February 2026. In February 2026, the company amended and restated the 364-Day Revolving Credit Facility, increasing the facility amount from $750 million to $1.25 billion, extended the expiration date to February 2027 and amended the interest rate to Term SOFR plus the applicable margin. The 364-Day Revolving Credit Facility contains customary representations and warranties, affirmative and negative covenants and events of default that are typical for companies with similar credit ratings. Additionally, the 364-Day Revolving Credit Facility contains a financial covenant requiring that the ratio of total indebtedness to total capitalization for Corteva and its consolidated subsidiaries not exceed 0.60. At December 31, 2025, the company was in compliance with these covenants.
In May 2022, the company entered into a $3 billion, five year revolving credit facility and a $2 billion, three-year revolving credit facility (the "Revolving Credit Facilities”) expiring in May 2027 and May 2025, respectively. In June 2024, the Revolving Credit Facilities were refinanced for purposes of extending the maturity dates for the five-year and three-year revolving credit facilities to June 2029 and June 2027, respectively, and lowering the facility amount of the five-year revolving credit facility to $2.85 billion and the three-year revolving credit facility to $1.9 billion. Borrowings under the Revolving Credit Facilities will have an interest rate equal to Adjusted Term SOFR, which is Term SOFR plus 0.10 percent, plus the applicable margin. The Revolving Credit Facilities may serve as a substitute to the company's commercial paper program, and can be used, from time to time, for general corporate purposes including, but not limited to, the funding of seasonal working capital needs. The Revolving Credit Facilities contain customary representations and warranties, affirmative and negative covenants and events of default that are typical for companies with similar credit ratings. Additionally, the Revolving Credit Facilities contain a financial covenant requiring that the ratio of total indebtedness to total capitalization for Corteva and its consolidated subsidiaries not exceed 0.60. At December 31, 2025, the company was in compliance with these covenants.
The company enters into short-term and long-term foreign currency loans from time-to-time by accessing uncommitted revolving credit lines to fund working capital needs of foreign subsidiaries in the normal course of business (“Foreign Currency Loans”). Interest rates are variable and determined at the time of borrowing. Total unused bank credit lines on the Foreign Currency Loans at December 31, 2025 was approximately $86 million. The company’s long-term Foreign Currency Loans are maturing in March 2026.
The company's indenture covenants include customary limitations on liens, sale and leaseback transactions, and mergers and consolidations affecting manufacturing plants, mineral producing properties or research facilities located in the U.S. and the consolidated subsidiaries owning such plants, properties and facilities subject to certain limitations. The outstanding long-term debt also contains customary default provisions.
In September 2023 and in accordance with the Nationwide Water District Settlement, Chemours, DuPont and Corteva established a settlement fund (the “Water District Settlement Fund”) and collectively contributed $1.185 billion, with Chemours contributing 50 percent, and DuPont and Corteva collectively contributing the remaining 50 percent pursuant to the terms of the Letter Agreement. The settling companies utilized the balance in the MOU Escrow Account, along with amounts previously expected to be contributed to the MOU Escrow Account in 2023, among other sources, to make their respective contributions to the Water District Settlement Fund. In April 2024, the settlement was deemed final resulting in the release of the previously restricted cash in the Water District Settlement Fund and derecognition of the associated liability. See Note 15 - Commitments and Contingent Liabilities, to the Corteva Consolidated Financial Statements, for additional information.
The company has meaningful seasonal working capital needs based in part on providing financing to its customers. Working capital is funded through multiple methods including cash, commercial paper, the Revolving Credit Facilities, the 364-Day Revolving Credit Facility, and factoring.
In May 2023, in line with seasonal working capital requirements, the company entered into a committed receivable repurchase facility of up to $500 million (the "2023 Repurchase Facility") which expired in December 2023. Under the 2023 Repurchase Facility, Corteva sold a portfolio of available and eligible outstanding customer notes receivables to participating institutions and simultaneously agreed to repurchase at a future date.
The company has factoring agreements with third-party financial institutions to sell its trade receivables under both recourse and non-recourse agreements in exchange for cash proceeds in an effort to reduce its receivables risk. For arrangements that include an element
of recourse, the company provides a guarantee of the trade receivables in the event of customer default. See Note 9 - Accounts and Notes Receivable - Net, to the Corteva Consolidated Financial Statements, for additional information.
The company also organizes agreements with third-party financial institutions that directly provide financing for select customers of its seed and crop protection products in each region. Terms of the third-party loans are less than a year and programs are renewed on an annual basis. In some cases, the company guarantees a portion of the extension of such credit to such customers. See Note 15 - Commitments and Contingent Liabilities, to the Corteva Consolidated Financial Statements, for more information on the company’s guarantees.
The company's cash, cash equivalents and marketable securities at December 31, 2025 and 2024 are $4.5 billion and $3.2 billion, respectively, of which $2.1 billion and $1.7 billion, respectively, was held by subsidiaries in foreign countries, including United States territories. Cash, cash equivalents and marketable securities are concentrated subject to local restrictions with highly rated and well capitalized global financial institutions. The underlying credit worthiness and exposures to these counterparties are monitored on a regular basis in line with the company’s overall risk management procedures. Upon actual repatriation, such earnings could be subject to withholding taxes, foreign and/or U.S. state income taxes, and taxes resulting from the impact of foreign currency movements. The cash held by foreign subsidiaries is generally used to finance the subsidiaries' operational activities and future foreign investments. At December 31, 2025, management believed that sufficient liquidity is available in the United States with global operating cash flows, borrowing capacity from existing committed credit facilities, and access to capital markets and commercial paper markets.
Summary of Cash Flows - Three months ended March 31, 2026 and 2025
Cash provided by (used for) operating activities - continuing operations was $(2,885) million for the three months ended March 31, 2026 compared to $(2,101) million for the three months ended March 31, 2025. The change was driven by the Bayer resolution payment, higher compensation payments, and lower customer prepayments partially offset by improved collections.
Cash provided by (used for) operating activities - discontinued operations was $(6) million for the three months ended March 31, 2026 compared to $(8) million for the three months ended March 31, 2025. The cash outflows were primarily related to PFAS activities that are subject to the MOU with Chemours and DuPont associated with environmental remediation activities primarily at Chemours’ Fayetteville Works facility, along with litigation matters.
Cash provided by (used for) investing activities was $(77) million for the three months ended March 31, 2026 compared to $(34) million for the three months ended March 31, 2025. The change was primarily driven by lower proceeds from sales and maturities of investments.
Cash provided by (used for) financing activities was $389 million for the three months ended March 31, 2026 compared to $995 million for the three months ended March 31, 2025. The change was primarily due to lower short-term debt borrowings due to higher cash on-hand at the beginning of the period.
In January 2026, the company's Board of Directors authorized a common stock dividend of $0.18 per share, payable on March 16, 2026, to the shareholders of record on March 2, 2026. In April 2026, the company's Board of Directors authorized a common stock dividend of $0.18 per share, payable on June 15, 2026, to the shareholders of record on June 1, 2026.
On November 19, 2024, Corteva, Inc. announced that its Board of Directors authorized a $3 billion share repurchase program to purchase Corteva, Inc.'s common stock, par value $0.01 per share, without an expiration date (“2024 Share Buyback Plan”). The timing, price and volume of purchases will be based on market conditions, relevant securities laws and other factors. In connection with the 2024 Share Buyback Plan, the company repurchased and retired 3,190,000 shares in the open market for a total cost (excluding excise taxes) of $250 million during the three months ended March 31, 2026.
On September 13, 2022, Corteva, Inc. announced that its Board of Directors authorized a $2 billion share repurchase program to purchase Corteva, Inc.'s common stock, par value $0.01 per share, without an expiration date (“2022 Share Buyback Plan”). The timing, price and volume of purchases were based on market conditions, relevant securities laws and other factors. The company completed the 2022 Share Buyback Plan during the second quarter of 2025 and repurchased and retired 7,815,000, 17,909,000, and 10,026,000 shares in the open market and through privately-negotiated transactions for a cost (excluding excise taxes) of $500 million, $1 billion and $500 million during the years ended December 31, 2025, 2024 and 2023, respectively.
For the first half of 2026, the company expects repurchases of approximately $500 million under the 2024 Share Buyback Plan discussed above. The total amount, timing, manner, price and volume of purchases will be based on market conditions, relevant securities laws and other market and company specific factors.
See Note 13 - Stockholders’ Equity, to the interim Consolidated Financial Statements, for additional information related to the share buyback plans.
Summary of Cash Flows - Years ended December 31, 2025, 2024, and 2023
|
|
|
|
|
|
|
|
|
|
|
|
|
|
For the Year Ended December 31, |
|
(In millions) |
2025 |
|
2024 |
|
2023 |
|
Cash provided by (used for) operating activities – continuing operations |
|
$ |
3,457 |
|
|
$ |
2,296 |
|
|
$ |
1,809 |
|
Cash provided by (used for) operating activities – continuing operations for the year ended December 31, 2025 was $3,457 million compared to $2,296 million for the year ended December 31, 2024. The change was primarily driven by higher net income, favorable changes in customer prepayments and collections, and favorable changes in accounts payable due to lower payments to third-party growers resulting from lower commodity costs and planted area, partially offset by an unfavorable change in inventories due to a lower comparable decline in volumes and the sale of lower-cost inventory in the current year.
Cash provided by (used for) operating activities – continuing operations for the year ended December 31, 2024 was $2,296 million compared to $1,809 million for the year ended December 31, 2023. The change was primarily driven by favorable changes in working capital. The favorable changes in inventories were driven by production reductions to match demand. Within accounts payable, lower payments to third-party growers resulted from lower commodity costs and production plans, supplemented by a change in inventory purchasing patterns. Accrued and other current liabilities benefited from a decrease in soybean royalties, while noncurrent assets and liabilities benefited from derivative settlements driven by a weaker Brazilian Real currency. These movements were partially offset by unfavorable changes in receivables driven by slower collections and higher sales on credit terms.
|
|
|
|
|
|
|
|
|
|
|
|
|
|
For the Year Ended December 31, |
|
(In millions) |
2025 |
|
2024 |
|
2023 |
|
Cash provided by (used for) operating activities – discontinued operations |
|
$ |
(51 |
) |
|
$ |
(151 |
) |
|
$ |
(40 |
) |
Cash provided by (used for) operating activities – discontinued operations for the years ended December 31, 2025 and 2024 was $(51) million and $(151) million, respectively. The cash outflows were primarily related to PFAS activities that are subject to the MOU with Chemours and DuPont associated with environmental remediation activities primarily at Chemours' Fayetteville Works facility. In addition, the disbursement of cash held in the Water District Settlement Fund is reflected in the year ended December 31, 2024.
Cash provided by (used for) operating activities – discontinued operations for the years ended December 31, 2024 and 2023 was $(151) million and $(40) million, respectively. The cash outflows were primarily related to PFAS activities that are subject to the MOU with Chemours and DuPont associated with environmental remediation activities primarily at Chemours’ Fayetteville Works facility. In addition, the disbursement of the cash held in the Water District Settlement Fund is reflected in the year ended December 31, 2024. These outflows were partially offset by the receipt of insurance proceeds related to legacy matters.
|
|
|
|
|
|
|
|
|
|
|
|
|
|
For the Year Ended December 31, |
|
(In millions) |
2025 |
|
2024 |
|
2023 |
|
Cash provided by (used for) investing activities |
|
$ |
(543 |
) |
|
$ |
(589 |
) |
|
$ |
(1,987 |
) |
Cash provided by (used for) investing activities was $(543) million for the year ended December 31, 2025 compared to $(589) million for the year ended December 31, 2024. The change was primarily due to lower purchases of investments and proceeds from sales of property, partially offset by higher payments to settle net investment hedges.
Cash provided by (used for) investing activities was $(589) million for the year ended December 31, 2024 compared to $(1,987) million for the year ended December 31, 2023. The change was primarily due to the acquisitions of Stoller and Symborg in 2023, partially offset by lower current year proceeds from sales and maturities of investments and higher proceeds from sales of property, businesses, and consolidated companies in 2023.
Capital expenditures totaled $591 million, $597 million, and $595 million for the years ended December 31, 2025, 2024 and 2023, respectively. The company expects 2026 capital expenditures to be approximately $600 million.
|
|
|
|
|
|
|
|
|
|
|
|
|
|
For the Year Ended December 31, |
|
(In millions) |
2025 |
|
2024 |
|
2023 |
|
Cash provided by (used for) financing activities |
|
$ |
(1,644 |
) |
|
$ |
(1,199 |
) |
|
$ |
(99 |
) |
Cash provided by (used for) financing activities was $(1,644) million for the year ended December 31, 2025 compared to $(1,199) million for the year ended December 31, 2024. The change was primarily due to lower borrowings in 2025, and higher dividend payments and share repurchases.
Cash provided by (used for) financing activities was $(1,199) million for the year ended December 31, 2024 compared to $(99) million for the year ended December 31, 2023. The change was primarily due lower required borrowings in 2024 to fund working capital needs, capital spending, dividend payments and share repurchases. In addition, there were additional borrowings in 2023 to partially fund the Stoller and Symborg acquisitions. These lower current year borrowings were offset by higher payments on debt and higher repurchases of common stock and paid dividends in 2024.
During 2025, the company's Board of Directors authorized and paid quarterly dividends on its common stock of $0.17 in the first and second quarters and $0.18 in third and fourth quarters, respectively.
On November 19, 2024, Corteva, Inc. announced that its Board of Directors authorized a $3 billion share repurchase program to purchase Corteva, Inc.'s common stock, par value $0.01 per share, without an expiration date ("2024 Share Buyback Plan"). The timing, price and volume of purchases will be based on market conditions, relevant securities laws and other factors. In connection with the 2024 Share Buyback Plan, the company repurchased and retired 8,318,000 shares in the open market for a cost (excluding excise taxes) of $571 million during the year ended December 31, 2025.
On September 13, 2022, Corteva, Inc. announced that its Board of Directors authorized a $2 billion share repurchase program to purchase Corteva, Inc.'s common stock, par value $0.01 per share, without an expiration date ("2022 Share Buyback Plan"). The company completed the 2022 Share Buyback Plan during the second quarter of 2025 and repurchased and retired 7,815,000, 17,909,000 and 10,026,000 shares in the open market and through privately-negotiated transactions for a cost (excluding excise taxes) of $500 million, $1 billion and $500 million during the year ended December 31, 2025, 2024 and 2023, respectively.
On August 5, 2021, the company's Board of Directors authorized a $1.5 billion share repurchase program to purchase Corteva, Inc.'s common stock, par value $0.01 per share, without an expiration date (“2021 Share Buyback Plan”). The company completed the 2021 Share Buyback Plan during the first quarter of 2023 and repurchased and retired 4,098,000, 17,425,000 and 5,572,000 shares in the open market for a total cost of $250 million, $1 billion, and $250 million during the years ended December 31, 2023, 2022 and 2021, respectively.
For the first half of 2026, the company expects repurchases of approximately $500 million under the 2024 Share Buyback Plan discussed above. The total amount, timing, price and volume of purchases will be based on market conditions, relevant securities laws and other market and company specific factors.
See Note 16 - Stockholders' Equity, to the Corteva Consolidated Financial Statements, for additional information related to the share buyback plans.
Critical Accounting Estimates
The company's significant accounting policies are more fully described in Note 2 - Summary of Significant Accounting Policies, to the Corteva Consolidated Financial Statements. Management believes that the application of these policies on a consistent basis enables the company to provide the users of the financial statements with useful and reliable information about the company's operating results and financial condition.
The preparation of the Corteva Consolidated Financial Statements in conformity with generally accepted accounting principles ("GAAP") in the United States of America requires management to make estimates and assumptions that affect the reported amounts, including, but not limited to, receivable and inventory valuations, impairment of tangible and intangible assets, long-term employee benefit obligations, income taxes, environmental matters and litigation. Management's estimates are based on historical experience, facts and circumstances available at the time and various other assumptions that are believed to be reasonable. The company reviews these matters and reflects changes in estimates as appropriate. Management believes that the following represent the more critical judgment areas in the application of the company's accounting policies which could have a material effect on the company's financial position, liquidity or results of operations.
Pension Plans and Other Post-Employment Benefits
Accounting for employee benefit plans involves assumptions and estimates. Discount rate and expected long-term rate of return on plan assets are two critical assumptions in measuring the cost and benefit obligation of the company's pension and other post-employment benefit ("OPEB") plans. Management reviews these two key assumptions when plans are re-measured. These and other assumptions are updated periodically to reflect the actual experience and expectations on a plan specific basis as appropriate. As permitted by GAAP, actual results that differ from the assumptions are accumulated on a plan by plan basis and to the extent that such differences exceed 10 percent of the greater of the plan's benefit obligation or the applicable plan assets, the excess is amortized over the average remaining service period of active employees or the average remaining life expectancy of plan participants if all or almost all of a plan’s participants are inactive.
Most of the company's benefit obligation for pensions and OPEB plans are attributable to the U.S. benefit plans. For U.S. benefit plans, the single equivalent discount rate is developed by matching the expected cash flow of the benefit plans to a yield curve constructed from a portfolio of high quality fixed-income instruments provided by the plans' actuaries as of the measurement date. The company measures the service and interest cost components utilizing a full yield curve approach by applying the specific spot rates along the yield curve used in the determination of the benefit obligation to the relevant projected cash flows. For the non-U.S. benefit plans, the company primarily utilizes prevailing long-term high quality corporate bond indices to determine the discount rate, applicable to each country, at the measurement date. The weighted average discount rates used in developing the expected 2026 net periodic pension and OPEB costs were 5.31 percent and 5.14 percent, respectively.
For the U.S. plan, the company establishes strategic asset allocation percentage targets and appropriate benchmarks for significant asset classes with the aim of achieving a prudent balance between return and risk. Where appropriate, asset-liability studies are also taken into consideration. The expected long-term rate of return on plan assets is based upon historical real returns (net of inflation) for the asset classes covered by the investment policy, expected performance, and projections of inflation and interest rates over the long-term period during which benefits are payable to plan participants. In determining the 2025 net periodic pension cost in the U.S., an assumption of 6.00 percent for expected long-term rate of return on plan assets was used. After re-evaluating the current strategic asset allocation and market conditions, the company maintained the expected long-term rate of return on plan assets assumption at 6.00 percent to be used in determining the 2026 net periodic pension cost in the U.S. Consistent with prior years, the expected long-term rate of return on plan assets in the U.S. reflects the asset allocation of the plan and the effect of the company's active management of the plan's assets. For the non-U.S. plans, the strategic asset allocations are selected in accordance with the laws and practices for each country.
In determining annual expense for the principal U.S. pension plan, the company uses a market-related value of assets rather than the fair value. Accordingly, there may be a lag in recognition of changes in market valuation. As a result, changes in the fair value of assets are not immediately reflected in the company's calculation of net periodic pension cost. For the years ended December 31, 2025, 2024 and 2023, the market-related value of assets is calculated by averaging market returns over 36 months.
The following table shows the market-related value and fair value of plan assets for the principal U.S. pension plan:
|
|
|
|
|
|
|
|
|
|
|
|
|
(In billions) |
December 31, 2025 |
|
December 31, 2024 |
|
December 31, 2023 |
|
Market-related value of assets |
|
$ |
10.0 |
|
|
$ |
10.6 |
|
|
$ |
11.9 |
|
Fair value of plan assets |
|
$ |
10.0 |
|
|
$ |
10.4 |
|
|
$ |
11.4 |
|
For plans other than the principal U.S. pension plan, pension expense is determined using the fair value of assets.
The following table highlights the potential impact on the company's pre-tax earnings due to changes in certain key assumptions with respect to the company's pension and OPEB plans, based on assets and liabilities at December 31, 2025:
|
|
|
|
|
|
|
|
|
Pre-tax Earnings Benefit (Charge) |
1/4 Percentage |
|
1/4 Percentage |
|
|
Point |
|
Point |
|
(Dollars in millions) |
Increase |
|
Decrease |
|
Discount rate |
|
$ |
(15 |
) |
|
$ |
16 |
|
Expected rate of return on plan assets |
|
$ |
24 |
|
|
$ |
(24 |
) |
Additional information with respect to pension and OPEB expenses, liabilities and assumptions is discussed under "Long-Term Employee Benefits" beginning on page 93 and in Note 17 - Pension Plans and Other Post-Employment Benefits, to the Corteva Consolidated Financial Statements.
Environmental Matters
Accruals for environmental matters are recorded when it is probable that a liability has been incurred and the amount of the liability can be reasonably estimated. At December 31, 2025, the company had accrued obligations of $562 million for probable environmental remediation and restoration costs, including $49 million for the remediation of Superfund sites. As remediation activities vary substantially in duration and cost from site to site, it is difficult to develop precise estimates of future site remediation costs. The company's estimates are based on a number of factors, including the complexity of the geology, the nature and extent of contamination, the type of remedy, the outcome of discussions with regulatory agencies and other Potentially Responsible Parties ("PRPs") at multi-party sites and the number of and financial viability of other PRPs. Therefore, considerable uncertainty exists with respect to environmental remediation and costs, and, under adverse changes in circumstances, it is reasonably possible that the ultimate cost with respect to these particular matters could range up to approximately $553 million above the accrued obligations amount. Consequently, it is reasonably possible that environmental remediation and restoration costs in excess of amounts accrued could have a material impact on the company’s results of operations, financial condition and cash flows. For further discussion, see the "Environmental Matters" section on page 94 and Note 15 - Commitments and Contingent Liabilities, to the Corteva Consolidated Financial Statements.
Legal Contingencies
The company's results of operations could be affected by significant litigation adverse to the company, including product liability claims, patent infringement and antitrust claims, and claims for third-party property damage or personal injury stemming from alleged environmental torts. The company records accruals for legal matters when the information available indicates that it is probable that a liability has been incurred and the amount of the loss can be reasonably estimated. Management makes adjustments to these accruals to reflect the impact and status of negotiations, settlements, rulings, advice of counsel and other information and events that may pertain to a particular matter. Predicting the outcome of claims and lawsuits and estimating related costs and exposure involves substantial uncertainties that could cause actual costs to vary materially from estimates. In making determinations of likely outcomes of litigation matters, management considers many factors. These factors include, but are not limited to, the nature of specific claims including unasserted claims, the company's experience with similar types of claims, the jurisdiction in which the matter is filed, input from outside legal counsel, the likelihood of resolving the matter through alternative dispute resolution mechanisms, and the matter's current status. Considerable judgment is required in determining whether to establish a litigation accrual when an adverse judgment is rendered against the company in a court proceeding. In such situations, the company will not recognize a loss if, based upon a thorough review of all relevant facts and information, management believes that it is probable that the pending judgment will be successfully overturned on appeal. A detailed discussion of significant litigation matters is contained in Note 15- Commitments and Contingent Liabilities, to the Corteva Consolidated Financial Statements.
Indemnification Assets
The company has entered into various agreements where the company is indemnified for certain liabilities by DuPont, Dow and Chemours. The term of this indemnification is generally indefinite and includes defense costs and expenses, as well as monetary and non-monetary settlements and judgments. In connection with the recognition of liabilities related to these matters, the company records an indemnification asset when recovery is deemed probable. In assessing the probability of recovery, the company considers the contractual rights under the separation agreements and any potential credit risk. Future events, such as potential disputes related to recovery as well as the solvency of DuPont, Dow and/or Chemours, could cause the indemnification assets to have a lower value than anticipated and recorded. The company evaluates the recovery of the indemnification assets recorded when events or changes in circumstances indicate the carrying values may not be fully recoverable. See Note 15 - Commitments and Contingent Liabilities, to the Corteva Consolidated Financial Statements, for additional information related to indemnifications.
Income Taxes
The breadth of the company's operations and the global complexity of tax regulations require assessments of uncertainties and judgments in estimating taxes the company will ultimately pay. The final taxes paid are dependent upon many factors, including negotiations with taxing authorities in various jurisdictions, outcomes of tax litigation and resolution of disputes arising from federal, state and international tax audits in the normal course of business. The resolution of these uncertainties may result in adjustments to the company's tax assets and tax liabilities. It is reasonably possible that changes to the company’s global unrecognized tax benefits could be significant; however, due to the uncertainty regarding the timing of completion of audits and possible outcomes, a current estimate of the range of increases or decreases that may occur within the next twelve months cannot be made.
Deferred income taxes result from differences between the financial and tax basis of the company's assets and liabilities and are adjusted for changes in tax rates and tax laws when changes are enacted. Valuation allowances are recorded to reduce deferred tax assets when it is more likely than not that a tax benefit will not be realized. Significant judgment is required in evaluating the need for and magnitude of appropriate valuation allowances against deferred tax assets. The realization of these assets is dependent on generating future taxable income, as well as successful implementation of various tax planning strategies. For example, changes in facts and circumstances that
alter the probability that the company will realize deferred tax assets could result in recording a valuation allowance, thereby reducing the deferred tax asset and generating a deferred tax expense in the relevant period. In some situations, these changes could be material.
At December 31, 2025, the company had a net deferred tax asset balance of $69 million, inclusive of a valuation allowance of $887 million. Realization of deferred tax assets is expected to occur over an extended period of time. As a result, changes in tax laws, assumptions with respect to future taxable income, and tax planning strategies could result in adjustments to deferred tax assets.
See Note 7 - Income Taxes, to the Corteva Consolidated Financial Statements, for additional information.
Valuation of Assets and Impairment Considerations
The assets and liabilities of acquired businesses are measured at their estimated fair values at the dates of acquisition. The excess of the purchase price over the estimated fair value of the net assets acquired, including identified intangible assets, is recorded as goodwill. The determination and allocation of fair value to the assets acquired and liabilities assumed is based on various assumptions and valuation methodologies requiring considerable management judgment, including estimates based on historical information, current market data and future expectations. The principal assumptions utilized in the company's valuation methodologies include revenue growth rates, EBITDA margin estimates, royalty rates, and discount rates. Although the estimates are deemed reasonable by management based on information available at the dates of acquisition, those estimates are inherently uncertain.
Assessment of the potential impairment of goodwill, other intangible assets, property, plant and equipment, investments in nonconsolidated affiliates, and other assets is an integral part of the company's normal ongoing review of operations. Testing for potential impairment of these assets is significantly dependent on numerous assumptions and reflects management's best estimates at a particular point in time. The dynamic economic environment in which the company's segments operate, and key economic and business assumptions with respect to projected selling prices, market growth and inflation rates, can significantly affect the outcome of impairment tests. Estimates based on these assumptions may differ significantly from actual results. Changes in factors and assumptions used in assessing potential impairments can have a significant impact on the existence and magnitude of impairments, as well as the time at which such impairments are recognized. In addition, the company continually reviews its portfolio of assets to ensure they are achieving their greatest potential and are aligned with the company's growth strategy. Strategic decisions involving a particular group of assets may trigger an assessment of the recoverability of the related assets. Such an assessment could result in impairment losses.
The company tests goodwill and other indefinite-lived intangible assets for impairment annually (during the fourth quarter), or more frequently when events or changes in circumstances indicate it is more likely than not that the fair value of a reporting unit has declined below its carrying value. Goodwill is evaluated for impairment using qualitative and/or quantitative testing procedures. The company performs goodwill impairment testing at the reporting unit level, which is defined as the operating segment or one level below the operating segment. One level below the operating segment, or component, is a business in which discrete financial information is available and regularly reviewed by segment management. The company aggregates certain components into reporting units based on economic similarities. The company’s reporting units are Seed and Crop Protection.
For purposes of goodwill impairment testing, the company has the option to first perform qualitative testing to determine whether it is more likely than not that the fair value of a reporting unit is less than its carrying value. Qualitative factors assessed at the company level include GDP growth rates, long-term commodity prices, equity and credit market activity, discount rates, and overall financial performance. Qualitative factors assessed at the reporting unit level include changes in industry and market structure, competitive environments and new product launches, cost factors such as raw material prices, and financial performance of the reporting unit. If the company chooses not to complete a qualitative assessment for a given reporting unit or if the initial assessment indicates that it is more likely than not that the carrying value of a reporting unit exceeds its estimated fair value, additional quantitative testing is required.
If additional quantitative testing is required, the reporting unit’s fair value is compared with its carrying amount, and an impairment charge, if any, is recognized for the amount by which the carrying amount exceeds the reporting unit’s fair value, limited to the amount of goodwill associated with the reporting unit. The company determines fair values for each of the reporting units using a discounted cash flow model (a form of the income approach), utilizing Level 3 unobservable inputs.
Under the income approach, fair value is determined based on the present value of estimated future cash flows, discounted at an appropriate risk-adjusted rate. The company’s significant assumptions in these analyses include future cash flow projections, weighted average cost of capital, the terminal growth rate and the tax rate. The company’s estimates of future cash flows are based on current regulatory and economic climates, recent operating results, and assumed business strategy from a market participant perspective and includes an estimate of long-term future growth rates based on such strategy. Actual results may differ from those assumed in the company’s forecasts. The company derives its discount rates using a capital asset pricing model and analyzes published rates for industries relevant to its reporting units to estimate the cost of equity financing. The company uses discount rates that are commensurate with the risks and uncertainty inherent in the respective reporting units and in its internally developed forecasts.
Estimating the fair value of reporting units requires the use of estimates and significant judgments that are based on a number of factors including actual operating results. It is reasonably possible that the judgments and estimates described above could change in future periods. The company believes the current assumptions and estimates utilized are both reasonable and appropriate. Based on the qualitative annual goodwill impairment analyses performed in the fourth quarter of 2025, it was concluded more likely than not that the fair value of each reporting unit exceeded its respective carrying value and, therefore, a quantitative test was not performed. No goodwill impairment charge was necessary.
Off-Balance Sheet Arrangements
Certain Guarantee Contracts
Information with respect to the company's guarantees is included in Note 15 - Commitments and Contingent Liabilities, to the Corteva Consolidated Financial Statements. Historically, the company has not made significant payments to satisfy guarantee obligations; however, the company believes it has the financial resources to satisfy these guarantees.
MOU Escrow Contributions
On January 22, 2021, Chemours, DuPont, Corteva and EIDP entered into a binding memorandum of understanding containing a settlement to resolve legal disputes originating from the Delaware Litigation and Pending Arbitration, and to establish a cost sharing arrangement for potential future legacy per- and polyfluoroalkyl substances (“PFAS”) liabilities arising out of pre-July 1, 2015 conduct (the “MOU”). Under the terms of the MOU, Corteva’s estimated aggregate share of the potential $2 billion is approximately $600 million. In order to support and manage any potential future PFAS liabilities, the parties have also agreed to establish an escrow account ("MOU Escrow Account"). The MOU provides that contributions to the MOU Escrow Account will be made by Chemours, DuPont and Corteva, annually over an eight-year period through 2028. Over this period, Chemours will deposit a total of $500 million in the account and DuPont and Corteva, together, will deposit an additional $500 million pursuant to the terms of the Letter Agreement. Additionally, if on December 31, 2028, the balance of the MOU Escrow Account (including interest) is less than $700 million, Chemours will make 50% of the deposits and DuPont and Corteva, together, will make 50% of the deposits necessary to restore the balance of the escrow account to $700 million pursuant to the terms of the Letter Agreement.
The company made its annual installment deposits due to the MOU Escrow Account through December 31, 2025, when considering the 2023 waiver and 2025 suspension pursuant to supplemental agreements to the MOU executed by Chemours, DuPont and Corteva as certain conditions were met. See Note 15- Commitments and Contingent Liabilities, to the Corteva Consolidated Financial Statements, for further details on the MOU and funding of the MOU Escrow Account.
Contractual Obligations
Our principal commitments consist of long-term debt, operating and finance lease obligations and environmental remediation obligations. See Note 14 - Short-Term Borrowings, Long-Term Debt and Available Credit Facilities, Note 13 – Leases, and Note 15 - Commitments and Contingent Liabilities, to the Corteva Consolidated Financial Statements, respectively, for further discussion.
Information related to the company's other significant contractual obligations are summarized in the following table:
|
|
|
|
|
|
|
|
|
|
|
|
|
|
|
|
Payments Due In |
|
(In millions) |
Total at
December 31, 2025 |
|
2026 |
|
2027 and
beyond |
|
Expected cumulative cash requirements for interest payments
through maturity |
|
$ |
515 |
|
|
$ |
89 |
|
|
$ |
426 |
|
Purchase obligations1 |
|
|
2,022 |
|
|
|
821 |
|
|
|
1,201 |
|
License agreements2,3 |
|
|
160 |
|
|
|
46 |
|
|
|
114 |
|
Other liabilities2,4 |
|
|
276 |
|
|
|
44 |
|
|
|
232 |
|
Total 5 |
|
$ |
2,973 |
|
|
$ |
1,000 |
|
|
$ |
1,973 |
|
1.Represents enforceable and legally binding agreements in excess of $1 million to purchase goods or services that specify fixed or minimum quantities; fixed, minimum or variable price provisions; and the approximate timing of the agreement.
2.Included in the Corteva Consolidated Financial Statements.
3.Represents undiscounted remaining payments under Pioneer license agreements (approximately $145 million on a discounted basis).
4.Includes liabilities related to employee-related benefits other than pension and other post-employment benefits, asset retirement obligations and other noncurrent liabilities.
5.Due to uncertainty regarding the completion of tax audits and possible outcomes, the timing of certain payments of obligations related to unrecognized tax benefits cannot be made and have been excluded from the table above. See Note 7 - Income Taxes, to the Corteva Consolidated Financial Statements, for additional detail.
The company expects to meet its contractual obligations through its normal sources of liquidity and believes it has the financial resources to satisfy the contractual obligations that arise in the ordinary course of business.
Long-Term Employee Benefits
The company has various obligations to its employees and retirees. The company maintains retirement-related programs in many countries that have a long-term impact on the company's earnings and cash flows. These plans are typically defined benefit pension plans, as well as medical, dental and life insurance benefits for pensioners and survivors and disability benefits for employees ("other post-employment benefits" or "OPEB"). Substantially all of the company's worldwide benefit obligation for pensions and OPEB obligations are attributable to the U.S. benefit plans.
Pension coverage for employees of the company's non-U.S. consolidated subsidiaries is provided, to the extent deemed appropriate, through separate plans. The company regularly explores alternative solutions to meet its global pension obligations in the most cost-effective manner possible as demographics, life expectancy and country-specific pension funding rules change. Where permitted by applicable law, the company reserves the right to change, modify or discontinue its plans that provide pension, medical, dental, life insurance and disability benefits.
Benefits under defined benefit pension plans are based primarily on years of service and employees' pay near retirement. In November 2016, the company announced changes to the U.S. pension and OPEB plans, and on November 30, 2018, the company froze the pay and service amounts used to calculate pension benefits for active employees who participate in the U.S. pension plans, resulting in the participants no longer accruing additional benefits. In addition, OPEB eligible employees who were under the age of 50 as of November 30, 2018 will not receive post-employment medical, dental and life insurance benefits. The majority of employees hired in the U.S. on or after January 1, 2007 are not eligible to participate in the pension and post-employment medical, dental and life insurance plans, but are eligible to participate in the defined contribution plans.
In December 2020, the company amended its retiree medical, dental and life insurance plans resulting in the company no longer providing retiree dental and life insurance benefits effective January 1, 2022 and Corteva’s portion of the cost of non-Medicare retiree medical coverage no longer being adjusted for cost increases, which capped the Corteva cost at the level as of December 31, 2021 ("2020 OPEB Plan Amendments").
Pension benefits are paid primarily from trust funds established to comply with applicable laws and regulations. The actuarial assumptions and procedures utilized are reviewed periodically by the plans' actuaries to provide reasonable assurance that there will be adequate funds for the payment of benefits. The company did not make contributions to the principal U.S. pension plan for the years ended December 31, 2025, 2024 or 2023.
Funding for each pension plan other than the principal U.S. pension plan is governed by the rules of the sovereign country in which it operates. Thus, there is not necessarily a direct correlation between pension funding and pension expense. In general, however, improvements in plans' funded status tend to moderate subsequent funding needs. The company contributed $5 million, $5 million and
$5 million to its funded pension plans other than the principal U.S. pension plan for the years ended December 31, 2025, 2024 and 2023, respectively.
U.S. pension benefits that exceed federal limitations are covered by separate unfunded plans and these benefits are paid to pensioners and survivors from operating cash flows. The company's remaining pension plans with no plan assets are paid from operating cash flows. The company made benefit payments of $34 million, $45 million, and $47 million to its unfunded plans for the years ended December 31, 2025, 2024 and 2023, respectively.
The company's OPEB plans are unfunded and the cost of the approved claims is paid from operating cash flows. Pre-tax cash requirements to cover actual net claims costs and related administrative expenses were $96 million, $101 million, and $97 million for the years ended December 31, 2025, 2024 and 2023, respectively. Changes in cash requirements reflect the net impact of per capita health care cost, demographic changes, plan amendments and changes in participant premiums, co-pays and deductibles.
In 2026, the company expects to contribute approximately $40 million to its pension plans other than the principal U.S. pension plan and approximately $100 million to its OPEB plans. In planning for the spin-off, including the future capital structures of the two new companies, the company expects to evaluate discretionary contributions to its principal U.S. pension plan in 2026.
The company's income can be significantly affected by pension and defined contribution benefits as well as OPEB costs. The following table summarizes the extent to which the company's income (loss) from continuing operations before income taxes for the years ended December 31, 2025, 2024 and 2023 was affected by pre-tax charges related to long-term employee benefits:
|
|
|
|
|
|
|
|
|
|
|
|
|
|
For the Year Ended December 31, |
|
(In millions) |
2025 |
|
2024 |
|
2023 |
|
Net periodic benefit (credit) cost - pension and OPEB |
|
$ |
36 |
|
|
$ |
160 |
|
|
$ |
138 |
|
Defined contributions |
|
|
150 |
|
|
|
146 |
|
|
|
146 |
|
Long-term employee benefit plan (credit) charges - continuing operations |
|
$ |
186 |
|
|
$ |
306 |
|
|
$ |
284 |
|
The above (credit) charges for pension and OPEB are determined as of the beginning of each period. Long-term employee benefit plan (credits) costs were $186 million and $306 million for the years ended December 31, 2025 and 2024, respectively. The change is mainly due to the increase in the expected long-term rate of return on plan assets assumption for the U.S plan net of the increase in the discount rates. See "Pension Plans and Other Post-Employment Benefits" under the Critical Accounting Estimates section beginning on page 89 of this report for additional information on determining annual expense.
For 2026, long-term employee benefit costs are expected to decrease by approximately $50 million. The change is mainly due to the decrease in the discount rates.
Environmental Matters
The company operates global manufacturing, product handling and distribution facilities that are subject to a broad array of environmental laws and regulations. Such rules are subject to change by the implementing governmental agency, and the company monitors these changes closely. Company policy requires that all operations fully meet or exceed legal and regulatory requirements. In addition, the company implements voluntary programs to reduce air emissions, minimize the generation of hazardous waste, decrease the volume of water use and discharges, increase the efficiency of energy use and reduce the generation of persistent, bioaccumulative and toxic materials. Management has noted a global upward trend in the amount and complexity of proposed chemicals regulation. The costs to comply with complex environmental laws and regulations, as well as internal voluntary programs and goals, are significant and will continue to be significant for the foreseeable future.
Pre-tax environmental expenses charged to income (loss) from continuing operations before income taxes are summarized below:
|
|
|
|
|
|
|
|
|
|
|
|
|
|
For the Year Ended December 31, |
|
(In millions) |
2025 |
|
2024 |
|
2023 |
|
Environmental operating costs |
|
$ |
155 |
|
|
$ |
168 |
|
|
$ |
178 |
|
Environmental remediation costs 1 |
|
|
67 |
|
|
|
42 |
|
|
|
47 |
|
|
|
$ |
222 |
|
|
$ |
210 |
|
|
$ |
225 |
|
1.Environmental remediation costs include costs that are subject to the $200 million threshold and sharing arrangements as discussed in Note 15 - Commitments and Contingent Liabilities, to the Corteva Consolidated Financial Statements, under the header Corteva Separation Agreement.
Environmental Operating Costs
As a result of its operations, the company incurs costs for pollution abatement activities including waste collection and disposal, installation and maintenance of air pollution controls and wastewater treatment, emissions testing and monitoring, and obtaining permits. The company also incurs costs related to environmental related research and development activities including environmental field and treatment studies as well as toxicity and degradation testing to evaluate the environmental impact of products and raw materials.
Approximately 85 percent of total pre-tax environmental operating costs charged to income (loss) from continuing operations for the year ended December 31, 2025 resulted from operations in the U.S. Based on existing facts and circumstances, management does not believe that year-over-year changes, if any, in environmental operating costs charged to current operations will have a material impact on the company's financial position, liquidity or results of operations. Annual expenditures in the near term are not expected to vary significantly from the range of such expenditures experienced in the past few years. Over the longer term, expenditures are subject to considerable uncertainty and may fluctuate significantly.
Remediation Accrual
Changes in the remediation accrual balance are summarized below:
|
|
|
|
|
(In millions) |
|
|
Balance at December 31, 2023 |
|
$ |
501 |
|
Remediation payments 1 |
|
|
(58 |
) |
Net increase in remediation accrual 1 |
|
|
42 |
|
Net change, indemnification 2 |
|
|
(7 |
) |
Balance at December 31, 2024 |
|
$ |
478 |
|
Remediation payments 1 |
|
|
(40 |
) |
Net increase in remediation accrual 1 |
|
|
67 |
|
Net change, indemnification 2 |
|
|
57 |
|
Balance at December 31, 2025 3 |
|
$ |
562 |
|
1.Environmental remediation activity relates to Corteva-specific sites, along with accruals and payments made that are subject to the Corteva Separation Agreement as discussed in Note 15 - Commitments and Contingent Liabilities, to the Corteva Consolidated Financial Statements.
2.Represents the net change in indemnified remediation obligations. Substantially all relates to activity pursuant to the Chemours Separation Agreement and subsequent MOU, as discussed in Note 15 - Commitments and Contingent Liabilities, to the Corteva Consolidated Financial Statements, in which EIDP is indemnified by Chemours and DuPont for certain environmental matters.
3.Includes accrued obligations of $137 million due in the next twelve months with the remainder being due subsequent to 2025.
Considerable uncertainty exists with respect to environmental remediation costs and, under adverse changes in circumstances, the potential liability may range up to approximately $553 million above the amount accrued as of December 31, 2025. See Note 15 – Commitments and Contingent Liabilities, to the Corteva Consolidated Financial Statements, for further details on the company’s accrued obligations at December 31, 2025.
As of December 31, 2025, the company has been notified of potential liability under the Comprehensive Environmental Response, Compensation and Liability Act ("Superfund") or similar state laws at approximately 500 sites around the U.S., including approximately 80 sites for which the company does not believe it has liability based on current information. Active remediation is under way at approximately 60 of the 500 sites. In addition, the company has resolved its liability at about 212 sites, either by completing remedial actions with other PRPs or by participating in "de minimis buyouts" with other PRPs whose waste, like the company's, represented only a small fraction of the total waste present at a site. There were no new notices in 2025 and 2024.
Environmental Capital Expenditures
Capital expenditures for environmental projects, either required by law or necessary to meet the company’s internal environmental goals, were approximately $9 million for the year ended December 31, 2025. The company currently estimates expenditures for environmental-related capital projects to be approximately $14 million in 2026.
Climate Impact
Shifts in climate are an important global environmental concern that presents risks and opportunities to the company, of which the Sustainability and Innovation Committee of the company’s Board of Directors maintains oversight. Management regularly assesses and manages climate-related issues. The company integrates processes for identifying, assessing and managing climate-related risk into its enterprise risk management program. Across its business, individuals who are responsible for climate-related initiatives may have annual performance goals tied to the delivery of projects related to these initiatives.
Extreme and volatile weather events, which may be amplified by, or become more frequent with, climate change may have an adverse impact on our customers’ ability to use the company's products and seed supply, potentially reducing sales volumes, revenues and margins. These events may also shift or exacerbate existing pest and disease pressures. These pressures, along with the desire for climate-smart and climate-resilient technologies may present opportunities for the company to meet these shifting demands. Therefore, the company invests in enabling innovation that can create a more resilient agriculture value chain, while also working to reduce greenhouse gas emissions through cost effective operational improvements.
QUANTITATIVE AND QUALITATIVE DISCLOSURES ABOUT MARKET RISK
The company’s global operations are exposed to financial market risks relating to fluctuations in foreign currency exchange rates, commodity prices and interest rates. The company has established a variety of programs including the use of derivative instruments and other financial instruments to manage the exposure to financial market risks as to minimize volatility of financial results. In the ordinary course of business, the company enters into derivative instruments to hedge its exposure to foreign currency and commodity price risks under established procedures and controls. For additional information on these derivatives and related exposures, see Note 19 - Financial Instruments, to the Corteva Consolidated Financial Statements. Decisions regarding whether or not to hedge a given commitment are made on a case-by-case basis, taking into consideration the amount and duration of the exposure, market volatility and economic trends. Foreign currency exchange contracts may be used, from time to time, to manage near-term foreign currency cash requirements.
Foreign Currency Exchange Rate Risks
The company has significant international operations resulting in a large number of currency transactions that result from international sales, purchases, investments and borrowings. The primary currencies for which the company has an exchange rate exposure are the Brazilian real, Euro, Canadian dollar and Argentine peso. The company uses foreign exchange contracts, where possible, to offset its net exposures, by currency, related to the foreign currency denominated monetary assets and liabilities of its operations. The company also uses foreign currency exchange contracts to offset a portion of the company's exposure to certain forecasted transactions, investment in foreign subsidiaries, as well as the translation of foreign currency-denominated earnings and uses commodity contracts to offset risks associated with foreign currency devaluation in certain countries. In addition to the contracts disclosed in Note 19 - Financial Instruments, to the Consolidated Financial Statements, from time to time, the company may enter into foreign currency exchange contracts to establish with certainty the U.S. Dollar ("USD") amount of future firm commitments denominated in a foreign currency.
The following table illustrates the fair values of outstanding foreign currency contracts at December 31, 2025 and 2024, and the effect on fair values of a hypothetical adverse change in the foreign exchange rates that existed at December 31, 2025 and 2024. The sensitivities for foreign currency contracts are based on a 10 percent adverse change in foreign exchange rates.
|
|
|
|
|
|
|
|
|
|
|
|
|
|
|
|
|
|
Fair Value |
|
Fair Value |
|
|
(Liability)/Asset |
|
Sensitivity |
|
(In millions) |
2025 |
|
2024 |
|
2025 |
|
2024 |
|
Foreign currency contracts |
|
$ |
(13 |
) |
|
$ |
(33 |
) |
|
$ |
(471 |
) |
|
$ |
(460 |
) |
The potential gain/loss in value for each risk management portfolio described above would be offset in part by changes in the value of the underlying exposure.
Concentration of Credit Risk
The company maintains cash and cash equivalents, marketable securities, derivatives and certain other financial instruments with various financial institutions. These financial institutions are generally highly rated and geographically dispersed and the company has a policy to limit the dollar amount of credit exposure with any one institution.
As part of the company's financial risk management processes, it continuously evaluates the relative credit standing of all of the financial institutions that service Corteva and monitors actual exposures versus established limits. The company has not sustained credit losses from instruments held at financial institutions.
The company's sales are not materially dependent on any single customer. Credit risk associated with its receivables balance is representative of the geographic, industry and customer diversity associated with the company's global product lines.
The company also maintains strong credit controls in evaluating and granting customer credit. As a result, it may require that customers provide some type of financial guarantee in certain circumstances. Length of terms for customer credit varies by region.
MANAGEMENT’S DISCUSSION AND ANALYSIS OF FINANCIAL CONDITION AND RESULTS OF OPERATIONS OF THE SEED BUSINESS (SUPPLEMENTAL)
The following discussion of financial condition and results of operations for the three months ended March 31, 2026 and 2025 and the years ended December 31, 2025, 2024 and 2023 relates to the supplemental audited Combined Financial Statements of the Seed Business and the supplemental unaudited interim Combined Financial Statements of the Seed Business, which have been derived from the Consolidated Financial Statements and accounting records of Corteva using the historical results of operations and historical basis of assets and liabilities of the Seed Business. This discussion should be read in conjunction with the supplemental audited Combined Financial Statements of the Seed Business and related notes and the supplemental unaudited interim Combined Financial Statements of the Seed Business and related notes, included elsewhere in this information statement, as well as the information contained in the sections of this information statement entitled “Unaudited Pro Forma Consolidated Financial Statements,” “Notes to Unaudited Pro Forma Consolidated Financial Statements,” “Management’s Discussion and Analysis of Financial Condition and Results of Operations of Corteva” and “Business.” The following discussion and analysis includes forward looking-statements. These forward-looking statements are subject to risks, uncertainties and other factors that could cause actual results to differ materially from those expressed or implied by the forward-looking statements. Factors that could cause or contribute to these differences include, but are not limited to, those discussed elsewhere in this Information Statement. Refer to the sections of this information statement entitled “Cautionary Statement Concerning Forward-Looking Statements” and “Risk Factors” for further considerations.
Explanatory Note
Irrespective of the legal form of the spin-off in which Vylor (inclusive of the Seed Business) is the legal spinnee in the transaction, Vylor will be treated as the accounting spinnor and, therefore, will be the accounting successor to Corteva subsequent to the spin-off. Vylor has been identified as the accounting spinnor given, among other factors, Vylor’s relative significance to New Corteva. As a result, the historical Consolidated Financial Statements of Corteva will become the historical financial statements of Vylor.
This information statement also contains the historical supplemental Combined Financial Statements of the Seed Business, which were prepared on a "carve-out" basis and have been derived from the Consolidated Financial Statements and accounting records of Corteva using the historical results of operations and historical basis of assets and liabilities of the Seed Business. These supplemental Combined Financial Statements reflect the Seed Business’ combined historical results of operations, financial position and cash flows as they were historically managed. The supplemental Combined Financial Statements may not be indicative of what the results of operations, financial position and cash flows would have been had Vylor operated as a standalone company during the periods presented, nor do they reflect what the Vylor results of operations, financial position and cash flows may be in the future.
For purposes of this “Management’s Discussion and Analysis of Financial Condition and Results of Operations of the Seed Business (Supplemental)” and unless otherwise indicated or the context otherwise requires, the “company” refers to the Seed Business.
Business Overview
The Seed Business is a global leader in developing and supplying commercial seed combining advanced germplasm and traits that offer maximum yield potential, enhance sustainability and strengthen crop health for farmers around the world. The company offers seed and trait technologies that boost resilience to weather, pests, diseases, and herbicides used to manage weeds. Its digital solutions provide data-driven insights to help farmers optimize yield and profitability.
Its Pioneer® brand has a century-long track record of advanced breeding, market leadership and financial strength that is unmatched in the industry. The Seed Business, a classic growth compounder, will also leverage other opportunities, including the strength of its existing brands; its partnership with retailers through brands like Brevant®; and growing presence in the out-licensing market, which has the opportunity to unlock transformational demand.
The company's focus will expand beyond its core germplasm and trait yield improvements through its growth platforms and emerging technologies, including hybrid wheat and biofuels, as well as with the broad-based application of artificial intelligence. It will accelerate innovation by leveraging its world-class plant breeding capabilities to drive germplasm innovation and harnessing its gene editing expertise to transform its portfolio. It plans to capitalize on a deep pipeline of attractive acquisition opportunities in core and adjacent markets to accelerate growth, its presence in new, higher-growth end markets, and to strengthen its technology capabilities.
The Seed Business' operations are managed through two operating segments: Americas and Rest of World. The Company is a leader in many key seed markets, including North America corn and soybeans, Europe corn and sunflower, as well as Brazil, India, South Africa and Argentina corn.
The Spin-Off
On October 1, 2025, Corteva announced its intention to pursue, subject to the approval of the Corteva Board of Directors and any required regulatory approvals, its separation into two independent publicly traded companies - one comprising its current Crop Protection Business ("New Corteva") and the other comprising its current Seed business (“Vylor” or "the Seed Business") - by distributing all outstanding shares of Vylor (inclusive of the Seed Business) common stock to Corteva stockholders in a transaction that is intended to be a tax-free spin-off for U.S. federal income tax purposes.
Basis of Presentation
The accompanying Combined Financial Statements and notes present the results of operations, financial position, and cash flows of the Seed Business and have been derived from the consolidated financial statements and accounting records of Corteva using the historical results of operations and historical basis of assets and liabilities of the Seed Business. As the Seed Business has historically operated as an operating segment of Corteva, separate financial statements for the Seed Business have not historically been prepared. The accompanying Combined Financial Statements may not reflect the financial statements had the Seed Business been a stand-alone company. The accompanying Combined Financial Statements of the Seed Business have been prepared in accordance with accounting principles generally accepted in the United States of America (“U.S. GAAP”).
The accompanying Combined Statements of Operations include all income and expenses directly attributable to the Seed Business, along with allocations of certain expenses for services from Corteva including, but not limited to, general corporate expenses related to finance, legal, information technology, human resources, ethics and compliance, shared services, employee benefits and incentives, insurance and stock-based compensation. These expenses have been allocated on a pro rata basis using net sales as a measure. The Seed Business and Corteva consider the basis on which the expenses have been allocated to be a reasonable reflection of the utilization of services provided. Management does not believe that it is practicable to estimate the expense the Seed Business would have incurred as a stand-alone company. The amount of actual costs that may have been incurred if the Seed Business were a stand-alone company would depend on a number of factors, including the Seed Business’ chosen organizational structure, which functions were outsourced or performed by Seed Business employees, contract terms negotiated with third party providers, and strategic decisions made in areas such as information technology and infrastructure.
The accompanying Combined Balance Sheets include all assets and liabilities specifically attributable to the Seed Business and certain assets and liabilities held by Corteva that are specifically identifiable or otherwise attributable to the Seed Business. Corteva uses a centralized approach to cash management and financing of its operations, including funding of required operating and investing activities of the Seed Business. Transfers of cash between Corteva and the Seed Business are reflected within Net transfers to Parent in the accompanying Combined Statements of Cash Flows and the accompanying Combined Statements of Equity. Any cash maintained in accounts for which the Seed Business subsidiary owns and retains the right to control the cash has been recorded as cash and cash equivalents on the accompanying Combined Balance Sheets. All debt and debt-related interest cost incurred by the Seed Business as the legal obligor has been recorded in the accompanying Combined Financial Statements. Additionally, the accompanying Combined Balance Sheets include a Net Parent investment comprised of financial support received from Corteva for which repayment was not required and the net effect of cost allocations from transactions with Corteva, net of the Seed Business' accumulated earnings and any dividends paid to Corteva.
The Seed Business' operations are included in the consolidated U.S. federal, and certain state, local and foreign income tax returns filed by Corteva, where applicable. The Seed Business also files certain separate state, local and foreign income tax returns. Income tax expense and other income tax related information contained in the accompanying Combined Financial Statements are presented on a separate return basis as if the Seed Business filed its own tax returns. The Seed Business' tax results as presented in the accompanying Combined Financial Statements may not be reflective of the results that the Seed Business would generate in the future. In jurisdictions where the Seed Business has been included in the tax returns filed by Corteva, any income taxes payable resulting from the related income tax provision have been reflected in the accompanying Combined Balance Sheets within Net Parent investment.
All intercompany transactions and accounts within the Seed Business have been eliminated in the accompanying Combined Financial Statements. Transactions between the Seed Business and Corteva are deemed to have been settled in the period incurred through Net Parent investment, the net effect of which is reflected within financing activities in the Combined Statements of Cash Flows as Net transfers to Parent and in the accompanying Combined Balance Sheets as Net Parent investment.
The audited Consolidated Financial Statements of Corteva and the related notes and the unaudited interim Consolidated Financial Statements of Corteva and the related notes are also included elsewhere in this information statement. The Consolidated Financial Statements reflect the Corteva business on a historical basis without giving effect to the spin-off.
Recent Developments
Bayer Resolution
As of January 2026, Bayer CropScience LLP (“Bayer”) and Corteva agreed to settle the agrobacterium cross-license agreement dispute. In addition, Corteva and Bayer resolved several other disputes regarding post-patent royalties and other matters, including post-patent regulatory support, resulting in the termination or amendment of the related licenses, as applicable. As part of the resolution of these matters, the cross-license agreement has been terminated and Corteva agreed to drop its AAD-1 patent claims against Bayer, as well as a payment of $610 million of which approximately $546 million was paid through the first quarter of 2026 and the remainder due by September 15, 2026. Also as a result of the resolution of this litigation and the related license terminations and amendments, potential royalty obligations for Corteva's Enlist E3® soybeans, as well as future royalty payments due to Bayer under other licensing agreements in dispute were terminated. The settlement agreements support Corteva's product out-licensing growth in competitive corn, cotton and canola markets, including for the out-licensing of above and below ground triple-stack corn technology. In conjunction with resolution of these matters, the companies also agreed to new cotton licensing arrangements at terms reflective of market rates. There is no remaining litigation between the parties.
Key Factors Affecting Our Business
For information on the risk factors affecting our business, refer to the “Risk Factors” section of this information statement.
Results of Operations - Three Months ended March 31, 2026 and 2025
Net Sales
Net sales were $3,023 million and $2,707 million for the three months ended March 31, 2026 and 2025, respectively. The increase was primarily driven by a 6 percent increase in volume, a 3 percent favorable currency impact, and a 3 percent increase due to price/mix.
Pricing gains in both regions demonstrate demand for top technology and the strength of the portfolio. Volume increases in the United States and Europe are due to timing shifts and favorable weather in the northern hemisphere. Favorable currency impacts were led by the Euro.
|
|
|
|
|
|
|
|
|
|
|
|
|
|
|
|
|
|
|
|
Three Months Ended March 31, |
|
|
2026 |
|
2025 |
|
|
Net Sales
($ Millions) |
|
% |
|
Net Sales
($ Millions) |
|
% |
|
Worldwide |
|
$ |
|
3,023 |
|
|
|
100 |
% |
|
$ |
|
2,707 |
|
|
|
100 |
% |
Americas |
|
|
|
1,994 |
|
|
|
66 |
% |
|
|
|
1,782 |
|
|
|
66 |
% |
Rest of World |
|
|
|
1,029 |
|
|
|
34 |
% |
|
|
|
925 |
|
|
|
34 |
% |
|
|
|
|
|
|
|
|
|
|
|
|
|
|
|
|
|
|
|
|
|
|
|
|
|
|
|
Q1 2026 vs. Q1 2025 |
|
Percent Change Due To: |
|
($ In millions) |
Net Sales Change |
|
Price & |
|
|
|
|
|
|
Portfolio / |
|
|
$ |
|
% |
|
Product Mix |
|
Volume |
|
Currency |
|
Other |
|
Americas |
|
$ |
|
212 |
|
|
|
12 |
% |
|
|
2 |
% |
|
|
8 |
% |
|
|
2 |
% |
|
|
— |
% |
Rest of World |
|
|
|
104 |
|
|
|
11 |
% |
|
|
5 |
% |
|
|
— |
% |
|
|
6 |
% |
|
|
— |
% |
Total |
|
$ |
|
316 |
|
|
|
12 |
% |
|
|
3 |
% |
|
|
6 |
% |
|
|
3 |
% |
|
|
— |
% |
Cost of Goods Sold ("COGS")
COGS was $1,377 million (46 percent of net sales) and $1,365 million (50 percent of net sales) for the three months ended March 31, 2026 and 2025, respectively. The increase was primarily driven by higher sales volumes and the impact of currency, partially offset by $40 million lower royalty expense and the absence of a prior year facility remediation accrual. Historically, royalty expense benefits have been the driver of our net royalty benefits. Going forward, we expect the benefits to be driven by out-licensing income.
Research and Development Expense ("R&D")
R&D expense was $243 million (8 percent of net sales) and $234 million (9 percent of net sales) for the three months ended March 31, 2026 and 2025, respectively. The increase in R&D expense is in support of the company’s long-term investment plans and was primarily driven by unfavorable currency impacts and increases in salaries, depreciation and field, lab and facilities costs, partially offset by cost recoveries received from third parties.
We expect our R&D expense will run at approximately 10 percent of net sales on an annual basis.
Selling, General and Administrative Expenses ("SG&A")
SG&A expenses were $534 million (18 percent of net sales) and $456 million (17 percent of net sales) for the three months ended March 31, 2026 and 2025, respectively. The increase was primarily driven by unfavorable currency impacts and an increase in bad debt expense, variable compensation, commissions, consulting fees and information technology costs.
Amortization of Intangibles
Intangible asset amortization was $121 million and $123 million for the three months ended March 31, 2026 and 2025, respectively. See Note 9 - Other Intangible Assets, to the supplemental interim Combined Financial Statements, for additional information.
Restructuring and Asset Related Charges - Net
Restructuring and asset related charges - net were $30 million and $2 million for the three months ended March 31, 2026 and 2025, respectively. The charges in the first quarter of 2026 were comprised of severance and related benefit costs. The charges in the first quarter of 2025 were primarily comprised of asset related charges.
See Note 4 - Restructuring and Asset Related Charges - Net, to the supplemental interim Combined Financial Statements, for additional information.
Other Income (Expense) - Net
Other income (expense) - net was $(12) million and $7 million for the three months ended March 31, 2026 and 2025, respectively. Higher other expense was driven by higher exchange losses and higher miscellaneous expenses, none of which were individually significant.
See Note 5 - Supplementary Information, to the supplemental interim Combined Financial Statements, for additional information.
Interest Expense
Interest expense was $2 million and $— million for the three months ended March 31, 2026 and 2025, respectively. The change was primarily driven by higher short-term borrowings.
Provision for (Benefit from) Income Taxes
The company’s provision for income taxes was $150 million for the three months ended March 31, 2026 on pre-tax income of $653 million, resulting in an effective tax rate of 23.0 percent. The effective tax rate was unfavorably impacted by geographic mix of earnings, valuation allowances on certain foreign tax credits, and withholding taxes on repatriation of cash held outside of the U.S. primarily from current year earnings. These items were partially offset by $34 million of net tax benefits associated with changes in deferred taxes and accruals for certain prior year tax positions.
The company's provision for income taxes was $136 million for the three months ended March 31, 2025 on pre-tax income of $534 million, resulting in an effective tax rate of 25.5 percent. The effective tax rate was unfavorably impacted by geographic mix of earnings, valuation allowances on certain foreign tax credits, and withholding taxes on repatriation of cash held outside of the U.S. primarily from current year earnings. These items were partially offset by $7 million of net tax benefits associated with changes in deferred taxes and accruals for certain prior year tax positions.
Recent Accounting Pronouncements - Three Months ended March 31, 2026 and 2025
See Note 2 - Recent Accounting Guidance, to the supplemental interim Combined Financial Statements, for a description of recent accounting pronouncements.
Segment Reviews - Three Months ended March 31, 2026 and 2025
The Seed Business' operations are managed through two operating segments: Americas and Rest of World. The Company is a leader in many key seed markets, including United States corn and soybeans, Europe corn and sunflower, as well as Brazil, India, South Africa and Argentina corn.
Summarized below are comments on individual segment net sales and segment operating EBITDA for the three months ended March 31, 2026 and 2025. The company defines segment operating EBITDA as earnings (loss) (i.e., income (loss) before income taxes) before interest, depreciation, amortization, corporate expenses, research and development expense, non-operating benefits (costs), foreign exchange gains (losses), and net unrealized gain or loss from mark-to-market activity for certain foreign currency derivative instruments that do not qualify for hedge accounting, excluding the impact of significant items and separation costs. Non-operating benefits (costs) consists of non-operating pension and OPEB credits (costs). See Note 17 - Segment Information, to the supplemental unaudited interim Combined Financial Statements, for details related to significant pre-tax benefits (costs) excluded from segment operating EBITDA. All references to prices are based on local price unless otherwise specified.
A reconciliation of segment operating EBITDA to income (loss) after income taxes for the three months ended March 31, 2026 and 2025 is included in Note 17 - Segment Information, to the supplemental interim Combined Financial Statements.
|
|
|
|
|
|
|
|
|
Americas |
Three Months Ended March 31, |
|
(In millions) |
2026 |
|
2025 |
|
Net sales |
|
$ |
1,994 |
|
|
$ |
1,782 |
|
Segment operating EBITDA |
|
$ |
832 |
|
|
$ |
685 |
|
Americas
Americas net sales were $1,994 million in the first quarter of 2026, up 12 percent from $1,782 million in the first quarter of 2025. The sales increase was driven by an 8 percent increase in volume, a 2 percent increase due to price/mix, and a 2 percent increase due to favorable impact from currency. The increase in volume was driven by the United States due to timing shifts and favorable weather. Pricing increases were driven by improvement in United States corn and favorable product mix in Brazil. The favorable currency impacts were led by the Brazilian Real.
Segment operating EBITDA was $832 million in the first quarter of 2026, up $147 million from $685 million in the first quarter of 2025. Higher segment operating EBITDA was driven by an increase in volumes in the United States, favorable price and product mix in the United States and Brazil, and lower net royalty expense, partially offset by higher bad debt expense in Brazil. Segment operating EBITDA margin improved by approximately 330 basis points versus the prior-year period.
|
|
|
|
|
|
|
|
|
Rest of World |
Three Months Ended March 31, |
|
(In millions) |
2026 |
|
2025 |
|
Net sales |
|
$ |
1,029 |
|
|
$ |
925 |
|
Segment operating EBITDA |
|
$ |
355 |
|
|
$ |
326 |
|
Rest of World
Rest of World net sales were $1,029 million in the first quarter of 2026, up 11 percent from $925 million in the first quarter of 2025. The sales increase over the prior period was driven by a 6 percent favorable impact from currency and a 5 percent increase due to price/mix. Price increases were primarily driven by demand for top technology, including seed applied technologies offerings. The favorable currency impacts were led by the Euro, with a partial offset from the Turkish Lira.
Segment operating EBITDA was $355 million in the first quarter of 2026, up $29 million from $326 million in the first quarter of 2025. The increase was driven by favorable pricing with a partial offset from higher commissions. Segment operating EBITDA margin deteriorated by approximately 75 basis points versus the prior-year period.
Non-GAAP Financial Measures - Three Months ended March 31, 2026 and 2025
The Seed Business presents certain financial measures that do not conform to U.S. GAAP and are considered non-GAAP measures. These measures include Operating EBITDA and operating earnings (loss). Management uses these measures internally for planning and forecasting, including allocating resources and evaluating incentive compensation. Management believes that these non-GAAP measures best reflect the ongoing performance of the company during the periods presented and provide more relevant and meaningful information to investors as they provide insight with respect to ongoing operating results of the company and a more useful comparison of year over year results. These non-GAAP measures supplement the Seed Business’ U.S. GAAP disclosures and should not be viewed as an alternative to U.S. GAAP measures of performance. Furthermore, such non-GAAP measures may not be consistent with similar measures provided or used by other companies. Reconciliations for these non-GAAP measures to U.S. GAAP are provided below.
Operating EBITDA is defined as earnings (loss) (i.e., income (loss) before income taxes) before interest, depreciation, amortization, non-operating benefits (costs), foreign exchange gains (losses), and net unrealized gain or loss from mark-to-market activity for certain foreign currency derivative instruments that do not qualify for hedge accounting, excluding the impact of significant items and separation costs. Non-operating benefits (costs) consists of non-operating pension and OPEB credits (costs). Operating earnings (loss) is defined as net income (loss) excluding the after-tax impact of significant items, the after-tax impact of separation costs, the after-tax impact of non-operating benefits (costs), the after-tax impact of amortization expense associated with intangible assets existing as of the Corteva Separation from DowDuPont, and the after-tax impact of net unrealized gain or loss from mark-to-market activity for certain foreign currency derivative instruments that do not qualify for hedge accounting. Although amortization of the company's intangible assets is excluded from these non-GAAP measures, management believes it is important for investors to understand that such intangible assets contribute to revenue generation. Amortization of intangible assets that relate to past acquisitions will recur in future periods until such intangible assets have been fully amortized. Any future acquisitions may result in amortization of additional intangible assets. Net unrealized gain or loss from mark-to-market activity for certain foreign currency derivative instruments that do not qualify for hedge accounting represents the non-cash net gain (loss) from changes in fair value of certain undesignated foreign currency derivative contracts. Upon settlement, which is within the same calendar year of execution of the contract, the realized gain (loss) from the changes in fair value of the non-qualified foreign currency derivative contracts will be reported in the relevant non-GAAP financial measures, allowing quarterly results to reflect the economic effects of the foreign currency derivative contracts without the resulting unrealized mark to fair value volatility.
Reconciliation of Net Income (Loss) to Operating EBITDA
|
|
|
|
|
|
|
|
|
|
Three Months Ended March 31, |
|
(In millions) |
2026 |
|
2025 |
|
Net income (loss) (GAAP) |
|
$ |
503 |
|
|
$ |
398 |
|
Provision for (benefit from) income taxes |
|
|
150 |
|
|
|
136 |
|
Income (loss) before income taxes (GAAP) |
|
$ |
653 |
|
|
$ |
534 |
|
Depreciation and amortization |
|
|
199 |
|
|
|
198 |
|
Interest income |
|
|
(12 |
) |
|
|
(11 |
) |
Interest expense |
|
|
2 |
|
|
|
— |
|
Exchange (gains) losses - net |
|
|
25 |
|
|
|
12 |
|
Non-operating (benefits) costs - net |
|
|
1 |
|
|
|
3 |
|
Mark-to-market (gains) losses on certain foreign currency contracts not designated as hedges |
|
|
(1 |
) |
|
|
5 |
|
Significant items (benefit) charge |
|
|
30 |
|
|
|
39 |
|
Separation costs |
|
|
51 |
|
|
|
— |
|
Operating EBITDA (Non-GAAP) |
|
$ |
948 |
|
|
$ |
780 |
|
Significant Items
|
|
|
|
|
|
|
|
|
|
Three Months Ended March 31, |
|
(In millions) |
2026 |
|
2025 |
|
Restructuring and asset related charges - net |
|
$ |
30 |
|
|
$ |
2 |
|
AltEn facility remediation charges 1 |
|
|
— |
|
|
|
37 |
|
Total pre-tax significant items (benefit) charge |
|
$ |
30 |
|
|
$ |
39 |
|
Total tax (benefit) provision impact of significant items 2 |
|
|
(7 |
) |
|
|
(10 |
) |
Total significant items (benefit) charge, after tax |
|
$ |
23 |
|
|
$ |
29 |
|
1.Relates to a charge to increase the remediation accrual at the AltEn facility relating to Corteva's estimated voluntary contribution to the solid waste and wastewater remedial action plans. See Note 11 - Commitments and Contingent Liabilities, to the supplemental interim Combined Financial Statements, for additional information.
2.Unless specifically addressed above, the income tax effect on significant items was calculated based upon the enacted tax laws and statutory income tax rates applicable in the tax jurisdiction(s) of the underlying non-GAAP adjustment.
Reconciliation of Net Income (Loss) Attributable to the Seed Business to Operating Earnings (Loss)
|
|
|
|
|
|
|
|
|
|
Three Months Ended March 31, |
|
(In millions) |
2026 |
|
2025 |
|
Income (loss) attributable to the Seed Business (GAAP) |
|
$ |
502 |
|
|
$ |
397 |
|
Less: Non-operating benefits (costs), after tax |
|
|
(1 |
) |
|
|
(2 |
) |
Less: Amortization of intangibles (existing as of Corteva Separation), after tax |
|
|
(91 |
) |
|
|
(93 |
) |
Less: Mark-to-market gains (losses) on certain foreign currency contracts not designated as hedges, after tax |
|
|
— |
|
|
|
(4 |
) |
Less: Significant items benefit (charge), after tax |
|
|
(23 |
) |
|
|
(29 |
) |
Less: Separation costs, after tax |
|
|
(41 |
) |
|
|
— |
|
Operating Earnings (Loss) (Non-GAAP) |
|
$ |
658 |
|
|
$ |
525 |
|
Results of Operations - Years ended December 31, 2025, 2024 and 2023
Net Sales
|
|
|
|
|
|
|
|
|
|
|
|
|
|
For the Year Ended December 31, |
|
(In millions) |
2025 |
|
2024 |
|
2023 |
|
Net sales |
|
$ |
9,898 |
|
|
$ |
9,545 |
|
|
$ |
9,472 |
|
2025 versus 2024
Net sales were $9,898 million for the year ended December 31, 2025, up 4 percent from $9,545 million for the year ended December 31, 2024. The increase was driven by a 3 percent increase in price/mix and a 2 percent increase in volume, partially offset by a 1 percent unfavorable currency impact. Pricing gains, which were led by United States corn and seed applied technologies offerings in EMEA, coupled with increased out-licensing income for corn and soybeans, demonstrate demand for top technology and the strength of the portfolio. Volume growth was driven primarily by increased corn area and market share gains in the United States and Brazil, partially offset by lower soybean area in the United States. The unfavorable currency impacts were led by the Turkish Lira and Canadian Dollar, with a partial offset from the Brazilian Real.
2024 versus 2023
Net sales were $9,545 million for the year ended December 31, 2024, up 1 percent from $9,472 million for the year ended December 31, 2023. The increase was driven by a 3 percent increase in price/mix and a 1 percent increase in volume, partially offset by a 2 percent unfavorable currency impact and a 1 percent unfavorable portfolio impact. The increase in price was due to improvement in United States corn and soybeans and seed applied technologies offerings in EMEA, as well as increased out-licensing income in corn, soybeans and canola. This pricing growth was partially offset by a decline in corn pricing in Brazil and Argentina. Overall global corn and soybean pricing were up 2 percent. Volume growth was driven primarily by the expected recovery in Brazil Safrinha corn and growth in United States soybeans and cotton, partially offset by reduced corn planted areas in Turkey and Argentina. The portfolio decline was driven by the Seed Business' withdrawal from Russia ("Russia Exit"). Unfavorable currency impacts were led by the Brazilian Real and Turkish Lira.
|
|
|
|
|
|
|
|
|
|
|
|
|
|
|
|
|
For the Year Ended December 31, |
($ In millions) |
2025 |
2024 |
2023 |
|
Net Sales |
% of Net Sales |
Net Sales |
% of Net Sales |
Net Sales |
% of Net Sales |
Worldwide |
|
$ |
9,898 |
|
100% |
|
$ |
9,545 |
|
100% |
|
$ |
9,472 |
|
100% |
Americas |
|
|
7,885 |
|
80% |
|
|
7,556 |
|
79% |
|
|
7,405 |
|
78% |
Rest of World |
|
|
2,013 |
|
20% |
|
|
1,989 |
|
21% |
|
|
2,067 |
|
22% |
|
|
|
|
|
|
|
|
|
|
|
|
|
|
|
Year Ended December 31, 2025 vs. 2024 |
Percent Change Due To: |
|
Net Sales Change |
Price & |
|
|
|
|
Portfolio / |
(In millions) |
$ |
% |
Product Mix |
Volume |
Currency |
Other |
Americas |
|
$ |
329 |
|
4% |
|
2 % |
|
2 % |
|
— % |
|
— % |
Rest of World |
|
|
24 |
|
1% |
|
5 % |
|
1 % |
|
(5)% |
|
— % |
Total |
|
$ |
353 |
|
4% |
|
3 % |
|
2 % |
|
(1)% |
|
— % |
|
|
|
|
|
|
|
|
|
|
|
|
|
|
|
Year Ended December 31, 2024 vs. 2023 |
Percent Change Due To: |
|
Net Sales Change |
Price & |
|
|
|
Portfolio / |
($ In millions) |
$ |
% |
Product Mix |
Volume |
Currency |
Other |
Americas |
|
$ |
151 |
|
2% |
|
1% |
|
3% |
|
(2)% |
|
— % |
Rest of World |
|
|
(78) |
|
(4)% |
|
9% |
|
(5)% |
|
(4)% |
|
(4)% |
Total |
|
$ |
73 |
|
1% |
|
3% |
|
1% |
|
(2)% |
|
(1)% |
Cost of Goods Sold (“COGS”)
|
|
|
|
|
|
|
|
|
|
|
|
|
|
For the Year Ended December 31, |
|
(In millions) |
2025 |
|
2024 |
|
2023 |
|
Cost of goods sold |
|
$ |
4,711 |
|
|
$ |
4,944 |
|
|
$ |
5,153 |
|
2025 versus 2024
COGS was $4,711 million (48 percent of net sales) for the year ended December 31, 2025 compared to $4,944 million (52 percent of net sales) for the year ended December 31, 2024. The decrease was primarily driven by $190 million lower commodity costs, $125 million in net productivity benefits and $50 million lower royalty expense, partially offset by higher volumes and the impact of a facility remediation accrual.
2024 versus 2023
COGS was $4,944 million (52 percent of net sales) for the year ended December 31, 2024 compared to $5,153 million (54 percent of net sales) for the year ended December 31, 2023. The decrease was driven by $110 million of currency impacts, $95 million lower royalty expense, and net productivity benefits, partially offset by higher volumes.
Research and Development Expense (“R&D”)
|
|
|
|
|
|
|
|
|
|
|
|
|
|
For the Year Ended December 31, |
|
(In millions) |
2025 |
|
2024 |
|
2023 |
|
Research and development expense |
|
$ |
995 |
|
|
$ |
915 |
|
|
$ |
842 |
|
2025 versus 2024
R&D expense was $995 million (10 percent of net sales) for the year ended December 31, 2025 and $915 million (10 percent of net sales) for the year ended December 31, 2024. The increase in R&D expense is in support of the company's long-term investment plans and was primarily driven by higher employee compensation costs due to variable compensation increases, as well as higher contractor, consulting and field, lab and facilities costs, all of which were partially offset by favorable currency impacts.
We expect our R&D expense will run at approximately 10 percent of net sales on an annual basis.
2024 versus 2023
R&D expense was $915 million (10 percent of net sales) for the year ended December 31, 2024 and $842 million (9 percent of net sales) for the year ended December 31, 2023. The increase in R&D expense is in support of the company's long-term investment plans and was primarily driven by higher employee compensation costs due to merit increases and higher headcount, as well as higher contractor and field, lab and facilities costs. These increases were partially offset by favorable currency impacts.
Selling, General and Administrative Expenses (“SG&A”)
|
|
|
|
|
|
|
|
|
|
|
|
|
|
For the Year Ended December 31, |
|
(In millions) |
2025 |
|
2024 |
|
2023 |
|
Selling, general and administrative expenses |
|
$ |
2,102 |
|
|
$ |
1,909 |
|
|
$ |
1,877 |
|
2025 versus 2024
SG&A expenses were $2,102 million (21 percent of net sales) for the year ended December 31, 2025 and $1,909 million (20 percent of net sales) for the year ended December 31, 2024. The increase was primarily driven by an increase in commissions, variable
compensation, bad debt expense, legal support fees and personnel and information technology costs, partially offset by favorable currency impacts and a decrease in consulting and professional fees.
2024 versus 2023
SG&A expenses were $1,909 million (20 percent of net sales) for the year ended December 31, 2024 and $1,877 million (20 percent of net sales) for the year ended December 31, 2023. The increase was primarily driven by an increase in bad debt expense, salaries and benefits, legal support fees, and consulting and professional fees, partially offset by favorable currency impacts and lower digital transformation project and advertising costs.
Amortization of Intangibles
|
|
|
|
|
|
|
|
|
|
|
|
|
|
For the Year Ended December 31, |
|
(In millions) |
2025 |
|
2024 |
|
2023 |
|
Amortization of intangibles |
|
$ |
489 |
|
|
$ |
525 |
|
|
$ |
538 |
|
2025 versus 2024
Intangible asset amortization was $489 million for the year ended December 31, 2025 and $525 million for the year ended December 31, 2024. The decrease was primarily driven by lower amortization on certain intangible assets arising from the all-stock merger of equals strategic combination between Historical Dow and Historical DuPont (the "DowDuPont Merger") that became fully amortized during the period.
2024 versus 2023
Intangible asset amortization was $525 million for the year ended December 31, 2024 and $538 million for the year ended December 31, 2023. The decrease was driven by lower amortization on certain intangible assets arising from the DowDuPont Merger that became fully amortized during the period
See Note 11 - Goodwill and Other Intangible Assets, to the supplemental audited Combined Financial Statements, for additional information.
Restructuring and Asset Related Charges—Net
|
|
|
|
|
|
|
|
|
|
|
|
|
|
For the Year Ended December 31, |
|
(In millions) |
2025 |
|
2024 |
|
2023 |
|
Restructuring and asset related charges - net |
|
$ |
4 |
|
|
$ |
70 |
|
|
$ |
98 |
|
2025
Restructuring and asset related charges - net were $4 million for the year ended December 31, 2025, which was primarily comprised of asset related charges.
2024
Restructuring and asset related charges - net were $70 million for the year ended December 31, 2024, which was primarily comprised of $15 million of severance and related benefit costs and a $55 million net charge from non-cash accelerated prepaid royalty amortization expense related to the Roundup Ready 2 Yield® and Roundup Ready 2 Xtend® herbicide tolerance traits.
2023
Restructuring and asset related charges - net were $98 million for the year ended December 31, 2023, which was primarily comprised of a $26 million charge related to the restructuring actions and a $72 million net charge related to non-cash accelerated prepaid royalty amortization expense related to the Roundup Ready 2 Yield® and Roundup Ready 2 Xtend® herbicide tolerance traits. The $26 million net charge associated with restructuring actions consisted of $11 million of severance and related benefit costs and $15 million of contract termination charges.
See Note 5 - Restructuring and Asset Related Charges - Net, to the supplemental audited Combined Financial Statements, for additional information.
Other Income (Expense)—Net
|
|
|
|
|
|
|
|
|
|
|
|
|
|
For the Year Ended December 31, |
|
(In millions) |
2025 |
|
2024 |
|
2023 |
|
Other income (expense) - net |
|
$ |
(712 |
) |
|
$ |
(64 |
) |
|
$ |
(12 |
) |
2025 versus 2024
Other income (expense) - net was $(712) million and $(64) million for the years ended December 31, 2025 and 2024, respectively. Higher other expense was driven by a $610 million charge related to the Bayer resolution and an increase in net exchange losses.
2024 versus 2023
Other income (expense) - net was $(64) million and $(12) million for the years ended December 31, 2024 and 2023, respectively. Higher other expense was driven by an increase in net exchange losses and lower interest income.
See Note 6 - Supplementary Information, to the supplemental audited Combined Financial Statements, for additional information.
Interest Expense
|
|
|
|
|
|
|
|
|
|
|
|
|
|
For the Year Ended December 31, |
|
(In millions) |
2025 |
|
2024 |
|
2023 |
|
Interest expense |
|
$ |
5 |
|
|
$ |
2 |
|
|
$ |
1 |
|
2025 versus 2024
Interest expense was $5 million and $2 million for the years ended December 31, 2025 and 2024, respectively. Interest expense was driven by local borrowings to fund subsidiary working capital needs and capital expenditures.
2024 versus 2023
Interest expense was $2 million and $1 million for the years ended December 31, 2024 and 2023, respectively. Interest expense was driven by local borrowings to fund subsidiary working capital needs and capital expenditures.
Provision for Income Taxes on Continuing Operations
|
|
|
|
|
|
|
|
|
|
|
|
|
|
For the Year Ended December 31, |
|
(In millions) |
2025 |
|
2024 |
|
2023 |
|
Provision for (benefit from) income taxes |
|
$ |
270 |
|
|
$ |
342 |
|
|
$ |
297 |
|
Effective tax rate |
|
|
32.0 |
% |
|
|
30.6 |
% |
|
|
31.2 |
% |
2025
For the year ended December 31, 2025, the Company’s effective tax rate of 32.0 percent on pre-tax income of $845 million was unfavorably impacted by geographic mix of earnings, a $45 million charge associated with valuation allowances on certain foreign tax credits, a $42 million and $26 million charge associated with valuation allowances in Argentina and Brazil, respectively, and a $25 million charge associated with repatriation of cash held outside of the U.S. primarily from current year earnings. These items were partially offset by a $(27) million benefit related to U.S. tax credits for increasing research activities.
2024
For the year ended December 31, 2024, the Company’s effective tax rate of 30.6 percent on pre-tax income of $1,116 million was unfavorably impacted by an $88 million charge on the establishment of a valuation allowance recorded against the net deferred tax asset position of a legal entity in Brazil, geographic mix of earnings, and a $21 million charge associated with repatriation of cash held outside of the U.S. primarily from current year earnings. These items were partially offset by a $(37) million benefit related to U.S. tax credits for increasing research activities.
2023
For the year ended December 31, 2023, the Company’s effective tax rate of 31.2 percent on pre-tax income of $951 million was unfavorably impacted by geographic mix of earnings including losses in foreign entities with valuation allowances, a $19 million charge associated with the repatriation of cash held outside of the U.S. primarily from current year earnings and the unfavorable tax impact of
certain net exchange losses recognized on the remeasurement of the net monetary asset positions. These items were partially offset by a $(39) million benefit related to U.S. tax credits for increasing research activities.
Recent Accounting Guidance - Years ended December 31, 2025, 2024 and 2023
See Note 3 - Recent Accounting Guidance, to the supplemental audited Combined Financial Statements, for a description of recent accounting pronouncements.
Segment Reviews - Years ended December 31, 2025, 2024 and 2023
The Seed Business' operations are managed through two operating segments: Americas and Rest of World. The Company is a leader in many key seed markets, including United States corn and soybeans, Europe corn and sunflower, as well as Brazil, India, South Africa and Argentina corn.
Summarized below are comments on individual segment net sales and segment operating EBITDA for the years ended December 31, 2025, 2024 and 2023. The Company defines segment operating EBITDA as earnings (loss) (i.e., income (loss) before income taxes) before interest, depreciation, amortization, corporate expenses, research and development expense, non-operating benefits (costs), foreign exchange gains (losses), and net unrealized gain or loss from mark-to-market activity for certain foreign currency derivative instruments that do not qualify for hedge accounting, excluding the impact of significant items and separation costs. Non-operating benefits (costs) consists of non-operating pension and OPEB credits (costs). Refer to Note 22 - Segment Information, to the supplemental audited Combined Financial Statements, for details related to significant pre-tax benefits (costs) excluded from segment operating EBITDA. All references to prices are based on local price unless otherwise specified.
A reconciliation of segment operating EBITDA to income (loss) after income taxes for the years ended December 31, 2025, 2024 and 2023 is included in Note 22 - Segment Information, to the supplemental audited Combined Financial Statements.
|
|
|
|
|
|
|
|
|
|
|
|
|
Americas |
For the Year Ended December 31, |
|
(In millions) |
2025 |
|
2024 |
|
2023 |
|
Net sales |
|
$ |
7,885 |
|
|
$ |
7,556 |
|
|
$ |
7,405 |
|
Segment operating EBITDA |
|
$ |
2,813 |
|
|
$ |
2,422 |
|
|
$ |
2,185 |
|
Americas
Americas net sales were $7,885 million in 2025, up 4 percent from $7,556 million in 2024. Favorable net sales were driven by a 2 percent increase in price/mix led by United States corn and increased out-licensing income for corn and soybeans, as well as a 2 percent increase in volumes driven by increased corn acres and market share gains within the United States and Brazil, partially offset by lower soybean and cotton area in the United States and the shift to an out-licensing model for soybeans in Brazil.
Americas segment operating EBITDA was $2,813 million in 2025, up 16 percent from $2,422 million in 2024. Higher segment operating EBITDA was driven by higher volumes, favorable product mix, lower net royalty expense and benefits from ongoing cost and productivity actions, partially offset by higher compensation, commissions and bad debt expense. Segment operating EBITDA margin improved by approximately 360 basis points versus the prior-year period.
Americas net sales were $7,556 million in 2024, up 2 percent from $7,405 million in 2023. Favorable net sales were driven by a 3 percent increase in volumes and a 1 percent increase in price/mix, partially offset by a 2 percent unfavorable currency impact. Higher volumes were due to the expected recovery in Brazil Safrinha corn and growth in United States soybeans and cotton, partially offset by reduced corn planted area in Argentina and the shift to an out-licensing model for soybeans in Brazil. The increase in price was driven by United States corn and increased out-licensing income for corn, soybeans and canola, partially offset by a decline in corn pricing in Brazil and Argentina.
Americas segment operating EBITDA was $2,422 million in 2024, up 11 percent from $2,185 million in 2023. Higher segment operating EBITDA was driven by an increase in volumes and favorable price and product mix in the United States, as well as benefits from ongoing cost and productivity actions and lower net royalty expense, partially offset by higher production costs and bad debt expense in Brazil. Segment operating EBITDA margin improved by approximately 255 basis points versus the prior-year period.
|
|
|
|
|
|
|
|
|
|
|
|
|
Rest of World |
For the Year Ended December 31, |
|
(In millions) |
2025 |
|
2024 |
|
2023 |
|
Net sales |
|
$ |
2,013 |
|
|
$ |
1,989 |
|
|
$ |
2,067 |
|
Segment operating EBITDA |
|
$ |
600 |
|
|
$ |
573 |
|
|
$ |
552 |
|
Rest of World
Rest of World net sales were $2,013 million in 2025, up 1 percent from $1,989 million in 2024. The increase was driven by a 5 percent increase in price/mix and a 1 percent increase in volume, partially offset by a 5 percent unfavorable currency impact. The increase in price was driven by favorable changes related to EMEA sunflower and seed applied technologies offerings and India corn, as well as efforts to offset unfavorable currency impacts. The increase in volume was driven by the recovery of corn acres in India and Pakistan and strong demand for rice and millet, partially offset by acreage reductions due to drought in EMEA.
Rest of World segment operating EBITDA was $600 million in 2025, up 5 percent from $573 million in 2024. The increase was driven by favorable pricing and benefits from ongoing cost and productivity actions. Segment operating EBITDA margin improved by approximately 100 basis points versus the prior-year period.
Rest of World net sales were $1,989 million in 2024, down 4 percent from $2,067 million in 2023. The decline was driven by a 5 percent reduction in volumes, a 4 percent unfavorable portfolio impact, and a 4 percent decrease from unfavorable currency impacts, partially offset by a 9 percent increase in price/mix. The volume decline was driven by lower corn planted area in Turkey, India and Pakistan and lower mustard planted area in India, while the portfolio impact was driven by the Russia Exit. The increase in price was driven by favorable changes in EMEA corn, sunflower and seed applied technologies offerings as well as strong value capture across key crops in India.
Rest of World segment operating EBITDA was $573 million in 2024, up 4 percent from $552 million in 2023. Higher segment operating EBITDA was driven by more favorable pricing, partially offset by higher production costs. Segment operating EBITDA margin improved by approximately 210 basis points versus the prior-year period.
Non-GAAP Financial Measures - Years ended December 31, 2025, 2024 and 2023
The Seed Business presents certain financial measures that do not conform to U.S. GAAP and are considered non-GAAP measures. These measures include Operating EBITDA and operating earnings (loss). Management uses these measures internally for planning and forecasting, including allocating resources and evaluating incentive compensation. Management believes that these non-GAAP measures best reflect the ongoing performance of the company during the periods presented and provide more relevant and meaningful information to investors as they provide insight with respect to ongoing operating results of the company and a more useful comparison of year-over-year results. These non-GAAP measures supplement the Seed Business' U.S. GAAP disclosures and should not be viewed as an alternative to U.S. GAAP measures of performance. Furthermore, such non-GAAP measures may not be consistent with similar measures provided or used by other companies. Reconciliations for these non-GAAP measures to U.S. GAAP are provided below.
Operating EBITDA is defined as earnings (loss) (i.e., income (loss) from continuing operations before income taxes) before interest, depreciation, amortization, non-operating benefits (costs), foreign exchange gains (losses), and net unrealized gain or loss from mark-to-market activity for certain foreign currency derivative instruments that do not qualify for hedge accounting, excluding the impact of significant items and separation costs. Non-operating benefits (costs) consists of non-operating pension and OPEB credits (costs). Operating earnings (loss) is defined as net income (loss) excluding the after-tax impact of significant items, the after-tax impact of separation costs, the after-tax impact of non-operating benefits (costs), the after-tax impact of amortization expense associated with intangible assets existing as of the Corteva Separation from DowDuPont, and the after-tax impact of net unrealized gain or loss from mark-to-market activity for certain foreign currency derivative instruments that do not qualify for hedge accounting. Although amortization of the company's intangible assets is excluded from these non-GAAP measures, management believes it is important for investors to understand that such intangible assets contribute to revenue generation. Amortization of intangible assets that relate to past acquisitions will recur in future periods until such intangible assets have been fully amortized. Any future acquisitions may result in amortization of additional intangible assets. Net unrealized gain or loss from mark-to-market activity for certain foreign currency derivative instruments that do not qualify for hedge accounting represents the non-cash net gain (loss) from changes in fair value of certain undesignated foreign currency derivative contracts. Upon settlement, which is within the same calendar year of execution of the contract, the realized gain (loss) from the changes in fair value of the non-qualified foreign currency derivative contracts will be reported in the relevant non-GAAP financial measures, allowing quarterly results to reflect the economic effects of the foreign currency derivative contracts without the resulting unrealized mark to fair value volatility.
Reconciliation of Net Income (Loss) to Operating EBITDA
|
|
|
|
|
|
|
|
|
|
|
|
|
|
For the Year Ended December 31, |
|
(In millions) |
2025 |
|
2024 |
|
2023 |
|
Net income (loss) (GAAP) |
|
$ |
575 |
|
|
$ |
774 |
|
|
$ |
654 |
|
Provision for (benefit from) income taxes |
|
|
270 |
|
|
|
342 |
|
|
|
297 |
|
Income (loss) before income taxes (GAAP) |
|
$ |
845 |
|
|
$ |
1,116 |
|
|
$ |
951 |
|
Depreciation and amortization |
|
|
806 |
|
|
|
829 |
|
|
|
832 |
|
Interest income |
|
|
(50 |
) |
|
|
(42 |
) |
|
|
(87 |
) |
Interest expense |
|
|
5 |
|
|
|
2 |
|
|
|
1 |
|
Exchange (gains) losses - net |
|
|
120 |
|
|
|
114 |
|
|
|
97 |
|
Non-operating (benefits) costs - net |
|
|
11 |
|
|
|
7 |
|
|
|
7 |
|
Mark-to-market (gains) losses on certain foreign currency contracts not designated as hedges |
|
|
— |
|
|
|
— |
|
|
|
— |
|
Significant items (benefit) charge |
|
|
651 |
|
|
|
64 |
|
|
|
93 |
|
Separation costs |
|
|
35 |
|
|
|
— |
|
|
|
— |
|
Operating EBITDA (Non-GAAP) |
|
$ |
2,423 |
|
|
$ |
2,090 |
|
|
$ |
1,894 |
|
Significant Items
|
|
|
|
|
|
|
|
|
|
|
|
|
|
For the Year Ended December 31, |
|
(In millions) |
2025 |
|
2024 |
|
2023 |
|
Restructuring and asset related charges - net 1 |
|
$ |
4 |
|
|
$ |
70 |
|
|
$ |
98 |
|
Bayer resolution 2 |
|
|
610 |
|
|
|
— |
|
|
|
— |
|
(Gain) loss on sale of business, assets and equity investments 3 |
|
|
— |
|
|
|
(4 |
) |
|
|
(4 |
) |
AltEn facility remediation charges 4 |
|
|
37 |
|
|
|
— |
|
|
|
10 |
|
Inventory write-offs 3 |
|
|
— |
|
|
|
(2 |
) |
|
|
7 |
|
Seed sale associated with Russia Exit 3,5 |
|
|
— |
|
|
|
— |
|
|
|
(18 |
) |
Total pre-tax significant items (benefit) charge |
|
$ |
651 |
|
|
$ |
64 |
|
|
$ |
93 |
|
Total tax (benefit) provision impact of significant items 6 |
|
|
(150 |
) |
|
|
(16 |
) |
|
|
(21 |
) |
Tax only significant item (benefit) charge 7 |
|
|
— |
|
|
|
88 |
|
|
|
— |
|
Total significant items (benefit) charge, after tax |
|
$ |
501 |
|
|
$ |
136 |
|
|
$ |
72 |
|
1.Includes restructuring plans and asset related charges as well as accelerated prepaid amortization expense. Refer to Note 5 - Restructuring and Asset Related Charges - Net, to the Combined Financial Statements, for additional information.
2.Consists of a charge relating to the resolution of litigation with Bayer. Refer to Note 14 - Commitments and Contingent Liabilities, to the Combined Financial Statements, for additional information.
3.Incremental (gains) losses associated with activities related to the 2022 Restructuring Actions.
4.Relates to a charge to increase the remediation accrual at the AltEn facility relating to Corteva's estimated voluntary contribution to the solid waste and wastewater remedial action plans. Refer to Note 14 - Commitments and Contingent Liabilities, to the Combined Financial Statements, for additional information.
5.Includes a benefit of $18 million for the year ended December 31, 2023, relating to the sale of seeds already under production in Russia when the decision to exit the country was made and that the Company was contractually required to purchase. It consists of $71 million of net sales and $53 million of cost of goods sold for the year ended December 31, 2023.
6.Unless specifically addressed above, the income tax effect on significant items was calculated based upon the enacted tax laws and statutory income tax rates applicable in the tax jurisdiction(s) of the underlying non-GAAP adjustment.
7.The tax only significant item for the year ended December 31, 2024 relates to the establishment of a valuation allowance recorded against the net deferred tax asset position of a legal entity in Brazil.
Reconciliation of Net Income (Loss) Attributable to the Seed Business to Operating Earnings (Loss)
|
|
|
|
|
|
|
|
|
|
|
|
|
|
For the Year Ended December 31, |
|
(In millions) |
2025 |
|
2024 |
|
2023 |
|
Net income (loss) attributable to the Seed Business (GAAP) |
|
$ |
574 |
|
|
$ |
772 |
|
|
$ |
652 |
|
Less: Non-operating benefits (costs), after tax |
|
|
(9 |
) |
|
|
(5 |
) |
|
|
(5 |
) |
Less: Amortization of intangibles (existing as of Corteva Separation), after tax |
|
|
(371 |
) |
|
|
(397 |
) |
|
|
(406 |
) |
Less: Mark-to-market gains (losses) on certain foreign currency contracts not designated as hedges, after tax |
|
|
— |
|
|
|
— |
|
|
|
— |
|
Less: Significant items benefit (charge), after tax |
|
|
(501 |
) |
|
|
(136 |
) |
|
|
(72 |
) |
Less: Separation costs, after tax |
|
|
(31 |
) |
|
|
— |
|
|
|
— |
|
Operating Earnings (Loss) (Non-GAAP) |
|
$ |
1,486 |
|
|
$ |
1,310 |
|
|
$ |
1,135 |
|
Liquidity and Capital Resources - Three Months ended March 31, 2026 and 2025
Historical Sources of Liquidity
The Seed Business has generated positive net operating cash flows in annual historical periods.
To meet its working capital and financing requirements, the Seed Business has been reliant upon Corteva's centralized cash management, with the exception of local borrowings to finance subsidiary working capital needs and capital expenditures. Under Corteva's centralized cash management, a substantial portion of the Seed Business' cash balances have been transferred to Corteva to fund its operating and investing activities. Had the Seed Business been a standalone business operating independently of Corteva during the periods presented, the method by which the Seed Business would have financed its operations would have differed. Transfers of cash between Corteva and the Seed Business are reflected within Net transfers to Parent in the interim Combined Statements of Cash Flows and the interim Combined Statements of Equity. All debt and debt-related interest cost incurred by the Seed Business as the legal obligor has been recorded in the interim Combined Financial Statements.
Future Sources of Liquidity
Subsequent to the spin-off, the Seed Business will no longer participate in Corteva's centralized cash management and operational financing program. The Seed Business' ability to fund its capital needs will be affected by its ongoing ability to generate cash from operations and access to commercial paper and the capital markets. The Seed Business' current cash balance, together with cash it expects to generate from future operations and other sources of liquidity, are expected to be sufficient to finance its short- and long-term capital requirements. In addition, the Seed Business currently believes that it will have investment grade credit ratings following the spin-off; such ratings would aid the Seed Business with any potential access to public and private debt markets. The Seed Business cannot assure you what its credit ratings will be following consummation of the spin-off or at any time in the future. Additional detail related to the Seed Business' capital structure is included in the "Description of Material Indebtedness" section of this information statement.
|
|
|
|
|
|
|
|
|
|
|
|
|
(In millions) |
March 31, 2026 |
|
December 31, 2025 |
|
March 31, 2025 |
|
Cash, cash equivalents and marketable securities |
|
$ |
437 |
|
|
$ |
836 |
|
|
$ |
422 |
|
Total debt |
|
$ |
127 |
|
|
$ |
112 |
|
|
$ |
12 |
|
The Seed Business enters into short-term and long-term foreign currency loans from time-to-time by accessing uncommitted credit lines to fund working capital needs of foreign subsidiaries in the normal course of business. Interest rates are variable and determined at the time of borrowing. Total unused bank credit lines on the loans at March 31, 2026 was approximately $371 million.
The Seed Business has meaningful seasonal working capital needs based in part on providing financing to its customers. Working capital has been funded through Corteva’s centralized cash management and operational financing program.
The Seed Business has factoring agreements with third-party financial institutions to sell its trade receivables under both recourse and non-recourse agreements in exchange for cash proceeds in an effort to reduce its receivables risk. For arrangements that include an element of recourse, the company provides a guarantee of the trade receivables in the event of customer default. See Note 7 - Accounts and Notes Receivable - Net, to the supplemental interim Combined Financial Statements, for more information.
The Seed Business also organizes agreements with third-party financial institutions who directly provide financing for select customers of its products in each region. Terms of the third-party loans are less than a year and programs are renewed on an annual basis. In some cases, the Seed Business guarantees a portion of the extension of such credit to such customers. See Note 11 - Commitments and Contingent Liabilities, to the supplemental interim Combined Financial Statements, for more information on the Seed Business’ guarantees.
The company's cash, cash equivalents and marketable securities at March 31, 2026, December 31, 2025 and March 31, 2025 are $437 million, $836 million and $422 million, respectively, of which $435 million, $715 million and $402 million at March 31, 2026, December 31, 2025 and March 31, 2025, respectively, was held by subsidiaries in foreign countries, including United States territories. Cash, cash equivalents and marketable securities are concentrated subject to local restrictions with highly rated and well capitalized global financial institutions. The underlying credit worthiness and exposures to these counterparties are monitored on a regular basis in line with the company’s overall risk management procedures. Upon actual repatriation, such earnings could be subject to withholding taxes, foreign and/or U.S. state income taxes, and taxes resulting from the impact of foreign currency movements. The cash held by foreign subsidiaries is generally used to finance the subsidiaries' operational activities and future foreign investments. At March 31, 2026, management believed that sufficient liquidity is available in the U.S. through Corteva’s centralized cash management.
Summary of Cash Flows
Cash provided by (used for) operating activities was $(2,007) million for the three months ended March 31, 2026 compared to $(1,248) million for the three months ended March 31, 2025. The change was driven by the Bayer resolution payment, higher compensation payments, and lower customer prepayments.
Cash provided by (used for) investing activities was $(54) million for the three months ended March 31, 2026 compared to $(31) million for the three months ended March 31, 2025. The change was primarily driven by lower proceeds from sales and maturities of investments and sales of property, businesses and consolidated companies.
Cash provided by (used for) financing activities was $1,664 million for the three months ended March 31, 2026 compared to $1,102 million for the three months ended March 31, 2025. The change was primarily due to an increase in net transfers from Corteva.
Liquidity & Capital Resources - Years ended December 31, 2025, 2024 and 2023
Historical Sources of Liquidity
The Seed Business has generated positive net operating cash flows in historical periods.
To meet its working capital and financing requirements, the Seed Business has been reliant upon Corteva's centralized cash management, with the exception of local borrowings to finance subsidiary working capital needs and capital expenditures. Under Corteva's centralized cash management, a substantial portion of the Seed Business' cash balances have been transferred to Corteva to fund its operating and investing activities. Had the Seed Business been a standalone business operating independently of Corteva during the periods presented, the method by which the Seed Business would have financed its operations would have differed. Transfers of cash between Corteva and the Seed Business are reflected within Net transfers to Parent in the Combined Statements of Cash Flows and the Combined Statements of Equity. All debt and debt-related interest cost incurred by the Seed Business as the legal obligor has been recorded in the Combined Financial Statements.
Future Sources of Liquidity
Subsequent to the spin-off, the Seed Business will no longer participate in Corteva's centralized cash management and operational financing program. The Seed Business' ability to fund its capital needs will be affected by its ongoing ability to generate cash from operations and access to commercial paper and the capital markets. The Seed Business' current cash balance, together with cash it expects to generate from future operations and other sources of liquidity, are expected to be sufficient to finance its short- and long-term capital requirements. In addition, the Seed Business currently believes that it will have investment grade credit ratings following the spin-off; such ratings would aid the Seed Business with any potential access to public and private debt markets. The Seed Business cannot assure you what its credit ratings will be following consummation of the spin-off or at any time in the future. Additional detail related to the Seed Business' capital structure is included in the "Description of Material Indebtedness" section of this information statement.
|
|
|
|
|
|
|
|
|
(In millions) |
December 31, 2025 |
|
December 31, 2024 |
|
Cash, cash equivalents and marketable securities |
|
$ |
836 |
|
|
$ |
599 |
|
Total debt |
|
$ |
112 |
|
|
$ |
15 |
|
The Seed Business enters into short-term and long-term foreign currency loans from time-to-time by accessing uncommitted credit lines to fund working capital needs of foreign subsidiaries in the normal course of business. Interest rates are variable and determined at the time of borrowing. Total unused bank credit lines on the loans at December 31, 2025 was approximately $413 million.
The Seed Business has meaningful seasonal working capital needs based in part on providing financing to its customers. Working capital has been funded through Corteva's centralized cash management and operational financing program.
The Seed Business has factoring agreements with third-party financial institutions to sell its trade receivables under both recourse and non-recourse agreements in exchange for cash proceeds in an effort to reduce its receivables risk. For arrangements that include an element of recourse, the company provides a guarantee of the trade receivables in the event of customer default. Refer to Note 9 - Accounts and Notes Receivable - Net, to the supplemental audited Combined Financial Statements, for additional information.
The Seed Business also organizes agreements with third-party financial institutions who directly provide financing for select customers of its products in each region. Terms of the third-party loans are less than a year and programs are renewed on an annual basis. In some cases, the Seed Business guarantees a portion of the extension of such credit to such customers. Refer to Note 14 - Commitments and Contingent Liabilities, to the supplemental audited Combined Financial Statements, for more information on the Seed Business' guarantees.
The Seed Business' cash, cash equivalents and marketable securities at December 31, 2025 and 2024 are $836 million and $599 million, respectively, of which $715 million and $528 million, respectively, was held by subsidiaries in foreign countries, including United States territories. Cash, cash equivalents and marketable securities are concentrated subject to local restrictions with highly rated and well capitalized global financial institutions. The underlying credit worthiness and exposures to these counterparties are monitored on a regular basis in line with the company’s overall risk management procedures. Upon actual repatriation, such earnings could be subject to withholding taxes, foreign and/or U.S. state income taxes, and taxes resulting from the impact of foreign currency movements. The cash held by foreign subsidiaries is generally used to finance the subsidiaries' operational activities and future foreign investments. At December 31, 2025, management believed that sufficient liquidity is available in the U.S. through Corteva's centralized cash management.
Summary of Cash Flows
|
|
|
|
|
|
|
|
|
|
|
|
|
|
For the Year Ended December 31, |
|
(In millions) |
2025 |
|
2024 |
|
2023 |
|
Cash provided by (used for) operating activities |
|
$ |
2,506 |
|
|
$ |
1,777 |
|
|
$ |
732 |
|
Cash provided by (used for) operating activities – continuing operations for the year ended December 31, 2025 was $2,506 million compared to $1,777 million for the year ended December 31, 2024. The change was primarily driven by higher collections on receivables, favorable changes in customer prepayments and collections, and favorable changes in accounts payable due to lower payments to third-party growers resulting from lower commodity costs and planted area. These favorable changes were partially offset by lower net income and an unfavorable change in inventories due to a lower comparable decline in volumes and the sale of lower-cost inventory in the current year.
Cash provided by (used for) operating activities – continuing operations for the year ended December 31, 2024 was $1,777 million compared to $732 million for the year ended December 31, 2023. The change was primarily driven by higher net income and favorable changes in working capital. The favorable changes in inventories were driven by production reductions to match demand and the sale of higher-cost inventory. Within accounts payable, lower payments to third-party growers resulted from lower commodity costs and production plans, supplemented by a change in inventory purchasing patterns. These movements were partially offset by unfavorable changes in receivables driven by slower collections and higher sales on credit terms.
|
|
|
|
|
|
|
|
|
|
|
|
|
|
For the Year Ended December 31, |
|
(In millions) |
2025 |
|
2024 |
|
2023 |
|
Cash provided by (used for) investing activities |
|
$ |
(352 |
) |
|
$ |
(362 |
) |
|
$ |
(259 |
) |
Cash provided by (used for) investing activities was $(352) million for the year ended December 31, 2025 compared to $(362) million for the year ended December 31, 2024. While the change between the two periods was insignificant, it was primarily due to higher net cash inflows on investments and proceeds from sales of property, partially offset by higher capital expenditures.
Cash provided by (used for) investing activities was $(362) million for the year ended December 31, 2024 compared to $(259) million for the year ended December 31, 2023. The change was primarily due to higher capital expenditures and lower proceeds from sales and maturities of investments.
Capital expenditures totaled $346 million, $338 million, and $303 million for the years ended December 31, 2025, 2024, and 2023. The Seed Business expects 2026 capital expenditures to be approximately $400 million.
|
|
|
|
|
|
|
|
|
|
|
|
|
|
For the Year Ended December 31, |
|
(In millions) |
2025 |
|
2024 |
|
2023 |
|
Cash provided by (used for) financing activities |
|
$ |
(1,945 |
) |
|
$ |
(1,383 |
) |
|
$ |
(570 |
) |
Cash provided by (used for) financing activities was $(1,945) million for the year ended December 31, 2025 compared to $(1,383) million for the year ended December 31, 2024. The change was primarily due to an increase in net transfers to Corteva, partially offset by net proceeds from debt.
Cash provided by (used for) financing activities was $(1,383) million for the year ended December 31, 2024 compared to $(570) million for the year ended December 31, 2023. The change was primarily due to an increase in net transfers to Corteva.
Critical Accounting Estimates
The Seed Business' significant accounting policies are more fully described in Note 2 - Summary of Significant Accounting Policies, to the Supplemental Audited Combined Financial Statements. Management believes that the application of these policies on a consistent basis enables the Seed Business to provide the users of the financial statements with useful and reliable information about the Seed Business' operating results and financial condition.
The preparation of the Combined Financial Statements in conformity with generally accepted accounting principles in the United States of America (“GAAP”) requires management to make estimates and assumptions that affect the reported amounts, including, but not limited to, receivable and inventory valuations, impairment of tangible and intangible assets, long-term employee benefit obligations, income taxes, environmental matters and litigation. Management's estimates are based on historical experience, facts and circumstances available at the time and various other assumptions that are believed to be reasonable. The Seed Business reviews these matters and reflects changes in estimates as appropriate. Management believes that the following represent the more critical judgment areas in the application of the Seed Business' accounting policies which could have a material effect on the Seed Business' financial position, liquidity or results of operations.
Environmental Matters
Accruals for environmental matters are recorded when it is probable that a liability has been incurred and the amount of the liability can be reasonably estimated. At December 31, 2025, the Seed Business had accrued obligations of $42 million for probable environmental remediation and restoration costs, including $41 million for the remediation of the AltEn facility near Mead, Nebraska for which Corteva’s Seed Business is one of six seed companies participating in the Nebraska Department of Environment and Energy's Voluntary Cleanup Program. As remediation activities vary substantially in duration and cost from site to site, it is difficult to develop precise estimates of future site remediation costs. The Seed Business' estimates are based on a number of factors, including the complexity of the geology, the nature and extent of contamination, the type of remedy, the outcome of discussions with regulatory agencies and other Potentially Responsible Parties ("PRPs") at multi-party sites and the number of and financial viability of other PRPs. Therefore, considerable uncertainty exists with respect to environmental remediation and costs, and, under adverse changes in circumstances, it is reasonably possible that the ultimate cost with respect to these particular matters could exceed the accrued obligations amount. Consequently, it is reasonably possible that environmental remediation and restoration costs in excess of amounts accrued could have a material impact on the Seed Business' results of operations, financial condition and cash flows. For further discussion, see “Environmental Matters” section below within the Management’s Discussion and Analysis of the Seed Business (Supplemental) and Note 14 - Commitments and Contingent Liabilities, to the supplemental audited Combined Financial Statements.
Legal Contingencies
The Seed Business’ results of operations could be affected by significant litigation adverse to the Seed Business, including product liability claims, patent infringement and antitrust claims, and claims for third-party property damage or personal injury stemming from alleged environmental torts. The Seed Business records accruals for legal matters when the information available indicates that it is probable that a liability has been incurred and the amount of the loss can be reasonably estimated. Management makes adjustments to
these accruals to reflect the impact and status of negotiations, settlements, rulings, advice of counsel and other information and events that may pertain to a particular matter. Predicting the outcome of claims and lawsuits and estimating related costs and exposure involves substantial uncertainties that could cause actual costs to vary materially from estimates. In making determinations of likely outcomes of litigation matters, management considers many factors. These factors include, but are not limited to, the nature of specific claims including unasserted claims, the Seed Business' experience with similar types of claims, the jurisdiction in which the matter is filed, input from outside legal counsel, the likelihood of resolving the matter through alternative dispute resolution mechanisms, and the matter's current status. Considerable judgment is required in determining whether to establish a litigation accrual when an adverse judgment is rendered against the company in a court proceeding. In such situations, the Seed Business will not recognize a loss if, based upon a thorough review of all relevant facts and information, management believes that it is probable that the pending judgment will be successfully overturned on appeal. A detailed discussion of significant litigation matters is contained in Note 14 - Commitments and Contingent Liabilities, to the supplemental audited Combined Financial Statements.
Income Taxes
The breadth of the Seed Business’ operations and the global complexity of tax regulations require assessments of uncertainties and judgments in estimating taxes the Seed Business will ultimately pay. The final taxes paid are dependent upon many factors, including negotiations with taxing authorities in various jurisdictions, outcomes of tax litigation and resolution of disputes arising from federal, state and international tax audits in the normal course of business. The resolution of these uncertainties may result in adjustments to the Seed Business’ tax assets and tax liabilities. It is reasonably possible that changes to the Seed Business’ global unrecognized tax benefits could be significant; however, due to the uncertainty regarding the timing of completion of audits and possible outcomes, a current estimate of the range of increases or decreases that may occur within the next twelve months cannot be made.
Deferred income taxes result from differences between the financial and tax basis of the Seed Business’ assets and liabilities and are adjusted for changes in tax rates and tax laws when changes are enacted. Valuation allowances are recorded to reduce deferred tax assets when it is more likely than not that a tax benefit will not be realized. Significant judgment is required in evaluating the need for and magnitude of appropriate valuation allowances against deferred tax assets. The realization of these assets is dependent on generating future taxable income, as well as successful implementation of various tax planning strategies. For example, changes in facts and circumstances that alter the probability that the Seed Business will realize deferred tax assets could result in recording a valuation allowance, thereby reducing the deferred tax asset and generating a deferred tax expense in the relevant period. In some situations, these changes could be material.
At December 31, 2025, the Seed Business had a net deferred tax liability balance of $754 million, inclusive of a valuation allowance of $403 million. Realization of deferred tax assets is expected to occur over an extended period of time. As a result, changes in tax laws, assumptions with respect to future taxable income, and tax planning strategies could result in adjustments to deferred tax assets.
See Note 7 - Income Taxes, to the Supplemental Audited Combined Financial Statements, for additional information.
Valuation of Assets and Impairment Considerations
The assets and liabilities of acquired businesses are measured at their estimated fair values at the dates of acquisition. The excess of the purchase price over the estimated fair value of the net assets acquired, including identified intangible assets, is recorded as goodwill. The determination and allocation of fair value to the assets acquired and liabilities assumed is based on various assumptions and valuation methodologies requiring considerable management judgment, including estimates based on historical information, current market data and future expectations. The principal assumptions utilized in the Seed Business’ valuation methodologies include revenue growth rates, EBITDA margin estimates, royalty rates, and discount rates. Although the estimates are deemed reasonable by management based on information available at the dates of acquisition, those estimates are inherently uncertain.
Assessment of the potential impairment of goodwill, other intangible assets, property, plant and equipment, investments in nonconsolidated affiliates, and other assets is an integral part of the Seed Business’ normal ongoing review of operations. Testing for potential impairment of these assets is significantly dependent on numerous assumptions and reflects management's best estimates at a particular point in time. The dynamic economic environment in which the Seed Business’ segments operate, and key economic and business assumptions with respect to projected selling prices, market growth and inflation rates, can significantly affect the outcome of impairment tests. Estimates based on these assumptions may differ significantly from actual results. Changes in factors and assumptions used in assessing potential impairments can have a significant impact on the existence and magnitude of impairments, as well as the time in which such impairments are recognized. In addition, the Seed Business’ continually reviews its portfolio of assets to ensure they are achieving their greatest potential and are aligned with the company’s growth strategy. Strategic decisions involving a particular group of assets may trigger an assessment of the recoverability of the related assets. Such an assessment could result in impairment losses.
The Seed Business tests goodwill and other indefinite-lived intangible assets for impairment annually (during the fourth quarter), or more frequently when events or changes in circumstances indicate it is more likely than not that the fair value of a reporting unit has declined below its carrying value. Goodwill is evaluated for impairment using qualitative and / or quantitative testing procedures. The
Seed Business performs goodwill impairment testing at the reporting unit level, which is defined as the operating segment or one level below the operating segment. One level below the operating segment, or component, is a business in which discrete financial information is available and regularly reviewed by segment management. The Seed Business aggregates certain components into reporting units based on economic similarities. The company’s reporting units are Americas and Rest of World.
For purposes of goodwill impairment testing, the Seed Business has the option to first perform qualitative testing to determine whether it is more likely than not that the fair value of a reporting unit is less than its carrying value. Qualitative factors assessed at the Seed Business level include GDP growth rates, long-term commodity prices, equity and credit market activity, discount rates, and overall financial performance. Qualitative factors assessed at the reporting unit level include changes in industry and market structure, competitive environments, and new product launches, cost factors such as raw material prices, and financial performance of the reporting unit. If the Seed Business chooses not to complete a qualitative assessment for a given reporting unit or if the initial assessment indicates that it is more likely than not that the carrying value of a reporting unit exceeds its estimated fair value, additional quantitative testing is required.
If additional quantitative testing is required, the reporting unit’s fair value is compared with its carrying amount, and an impairment charge, if any, is recognized for the amount by which the carrying amount exceeds the reporting unit’s fair value, limited to the amount of goodwill associated with the reporting unit. The Seed Business determines fair values for each of the reporting units using a combination of a discounted cash flow model (a form of the income approach), utilizing Level 3 unobservable inputs, and the market approach.
Under the income approach, fair value is determined based on the present value of estimated future cash flows, discounted at an appropriate risk-adjusted rate. The Seed Business’ significant assumptions in these analyses include future cash flow projections, weighted average cost of capital, the terminal growth rate and the tax rate. The Seed Business' estimates of future cash flows are based on current regulatory and economic climates, recent operating results, and assumed business strategy from a market participant perspective and includes an estimate of long-term future growth rates based on such strategy. Actual results may differ from those assumed in the Seed Business’ forecasts. The Seed Business derives its discount rates using a capital asset pricing model and analyzes published rates for industries relevant to its reporting units to estimate the cost of equity financing. The Seed Business uses discount rates that are commensurate with the risks and uncertainty inherent in the respective reporting units and in its internally developed forecasts. Under the market approach, the Seed Business uses metrics of publicly traded companies or historically completed transactions for comparable companies.
Estimating the fair value of reporting units requires the use of estimates and significant judgments that are based on a number of factors including actual operating results. It is reasonably possible that the judgments and estimates described above could change in future periods. The Seed Business believes the current assumptions and estimates utilized are both reasonable and appropriate.
The Seed Business performed annual quantitative testing on both of its reporting units for the years ended December 31, 2024 and 2023. The assessment was performed using a combination of the discounted cash flow model (a form of the income approach) and the market approach. No goodwill impairment charges were necessary for the years ended December 31, 2024 or 2023.
Based on the qualitative annual goodwill impairment analyses performed for the year ended December 31, 2025, it was concluded more likely than not that the fair value of each reporting unit exceeded its respective carrying value and, therefore, a quantitative test was not performed. No goodwill impairment charge was necessary for the year ended December 31, 2025.
Prepaid Royalties
The Seed Business currently has certain third-party biotechnology trait license agreements, which require up-front and variable payments subject to the licensor meeting certain conditions. These payments are reflected as other current assets and other assets and are amortized to cost of goods sold as seeds containing the respective trait technology are utilized over the term of the license. The rate of royalty amortization expense recognized is based on the Seed Business’ strategic plans which include various assumptions and estimates including product portfolio, market dynamics, farmer preferences, growth rates and projected planted acres. Changes in factors and assumptions included in the strategic plans, including potential changes to the product portfolio in favor of internally developed biotechnology, could impact the rate of recognition of the relevant prepaid royalty.
The Seed Business holds a non-exclusive license in the United States and Canada for the Monsanto Company’s Genuity® Roundup Ready 2 Yield® glyphosate tolerance trait and Roundup Ready 2 Xtend® glyphosate and dicamba tolerance trait for soybeans, which was obtained by the Seed Business’ wholly owned subsidiary, Pioneer Hi-Bred International, Inc. (“Pioneer”) (“Roundup Ready 2 License Agreement”). Each of these licensed technologies are now trademarks of the Bayer Group, which acquired the Monsanto Company in 2018. The prepaid royalty asset relates to a series of up-front, fixed and variable royalty payments to utilize the traits in Pioneer’s soybean product mix. The Seed Business' historical expectation was that the technology licensed under the Roundup Ready 2 License Agreement would be used as the primary herbicide tolerance trait platform in the Pioneer® brand soybean through the term of the agreement. Dow Agrosciences LLC and MS Technologies, L.L.C. jointly developed and own the Enlist E3TM herbicide tolerance
trait for soybeans which provides tolerance to 2,4-D choline in Enlist Duo® and Enlist One® herbicides, as well as glyphosate and glufosinate herbicides. In connection with the validation of breeding plans and large-scale product development timelines, during 2019 the Seed Business committed to accelerate the ramp up of the Enlist E3TM trait platform in its soybean portfolio mix across all brands, including Pioneer® brands. Due to the five-year ramp-up of Enlist E3TM, the Seed Business significantly reduced the volume of products with the Roundup Ready 2 Yield® and Roundup Ready 2 Xtend® herbicide tolerance traits, with expected minimal use of the trait platform thereafter for the remainder of the Roundup Ready 2 License Agreement (the “Transition Plan”). The rate of royalty expense had therefore increased significantly through higher amortization of the prepaid royalty as fewer seeds containing the respective trait were expected to be utilized.
In connection with the departure from these traits in the Seed Business’ product portfolio in favor of the Enlist E3TM trait platform, beginning January 1, 2020 the Seed Business presents and discloses accelerated prepaid royalty amortization expense associated with these prepaid royalties as a component of restructuring and asset related charges - net in the Combined Statement of Operations. The accelerated prepaid royalty amortization expense represents the difference between the rate of amortization based on the revised number of units expected to contain the Roundup Ready 2 Yield® and Roundup Ready 2 Xtend® trait technology and the per unit cash rate per the Roundup Ready 2 License Agreement. For the year ended December 31, 2025, the Seed Business recognized charges of $— million in Restructuring and asset related charges - net in the Combined Statement of Operations from non-cash accelerated prepaid royalty amortization expense, as the amortization was complete as of the second quarter of 2024. For further discussion of accelerated prepaid royalty amortization, refer to Note 2 - Summary of Significant Accounting Policies, to the supplemental audited Combined Financial Statements.
Off-Balance Sheet Arrangements
Certain Guarantee Contracts
Information with respect to the Seed Business’ guarantees is included in Note 14 - Commitments and Contingent Liabilities, to the supplemental audited Combined Financial Statements. Historically, the Seed Business has not made significant payments to satisfy guarantee obligations; however, the Seed Business believes it has the financial resources to satisfy these guarantees.
Contractual Obligations
Our principal commitments consist of long-term debt, operating and finance lease obligations and environmental remediation obligations. Refer to Note 13 - Short-Term Borrowings, Long-Term Debt and Available Credit Facilities, Note 12 – Leases, and Note 14 - Commitments and Contingent Liabilities, to the supplemental audited Combined Financial Statements, respectively, for further discussion.
Information related to the Seed Business' other significant contractual obligations are summarized in the following table:
|
|
|
|
|
|
|
|
|
|
|
|
|
|
|
|
Payments Due In |
|
(In millions) |
Total at
December 31, 2025 |
|
2026 |
|
2027 and
beyond |
|
Expected cumulative cash requirements for interest payments
through maturity |
|
$ |
— |
|
|
$ |
— |
|
|
$ |
— |
|
Purchase obligations 1 |
|
817 |
|
|
|
377 |
|
|
|
440 |
|
License agreements 2,3 |
|
160 |
|
|
|
46 |
|
|
|
114 |
|
Other liabilities 2,4 |
|
122 |
|
|
|
18 |
|
|
|
104 |
|
Total 5 |
|
$ |
1,099 |
|
|
$ |
441 |
|
|
$ |
658 |
|
1.Represents enforceable and legally binding agreements in excess of $1 million to purchase goods or services that specify fixed or minimum quantities; fixed, minimum or variable price provisions; and the approximate timing of the agreement.
2.Included in the Combined Financial Statements.
3.Represents undiscounted remaining payments under Pioneer license agreements (approximately $145 million on a discounted basis).
4.Includes liabilities related to employee-related benefits other than pension and other post-employment benefits, asset retirement obligations and other noncurrent liabilities.
5.Due to uncertainty regarding the completion of tax audits and possible outcomes, the timing of certain payments of obligations related to unrecognized tax benefits cannot be made and have been excluded from the table above. Refer to Note 7 - Income Taxes, to the supplemental audited Combined Financial Statements, for additional detail.
As of March 31, 2026, there have been no material changes to the Seed Business' contractual obligations outside the ordinary course of business from those reported in the preceding table.
The Seed Business expects to meet its contractual obligations through its current and planned future sources of liquidity and believes it has the financial resources to satisfy the contractual obligations that arise in the ordinary course of business.
Long-term Employee Benefits
The Seed Business has various obligations to its employees and retirees. The Seed Business maintains retirement-related programs in many countries that have a long-term impact on the Seed Business' earnings and cash flows. These plans are typically defined benefit pension plans, as well as medical, dental and life insurance benefits for pensioners and survivors and disability benefits for employees (“other post-employment benefits” or “OPEB”).
Pension coverage for employees of the Seed Business' non-U.S. consolidated subsidiaries is provided, to the extent deemed appropriate, through separate plans. The Seed Business regularly explores alternative solutions to meet its global pension obligations in the most cost effective manner possible as demographics, life expectancy and country-specific pension funding rules change. Where permitted by applicable law, the Seed Business reserves the right to change, modify or discontinue its plans that provide pension, medical, dental, life insurance and disability benefits.
Benefits under defined benefit pension plans are based primarily on years of service and employees' pay near retirement. On November 30, 2018, the pay and service amounts used to calculate the pension benefits for active employees who participate in the U.S. pension plans were frozen. In addition, OPEB eligible employees who were under the age of 50 as of November 30, 2018 will not receive post-employment medical, dental and life insurance benefits. The majority of employees hired in the U.S. on or after January 1, 2007 are not eligible to participate in the pension and post-employment medical, dental and life insurance plans, but are eligible to participate in the defined contribution plans.
In December 2020, the Seed Business amended its retiree medical, dental and life insurance plans resulting in the company no longer providing retiree dental and life insurance benefits effective January 1, 2022 and Corteva’s portion of the cost of non-Medicare retiree medical coverage no longer being adjusted for cost increases, which capped the Corteva cost at the level as of December 31, 2021.
The Seed Business’ U.S. defined benefit pension plans (“U.S. pension plans”) are unfunded, with benefits paid from operating cash flows. Funding for each pension plan other than the U.S. pension plans is governed by the rules of the sovereign country in which it operates. Thus, there is not necessarily a direct correlation between pension funding and pension expense. In general, however, improvements in plans' funded status tend to moderate subsequent funding needs. The Seed Business contributed $3 million, $2 million, and $3 million to its funded pension plans other than the U.S. pension plans for the years ended December 31, 2025, 2024 and 2023, respectively. The Seed Business made benefit payments of $12 million, $15 million, and $15 million in relation to its unfunded pension plans for the years ended December 31, 2025, 2024 and 2023, respectively.
The Seed Business' OPEB plans are unfunded and the cost of the approved claims is paid from operating cash flows. Pre-tax cash requirements to cover actual net claims costs and related administrative expenses were $11 million, $10 million, and $11 million for the years ended December 31, 2025, 2024, and 2023, respectively. Changes in cash requirements reflect the net impact of per capita health care cost, demographic changes, plan amendments and changes in participant premiums, co-pays and deductibles.
In 2026, the Seed Business expects to contribute approximately $9 million to its U.S. pension plans, approximately $6 million to its non-U.S. pension plans and approximately $11 million to its OPEB plans.
The Seed Business’ income can be significantly affected by pension and defined contribution benefits as well as OPEB costs. During the three months ended March 31, 2026, the Seed Business' income (loss) before income taxes was affected by net periodic benefit (credit) cost related to pension and OPEB plans of $2 million and by defined contributions of $39 million.
The following table summarizes the extent to which the Seed Business' income (loss) before income taxes for the years ended December 31, 2025, 2024 and 2023 was affected by pre-tax charges related to long-term employee benefits:
|
|
|
|
|
|
|
|
|
|
|
|
|
|
For the Year Ended December 31, |
|
(In millions) |
2025 |
|
2024 |
|
2023 |
|
Net periodic benefit (credit) cost - pension and OPEB |
|
$ |
15 |
|
|
$ |
13 |
|
|
$ |
17 |
|
Defined contributions |
|
|
75 |
|
|
|
72 |
|
|
|
67 |
|
Long-term employee benefit plan (credit) charges |
|
$ |
90 |
|
|
$ |
85 |
|
|
$ |
84 |
|
The above (credit) charges for pension and OPEB are determined as of the beginning of each period. Long-term employee benefit plan (credits) costs were $90 million and $85 million for the years ended December 31, 2025 and 2024, respectively. The change is mainly due to less-than-expected return on plan assets during 2024 for non-U.S. pension plans.
For 2026, long-term employee benefit costs are expected to decrease by approximately $6 million. The change is mainly due to better-than-expected return on plan assets during 2025 for non-U.S. pension plans.
Environmental Matters
The Seed Business operates seed production, product handling and distribution facilities that are subject to a broad array of environmental laws and regulations. Such rules are subject to change by the implementing governmental agency, and the company monitors these changes closely. Company policy requires that all operations fully meet or exceed legal and regulatory requirements. In addition, the company implements voluntary programs to reduce air emissions, minimize the generation of hazardous waste, decrease the volume of water use and discharges, increase the efficiency of energy use and reduce the generation of persistent, bioaccumulative and toxic materials.
Pre-tax environmental expenses charged to Net income (loss) were $— million for the three months ended March 31, 2026, and $37 million, $2 million and $10 million for the years ended December 31, 2025, 2024 and 2023, respectively.
As a result of its operations, the company incurs costs for pollution abatement activities including waste collection and disposal, installation and maintenance of air pollution controls and wastewater treatment, emissions testing and monitoring, and obtaining permits. The company also incurs costs related to environmental related research and development activities including environmental field and treatment studies as well as toxicity and degradation testing to evaluate the environmental impact of products and raw materials. Such amounts were not significant for the three months ended March 31, 2026 and the years ended December 31, 2025, 2024 or 2023.
Remediation Accrual
Changes in the remediation accrual balance are summarized below:
|
|
|
|
|
(In millions) |
|
|
Balance at December 31, 2023 |
|
$ |
32 |
|
Remediation payments |
|
|
(18 |
) |
Net increase in remediation accrual |
|
|
2 |
|
Balance at December 31, 2024 |
|
$ |
16 |
|
Remediation payments |
|
|
(11 |
) |
Net increase in remediation accrual |
|
|
37 |
|
Balance at December 31, 2025 |
|
$ |
42 |
|
Remediation payments |
|
|
(3 |
) |
Net increase in remediation accrual |
|
|
— |
|
Balance at March 31, 2026 |
|
$ |
39 |
|
Considerable uncertainty exists with respect to environmental remediation costs and, under adverse changes in circumstances, the potential liability may exceed the amount accrued as of December 31, 2025. However, based on existing facts and circumstances, management does not believe that any loss, in excess of amounts accrued, related to remediation activities at any individual site will have a material impact on the financial position, liquidity or results of operations of the Seed Business. Refer to Note 14 – Commitments and Contingent Liabilities, to the Supplemental Audited Combined Financial Statements, for further details on the company’s accrued obligations at December 31, 2025.
As of December 31, 2025, Corteva’s Seed Business is one of six seed companies participating in the Nebraska Department of Environment and Energy's Voluntary Cleanup Program for the remediation of the AltEn facility near Mead, Nebraska. The Seed Business has not been notified of potential liability under the Comprehensive Environmental Response, Compensation and Liability Act (“Superfund”) or similar state laws at any sites in the United States.
Environmental Capital Expenditures
Capital expenditures for environmental projects, either required by law or necessary to meet the Seed Business' internal environmental goals, were approximately $6 million for the year ended December 31, 2025. The Seed Business currently estimates expenditures for environmental-related capital projects to be approximately $5 million in 2026.
Climate Change
The Seed Business believes that climate change is an important global environmental concern that presents risks and opportunities, of which the Sustainability and Innovation Committee of Corteva’s Board of Directors maintains oversight. Management regularly assesses and manages climate-related issues. Across its business, individuals who are responsible for climate-related initiatives may have annual performance goals tied to the delivery of projects related to these initiatives.
Continuing political and social attention to climate change and its impacts has resulted in regulatory and market-based approaches to limit greenhouse gas emissions. The Seed Business believes there is a way forward for sustainable climate change mitigation that both enables farmers to meet the demands of a growing population and secures the economic future for the vast majority of the world’s population who depend on agriculture for their livelihoods.
Extreme and volatile weather due to climate change may have an adverse impact on our customers’ ability to use the Seed Business’ products and seed supply, potentially reducing sales volumes, revenues and margins. The Seed Business continuously evaluates opportunities for existing and new product and service offerings to meet the anticipated demands of climate-smart agriculture and mitigate the impact of extreme and volatile weather. The Seed Business integrates processes for identifying, assessing and managing climate-related risk into its enterprise risk management program.
While the Seed Business is working to reduce its role in the emission of greenhouse gasses, it also invests in enabling innovation that can create a more resilient agriculture value chain. The Seed Business engages with multiple stakeholders and partners around the globe regarding its innovations and actionable ideas to help safeguard the health and well-being of the planet and its people.
QUANTITATIVE AND QUALITATIVE DISCLOSURES ABOUT MARKET RISK
The Seed Business' global operations are exposed to financial market risks relating to fluctuations in foreign currency exchange rates, commodity prices, and interest rates. The Seed Business has established a variety of programs including the use of derivative instruments and other financial instruments to manage the exposure to financial market risks as to minimize volatility of financial results. Through its participation in Corteva’s hedging program, the Seed Business enters into derivative instruments to hedge its exposure to foreign currency and commodity price risks under established procedures and controls. For additional information on these derivatives and related exposures, see Note 17 - Financial Instruments, to the supplemental audited Combined Financial Statements. Decisions regarding whether or not to hedge a given commitment are made on a case-by-case basis, taking into consideration the amount and duration of the exposure, market volatility and economic trends. Foreign currency exchange contracts may be used, from time to time, to manage near-term foreign currency cash requirements.
Foreign Currency Exchange Rate Risks
The Seed Business has significant international operations resulting in a large number of currency transactions that result from international sales, purchases, investments and borrowings. The primary currencies for which the Seed Business has an exchange rate exposure are the Brazilian real, Canadian dollar, Euro and Turkish lira. Through its participation in Corteva’s hedging program, the Seed Business uses foreign currency exchange contracts to offset its net exposures, by currency, related to the foreign currency denominated monetary assets and liabilities of its operations. The Seed Business also uses foreign currency exchange contracts to offset a portion of the Seed Business' exposure to certain forecasted transactions as well as the translation of foreign currency-denominated earnings. In addition, the Seed Business uses commodity contracts to offset risks associated with foreign currency devaluation in certain countries. Since the hedging instruments mitigate combined Corteva exposures as opposed to assets, liabilities and cash flows attributed only to the Seed Business, the Seed Business has been allocated a pro rata share of the income statement activity related to these hedges.
Concentration of Credit Risk
The Seed Business maintains cash and cash equivalents, marketable securities, derivatives and certain other financial instruments with various financial institutions. These financial institutions are generally highly rated and geographically dispersed and the Seed Business has a policy to limit the dollar amount of credit exposure with any one institution.
As part of the Seed Business’ financial risk management processes, it continuously evaluates the relative credit standing of all of the financial institutions that service the Seed Business and monitors actual exposures versus established limits. The Seed Business has not sustained credit losses from instruments held at financial institutions.
The Seed Business' sales are not materially dependent on any single customer. Credit risk associated with its receivables balance is representative of the geographic, industry and customer diversity associated with the Seed Business’ global product lines.
BUSINESS
Our Company
We are recognized by farmers as a leader in the seed technology markets globally with a century-long legacy of customer loyalty, technological leadership, and financial strength originating with our iconic, flagship Pioneer® brand, the number one corn and soybean brand by market share in the United States. Through branded sales and licensing arrangements, our business develops and supplies high quality, best-in-class germplasm combined with advanced traits to produce higher yields for farmers around the world. Our seed technology solutions fuel farmer productivity in more than [70] countries and generated annual net sales of $9.9 billion for the year ended December 31, 2025. Our strategy is built upon providing farmers with the right mix of seed technology solutions to maximize their yields and to improve their profitability, while strengthening customer relationships and supporting an abundant food and fuel supply for a growing global population and the next generation demand for biofuels.
We are a global leader in developing and supplying advanced germplasm and traits that produce optimum yield for farms around the world and strive to hold the number one or number two brand position in every seed market where we operate. We are a revenue share leader in many of our key seed markets, including North America corn and soybeans, Europe corn and sunflower, as well as Brazil, India, South Africa and Argentina corn. We offer trait technologies that improve resistance to weather, disease, insects and weeds, and trait technologies that enhance food and nutritional characteristics. We also provide digital solutions that assist farmer decision-making with a view to optimize product selection and, ultimately, maximize yield and profitability potential for farmers.
We aspire to create shareholder value as an industry leader in advanced genetics that discovers and develops groundbreaking solutions for farmers around the world by developing products that continue to provide genetic gain and grow our seed and trait licensing income. Another expected value driver is our disciplined capital and resource allocation processes, including a performance-based culture, with a strong focus on capital discipline, including through stable dividends and share repurchases, selectively assessing merger or acquisition opportunities and continuing to advance our science-based innovation. We anticipate that our innovation investments, including those through our growth platforms in licensing, gene editing, biofuels, and hybrid wheat, will drive our continued growth through the next decade.
Our innovation is focused on delivering a wide range of improved products and services to our customers. New products are crucial to solving farmers’ productivity challenges amid a growing global population while addressing natural resistance, regulatory changes, and competitive dynamics. Our investment in technology-based and solution-based product offerings allow us to meet farmers’ evolving needs while generating sufficient returns that reflect the value of our technology. Meanwhile, through our unique, advantaged routes to market, we continue to work face-to-face with farmers around the world to deeply understand their needs and inform our next generation of innovations.
Our Industry
The global agricultural landscape is rapidly changing as farmers continue to face a variety of challenges, including the need to feed, fuel and clothe a growing population with limited land and declining yields due to increasing temperatures and other related weather and climate challenges. Consumers are also reshaping the industry by demanding healthier, more affordable and safer food, through their increased focus on sustainability and greater transparency to facilitate their understanding of the agricultural products they purchase and consume. The industry also faces rules and regulations and varying levels of government support, which may be enacted to protect farmers, consumers or the environment, which often vary across geographies and can rapidly change.
These challenges, along with available data analysis allowing farmers to better understand the precise needs of a specific crop in a specific region, create strong incentives for farmers to invest in high quality seed technology inputs to maximize yields, optimize resources and protect harvests in an environmentally sustainable manner. These technological advances in the agriculture industry challenge agriculture companies to develop customized technology-based and solution-based product offerings for farmers that address their specific needs and protect yield through varying conditions.
Given these rapidly evolving dynamics, it is critical for companies in the agriculture industry to be agile in adapting their product offerings to respond to changing farmer needs while addressing government regulations and market trends on both a global and localized scale. Companies in our industry in turn compete on the basis of germplasm and trait leadership; customer service; price; quality; and cost competitiveness, with an intensified focus on research and development (“R&D”). While the industry is evolving rapidly, the time and cost to launch new products has only increased with biotech traits taking approximately 16 years to commercialize. Our response to these global macro-trends is to leverage our deep farmer relationships and our industry leading platform, as well as seeking strategic
partnerships and mergers or acquisitions, to provide customized solutions and transformative technologies to meet the evolving needs of farmers.
Against this competitive landscape, Vylor intends to leverage its competitive strengths and harness its strong culture to win in the agriculture marketplace by quickly, effectively and attractively delivering solutions that improve the profitability, efficiency and sustainability of farms globally.
Our Competitive Strengths
We believe the following attributes provide us with a competitive advantage in our industry:
Leading technology position in key markets
We are a technological leader in many of our key seed markets, including North America corn and soybeans, Europe corn and sunflower, as well as Brazil, India, South Africa and Argentina corn. Our brand portfolio consists of some of the most recognized and premium brands in agriculture, such as our flagship premium Pioneer® brand and our Enlist® soybeans, which remain the leading soybean seed technology in the United States. We also have the largest and most robust germplasm pool in the world, spanning more than ten crops, including key crops such as corn, soybeans and sunflowers, providing us with a strong foundation for future value creation.
Innovation investment
We have historically invested and will continue to invest significant funds in R&D. We have created one of the broadest and most innovative pipelines in the agricultural input industry. Our leading digital breeding and genetics capabilities accelerate identification of native traits for desirable qualities such as yield maximization as well as drought, disease and insect resistance. By integrating the use of gene editing and artificial intelligence in advancing these technologies, we expect to be well-positioned to advance more tailored technological solutions faster to respond to agriculture's greatest productivity and environmental challenges.
Strong customer relationships
We are a trusted partner in the global agriculture and food community, having earned the confidence of farmers and our communities. Our combination of market penetration, strong brand portfolio, robust germplasm library, and genetics expertise allows us to serve as a trusted partner addressing a wide range of farmer needs in all major geographic regions and in many major crops. Our customer service model “walks the acre,” with our agents meeting face-to-face with farmers providing them with a premium, high-touch experience. In certain cases, these relationships extend over multiple generations. Through our unique direct access model, we continue to foster strong relationships by developing a deeper understanding of each farmer’s business. We are specialists in our products and the customers and regions we serve, and we customize our offerings to the market by understanding and responding to specific regional opportunities and challenges. Our knowledge of the customer also enhances our ability to effectively introduce new products that meet customer needs. We introduce test concepts to farmers in target markets years prior to market launches, allowing farmers to provide regular feedback on our new products and validate the efficacy of our products, which drives demand. We also continue to listen and solicit feedback from farmers after product launches in order to address their needs and continuously improve our offerings. This approach enhances the success of our new product launches. These strong customer relationships afford us the opportunity to anticipate customer needs and utilize this information to develop solutions that increase our likelihood of maintaining our customers and continuing to serve as their trusted provider.
Deep industry expertise
We have a strong management team that combines in-depth industry experience and decades of demonstrated leadership. Charles V. Magro, who will be our Chief Executive Officer, is the current Chief Executive Officer of Corteva. Our executive management team has, combined, approximately 95 years of industry experience and has retained top talent from Corteva, providing a track record of success and continuity. Meanwhile, our team of dedicated R&D scientists will continue to collaborate with external partners to advance agriculture systems and serves as a thoughtful, diligent advisor for farmers, communities, policymakers, regulatory bodies and institutions.
Our Strategy
We believe agriculture continues to undergo a global transformation, driven by population growth, environmental challenges and societal changes. As demand for food and fuel continues to grow, the pressure on farms to increase productivity and output will remain high. We believe this requirement provides the foundation of long-term opportunity in agriculture.
Our strategy is to combine our proven innovation capability with our unmatched customer access to provide farmers with the right mix of seeds and digital solutions to maximize their yields and support their profitability, while strengthening customer relationships and contributing to an abundant food and fuel supply to support a growing global population. We plan to leverage the work already done by Corteva, while enhancing its existing strategies, operating priorities and business focus through a more streamlined, efficient and focused operating structure. We also believe that by operating as a pure-play seed technology business, we can more sharply focus on the innovation needs of farmers and instill a culture that best supports our strategy.
To drive industry-leading value creation, we will continue to prioritize:
•Instilling a strong, performance-based, inclusive, customer-centric culture.
•Developing innovative solutions that improve farmer productivity and global food and fuel security.
•Delivering above-market growth via our robust new product pipeline and best-in-class routes to market.
•Driving disciplined capital and resource allocation with a strong focus on return on invested capital.
•Maintaining a best-in-class cost structure.
More broadly, we believe the following strategic priorities will continue to enable us to create significant value for our customers while delivering strong financial returns to our stockholders.
Growing Core Revenue Streams
We will aim to expand our product portfolio by adding approximately 200 to 300 seed hybrids and varieties each year that incorporate genetic traits and agronomic characteristics intended to improve yield potential, performance consistency, and risk management for growers. We also intend to expand our portfolio to new cropping systems, such as hybrid wheat and biofuels, to drive growth beyond core germplasm and trait yield improvements. Additionally, we have developed proprietary seed trait and germplasm technologies that may be licensed to third parties and are executing on a strategic transition from being a net licensee of technology to becoming a leading net out-licensor. While for 2025 we had gross out-licensing income and net royalty cost of $317 million and $439 million, respectively. We anticipate achieving royalty neutrality in 2026 and expect to grow into a $1.0 billion net royalty income position by 2035. Technology out‑licensing allows us to participate economically in seed markets beyond our branded footprint and to monetize R&D investments across a broader industry base. Following the spin-off, we will prioritize this high-margin out-licensing business as a core pillar for innovation-driven growth and high cash conversion. The scale and profitability of this revenue stream depend on acreage adoption, pricing terms, intellectual property protection, competitive offerings, and regulatory requirements.
Accelerating Innovation
We maintain a global germplasm portfolio supported by breeding programs and testing networks designed to advance crop performance over successive growing seasons through the introduction of new proprietary seed traits that anticipate and meet evolving customer needs. Improved germplasm will support revenue growth primarily through branded seed sales, enabling portfolio refreshment, pricing differentiation, and share retention within core markets. Gene editing technologies are utilized within Vylor’s R&D activities to support targeted genetic improvements in certain crops. We expect this transformational technology to expand the range of traits that may be commercialized and to support future revenue opportunities through both branded seed products and potential licensing arrangements. We believe gene editing has the potential to double the rate of annual genetic gain from the historical approximately 1% to 2%. We expect to continue to combine our in-house capabilities with external partnerships to accelerate yield gains and crop resilience with the use of gene editing technology.
Leveraging go-to-market excellence
We expect to capitalize on our advantaged routes-to-market and brand strength in order to continually refine the price-for-value equation for new innovations and products. Our seed distribution model services customers primarily through our flagship Pioneer direct sales channel in key agricultural geographies, including the United States. Through this agency model, we interact directly with farmers at multiple points in the growing season, from prior to planting all the way through harvest. These regular interactions enable us to provide
the advice and service farmers need while giving us real-time insights into their future ordering decisions and technology needs. Our agency model is supplemented by strong retail channels though our Brevant® brand and licensing, further extending our market reach and increasing exposure of our technology, including smaller farmers or farmers in less concentrated areas. As a result, we can offer farmers a localized approach throughout the entire growing season to ensure all their seed needs are anticipated and satisfied. We listen to the customer to understand not only what they want today, but more importantly, what they will need tomorrow and well into the future. This collaboration helps inform our seed innovation decisions and focus by allowing us to better understand the technology value drivers for farmers. We are committed to rigorous ongoing sales training, territory planning and management systems that enable our people to match solutions to specific geographic regions and inform our future innovation.
Our Portfolio
Vylor offers product solutions in over 70 countries that incorporate genetic traits and agronomic characteristics intended to improve yield potential, performance consistency, and risk management for growers. The primary markets served include row crops and other broad‑acre crops that are replanted annually. We offer farmers solutions in several key crops, including corn, soybean, sunflowers and wheat, and complementary crops such as canola, cotton, rice and sorghum, as well as silage inoculants. In 2025, our Seed Business generated $9.9 billion in net sales. Revenue is influenced by planted acreage, seed replacement rates, product mix, pricing, and adoption of new technologies. Demand may also be affected by commodity prices, weather conditions, disease and pest pressure, regulatory requirements, and other factors affecting agricultural markets.
Corn
We have a leading corn portfolio, with what we believe to be the number one corn technology in the United States, as well as an innovation pipeline with market opportunities around the world. We utilize proprietary and licensed trait technologies for corn, including hybrids under our flagship Pioneer brand, which have produced world record yields, as well consistent yield advantages and leading disease resistance to tar spot over competitors. At the 2023 annual National Corn Growers Association yield contest a new world record of 623.84 bushels per acre was set with Pioneer brand corn product P14830VYHR, which topped the previous world record also achieved with Pioneer branded products.
Our goal is to develop technology that boosts margins and efficacy by renewing our portfolio solutions and creating license opportunities. Late this decade, we expect to launch short stature corn and to begin licensing triple-stack corn traits advancing the timeline for third-generation above-ground insect traits in corn to the end of the decade. Additionally, a cornerstone of our gene editing strategy is the development of multi-disease resistant (MDR) corn. We believe our gene-edited MDR corn is a “first-in-kind” trait designed to stabilize yield by providing “in the seed” control for fungal diseases. This product uses gene editing to package resistance to four major North American diseases into a single genetic location, aiming to protect against approximately $1 billion in annual yield losses. With USDA regulatory authorization already in place, we are targeting a U.S. commercial launch in 2028. A global rollout is to follow, but subject to future regulatory developments and conditions with respect to gene editing.
Soybean
We have an extensive soybean portfolio and innovation pipeline focused on North America and Latin America. Our breeding program leadership in soybeans has proven successful in driving value in yield and productivity in North America with our Enlist E3® soybeans planted on approximately 65% of U.S. soybean acres. We are applying and leveraging those approaches in Latin America as we develop new products and introduce new trait offerings into the market, including Conkesta E3® soybeans. In 2025, we doubled our soybean trait market share in Brazil, the largest soybean market on the planet, and we expect to reach double-digit soybean trait penetration in 2026.
Additionally, our Pioneer® brand Z-Series soybean varieties are developed from the most extensive localized soybean breeding and product testing program in the industry, with a focus on customizing varieties for local yield environments. In 2024, Pioneer Brand Z-Series soybeans edged out all competitors by an average yield advantage of 3.5 bushels. The Pioneer® brand Z-Series variety P49Z02E™ set a new world record of 218.2856 bushels per acre in 2024. In addition to these yield advantages, the Pioneer® Brand Z-Series showed a 12% increase in improved agronomics and disease scores as compared to current market products with respect to white mold, sudden death syndrome, iron chlorosis and lodging resistance, as well as significant improvements in protection against key diseases, such as soybean cyst nematode and phytophthora.
We plan to offer our next generation of strong agronomic soybean solutions with high-yield potential beginning in the early 2030s. Our pipeline includes our fourth generation robust herbicide tolerance with four modes of action, as well as our second generation lepidopteran soybean solution offering insect control with three new modes of action. In the second half of the next decade, we expect gene editing will enable launches of MDR soybean technology enabling further yield protection.
Products and Brands
Our seed segment’s major brands and technologies, by key product line, are listed below:
|
|
|
|
Brands |
Pioneer® seeds; Brevant® seeds; Dairyland Seed®; Hoegemeyer® hybrids; Nutech® seed; Seed Consultants®; AgVenture® brand; Cordius®, Licensing Division of Corteva Agriscience; DUO® hybrid corn; NEXSEM® corn; NordTM semillas; PhytoGen® cottonseed; Pannar™ brand corn. |
Traits and Technologies |
ENLIST® corn; ENLIST E3® soybeans; ENLIST® cotton; Enlist® weed control system; Herculex® Insect Protection; Herculex® XTRA Insect Protection; PowerCore® corn; PowerCore® Ultra corn; PowerCore® Enlist® corn; PowerCore® Ultra Enlist® corn; POWERCORE® trait technology family of products; Refuge Advanced® trait technology; SMARTSTAX® trait technology; NEXERA® canola trait; Omega-9 Oils; Optimum® AQUAmax® products; Pioneer® brand A-Series soybeans; Pioneer® brand Plenish® high oleic soybeans; ExpressSun® herbicide tolerant trait; Pioneer Protector® products for canola, sunflower and sorghum; Pioneer MAXIMUS® rapeseed hybrids; Qrome® corn; Clearfield® canola; PROPOUND® advanced canola meal; Vorceed® Enlist® products; Conkesta®; Conkesta E3® soybeans; WideStrike® Insect Protection; WideStrike® 3 Insect Protection; InzenTM trait; BOLT® technology; STS® herbicide tolerant trait; CottonBest® program; Brevant® Protector products; Optimum® GLY herbicide tolerance trait Optimum® AcreMax® insect protection; Optimum® AcreMax® Leptra® insect protection; Optimum® AcreMax® Xtra insect protection; Optimum® AcreMax® XTreme insect protection; Bovalta® BMR products; Optimum® Intrasect® insect protection; Optimum® Leptra® insect protection. |
Other |
LumiGEN® seed treatments; Lumisena® fungicide seed treatment; Lumiposa® seed applied insecticide; Lumiscend® and Lumiscend® Pro fungicide seed treatments; Lumisure® insecticide seed treatment; Lumiflex™ fungicide seed treatment; Lumiante™ fungicide seed treatment; LumiTreo™ fungicide seed treatment; Dermacor™ X-100 seed treatment products; Vertisan® ST; Lumiderm® insecticide seed treatment; Lumivia™ CPL; Lumivia™ and Lumialza™ nematicide seed treatment. |
Growth Platforms
Technology Licensing
We are executing a strategic transition from being a net licensee of technology to becoming a leading net out-licensor, aiming to achieve royalty neutrality in 2026 which is expected to grow into a $1.0 billion net royalty income position by 2035. We have developed proprietary seed trait and germplasm technologies that may be licensed to third parties. This platform is intended to generate revenue through contractual royalty and licensing arrangements tied to third‑party seed sales and planted acreage. Technology licensing allows us to participate economically in seed markets beyond our branded footprint and to monetize R&D investments across a broader industry base. Key milestones in this transition include the accelerated availability of triple-stack corn traits for out-licensing as early as 2027 and advancing the timeline for third-generation above-ground insect traits in corn to the end of the decade. Furthermore, we are expanding our addressable market by entering the U.S. cotton out-licensing segment. Following the separation, we will prioritize this high-margin out-licensing business as a core pillar for innovation-driven growth and high cash conversion. The scale and profitability of this revenue stream depend on acreage adoption, pricing terms, intellectual property protection, competitive offerings, and regulatory requirements.
Gene Editing Technologies
Gene editing technologies are utilized within our research and development activities to support targeted genetic improvements in certain crops. These technologies are intended to expand the range of traits that may be commercialized and to support future revenue opportunities through both branded seed products and potential licensing arrangements. We view gene editing as a transformational technology that serves as the next major wave of plant breeding, following DNA and marker-assisted breeding from decades ago. We will combine our internal capabilities with external partnerships to accelerate yield gains and crop resilience.
Our gene editing strategy is designed to deliver differentiated technology that enhances productivity, food security, and climate change adaptation. While gene editing tools are becoming more accessible, our true differentiation lies in combining these tools with our industry-leading germplasm and massive global seed production supply chain. Today, we have the second largest gene editing patent estate – surpassed only by China. The commercial contribution of gene‑edited products will depend on regulatory approvals, market acceptance, intellectual property protection, and the timing of product introductions across relevant crops and regions.
Hybrid Wheat Development
We have developed a hybrid wheat system as part of our longer‑term innovation pipeline. Wheat represents a large global acreage market that has historically relied on farmer‑saved seed and conventional varieties. Hybrid wheat is intended to support a commercial hybrid seed model, which is expected to create incremental revenue opportunities through increased seed replacement rates and differentiated performance.
Our management believes our proprietary hybrid wheat technology is a "first-of-its-kind" non-GMO system that could transform global wheat production similarly to how hybridization revolutionized corn a century ago. Technologically, this proprietary system overcomes historical barriers to wheat hybridization—such as inconsistent sterility and high seed production costs—by using a unique genetic mechanism that works across 100% of wheat germplasm. Internal trials have demonstrated significant performance gains, including a 10% to 20% increase in yield potential while using the same land and resources. Furthermore, the technology exhibits enhanced climate resilience, with research indicating yields roughly 20% higher than elite varieties in water-stressed or high-stress environments.
We plan to launch our first commercial hybrid wheat product, hard red winter wheat, in North America as early as 2027, with expectations that the platform will scale into a primary revenue opportunity within the next decade. While the 2027 launch will feature the initial class of hybrids, the pipeline is expected to deliver continuous genetic gains, eventually achieving a margin profile similar to our established corn and soybean franchises.
Strategically, we intend to utilize this technology as another key strategic pillar alongside our market-leading corn and soybean products, emphasizing a shift toward becoming a net out-licensor of advanced genetics. The realization of this opportunity will depend on research progress, seed production scalability, grower adoption, and regional agronomic conditions.
Biofuels‑Related Seed Technologies
We are evaluating seed technologies that may support emerging biofuels markets, including crops and cropping systems intended for use as renewable fuel feedstocks. These initiatives are intended to expand end‑market demand for seed products by supporting new or incremental planted acreage.
Our collaboration with Bunge and Chevron focuses on a double-cropping system in the American Mid-South using proprietary winter canola hybrids. The partnership functions as an integrated value chain where we provide the seed technology to farmers, Bunge contracts and crushes the oil, and Chevron utilizes the feedstock for its renewable fuel programs. A 2023 pilot program covering approximately 5,000 acres exceeded expectations, delivering an average yield of 54 bushels per acre. Following this success, the program expanded to approximately 35,000 acres six states for the 2024-2025 season. The system allows farmers to produce two highly profitable crops in a single year. Trial results showed yields of 45 to 65 bushels per acre, providing a reliable cash crop that can be harvested in time to plant soybeans. Winter canola acts as a cover crop that preserves soil health; furthermore, the double-crop system achieves an approximate 2.60x reduction in carbon intensity compared to electricity from the grid.
On January 7, 2026, we and BP p.l.c officially launched Etlas, a 50:50 joint venture dedicated to producing biofuel feedstocks, specifically targeting the sustainable aviation fuel (SAF) and renewable diesel (RD) markets. Etlas aims to produce 1 million metric tonnes of feedstock annually by the mid-2030s, which is expected to yield over 800,000 tonnes of biofuel. Initial supply is slated to begin in 2027 for use in refineries and dedicated biofuel plants. The venture will focus on growing proprietary mustard seed, sunflower, and canola as intermediate crops in North America, South America, and Europe. These crops are grown between main food cropping seasons, thereby avoiding an increase in demand for additional land. The venture specifically targets meeting the European Union’s RED III criteria and qualifying for U.S. Low Carbon Intensity policy incentives, addressing the mandatory blending mandates for SAF applicable to airlines in the European Union.
Our biofuels-related revenue opportunities will depend on farmer adoption of biofuels programs, energy market conditions, government policies and incentives, infrastructure development, and grower economics.
Raw Materials and Supply Chain
To produce high-quality seeds, the company contracts with third-party growers globally. The company focuses on production close to the customer to provide the seed product, which is suitable for that region and its weed, insect and disease challenges, weather, soil and other conditions. The company conditions and packages the seeds using its own plants and third-party contract production plants. By
striking a balance between owning production facility assets directly and contracting with third-party growers, we are well-positioned to maintain flexibility to react to demand changes unique to each geography while minimizing costs. The company seeks to collaborate with strategic seed growers and share its digital agronomy and product management knowledge with them. The company’s third-party growers are an important part of its supply chain. We provide them with rigorous training, planning tools and access to a system that tests and advances products matched to specific geographic needs.
Our research and development ("R&D") and supply chain groups work seamlessly to select and maintain product characteristics that enhance the quality of its seed products and solutions.The company focuses on customer-driven innovation to deliver superior germplasm and trait technologies. With its large sets of digitized data and globally connected network, the company can manage its field operations efficiently and draw insights from data quickly and effectively. We have also invested in digital platforms, advanced analytics, and artificial intelligence tools to support data‑intensive seed development processes, including the integration of genetic, agronomic, trial, and environmental data. This allows the company’s supply chain to be managed in a manner that enables the company to react quickly to changing customer needs and provides the production team with tremendous amounts of data to analyze and incorporate into resource allocation decisions, as well as future R&D product advancement decisions. We continue to invest in and build our analytical capabilities that drive value via investment in artificial intelligence that enable the company to create an even more responsive and efficient answer to customer needs.
Our seed production footprint includes owned production facilities and third party contracts to maintain flexibility to react to demand changes unique to each geography while minimizing costs.
Multi-Channel, Multi-Brand Distribution
We utilize a multi-channel, multi-brand strategy that differentiates us from our competition and drive growth by presenting us with a route to market in which we are uniquely positioned to win business. Our strengths and unique direct-engagement approach enable us to deliver solutions farmers can trust through whatever channel they prefer, including agency, dealer or direct, retail or co-operative, or licensing channels.
We intend to continue to leverage our advantaged routes to market as an independent company, including their operations and sales and marketing capabilities, to broaden our geographic reach and market penetration by offering a wider range of complementary offerings. Our seed distribution model primarily services customers primarily through its legacy Pioneer direct sales channel in key agricultural geographies, including the United States. Through this model, we interact directly with farmers at multiple points in the growing season, from prior to planting all the way through harvest. These regular interactions enable us to provide the advice and service farmers need while giving us real-time insights into their future ordering decisions. This approach is supplemented by retail channels including distributors, agricultural cooperatives and farmer dealers. The indirect channels extend our reach and efficiently increase exposure of our products to other potential buyers, including smaller farmers and retail channels for farmers in less concentrated areas. This enhanced approach allows us to have a complete go-to-market strategy covering the direct, dealer and retail chains providing farmers with a localized approach that can continue to expand our brand loyalty.
Under this approach, the Pioneer® brand, one of our premium global seed brands, is primarily delivered through our unique, direct route-to-market channel. Brevant™ seeds, also a premium global brand, primarily serves retail channels outside of the United States. In addition to these two premium global seed brands, we will continue to offer quality country- and region-specific seed brands that complete one of the broadest, most diverse seed portfolios in the world.
Seasonality
Our sales and profitability are generally strongest in the first half of the calendar year, which aligns with the planting and growing season in the northern hemisphere. We typically generate about 75 percent of our sales and substantially all of our profit in the first half of the calendar year, driven by northern hemisphere seed sales. We generate about 25 percent of our sales in the second half of the calendar year, led by seed sales in the southern hemisphere. Our direct distribution channel, where products are shipped to farmers, is more affected by planting delays than our competitors. Generally speaking, unfavorable weather slows the planting season and can affect our quarterly results and sales mix. Severe unfavorable weather, however, can impact overall sales. Also, we have meaningful seasonal working capital needs based in part on providing financing in support of our seasonal sales. Accounts receivable tends to be higher during the first half of the year, consistent with the peak sales period in the northern hemisphere, with substantial cash collection focused in the fourth quarter.
Facilities
We will operate out of our headquarters in Johnston, Iowa. Our manufacturing, processing, marketing and R&D facilities, as well as regional purchasing offices and distribution centers, are located throughout the world. Following the spin-off, we expect to operate [ ] production sites in approximately [ ] countries in the following geographic regions:
|
|
|
|
|
|
|
|
|
|
|
|
Total |
Americas |
|
|
|
|
|
|
Rest of World |
|
|
|
|
|
|
Total |
|
|
|
|
|
|
Our properties will include facilities which, in the opinion of management, are expected to be suitable and adequate for their use and will have sufficient capacity for our current needs and expected near-term growth. All our plants are owned or leased, subject to certain easements of other persons which, in the opinion of management, do not substantially interfere with the continued use of such properties or materially affect their value. No title examination of the properties has been made for the purpose of this information statement.
Intellectual Property
We consider our intellectual property estate, which includes patents, trade secrets, trademarks and copyrights, in the aggregate, to constitute a valuable asset and we actively seek to secure intellectual property rights as part of an overall strategy to protect our investment in innovations and maximize the results of our R&D program. While we believe that our intellectual property estate, taken as a whole, provides a competitive advantage in many of our businesses, no single patent, trademark, license or group of related patents or licenses is in itself essential to us as a whole or to any of our segments.
We continually apply for and obtains U.S. and foreign patents and have access to a large patent portfolio, both owned and licensed. The protection afforded by these patents varies based on country, scope of individual patent coverage, as well as the availability of legal remedies in each country. This significant patent estate may be leveraged to align with the company’s strategic priorities within and across product lines. As of June 30, 2026, we owned about 5,300 U.S. patents and about 2,500 active patents outside of the U.S. In addition to its owned patents, we own approximately 2,000 patent applications.
Remaining life of granted patents owned as of June 30, 2026:
|
|
|
|
Approximate U.S. |
Approximate Other Countries |
Within 5 years |
1,000 |
600 |
6 to 10 years |
1,800 |
1,100 |
11 to 15 years |
1,500 |
600 |
16 to 20 years |
1,000 |
200 |
Total |
5,300 |
2,500 |
We also own or have licensed a substantial number of tradenames, trademarks and trademark registrations in the United States and other countries, including over [ ] registrations and pending trademark applications in a number of jurisdictions.
In addition, we hold multiple long-term biotechnology trait licenses from third parties as a normal course of business. Our seed varieties sold to customers can contain biotechnology traits licensed from third parties under these long-term licenses.
To facilitate the spin-off, and allow our, as well as New Corteva’s, operations to continue with minimal interruption, we expect to enter an Intellectual Property Matters Agreement and a Trademark Licensing Agreement. For additional information, see the section entitled “Our Relationship with New Corteva Following the Spin-off.”
Employees
As of December 31, 2025, we have approximately X employees, approximately X percent of whom are represented by unions and X represented by works councils. In order to address regional specific customer needs within its global business, we have a geographically
diverse employee base with X percent and X percent, located in the Americas and Rest of World regions, respectively. In 2025, we did not experience any work stoppages due to strike or lockouts. Management believes its relations with its employees to be good.
We hire, train, and retain some of the leading scientists in the agriculture and biotechnology space. It is our mission to attract the best employees, and to retain those employees through offering career development and training opportunities while also prioritizing their safety and wellness in an inclusive and productive work environment. Our strong employee base, along with our commitment to Vylor’s core values, is a key element to the success of our business.
We have implemented safety programs and management practices to promote a culture of safety to protect our employees, as well as the environment. This includes required training for employees, as well as specific qualifications and certifications for certain operational employees.
We have a robust inclusion and belonging vision and strategy, based upon the belief that embracing individual differences benefits Vylor by creating a workforce with a greater variety of skills and perspectives as a result of their differentiated backgrounds and experiences. Specific inclusion and belonging initiatives will be identified and tracked to promote a culture of belonging that is designed to create an inclusive environment where the best talent is attracted, retained, and engaged. Critical to creating this environment are company-sponsored employee business resource groups (“BRGs”) that support and promote certain mutual objectives of both the employee and Vylor, including community engagement and the professional development of employees. The BRGs are open to all employees and provide a voluntary space where employees can foster professional and personal connections within a supportive environment.
We plan to monitor our recruitment and talent development processes, to prevent and detect inequities and potentially discriminatory practices that could negatively impact the creation of an inclusive culture and the retention of key talent for our leadership pipeline. We expects to review our inclusion and belonging efforts through periodic engagement surveys and other measures. The results of our efforts, along with our inclusion and belonging strategy, will be reviewed periodically with our management, and through annual reviews of our leadership pipelines and inclusion and belonging programs with the People and Compensation Committee of our board of directors.
Competitive Landscape
We compete with producers of seed germplasm and trait developers on a global basis. The global market for products within the industry is highly competitive and we believe competition has and will continue to intensify. We compete based on germplasm and trait leadership, quality and price competitiveness relative to the technological value. Our key competitors include BASF, Bayer, and, Syngenta, as well as regional seed companies.
Regulatory Considerations
Our seed products and operations are subject to certain approval procedures, manufacturing requirements and environmental protection laws and regulations in the jurisdictions in which we operate. We evaluate and test products throughout the R&D phases, and each new technology undergoes further rigorous scientific studies and tests to demonstrate that the product can be used effectively and that use of the technology is safe for humans and animals and does not cause undue harm to the environment.
The regulatory approval processes and procedures globally have grown increasingly more complex, which has resulted in additional tests, time investment and higher development and maintenance costs. We continue to invest on an ongoing basis to keep dossiers current, respond to regulators and meet regulatory standards required by global regulatory frameworks.
Genetically modified and gene edited seed products are subject to regulatory approval processes and procedures. For example, in the United States, the Coordinated Framework for Regulation of Biotechnology governs gene edited and genetically modified organisms, using existing U.S. legislation and legal authorities on food, feed and environmental safety. Gene edited and genetically modified plants are regulated by the U.S. Department of Agriculture’s (the “USDA”) Animal and Plant Health Inspection Service (the “APHIS”) under the Plant Protection Act. The APHIS, where required, assesses the trait to ensure that the trait will not pose a plant pest and is not a noxious weed. GMOs in food are regulated by the Food and Drug Administration (the “FDA”) under the Federal Food, Drug, and Cosmetic Act (the “FFDCA”). The FDA ensures GMOs in food meet the same strict food-safety standards as non-GMO foods. Pesticides and microorganisms containing GMOs are regulated by the Environmental Protection Agency (the “EPA”) pursuant to the Federal Insecticide, Fungicide and Rodenticide Act (the “FIFRA”) and the Toxic Substances Control Act. The EPA assesses the trait or the stack containing the traits to ensure that there is no unreasonable adverse effect to the environment.
Genetically modified and gene edited products may be subject to bans and restrictions in certain countries. Other countries also have rigorous approval processes, procedures, and scientific testing requirements for the cultivation or import of genetically modified and
gene edited seed products. In the United States and other countries that have well-developed regulatory systems, a rigorous scientific review is conducted by these agencies to demonstrate that genetically modified and gene editing products are as safe as traditionally bred, non-biotech/GMO counterparts for food, feed and the environment. While in certain jurisdictions, gene edited products offer the potential for faster regulatory approval, these regulatory frameworks are still developing and unfavorable developments may delay or prevent the successful commercialization of our products.
Environmental and Other Legal Proceedings
Allocation of Contingencies Under the Separation and Distribution Agreement
Under the Separation and Distribution Agreement, certain assets and liabilities will be allocated to us, as more fully described in the section entitled “Our Relationship with New Corteva Following the Spin-Off.”
Environmental Proceedings Nebraska Department of Environment and Energy, AltEn Facility
The matters below involve the potential for $1 million or more in monetary fines.
Nebraska Department of Environment and Energy, AltEn Facility. The EPA and the Nebraska Department of Environment and Energy (“NDEE”) are pursuing investigations, response and removal actions, litigation and enforcement action related to an ethanol plant located near Mead, Nebraska that is owned and operated by AltEn LLC (“AltEn”). The agencies have alleged violations under the Resource Conservation and Recovery Act (“RCRA”) and other federal and state laws stemming from AltEn’s lack of compliance with the terms and conditions of its operating permits and other regulatory requirements. Vylor is one of six seed companies, who were customers of AltEn (collectively, the “Facility Response Group”), participating in the NDEE’s Voluntary Cleanup Program to address certain interim remediation needs at the site. In March 2025, the Facility Response Group reached an agreement to settle its lawsuit against AltEn and certain of its affiliates to preserve certain contractual and common law indemnification claims. The settlement agreement, among other things, limits AltEn’s ability to dispose of the property or take any adverse action with respect to its property or assets. As of December 31, 2025, an accrual was established for our estimated voluntary contribution to the solid waste and wastewater remedial action plans for the AltEn location.
AZ Concordia Chile Site. On February 9, 2026, a water reservoir at the AZ Concordia site overflowed during a refilling, resulting in the collapse of part of the embankment and the release of all stored water beyond Corteva’s facilities resulting in flooding and other damage impacting government-managed infrastructure and wastewater systems. Corteva is working with local authorities on the resolution of matters related to this incident.
Environmental Operating Costs and Remediation Costs
As a result of our operations, we incur environmental operating costs for pollution abatement activities including waste collection and disposal, installation and maintenance of air pollution controls and wastewater treatment, emissions testing and monitoring and obtaining permits. We also incur environmental operating costs related to environmental related R&D activities including environmental field and treatment studies as well as toxicity and degradation testing to evaluate the environmental impact of products and raw materials. In addition, we maintain and periodically review and adjust our accruals for probable environmental remediation and restoration costs.
We expect to continue to incur environmental operating costs since we will operate global product handling and distribution facilities that are subject to a broad array of environmental laws and regulations. These rules are subject to change by the implementing governmental agency, which we monitor closely. Our policy will require that our operations fully meet or exceed legal and regulatory requirements. In addition, we expect to continue certain voluntary programs, and could consider additional voluntary actions, to reduce air emissions, minimize the generation of hazardous waste, decrease the volume of water use and discharges, and increase the efficiency of energy use. Costs to comply with complex environmental laws and regulations, as well as internal voluntary programs and goals, can be significant. However, we do not expect these costs to have a material impact on our financial position, liquidity or results of operations in the foreseeable future, although over the longer term such expenditures are subject to considerable uncertainty and could fluctuate significantly.
We accrue for environmental matters when it is probable that a liability has been incurred and the amount can be reasonably estimated. As remediation activities vary substantially in duration and cost from site to site, it is difficult to develop precise estimates of future site remediation costs. We expect to base such estimates on several factors, including the complexity of the geology, the nature and extent of contamination, the type of remedy, the outcome of discussions with regulatory agencies and other potentailly responsible parties (“PRPs”) at multi-party sites and the number of, and financial viability, of other PRPs.
Litigation
From time to time we are subject to various legal proceedings arising out of the normal course of our current and former business operations. Such legal proceedings may include intellectual property, commercial, product liability, environmental and antitrust lawsuits. It is not possible to predict the outcome of these various proceedings. Although considerable uncertainty exists, our management does not anticipate that the ultimate disposition of these matters will have a material adverse effect on our results of operations, consolidated financial position or liquidity. However, the ultimate liabilities could be material to our results of operations in the period recognized.
MANAGEMENT
Executive Officers Following the Spin-Off
The following table sets forth information regarding individuals who are expected to serve as our executive officers, including their positions, after the spin-off. Additional executive officers will be selected prior to the spin-off to serve as executive officers after the spin-off, and information concerning those executive officers will be included in an amendment to this Form 10. While some of these individuals currently serve as executive officers of Corteva, after the spin-off, none of our executive officers will be executive officers of New Corteva. The information set forth below is as of , 2026.
|
|
|
|
|
|
|
Name and Age |
|
Expected Position with Vylor |
|
Current Positions with Corteva |
|
Other Business Experience |
Charles V. Magro, age 56 |
|
Chief Executive Officer, Director |
|
Chief Executive Officer, Director |
|
Mr. Magro was named Chief Executive Officer and Director of Corteva effective November 2021. Prior to joining Corteva, Mr. Magro served as President and CEO of Nutrien Ltd. from its launch in 2018 until April 2021. From 2014 to 2018, he served as President and CEO of Agrium Inc., which merged with Potash Corporation of Saskatchewan Inc. to create Nutrien Ltd. As President and CEO of Nutrien Ltd., Mr. Magro led the global organization to achieve best-in-class engagement, top safety performance and exceptional business results. While at Nutrien he also led the company through numerous M&A transactions thereby, expanding its global footprint. Prior to this role, Mr. Magro held a variety of other key leadership positions with the company, including Chief Operating Officer, Chief Risk Officer, Executive Vice President of Corporate Development, and Vice President of Manufacturing. He joined Agrium Inc. in 2009 following a productive career with NOVA Chemicals Corp. Mr. Magro has served on the board of directors of Ingredion Inc., a global provider of ingredient solutions to the food and beverage manufacturing industry since May 2022. Mr. Magro previously served on the Canada Pension Plan Investment Board from 2018 until March 2022. |
David P. Johnson, age 59 |
|
Chief Financial Officer |
|
Executive Vice President, Chief Financial Officer |
|
Mr. Johnson was named Executive Vice President and Chief Financial Officer effective in September 2024. Prior to joining Corteva, Mr. Johnson served as Chief Financial Officer and Chief Accounting Officer of Atkore Inc. from August 2018 through August 9, 2024, and has more than 30 years of experience in strategic and financial planning, risk assessment, mergers & acquisitions, global tax strategies, international operations and internal controls. Prior to joining Atkore Inc., Mr. Johnson served in various finance leadership roles at Eaton Corporation from 1989 through 2018. Most recently at Eaton, Mr. Johnson was Vice President-Finance & Operations for the electrical sector business, where he was responsible for sector financial planning, analysis, and reporting; compliance, credit & collections; government accounting; as well as global purchasing, manufacturing strategies, logistics and distribution. Prior to that, Mr. Johnson was Vice |
|
|
|
|
|
|
|
Name and Age |
|
Expected Position with Vylor |
|
Current Positions with Corteva |
|
Other Business Experience |
|
|
|
|
|
|
President-Finance and Planning for the Americas region (Eaton Electrical) where he was responsible for reporting, planning, acquisitions, and implementing common financial policies / reporting across numerous recently acquired businesses. During his tenure at Eaton, Mr. Johnson held other roles of progressive responsibilities, including Plant Controller, Division Controller, Director of Finance & Business Development, Vice President Finance & Business Development, and Vice President Finance & Planning-Europe, Middle East, and Asia.
|
Dr. Samuel R. Eathington, age 57 |
|
Chief Technology Officer |
|
Executive Vice President, Chief Technology and Digital Officer |
|
Dr. Eathington was named Executive Vice President, Chief Technology and Digital Officer of Corteva effective April 2022, where he is responsible for leading its global research and development organization, building and expanding its industry-leading pipeline, and overseeing all aspects of Corteva’s digital farming strategy and investments. He joined Corteva in November 2020 and served as Senior Vice President, Chief Technology Officer from January 2021 until April 2022. A recognized leader in agricultural innovation, Dr. Eathington served as Chief Science Officer of The Climate Corporation (part of the crop science division of Bayer AG) from December 2015 until April 2020. Prior to assuming that role, Dr. Eathington spent 19 years with Monsanto Corporation, in various roles and becoming Vice President, Global Plant Breeding beginning in February 2011.
|
Judd M. O’Connor, age 55 |
|
Chief Commercial and Operations Officer |
|
Executive Vice President, Seed Business Unit |
|
Mr. O’Connor was named Executive Vice President, Seed Business Unit of Corteva, effective December 2024. Mr. O’Connor has over 30 years of experience in agriculture and served as Corteva’s President for the North America commercial business since July 2022. Prior to that, Mr. O’Connor served as the President for its U.S. commercial business since August 2018. Prior to Corteva’s spin from DowDuPont, Inc., Mr. O’Connor was the North America Commercial Leader for DuPont Pioneer, where he was responsible for integration activities supporting the merger of DuPont and The Dow Chemical Company. Mr. O’Connor held various leadership positions in the Seed Business including Vice President of Integrated Operations & Commercial Effectiveness for DuPont Pioneer, Business Director and Vice President for the Pioneer® brand sales organization. He previously served as Regional President for DuPont Latin America and was based in Sao Paulo, Brazil. Prior to joining Corteva, Mr. O’Connor began his career in the crop protection sector with American Cyanamid where he held a number of sales, marketing and leadership positions.
|
|
|
|
|
|
|
|
Name and Age |
|
Expected Position with Vylor |
|
Current Positions with Corteva |
|
Other Business Experience |
Jennifer A. Johnson, age 51 |
|
Chief Legal & Public Affairs Officer, and Corporate Secretary |
|
Senior Vice President, Chief Legal & Public Affairs Officer, and Corporate Secretary |
|
Dr. Johnson was named Corteva’s Senior Vice President, Chief Legal Officer, effective September 15, 2025 and Corporate Secretary as of January 1, 2026. As of December 8, 2025, she provides oversight of Corteva’s public affairs function. Prior to joining Corteva, Dr. Johnson served as the Executive Vice President, General Counsel and Corporate Secretary of International Flavors & Fragrances Inc. (“IFF”) from February 2021 to July 2025. Prior to joining IFF, Dr. Johnson held various roles at DuPont where she was associate general counsel for the nutrition and biosciences business from 2019 to February 2021. During her career at DuPont, she held various legal leadership roles supporting its commercial and intellectual property teams, including with the company’s seed business. Prior to joining DuPont in 2013, Dr. Johnson was a partner at the global intellectual property law firm, Finnegan, Henderson, Farabow, Garrett & Dunner, L.L.P. Dr. Johnson earned a Ph.D. in plant biology and a bachelor of science degree in genetics and plant biology from the University of California, Berkeley, and a juris doctorate from the University of Washington. |
Audrey Grimm, age 45 |
|
Chief People Officer |
|
Senior Vice President, Chief People Officer |
|
Ms. Grimm was named Senior Vice President and Chief People Officer of Corteva effective March 2022. Beginning in 2021, she served as Vice President, Europe, Middle East and Africa (EMEA) HR, with added responsibility for Corteva’s global culture and inclusion and belonging efforts, and before that as HR Director for Corteva’s EMEA region from 2017 to 2021. Ms. Grimm spent her early career with The Dow Chemical Company, where she held a series of progressive HR roles leading to her appointment as Vice President, HR of the Agricultural division of The Dow Chemical Company in 2015. |
Board of Directors Following the Spin-Off and Director Independence
The following sets forth information with respect to those persons who are expected to serve on our board of directors following the spin-off. We may name and appoint additional nominees to the board of directors prior to the distribution. While some of these individuals currently serve as employees or directors of Corteva, after the spin-off, none will serve as an employee or director of New Corteva. Our board of directors will be composed of seven members, six of whom are expected to qualify as “independent” as defined by rules of the NYSE and the Corporate Governance Guidelines to be adopted by our board of directors (see discussion below under “—Corporate Governance Guidelines”).
Karen H. Grimes, age 69, is expected to serve as the non-executive chairman of Vylor. Ms. Grimes was senior managing director, partner, and equity portfolio manager at Wellington Management Company LLP, an investment management firm, from January 2008 through December 2018. Prior to joining Wellington Management Company in 1995, she held the position of director of research and equity analyst at Wilmington Trust Company, a financial investment and banking services firm from 1988 to 1995. Before that, Ms. Grimes was a portfolio manager and equity analyst at First Atlanta Corporation from 1983 to 1986 and at Butcher and Singer from 1986 to 1988. Ms. Grimes holds the Chartered Financial Analyst designation. Ms. Grimes began her career as a field engineer in the Atlanta office at IBM after serving for three years in the U.S. Army. Ms. Grimes has served as a director of Toll Brothers, Inc., a company that builds, markets and finances residential and commercial properties in the U.S., since March 2019, and previously served on the board of TEGNA, Inc., a broadcast, digital media, and marketing services company, from February 2020 until April 2025. Ms. Grimes has served as a director of Corteva since March 2021.
Victor Aguilar, age 59, has served is various innovation and research and development leadership roles at The Procter & Gamble Company ("P&G") across three continents for over 35 years. Mr. Aguilar has served as P&G’s chief research, development and innovation Officer since October 2020, where he leads P&G’s research and development organization, global innovation program and strategy, including its nearly $2 billion annual investment in research and development, and end-to-end packaging transformation, as well as serving as a liaison to P&G's board of director’s innovation and technology committee.
Rajesh “Raj” Kalathur, age 58, has nearly thirty years of experience across finance, information technology, operations, and sales and marketing functions at Deere & Company (“Deere”), a global leader in the production of agricultural, construction, and forestry equipment and solutions. Most recently, Mr. Kalathur served as the president of John Deere Financial, a leading financial services provider for dealers and customers of John Deere equipment, and chief information officer of Deere from 2019 through his retirement in January 2026. As chief information officer, Mr. Kalathur oversaw Deere's information technology function, and recently led its implementation of its agile information technology operating model and digital transformation leveraging artificial intelligence and automation technologies. Mr. Kalathur also served as Deere's chief financial officer from September 2012 to March 2019, and then again from May 2022 to September 2022. Since February 2025, Mr. Kalathur has served as a director of American Tower Corporation, a global real estate investment trust, which acts as an independent owner, operator and developer of multitenant communications real estate with a portfolio of over 148,000 communications sites and an interconnected footprint of U.S. data center facilities.
Marcos M. Lutz, age 56, was appointed chairman of the board of directors of Ultrapar Participações S.A., a major Brazilian conglomerate operating in various sectors, including energy, mobility and logistics infrastruture, in April 2025. Mr. Lutz joined Ultrapar in April 2021 as a member of the board, and from January 2022 to April 2025 held the position of chief executive officer, and served as vice-chair of the board from April 2023 to April 2025. Mr. Lutz currently also serves as chairman of the board of Hidrovias do Brasil S.A., a publicly-traded integrated logistics solutions company, which is majority held by Ultrapar, and is a member of the board of directors of Itau Unibanco S.A., one of the largest financial institutions in Latin America, a position he has held since April 2025. Previously, Mr. Lutz was chief executive officer of Cosan Limited, a Brazil-based holding company that operates in strategic sectors including agribusiness, fuel and natural gas distribution, lubricants and logistics, from April 2015 to April 2020, and served as a director of Cosan from December 2009 to June 2020. Prior to joining Cosan, he held senior leadership roles at Companhia Siderurgica Nacional (CSN) SA, most recently serving as vice president of infrastructure and energy with responsibility for the company’s hydroelectric plants, logistics, railways and port terminals. Prior to that, he was the chief operating officer for Ultracargo S.A., Ultra Group’s logistics subsidiary. Mr. Lutz previously served as a director at Monsanto Company from May 2014 to June 2018. Mr. Lutz has served as a director of Corteva since June 2019.
Charles V. Magro, age 56, is expected to be the chief executive officer of Vylor. Mr. Magro has served as the chief executive officer and director of Corteva since November 2021. Prior to joining Corteva, Mr. Magro served as president and chief executive officer of
Nutrien Ltd. from the company’s launch in 2018 until April 2021. From 2014 to 2018, he served as president and chief executive officer of Agrium Inc., which merged with Potash Corporation of Saskatchewan Inc. to create Nutrien Ltd. As president and chief executive officer of Nutrien Ltd., Mr. Magro led more than 27,000 employees to achieve best-in-class engagement, top safety performance and exceptional business results. While at Nutrien, he also led the company through numerous M&A transactions, thereby expanding its global footprint. Prior to this role, Mr. Magro held a variety of other key leadership positions with the company, including chief operating officer, chief risk officer, executive vice president of corporate development, and vice president of manufacturing. He joined Agrium Inc. in 2009 following a productive career with NOVA Chemicals Corp. Mr. Magro has served on the board of directors of Ingredion Inc., a global provider of ingredient solutions to the food and beverage manufacturing industry, since May 2022. He was also recently named chair of the board of directors of CropLife International, effective January 1, 2026. Mr. Magro previously served on the Canada Pension Plan Investment Board from 2018 until March 2022.
Johannes “Jannie” J. Oosthuizen, age 59, has spent over a decade at Merck & Co., Inc. (“Merck”) in various sales, marketing and business roles. Beginning in 2026, Mr. Oosthuizen has served as executive vice president and president, oncology and MSD International, where he leads Merck’s global oncology business and holds P&L responsibility for U.S. Oncology and Merck’s 75-plus markets outside of the U.S., driving the company’s continued leadership in oncology and overseeing commercial execution at the market level across the full human health portfolio. From 2022 to 2026, Mr. Oosthuizen served as president, Merck Human Health U.S. where he oversaw P&L, strategy and commercialization for Merck’s broad U.S. portfolio. Prior to that, Mr. Oosthuizen was Merck's president, global oncology. Prior to Merck, Mr. Oosthuizen spent 21 years at Eli Lilly and Company in a wide range of commercial and marketing roles with increasing responsibility.
Kerry J. Preete, age 65, had an extensive career at the Monsanto Company, where he worked for over thirty years in roles of increasing responsibility. Mr. Preete served as the executive vice president and chief strategy officer for Monsanto, from 2010 until his retirement in June 2018, and agreed to stay on as an employee of Bayer AG after Monsanto’s acquisition through December 2018. As chief strategy officer, Mr. Preete oversaw the information technology function, including Monsanto’s digital and cybersecurity transformations. In this role, he also led the company’s M&A and venture capital initiatives, Also at Monsanto, Mr. Preete served as the president of global crop protection and chemicals, from 2009 to 2010, as the vice president of international crops business, from 2008 to 2009, as the president of seminis vegetable seeds, from 2005 to 2008, as the vice president of U.S. markets, from 2001 to 2005, as the vice president of global product management, from 1999 to 2001, and as the director of global product stewardship and chemicals, from 1998 to 1999. Earlier in his career at Monsanto, Mr. Preete held various positions in the marketing and distribution groups, from 1985 to 1998, including as U.S. marketing director. Mr. Preete has served on the board of directors of Avient Corporation, a specialized provider of polymer materials, services and solutions, since December 2013, and previously served on the board of Univar Solutions Inc., a global chemical and ingredient distributor, from May 2018 until its acquisition by Apollo Funds in August 2023. Mr. Preete has served as a director of Corteva since March 2021.
Committees of the Board of Directors
Effective upon the completion of the spin-off, our board of directors is expected to have the following standing committees: an Audit Committee, a People and Compensation Committee, a Governance and Compliance Committee, and a Science and Innovation Committee. Our board of directors is expected to adopt a written charter for each of these committees, which will be posted on our website.
Audit Committee
The responsibilities of the Audit Committee will be more fully described in our Audit Committee Charter and will include, among other duties:
•Appointing, compensating, retaining and overseeing the work of any independent auditors engaged for the purpose of preparing or issuing an audit report or performing other audit, review or attest services for us.
•Reviewing and pre-approving our independent auditors’ annual engagement letter, including the proposed fees contained therein, as well as all audit and permitted non-audit engagements and relationships with us.
•Reviewing and discussing with the independent auditors their annual audit plan, including the timing and scope of audit activities, and monitoring such plan’s progress and results during the year.
•Reviewing the performance and evaluating the independence of the independent auditors.
•Reviewing (i) the adequacy and effectiveness of our accounting and internal control policies and procedures on a regular basis through inquiry and periodic meetings with our independent auditors and management and (ii) the yearly report prepared by management
assessing the effectiveness of our internal control over financial reporting and stating management’s responsibility for establishing and maintaining adequate internal control over financial reporting prior to its inclusion in our Annual Report on Form 10-K.
•Establishing procedures for (i) the receipt, retention and treatment of complaints received by us regarding accounting, internal accounting controls or auditing matters and (ii) the confidential, anonymous submission by our employees of concerns regarding questionable accounting or auditing matters.
•Reviewing with management, the independent auditor and, if applicable, the Chief Audit Executive our annual audited financial statements and quarterly financial statements, including our specific disclosures under “Management’s Discussion, and Analysis of Financial Condition and Results of Operations,” and any major issues related thereto.
•Overseeing the internal audit function, including reviewing and approving the appointment, compensation and dismissal of the Chief Audit Executive and reviewing the internal audit plan, budget and charter.
•Reviewing with management our cybersecurity risks and mitigation activities.
The Audit Committee will consist entirely of independent directors, and we intend that each member of the Audit Committee will meet the independence requirements set forth in the rules of the NYSE and Rule 10A-3 of the Exchange Act. We also intend that (x) each member of the Audit Committee will be financially literate and (y) at least one member of the Audit Committee will be an “audit committee financial expert” under SEC rules and the rules of the NYSE applicable to audit committees. The initial members of the Audit Committee are expected to be _______________________.
People and Compensation Committee
The responsibilities of the People and Compensation Committee will be more fully described in our People and Compensation Committee Charter and will include, among other duties:
•Overseeing the succession planning process for the Chief Executive Officer.
•Reviewing current and future senior leadership talent, including their development and the succession plans for key management positions other than the Chief Executive Officer.
•Reviewing and approving annually the goals and objectives applicable to the compensation of the Chief Executive Officer, evaluating annually the performance of the Chief Executive Officer in light of those goals and objectives, and, after making a recommendation to the other independent directors, together with the other independent directors, determining and approving the Chief Executive Officer’s compensation level based on this evaluation.
•Reviewing compensation arrangements for our employees to evaluate whether incentive and other forms of pay encourage unnecessary or excessive risk taking, and reviewing and discussing, at least annually, the relationship between risk management policies and practices, corporate strategy and our compensation arrangements.
•Reviewing and discussing with management the Compensation Discussion and Analysis and preparing the Compensation Committee Report for inclusion in our annual proxy statement or annual report on Form 10-K.
•Considering the results of the most recent shareholder advisory votes, including those on executive compensation (“say-on-pay”) and say-on-pay frequency, if appropriate, taking such results into consideration in connection with the review and approval of executive officer compensation and practices.
•Adopting, maintaining, and administering our compensation “clawback policy”.
The People and Compensation Committee will consist entirely of independent directors, and we intend that each member of the People and Compensation Committee will meet the independence requirements set forth in the rules of the NYSE and Rule 10C-1 of the Exchange Act. We also intend the members of the People and Compensation Committee to be “non-employee directors” (within the meaning of Rule 16b-3 of the Exchange Act). The initial members of the People and Compensation Committee are expected to be
Governance and Compliance Committee
The responsibilities of the Governance and Compliance Committee will be more fully described in our Governance and Compliance Committee Charter and will include, among other duties:
•Assisting in identifying, recruiting and, if appropriate, interviewing candidates to fill positions on our board of directors.
•Recommending to our board of directors the director nominees for election by the stockholders or appointment by our board of directors, which recommendations shall be consistent with the criteria for selecting directors established by our board of directors from time to time.
•Reviewing annually with our board of directors the composition of our board of directors as a whole and recommending, if necessary, measures to be taken so that our board of directors reflects the appropriate balance of knowledge, experience, skills, expertise and diversity required for our board of directors as a whole and contains at least the minimum number of independent directors required by the NYSE.
•Reviewing annually, and making a recommendation to our board of directors for final determination, regarding the independence of each director in accordance with the standards of independence of the NYSE.
•Making recommendations to our board of directors regarding the size and composition of each standing committee of our board of directors, including the identification of individuals qualified to serve as members of a committee, and recommending individual directors to fill any vacancy that might occur on a committee.
•Developing and recommending to our board of directors a set of corporate governance principles for us, which shall be consistent with any applicable laws, regulations and listing standards.
•Overseeing and advising management the evaluation of our board of directors and its committees,including the reporting to our board of directors on the performance and effectiveness of our board of directors, committees, and individual directors.
•Overseeing our ethics and compliance programs and establishing, implementing and reviewing our ethics and compliance-related policies and procedures, including those relating to (a) the ethical handling of conflicts of interest, (b) the Governance and Compliance Committee’s review and approval or disapproval of proposed “related party transactions” and (c) our Code of Conduct.
•Overseeing and advising management on environmental, health, safety, and security risk management programs and reporting periodically to our board of directors on such matters.
•Reviewing our public policy positions, strategy regarding political engagement and political contributions (at the state, federal and international level), and corporate social responsibility initiatives with significant potential financial and reputational impact.
The Governance and Compliance Committee will consist entirely of independent directors, and we intend that each member of the Governance and Compliance Committee will meet the independence requirements set forth in the rules of the NYSE. The initial members of the Governance and Compliance Committee are expected to be .
Science and Innovation Committee
The responsibilities of the Science and Innovation Committee will be more fully described in our Science and Innovation Committee Charter and will include, among other duties:
•Reviewing, evaluating and advising our board of directors regarding the quality, direction and competitiveness of our innovation programs, platforms, and science and technology capabilities.
•Reviewing, evaluating and advising our board of directors on our progress in achieving our near-term and long-term strategic innovation goals and objectives.
•Monitoring, evaluating and advising the board of directors on our research and development strategy and pipeline progress.
•Periodically reviewing and making recommendations to our board of directors related to our capital allocation and investment strategy for mergers, acquisitions, and the use of partnerships, equity or structured investments, or other strategic alliances for obtaining external innovation.
•Assessing the effectiveness of, and advising our board of directors on, corporate responsibility programs and initiatives, and sustainability policies and programs and matters impacting our public reputation.
•Reviewing our risk management strategy with respect to product stewardship, policies and programs, and periodically reviewing and reporting to our board of directors on product quality stewardship matters and incidents impacting us.
•Overseeing and advising our board of directors on our corporate citizenship and corporate social responsibility programs and activities, including our sustainability commitments and programs, to advance our business strategy and create stakeholder value.
•Assessing our sustainability commitments, policies and performance and making recommendations to our board of directors and management regarding promoting and maintaining superior standards of performance, including processes to ensure compliance with applicable laws and regulations and programs to manage risk.
•Monitoring climate change risks, and reviewing the progress against such targets annually.
The initial members of the Sustainability and Innovation Committee are expected to be .
Stockholder Recommendations for Director Nominees
The Governance and Compliance Committee is expected to adopt a process for identifying new director candidates. The Governance and Compliance Committee will consider potential candidates suggested by board members, as well as management, stockholders and others. The Governance and Compliance Committee will accept stockholders’ suggestions of candidates to consider as potential board members as part of the Governance and Compliance Committee’s periodic review of the size and composition of our board of directors and its committees. The Governance and Compliance Committee will use the same process to evaluate director nominees recommended by stockholders as it does to evaluate nominees identified by other sources.
Director Qualification Standards
The Governance and Compliance Committee will evaluate candidates for board membership in accordance with the qualifications set forth in the Governance and Compliance Committee Charter and the Corporate Governance Guidelines in order to establish a highly qualified board of directors. Those qualifications include integrity and character, sound and independent judgment, breadth of experience, insight and knowledge, business acumen, leadership skills, scientific or technology expertise, familiarity with issues affecting global businesses, prior government or military service, diverse personal attributes, time availability in light of other commitments, dedication, conflicts of interest and such other relevant factors that the Governance and Compliance Committee considers appropriate in the context of the needs of our board of directors.
Corporate Governance Guidelines
The Governance and Compliance Committee will recommend, and our board of directors will adopt, Corporate Governance Guidelines designed to assist Vylor and our board of directors in implementing effective corporate governance practices. The Corporate Governance Guidelines, including our independence standards, will be posted to our website prior to the completion of the spin-off. The Corporate Governance Guidelines will be reviewed regularly by the Governance and Compliance Committee in light of changing circumstances in order to continue serving our best interests and the best interests of our stockholders.
Communications with the Board of Directors and Procedures for Treatment of Complaints Regarding Accounting, Internal Accounting Controls and Auditing Matters
Stockholders and other parties interested in communicating directly with our board of directors may do so by writing in care of the corporate secretary. Our Corporate Governance Guidelines set forth procedures approved by our board of directors for handling correspondence received by Vylor and addressed to the board of directors.
Complaints regarding accounting, internal controls or auditing matters will be handled in accordance with procedures established by the Audit Committee with respect to such matters, which may include an anonymous toll-free hotline and a website through which to report issues.
Codes of Conduct and Financial Ethics
Our board of directors will adopt a code of conduct for all directors of Vylor, which will be intended to foster the highest ethical standards and integrity, focus directors on areas of potential ethical risk and conflicts of interest, guide directors in recognizing and dealing with ethical issues, establish reporting mechanisms and promote a culture of honesty and accountability.
We will also adopt a code of conduct that applies to all of our employees, which will be intended to help employees conduct business in accordance with our values and understand their responsibility for compliance with laws, regulations and our policies.
In addition, the Governance and Compliance Committee is expected to adopt a Code of Ethics for Senior Financial Officers applicable to all of our principal executive officers, principal financial officers, principal accounting officers or controllers, or persons performing similar functions.
Director Compensation
Following the spin-off, director compensation will be determined by our board of directors with the assistance of the People and Compensation Committee. We will include the relevant details in an amendment to the Form 10. It is anticipated that such compensation will consist of the following:
•A cash retainer in the amount of $ per year, and
•An annual equity award in the form of restricted stock units valued at $ .
We also anticipate that the Company’s Non-Executive Chairman will receive an additional cash retainer of $ per year, and an additional annual restricted stock unit grant valued at $ . In addition, we anticipate that the chairs of the Audit Committee and the People and Compensation Committee will receive an additional cash retainer in the amount of $ and $ per year, respectively, and that all other committee chairs will receive an additional cash retainer in the amount of $ per year.
Stock Ownership Guidelines
We expect to adopt Corporate Governance Guidelines setting forth our non-employee director stock ownership guidelines, which require non-employee directors to own within five years from their respective appointment date, equity in an amount equal to five times their annual cash retainer of Vylor. Equity is a key component of director compensation in order to align their interests with those of our stockholders. In order to ensure our non-employee directors meet the stock ownership guidelines, we intend to also implement a stock holding requirement that requires such directors to each hold all equity compensation until he or she meets the stock ownership guidelines.
Deferred Compensation
We expect to continue a legacy director deferred compensation program (both for legacy Corteva directors who continue as directors with us and for new directors) under which non-employee directors may choose, prior to the beginning of each year, to have all or part of their fees credited to a deferred compensation account. Under this program, a director may defer all or part of the board retainer and committee chair fees in cash or stock units until retirement as a director or until a specified year after retirement. Interest will accrue on deferred cash payments and dividend equivalents will accrue on deferred stock units.
COMPENSATION DISCUSSION AND ANALYSIS
The following Compensation Discussion and Analysis (“CD&A”) relates to the historical compensation by Corteva to our named executive officers (“NEOs”) for the fiscal year ended December 31, 2025. The historical Corteva information provided below is required to be included under applicable SEC regulations and refers to the NEOs by their current titles with Corteva.
Following the spin-off, Vylor’s pay practices will be developed to advance the future pay philosophy of Vylor that will be developed by our board of directors and the People and Compensation Committee of our board of directors (the “Vylor Committee”), and therefore the amounts and forms of compensation reported below with respect to 2025 do not necessarily reflect the compensation that our NEOs will receive following the distribution. The Vylor Committee will review the impact of the spin-off and will review all aspects of compensation and may make adjustments that it believes are appropriate in structuring our executive compensation arrangements..
Named Executive Officers
Following the distribution, we expect that Charles V. Magro will serve as our Chief Executive Officer (“CEO”) and that David P. Johnson will serve as our Chief Financial Officer. In addition, our other NEOs will be Samuel R. Eathington, Ph.D., whom we expect to serve as Chief Technology Officer; Judd M. O’Connor, whom we expect to serve as the Chief Commercial and Operations Officer; and Audrey R. Grimm, whom we expect to serve as the Chief People Officer.
Executive Compensation Program Principles
Corteva’s executive compensation programs are designed to attract, engage, reward, and retain the high-quality executives necessary to lead the businesses and execute our business strategy in alignment with the best interests of stockholders. Corteva provides compensation through an appropriate mix of fixed and variable compensation, short-term and long-term incentives, and cash-based and equity-based pay. Its executive compensation programs typically target the market median for each of the key compensation components.
Corteva’s compensation programs are designed and administered to follow these core principles:
•Reinforce Corteva’s business objectives and the creation of sustainable long-term stockholder value;
•Align executives’ interests with stockholders’ interests by weighting a significant portion of compensation on long-term performance programs designed to drive sustained stockholder returns;
•Establish a strong link between pay and performance that supports growth and innovation without encouraging or rewarding excessive risk; and
•Recognize and support outstanding individual performance and behaviors, consistent with clear goals and objectives.
Corteva regularly reviews best practices in governance and executive compensation to evaluate whether its programs align with its core compensation principles and company values. Corteva's key compensation practices are outlined below.
2025 Executive Compensation Practices and Policies
This section summarizes the objectives and elements of Corteva’s executive compensation program and discusses and analyzes the 2025 compensation decisions by the People and Compensation Committee of the Corteva Board (the “Corteva Committee”) regarding the NEOs.
|
|
|
|
|
|
What Corteva Does |
|
|
What Corteva Doesn’t Do |

|
Performance metrics aligning pay with performance, with a structure designed to discourage excessive risk-taking, including utilizing caps on incentive plan payouts |
|

|
Plans and programs that include single-trigger change-in-control provisions |
|
|
|
|
|

|
Balanced short-term and long-term incentives using multiple performance metrics, which allows for the achievement of near-term targets while innovating to provide sustainable long-term growth |
|

|
Compensation practices that encourage excessive risk-taking |
|
|
|
|
|

|
Rigorous stock ownership and retention requirements for NEOs (values equal to a target multiple of base salary) |
|

|
Policies that allow short sales, hedging, margin accounts, or pledging of Corteva securities by its executives and directors |
|
|
|
|
|

|
A comprehensive compensation clawback policy covering cash and equity |
|

|
The reloading, repricing, or backdating of stock options |
|
|
|
|
|

|
An independent compensation consultant to advise on executive compensation |
|

|
Grants of stock options with an exercise price less than fair market value |
|
|
|
|
|

|
Tally sheets to monitor executive compensation |
|

|
Tax gross-ups on benefits and perquisites (except for limited mobility benefits, if applicable) |
|
|
|
|
|

|
Regular review of the Corteva Committee Charter to ensure independence and adherence to best practices and priorities |
|

|
Dividend payments on unvested or unearned performance share units |
|
|
|
|
|

|
Regular review of its peer group with the Corteva Committee to ensure appropriate benchmarking of its compensation programs |
|
|
|
|
|
|
|
|

|
Annual say-on-pay votes |
|
|
|
|
|
|
|
|

|
Use of a sustainability modifier in its short-term incentive plan to hold executives accountable for incremental progress toward Corteva’s sustainability objectives |
|
|
|
|
|
|
|
|

|
Regular engagement with its investors on Corteva’s strategy, governance, and compensation programs |
|
|
|
We expect the Vylor executive compensation program to include many, if not all, of the same best practices.
Oversight Responsibilities for Executive Compensation
The table below summarizes the distribution of oversight responsibilities related to executive compensation.
|
|
|
People and Compensation Committee |
|
Establishes executive compensation philosophy Approves incentive compensation programs and target performance expectations for Performance Reward Plan (“PRP”) and the performance-based restricted stock units (“PSUs”) component of long-term incentive (“LTI”) awards Approves all compensation actions for the executive officers, including base salaries, target and actual PRP awards, and LTI grants, including target and actual PSU awards, except CEO base salary and target awards approved by the independent Board members Recommends compensation actions for Corteva's CEO to the independent members of the Corteva board, including base salary, target PRP award, and LTI grant, including the target PSU award |
All Independent Board Members |
|
Evaluates the performance of Corteva's CEO Approves base salary, target PRP award, and LTI grant, including target and actual PSU award, for Corteva's CEO |
Independent Committee Consultant — Cook |
|
Provides independent advice, research, and analytical services on a variety of subjects to the Corteva Committee, including compensation of executive officers, nonemployee director compensation, and executive compensation trends Participates in Corteva Committee meetings as requested and communicates with the Chair of the Corteva Committee between meetings |
CEO |
|
Provides a performance assessment of the other executive officers Recommends compensation targets and actual awards for the other executive officers to the Corteva Committee |
In addition to company performance, the Corteva Committee considers a broad array of facts and circumstances in finalizing executive officer pay decisions, including competitive analysis, tally sheets, and stockholder feedback. As part of its annual executive compensation evaluations, the Corteva Committee considered each NEO’s scope of responsibility, experience, performance, results and potential. The Corteva Committee also considered the need to retain talent, business conditions, and the competitive compensation levels for comparable positions benchmarked against Corteva’s peer group and general industry information.
Corteva's compensation programs are dynamic, and the Corteva Committee actively updates such programs in response to changing circumstances to ensure that its executive officers’ compensation is aligned with its stockholders’ interests. The Corteva Committee retains the authority to adjust awards when in its discretion exceptional circumstances warrant such adjustments from Corteva’s established incentive programs.
Peer Group Analysis
To ensure a complete and robust picture of the overall compensation environment, and to provide consistent comparisons against which to benchmark compensation for the CEO and other NEOs, Corteva utilizes a select group of peer companies (“peer group”) to:
•Benchmark pay design including mix and performance criteria;
•Test the link between pay and performance; and
•Determine the competitiveness of the compensation paid to its NEOs.
The peer group generally reflects the agricultural and chemical industries in which Corteva operates, represents the multiple markets in which it competes — including markets for executive talent, customers and capital — and comprises large companies with a strong scientific focus and/or research intensity, as well as a significant international presence.
To help guide the selection process in an objective manner, the Corteva Committee established the following criteria requiring peer group companies be:
•Publicly traded U.S. companies and select non-U.S. based companies traded on the New York Stock Exchange to facilitate pay design and performance comparisons;
•Direct business competitors; and
•Companies similar in size to Corteva — 1/3X to 3X revenue and market capitalization criteria.
Based upon the criteria it established, the Corteva Committee, in consultation with Cook and with management established the following peer group in 2022 and continued with this peer group for benchmarking 2025 compensation program design.
|
|
|
|
|
3M Company |
|
DuPont de Nemours, Inc. |
|
International Flavors & Fragrances, Inc. |
Air Products and Chemicals, Inc. |
|
Eastman Chemical Company |
|
Nutrien Ltd. |
Archer-Daniels Midland Company |
|
Ecolab Inc. |
|
PPG Industries, Inc. |
Avery Dennison Corporation |
|
FMC Corporation |
|
The Sherwin-Williams Company |
Celanese Corporation |
|
Honeywell International Inc. |
|
Zoetis Inc. |
Deere & Company |
|
|
|
|
The Corteva Committee revised Corteva’s peer group in July 2025 to remove Avery Dennison Corporation and FMC Corporation for no longer meeting the Corteva Committee's peer group criteria. These peer companies were replaced with Becton, Dickinson and Co. and Biogen Inc. The current Corteva peer group as updated in July 2025 is set forth below.
|
|
|
|
|
3M Company |
|
Deere & Company |
|
International Flavors & Fragrances, Inc. |
Air Products and Chemicals, Inc. |
|
DuPont de Nemours, Inc. |
|
Nutrien Ltd. |
Archer-Daniels Midland Company |
|
Eastman Chemical Company |
|
PPG Industries, Inc. |
Becton, Dickinson and Co.: |
|
Ecolab Inc. |
|
The Sherwin-Williams Company |
Biogen Inc. |
|
Honeywell International Inc. |
|
Zoetis Inc. |
Celanese Corporation |
|
|
|
|
Published Compensation Surveys
In addition to benchmarking its compensation programs against our peer group, the Corteva Committee utilizes data obtained from published compensation surveys. The data utilized from these surveys represents large companies with median revenue comparable to Corteva’s. Data obtained from these published surveys are used in conjunction with peer group data in assessing the compensation of its NEOs and are used as a secondary source of data for assessing the compensation of the CEO.
Tally Sheets
For each NEO, the Corteva Committee annually reviews tally sheets that include all aspects of total compensation and the benefits associated with various termination scenarios. Tally sheets provide the Corteva Committee with information on all elements of actual and potential future compensation of the NEOs, as well as data on retention linkages. This helps the Corteva Committee monitor that there are no unintended consequences of its actions.
Components of Corteva's Executive Compensation Program
The components of Corteva’s executive compensation program align with its executive compensation philosophy.
Direct Compensation Elements
|
|
|
|
|
Pay Element |
|
Role in Program/Objectives |
|
How Amounts Are Determined |
Base salary |
|
•Provides regular source of income for NEOs •Provides foundation for other pay components (i.e., PRP targets expressed as a percentage of base salary) |
|
Based on a range of factors, including peer data, market pay surveys, business results, and individual performance |
PRP awards |
|
•Align executives with annual goals and objectives •Create a direct link between executive pay and annual financial and operational performance |
|
Actual payout is based on financial performance of the company, modified as applicable by sustainability performance |
LTI awards |
|
•Link pay and performance — accelerate growth, profitability, and stockholder return •Align the interests of executives with stockholders •Balance plan costs, such as accounting and dilution, with employee-perceived value, potential earning opportunity, and employee share ownership objectives |
|
Actual value realized is based on company performance over a multi-year time frame and/or is linked to stock price |
Performance metrics for our short- and long-term incentive programs for our NEOs are established typically at the beginning of the calendar year in February. Adjustments to incentive award terms and conditions or criteria may be made by the Corteva Committee to recognize unusual or infrequent events affecting Corteva or its financial statements, or due to changes in applicable laws, regulations, or accounting principles that are unrelated to the underlying operational performance of Corteva. These adjustments can have either a positive or negative impact on award payouts.
On March 1, 2023, Corteva completed its acquisitions of the Stoller Group, Inc. (“Stoller”), one of the largest independent companies in the Biologicals industry, and Quorum Vital Investment, S.L. and its affiliates (“Symborg”), an expert in microbiological technologies (together "the Biologicals acquisitions"). With respect to PSU awards, the Corteva Committee excludes the impact of the sales, costs, and assets and liabilities from acquisitions completed during the performance year, if the performance payout is impacted plus or minus 5%. Additionally, with respect to PSU awards, the Corteva Committee excludes the impact of acquisitions which occur when more than 50% of the applicable performance award is complete. If 50% or more of the applicable performance period remains, performance targets may be adjusted for each of the performance years impacted by the acquisitions (year of acquisition plus years following). Consistent with this framework, the targets for the 2023-2025 PSU awards were adjusted to reflect the impact of the Biologicals acquisitions. See 2023-2025 Annual PSU Awards (PSUs Payable in 2026) for additional information.
Target Compensation Pay Mix
To reinforce its pay-for-performance philosophy, Corteva targets a significant portion of its NEOs’ compensation to be “at risk”, tying each NEO’s compensation to Corteva’s financial performance, the executive’s continued employment with Corteva, and the performance of its common stock as indicated by Corteva’s share price. The Corteva Committee believes this approach motivates executives to consider the impact of their decisions on stockholder value.
2025 Target Compensation Mix and “Pay at Risk”
|
|
|
CEO |
|
Other NEOs |
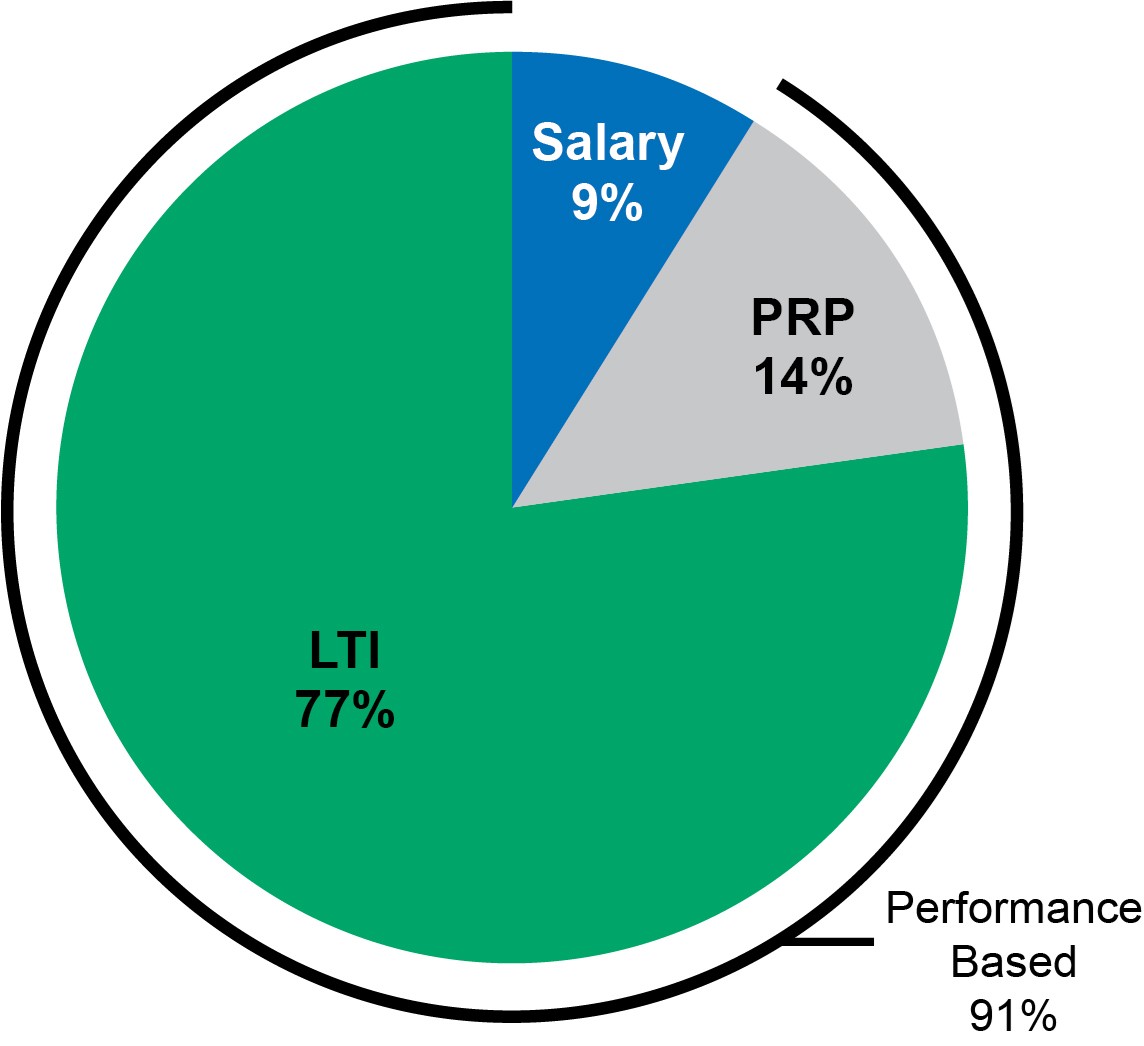
|
|
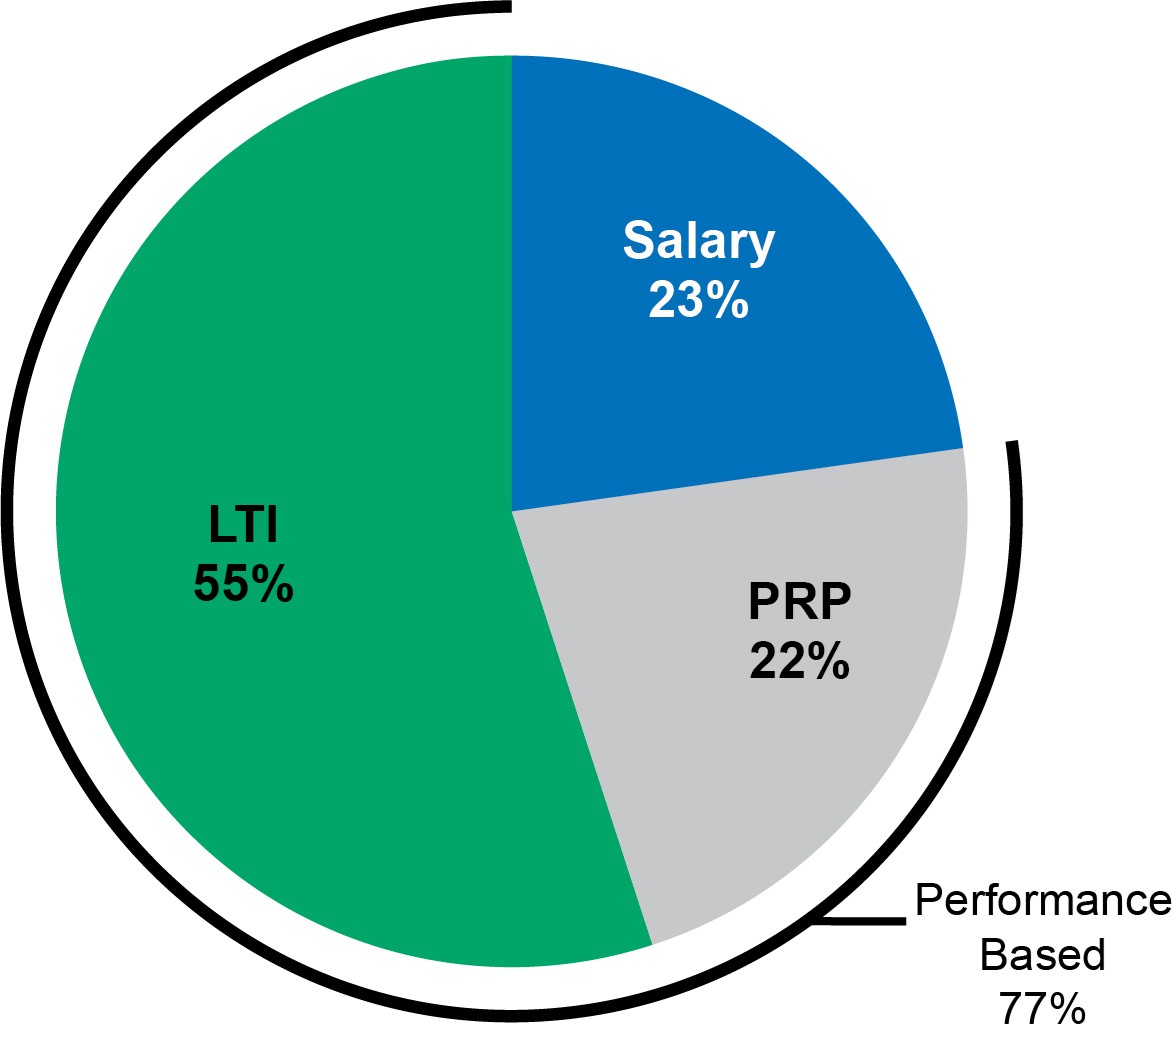
|
•91% of targeted Total Direct Compensation (“TDC”) for the CEO at risk •15% of the at-risk pay is tied to achievement of annual incentive goals,
85% is tied to achievement of financial goals and/or share price over a
multi-year period |
|
•On average 77% of TDC for the other NEOs is at risk •On average 29% of the at-risk pay is tied to achievement of annual
incentive goals, 71% is tied to achievement of financial goals and/or
share price over a multi-year period |
Benefits, Retirement and Other Compensation Components
In addition to the annual and long-term direct compensation programs designed to align pay with performance, Corteva provides our executives with additional compensation elements including: health and welfare, paid time off, and other benefits, retirement plans, and limited perquisites.
|
|
|
|
|
Pay Element |
|
Role in Program/Objectives |
|
How Amounts Are Determined |
Standard health, welfare,
paid time off, and other
benefits provided to
other employees |
|
•Same tax-qualified retirement, medical, dental, vacation benefit, life insurance, and disability plans provided to other employees |
|
Tax-qualified plans are targeted to peer group median in the aggregate |
Non-qualified retirement
and deferred
compensation plans
provided to other
employees |
|
•Nonqualified retirement plans that restore benefits above the Internal Revenue Code (“IRC”) limits for tax-qualified retirement plans as provided to other eligible employees •Nonqualified deferred compensation plan that allows for deferral of base salary, PRP and LTI awards |
|
Nonqualified retirement plans are provided to restore benefits lost due to IRC limits |
Change in Control and
Executive Severance
benefits |
|
•Severance benefits upon a change in control and qualifying termination (double-trigger) provided to ensure continuity of management in a potential change in control environment •A change in control does not automatically entitle an executive to this severance benefit. An executive must lose his/her job within a defined period surrounding the change in control (see Change in Control and Executive Severance Benefits below for more details) •Severance benefits not associated with a change in control provided as a component of overall competitive compensation and benefit employment package at senior executive levels in the organization |
|
Benefits provided are a function of both the termination reason (i.e., whether or not associated with a change in control) and the executive level |
Limited perquisites |
|
•Personal financial counseling (excluding tax preparation) at a cost of $13,000 per NEO •Relocation expenses under a Corteva relocation policy generally applicable to its management employees |
|
Amounts are determined by market rates |
Perquisites
Corteva’s general policy is to limit perquisites and other personal benefits to NEOs. However, these personal benefits may be provided to remain competitive with market practices or when they provide a benefit to Corteva. For perquisites and other personal benefits, the Corteva Committee expects to pay amounts as determined by market practices and rates, or as established by applicable Corteva security policies or benefit programs applicable to all employees or all management-level employees. For additional information on perquisite and other benefit compensation, see the “2025 Summary Compensation Table”.
Change in Control and Executive Severance Benefits
To ensure that executives remain focused on Corteva business during a period of uncertainty that may arise in the case of a potential change in control, and to maintain the competitiveness of its overall executive compensation and benefit offerings, Corteva offers a Change in Control and Executive Severance Plan. Each of the NEOs is a participant in the plan. For any benefits to be earned under the plan in association with a change in control, a change in control must occur and the executive’s employment must be terminated within two years following the change in control event, either by Corteva without cause or by the executive for good reason (often called a “double trigger”). Under the Change in Control and Executive Severance Plan the CEO severance payout factor is 2.99 times target total cash compensation.
The plan requires a release of claims as a condition to the payment of benefits and includes one-year non-competition and non-solicitation provisions and additional non-disparagement and confidentiality provisions. For additional information about benefits under the Change in Control and Executive Severance Plan see the section titled “Executive Compensation—Potential Payments Upon Termination or Change in Control”.
Management of Compensation Risk
The Corteva Committee regularly monitors its compensation programs to assess whether those programs are motivating the desired behaviors while delivering on Corteva’s performance objectives and encouraging appropriate levels of risk-taking. In 2025, the Corteva Committee engaged Cook to perform a risk assessment of its compensation programs. Cook’s review encompassed an assessment of risk pertaining to a broad range of design elements, such as mix of pay, performance metrics, goal-setting and payout curves, and payment timing and adjustments, as well as other mitigating program elements noted below. Cook’s analysis determined, and the Corteva Committee concurred, that Corteva’s compensation programs do not encourage behaviors that would create undue material risk for Corteva.
Payout Limitations or Caps
Payout limitations, or “caps,” play a vital role in risk mitigation, and all metrics in the PRP and PSU programs are capped at 200% to protect against excessive payouts.
Stock Ownership Guidelines
Corteva requires that NEOs accumulate and hold shares of Corteva Common Stock with a value equal to a specified multiple of base pay. These targets are 6, 4, and 3 times base salary for Corteva’s CEO, executive vice presidents, and senior vice presidents, respectively.
Stock ownership guidelines also include a retention ratio requirement. Under the guidelines, until the required ownership is reached, executives are required to retain 75% of net shares acquired upon any future vesting of stock units or exercise of stock options, after deducting shares used to pay applicable withholding taxes and/or exercise price, as applicable.
For purposes of the stock ownership guidelines, the direct ownership of shares and stock units held in employee plans and awards of restricted stock units (“RSUs") awards are included. Stock options and PSUs are not included in determining whether an executive has achieved the ownership levels. NEOs are generally expected to reach these targets in five years of their respective appointment date. Messrs. Magro, Johnson, and O’Connor, Dr. Eathington, and Ms. Grimm have each met their respective ownership guideline.
Vylor is also expected to adopt similar stock ownership guidelines in connection with the spin-off.
Compensation Recovery Policy (Clawback)
Corteva maintains a compensation recovery policy complying with the NYSE Listing Rules and Section 10D and Rule 10D-1 of the Exchange Act. The policy covers each current and former employee of Corteva or an affiliated company who is, or was, the recipient of incentive-based compensation (“Grantee”) awarded following the adoption of the policy, including each of our NEOs.
Under Corteva’s policy, a mandatory clawback applies to its officers subject to Section 16 of the Exchange Act, if Corteva is required to prepare an accounting restatement due to its material noncompliance with any financial reporting requirement under securities law or is required to correct an error in previously issued financial statements that is material to the previously issued financial statements, or that would result in a material misstatement if the error were corrected in the current period or left uncorrected in the current period. Except where impracticable by law, Corteva’s policy requires the reimbursement or forfeiture of any excess incentive-based
compensation received by the Grantee over the amount that would have been paid to the Grantee had it been paid on the restated results. In any case, should Corteva demand reimbursement of amounts paid to a Grantee, the Grantee will be required to provide such repayment within ten (10) business days following such demand. The Corteva Committee in its discretion may also apply such clawback to other current and former senior employees of Corteva.
Also under Corteva’s policy, if a Grantee, subject to the policy, engages in misconduct, then at the discretion of the Corteva Committee:
•He/she may forfeit any right to receive any future awards or other equity-based incentive compensation; and/or
•Corteva may demand repayment of any awards or cash payments already received by a Grantee.
“Misconduct” for purposes of our policy means any of the following:
•The Grantee’s employment or service is terminated for cause;
•There has been a breach of a noncompete or confidentiality covenant set out in any employee agreement or arrangement with Corteva; or
•There has been a willful violation of Corteva’s Code of Conduct or other company policies that causes significant financial or reputational harm to Corteva.
Vylor is also expected to adopt a similar compensation recovery policy in connection with the spin-off.
Prohibition on Hedging and Pledging of Corteva’s Common Stock
Corteva’s insider trading policy includes an “anti-hedging” provision that prohibits directors and executive officers and certain of their related persons (such as certain of their family members and entities they control) from engaging in hedging transactions and short sales with respect to its securities or those of its subsidiaries. Corteva’s insider trading policy also prohibits its directors and executive officers from holding securities of Corteva or its subsidiaries in a margin account and the pledging of any of these securities as collateral for a loan. Corteva’s insider trading policy strongly recommends that other employees not engage in hedging and pledging transactions. Vylor is expected to adopt a similar insider trading policy in connection with the spin-off.
2026 Compensation Decisions
The Corteva Committee reevaluated the design of its incentive programs for 2026 to consider the impacts of the proposed spin-off and to further align its executives' interest with those of its stockholders.
Short-Term Incentive Design
In light of the proposed spin-off, the Corteva Committee simplified Corteva’s PRP program to a single enterprise PRP to continue to drive whole company performance while executing on the proposed spin-off transaction. Additionally, for Corteva’s 2026 enterprise PRP program, the Free Cash Flow metric was eliminated, thereby limiting the enterprise PRP metrics to Operating EBITDA and Operating EBITDA Margin, weighted at 75% and 25%, respectively. While the Corteva Committee believes a cash-related metric will likely be important to both Corteva’s and Vylor’s compensation programs in the future, the Corteva Committee concluded that it was not an appropriate fit for the 2026 short-term incentive program given that the proposed spin-off is expected to occur in the second half of 2026 and that the cash-related metric was most appropriately measured on an annual basis given the seasonal dynamics of its business and industry. Additionally, a number of pending capital allocation decisions related to the proposed spin-off presented challenges to the Corteva Committee’s ability to appropriately set goals for this metric in the first quarter of 2026.
Long-Term Incentive Design
For 2026, the Corteva Committee determined it would eliminate stock options as a component of Corteva’s long-term incentive program and change its equity mix to be 50% each of PSUs and RSUs in 2026. In consideration of the proposed spin-off transaction, the Corteva Committee believed shifting more weight to RSUs would provide further retention of key executives and better align to the long-term interests of stockholders.
Treatment of Outstanding Equity Awards as of the Distribution Date
This section will be populated, in an amendment to the Form 10, to provide information regarding the treatment of outstanding equity awards.
Vylor Equity Incentive Plan
We intend to adopt an equity incentive plan (the “EIP”). The EIP will become effective as of the distribution date, subject to the occurrence of the distribution. This section will be populated, in an amendment to the Form 10, to provide information regarding the terms of the EIP.
Vylor Employee Stock Purchase Plan
We intend to adopt an employee stock purchase plan (the “ESPP”). The ESPP will become effective as of the distribution date, subject to the occurrence of the distribution. This section will be populated, in an amendment to the Form 10, to provide information regarding the terms of the ESPP.
EXECUTIVE COMPENSATION
Summary Compensation Table
The following table summarizes the compensation for the fiscal year ended December 31, 2025 of the individuals Corteva expects will be Vylor’s Chief Executive Officer and Chief Financial Officer, as well as Vylor’s three other most highly compensated executive officers (the “Vylor NEOs”) for the fiscal year ended December 31, 2025, based in each case on compensation received from Corteva. The following information for executive compensation relates to the historical compensation provided by Corteva for the fiscal year ended December 31, 2025, which is required to be included under applicable SEC regulations.
|
|
|
|
|
|
|
|
|
|
|
|
|
|
|
|
|
|
|
|
|
|
|
|
|
|
|
|
|
|
|
|
|
|
|
Name and Principal
Position (a) |
|
Year
(b) |
|
Salary
($)(c)(1) |
|
|
Bonus
($)(d)(2) |
|
|
Stock
Awards
($)(e)(3) |
|
|
Option
Awards
($)(f)(4) |
|
|
Non-equity
Incentive Plan
Compensation
($)(g)(5) |
|
|
Change in
Pension
Value and
Non-Qualified
Deferred
Compensation
Earnings
($)(h)(6) |
|
|
All other
compensation
($)(i)(7) |
|
|
Total
($)(j) |
|
Charles V. Magro |
|
2025 |
|
|
1,405,385 |
|
|
|
— |
|
|
|
9,320,078 |
|
|
|
2,330,023 |
|
|
|
3,990,000 |
|
|
|
— |
|
|
|
453,913 |
|
|
|
17,499,399 |
|
Chief Executive Officer |
|
2024 |
|
|
1,402,308 |
|
|
|
— |
|
|
|
8,800,014 |
|
|
|
2,200,018 |
|
|
|
1,671,600 |
|
|
|
— |
|
|
|
433,119 |
|
|
|
14,507,058 |
|
|
|
2023 |
|
|
1,341,923 |
|
|
|
— |
|
|
|
8,200,042 |
|
|
|
2,050,001 |
|
|
|
1,472,175 |
|
|
|
— |
|
|
|
170,731 |
|
|
|
13,234,872 |
|
David P. Johnson |
|
2025 |
|
|
748,750 |
|
|
|
— |
|
|
|
1,760,016 |
|
|
|
440,009 |
|
|
|
1,425,000 |
|
|
|
— |
|
|
|
104,863 |
|
|
|
4,478,638 |
|
EVP, Chief Financial Officer |
|
2024 |
|
|
214,712 |
|
|
|
450,000 |
|
|
|
4,560,121 |
|
|
|
440,016 |
|
|
|
168,715 |
|
|
|
— |
|
|
|
5,225 |
|
|
|
5,838,788 |
|
Samuel R. Eathington, Ph.D. |
|
2025 |
|
|
694,365 |
|
|
|
— |
|
|
|
1,320,076 |
|
|
|
330,007 |
|
|
|
1,320,500 |
|
|
|
— |
|
|
|
107,992 |
|
|
|
3,772,941 |
|
EVP, Chief Technology |
|
2024 |
|
|
675,962 |
|
|
|
— |
|
|
|
1,200,051 |
|
|
|
300,001 |
|
|
|
537,300 |
|
|
|
— |
|
|
|
141,404 |
|
|
|
2,854,718 |
|
& Digital Officer |
|
2023 |
|
|
645,962 |
|
|
|
— |
|
|
|
1,120,099 |
|
|
|
280,002 |
|
|
|
472,550 |
|
|
|
— |
|
|
|
171,551 |
|
|
|
2,690,163 |
|
Judd M. O’Connor |
|
2025 |
|
|
627,404 |
|
|
|
— |
|
|
|
960,067 |
|
|
|
240,005 |
|
|
|
1,167,500 |
|
|
|
102,736 |
|
|
|
107,507 |
|
|
|
3,205,218 |
|
EVP, Seed Business Unit |
|
|
|
|
|
|
|
|
|
|
|
|
|
|
|
|
|
|
|
|
|
|
|
|
|
|
Audrey R. Grimm |
|
2025 |
|
|
581,462 |
|
|
|
— |
|
|
|
1,040,062 |
|
|
|
260,005 |
|
|
|
944,775 |
|
|
|
— |
|
|
|
101,115 |
|
|
|
2,927,419 |
|
SVP, Chief People Officer |
|
|
|
|
|
|
|
|
|
|
|
|
|
|
|
|
|
|
|
|
|
|
|
|
|
|
(1)The salary amount for Mr. Johnson was prorated for his length of service in 2024.
(2)Amount represents the one-time cash signing bonus for Mr. Johnson to compensate for certain cash incentive compensation from his former employer that would be forfeited, in order to join Corteva.
(3)Amounts represent the aggregate grant date fair value of RSU and PSU awards in the year of grant in accordance with the same standard applied for financial accounting purposes, Financial Accounting Standards Board (“FASB”) Accounting Standards Codification (“ASC”) Topic 718. If valued assuming a maximum payout, the value of the 2025 PSU awards would be: Mr. Magro, $13,980,085; Mr. Johnson, $2,640,024; Dr. Eathington, $1,980,082; Mr. O’Connor, $1,440,036; and Ms. Grimm, $1,560,061. This column does not represent the stock-based compensation expense recognized in Corteva’s financial statements for the respective year end. See “2025 Grants of Plan-Based Awards — Grant Date Fair Value of Stock and Option Awards”.
(4)Amounts represent the aggregate grant date fair value of stock options computed in accordance with FASB ASC Topic 718 in the year of grant. A discussion of the assumptions used in calculating these values can be found in Note 18 to the Corteva Consolidated Financial Statements herein. This column does not represent the stock-based compensation expense recognized in Corteva’s financial statements for the year ended December 31, 2025.
(5)Non-Equity Incentive Plan Compensation is detailed in “Compensation Discussion and Analysis” and reflect income earned for performance achieved in the respective year.
(6)This column reports the estimated change in the actuarial present value of an NEO’s accumulated pension benefits and any above-market earnings on nonqualified deferred compensation balances. Corteva does not credit participants in the nonqualified plans with above-market earnings, therefore, only the change in the pension value is reflected here. Where the overall change in pension value is negative, no value is reported.
(7)Amounts shown in this column include Corteva contributions to both qualified and non-qualified defined contribution plans, as applicable, as well as the value of certain perquisites or other personal benefits. For a detailed discussion of the items and amounts reported in this column, refer to the “Executive Compensation —Narrative Discussion of Summary Compensation Table —All Other Compensation”.
Narrative Discussion of Summary Compensation Table
Salary
Amounts shown in the “Salary” column of the table above represent base salary earned from Corteva during 2025.
Stock Awards
Amounts shown in the “Stock Awards” column of the table above represent the aggregate grant date fair value of Corteva RSUs and PSUs computed in accordance with FASB ASC Topic 718. For PSUs, the aggregate grant date fair value is based upon the probable outcome of the performance conditions. This amount is consistent with the estimate of aggregate compensation cost to be recognized over the service period determined as of the grant date under FASB ASC Topic 718, excluding the effect of estimated forfeitures. See “Executive Compensation—Grants of Plan-Based Awards — Grant Date Fair Value of Stock and Option Awards” for a detailed discussion of the grant date fair value of stock awards.
Option Awards
Amounts shown in the “Option Awards” column of the table above represent the aggregate grant date fair value of stock options computed in accordance with FASB ASC Topic 718. Refer to “Executive Compensation—Grants of Plan-Based Awards — Grant Date Fair Value of Stock and Option Awards” for a detailed discussion of the grant date fair value of option awards.
Non-Equity Incentive Plan Compensation
Amounts shown in this column of the table above represent Corteva cash-based annual incentives under the PRP. Refer to “Compensation Discussion and Analysis ” for a detailed discussion of the calculation of individual results for payouts under the PRP for our NEOs.
Change in Pension Value and Nonqualified Deferred Compensation Earnings
Amounts shown in this column of the table above represent the estimated change in the actuarial present value of accumulated Corteva pension benefits for Mr. O’Connor at retirement at age 65. Key actuarial assumptions for the present value of accumulated benefit calculation can be found in Note 17 (“Pension Plans and Other Post-Employment Benefits”) to the Corteva Consolidated Financial Statements herein. Assumptions are further described in the narrative discussion following the Pension Benefits table.
There were no above-market or preferential earnings during 2025 on Corteva nonqualified deferred compensation. Generally, earnings on nonqualified deferred compensation include returns on investments in seven core investment alternatives, interest accruals on cash balances, Corteva common stock returns, and dividend reinvestments. Interest is accrued on cash balances based on a rate that is traditionally less than 120% of the applicable federal long-term rate, and dividend equivalents are accrued at a non-preferential rate. In addition, the other core investment alternatives are a subset of the investment alternatives available to all employees under the Corteva’s Retirement Savings Plan (“RSP”). Accordingly, these amounts are not considered above-market or preferential earnings for purposes of, and are not included in, the "Summary Compensation Table".
Accordingly, all amounts shown in this column reflect the change in the pension value under the Pension Plan (as defined below). The change in pension value represents the change in the present value from the prior measurement date of an NEO’s accumulated benefit as of the applicable pension measurement date.
All Other Compensation
Amounts shown in the “All Other Compensation” column of the table for 2025 above include Corteva’s perquisites and personal benefits and Corteva’s contributions to both qualified and nonqualified defined contribution plans. These amounts are described in the table below.
|
|
|
|
|
|
|
|
|
|
Name |
|
Perquisites and Other Personal Benefits ($)(a) |
|
|
Registrant Contributions to Qualified Defined Contribution Plans ($)(b) |
|
|
Registrant Contributions to Nonqualified Defined Contribution Plans ($)(c) |
|
Charles V. Magro |
|
183,735 |
|
|
31,350 |
|
|
238,829 |
|
David P. Johnson |
|
78,007 |
|
|
26,856 |
|
|
— |
|
Samuel R. Eathington, Ph.D. |
|
— |
|
|
31,350 |
|
|
76,642 |
|
Judd M. O'Connor |
|
13,000 |
|
|
31,350 |
|
|
63,157 |
|
Audrey R. Grimm |
|
18,000 |
|
|
31,350 |
|
|
51,765 |
|
(a)Amounts for Messrs. Magro and Johnson include the value of the personal use of Corteva’s aircraft in amounts of $183,735 and $2,103, respectively. Mr. Magro under the Company’s security policies is required for his personal safety to use Corteva’s aircraft for both business and personal flights. Corteva allows executives and directors, when accompanying the executive their immediate family members, to use its corporate aircraft for personal use for reasons in order to comply with the Company's securities policies, as well as for Corteva’s preference and convenience. The value of personal aircraft usage reported above is based on the actual direct operating costs for operating the aircraft, including jet fuel, maintenance, crew travel, catering, in-flight wi-fi data usage, and airport related fees. Since the corporate aircraft is used primarily for business travel, the methodology excludes fixed costs which do not change based on usage, such as pilots’ and other employees’ salaries, purchase costs of the aircraft and non-trip-related hangar expenses. Amounts for Mr. Johnson include the value of relocation costs of $75,904 provided to the executive at the Company’s expense to relocate them to Corteva’s headquarters. Corteva’s relocation policies applicable to all management-level employees typically provide reimbursement for, among other items, the costs of identifying a new residence, real estate commissions and certain other costs associated with the sale of the home, and the storage and shipment of belongings. The relocation expenses do not include any home loss buyout for Mr. Johnson. Perquisites for Mr. O'Connor and Ms. Grimm include $13,000 each for financial counseling. Ms. Grimm’s perquisites also include $5,000 for an executive physical.
(b)Amounts represent Corteva’s match to the RSP on the same basis as provided to U.S. parent company employees. For 2025, the RSP provided a Company match of 100% of the first 6% of the employee’s contribution. Amounts also include an additional Company contribution of 3%.
(c)Amounts represent Corteva’s match to the Retirement Savings Restoration Plan (“RSRP”) on the same basis as provided to U.S. parent company employees who fall above the applicable IRC limits. For 2025, the RSRP provided a Company match of 100% of the first 6% of the employee’s eligible contributions. Amounts also include an additional Company contribution of 3% of eligible contributions.
Grants of Plan-Based Awards
The following table provides additional information about plan-based compensation disclosed in the Summary Compensation Table for 2025. This table includes both equity and non-equity awards.
|
|
|
|
|
|
|
|
|
|
|
|
|
|
|
|
|
|
|
|
|
|
|
|
|
|
|
|
|
|
|
|
|
|
|
|
|
|
|
|
|
|
|
|
|
|
|
|
|
|
|
|
|
|
|
|
|
|
|
|
|
|
|
|
|
All Other |
|
|
All Other |
|
|
|
|
|
|
|
|
|
|
|
|
|
|
|
|
|
|
|
|
|
|
|
|
|
|
|
|
|
Stock |
|
|
Option |
|
|
|
|
|
|
|
|
|
|
|
|
|
|
|
|
|
|
|
|
|
|
|
|
|
|
|
|
|
Awards: |
|
|
Awards: |
|
|
Exercise or |
|
|
Grant Date |
|
|
|
|
|
Estimated Future Payouts
Under Non-Equity Incentive
Plan Awards |
|
|
Under Equity Incentive
Estimated Future Payouts
Plan Awards |
|
|
Number of
Shares of
Stock or |
|
|
Number of
Securities
Underlying |
|
|
Base
Price of
Option |
|
|
Fair Value
of Stock
and Option |
|
Name |
|
Grant
Date |
|
Threshold
($) |
|
|
Target
($) |
|
|
Maximum
($) |
|
|
Threshold
(#) |
|
|
Target
(#) |
|
|
Maximum
(#) |
|
|
Units
(#) |
|
|
Options
(#) |
|
|
Awards
($/Sh) |
|
|
Awards
($) |
|
Charles V. Magro |
|
|
|
|
— |
|
|
|
2,100,000 |
|
|
|
4,200,000 |
|
|
|
— |
|
|
|
— |
|
|
|
— |
|
|
|
— |
|
|
|
— |
|
|
|
— |
|
|
|
|
|
|
2/18/2025 |
|
|
— |
|
|
|
— |
|
|
|
— |
|
|
|
— |
|
|
|
108,440 |
|
|
|
216,880 |
|
|
|
— |
|
|
|
— |
|
|
|
— |
|
|
|
6,990,042 |
|
|
|
2/18/2025 |
|
|
— |
|
|
|
— |
|
|
|
— |
|
|
|
— |
|
|
|
— |
|
|
|
— |
|
|
|
36,147 |
|
|
|
— |
|
|
|
— |
|
|
|
2,330,036 |
|
|
|
2/18/2025 |
|
|
— |
|
|
|
— |
|
|
|
— |
|
|
|
— |
|
|
|
— |
|
|
|
— |
|
|
|
— |
|
|
|
97,859 |
|
|
$ |
64.46 |
|
|
|
2,330,023 |
|
David P. Johnson |
|
|
|
|
— |
|
|
|
750,000 |
|
|
|
1,500,000 |
|
|
|
— |
|
|
|
— |
|
|
|
— |
|
|
|
— |
|
|
|
— |
|
|
|
— |
|
|
|
|
|
|
2/18/2025 |
|
|
— |
|
|
|
— |
|
|
|
— |
|
|
|
— |
|
|
|
20,478 |
|
|
|
40,956 |
|
|
|
— |
|
|
|
— |
|
|
|
— |
|
|
|
1,320,012 |
|
|
|
2/18/2025 |
|
|
— |
|
|
|
— |
|
|
|
— |
|
|
|
— |
|
|
|
— |
|
|
|
— |
|
|
|
6,826 |
|
|
|
— |
|
|
|
— |
|
|
|
440,004 |
|
|
|
2/18/2025 |
|
|
— |
|
|
|
— |
|
|
|
— |
|
|
|
— |
|
|
|
— |
|
|
|
— |
|
|
|
— |
|
|
|
18,480 |
|
|
$ |
64.46 |
|
|
|
440,009 |
|
Samuel R. |
|
|
|
|
— |
|
|
|
695,000 |
|
|
|
1,390,000 |
|
|
|
— |
|
|
|
— |
|
|
|
— |
|
|
|
— |
|
|
|
— |
|
|
|
— |
|
|
|
|
Eathington, Ph.D. |
|
2/18/2025 |
|
|
— |
|
|
|
— |
|
|
|
— |
|
|
|
— |
|
|
|
15,359 |
|
|
|
30,718 |
|
|
|
— |
|
|
|
— |
|
|
|
— |
|
|
|
990,041 |
|
|
|
2/18/2025 |
|
|
— |
|
|
|
— |
|
|
|
— |
|
|
|
— |
|
|
|
— |
|
|
|
— |
|
|
|
5,120 |
|
|
|
— |
|
|
|
— |
|
|
|
330,035 |
|
|
|
2/18/2025 |
|
|
— |
|
|
|
— |
|
|
|
— |
|
|
|
— |
|
|
|
— |
|
|
|
— |
|
|
|
— |
|
|
|
13,860 |
|
|
$ |
64.46 |
|
|
|
330,007 |
|
Judd M. O’Connor |
|
|
|
|
— |
|
|
|
625,000 |
|
|
|
1,250,000 |
|
|
|
— |
|
|
|
— |
|
|
|
— |
|
|
|
— |
|
|
|
— |
|
|
|
— |
|
|
|
|
|
|
2/18/2025 |
|
|
— |
|
|
|
— |
|
|
|
— |
|
|
|
— |
|
|
|
11,170 |
|
|
|
22,340 |
|
|
|
— |
|
|
|
— |
|
|
|
— |
|
|
|
720,018 |
|
|
|
2/18/2025 |
|
|
— |
|
|
|
— |
|
|
|
— |
|
|
|
— |
|
|
|
— |
|
|
|
— |
|
|
|
3,724 |
|
|
|
— |
|
|
|
— |
|
|
|
240,049 |
|
|
|
2/18/2025 |
|
|
— |
|
|
|
— |
|
|
|
— |
|
|
|
— |
|
|
|
— |
|
|
|
— |
|
|
|
— |
|
|
|
10,080 |
|
|
$ |
64.46 |
|
|
|
240,005 |
|
Audrey R. Grimm |
|
|
|
|
— |
|
|
|
497,250 |
|
|
|
994,500 |
|
|
|
— |
|
|
|
— |
|
|
|
— |
|
|
|
— |
|
|
|
— |
|
|
|
— |
|
|
|
|
|
|
2/18/2025 |
|
|
— |
|
|
|
— |
|
|
|
— |
|
|
|
— |
|
|
|
12,101 |
|
|
|
24,202 |
|
|
|
— |
|
|
|
— |
|
|
|
— |
|
|
|
780,030 |
|
|
|
2/18/2025 |
|
|
— |
|
|
|
— |
|
|
|
— |
|
|
|
— |
|
|
|
— |
|
|
|
— |
|
|
|
4,034 |
|
|
|
— |
|
|
|
— |
|
|
|
260,032 |
|
|
|
2/18/2025 |
|
|
— |
|
|
|
— |
|
|
|
— |
|
|
|
— |
|
|
|
— |
|
|
|
— |
|
|
|
— |
|
|
|
10,920 |
|
|
$ |
64.46 |
|
|
|
260,005 |
|
Narrative Discussion of Grants of Plan-Based Awards Table
Estimated Future Payouts Under Non-Equity Incentive Plan Awards
Amounts shown in this column of the table above represent PRP award opportunities for 2025 under the OIP. A target PRP award is established for each NEO at the beginning of the relevant fiscal year based on a percentage of the NEO’s base salary. To the extent that the Corteva Committee approves changes to a NEO’s base salary or the PRP target (as a percentage of base salary) during a fiscal year, the PRP is designed such that the base salary and PRP target as a percentage of base salary in effect at the end of the fiscal year are assumed to have been in effect for the entire fiscal year. The Corteva Committee (and, in the case of the Corteva CEO, the Corteva board) approved the PRP targets for its NEOs in February 2025 as shown above. The actual PRP payout for NEOs, which can range from 0% to 200% of target, is based on corporate financial performance and modified for sustainability performance as applicable. Refer to “Compensation Discussion and Analysis” for more details.
Estimated Future Payouts Under Equity Incentive Plan Awards
Amounts shown in this column of the table above represent the potential payout range of Corteva PSUs granted in 2025. Vesting was based upon performance against RONA and Cumulative Operating EPS growth targets applicable to Corteva. At the conclusion of the three-year performance period, the actual award, vested and delivered as Corteva common stock, can range from 0% to 200% of the original grant. Dividend equivalents are applied after the final performance determination only to the extent that the underlying awards vest based upon performance. For a discussion of the impact on Corteva PSUs of any termination, see the section titled “Executive Compensation—Potential Payments Upon Termination or Change in Control.”
Grant Date Fair Value of Stock Options and Stock Awards
Except with respect to PSUs, amounts shown in this column of the table above reflect the grant date fair value of the Corteva equity award computed in accordance with FASB ASC Topic 718. For Corteva PSUs, the grant date fair value is based upon the probable outcome of the performance conditions as of the grant date. This amount is consistent with the estimate of aggregate compensation cost to be recognized over the service period determined as of the grant date under FASB ASC Topic 718, excluding the effect of estimated forfeitures.
Outstanding Equity Awards
The following table lists outstanding equity grants for each Vylor NEO as of December 31, 2025, including outstanding equity grants made in previous years.
|
|
|
|
|
|
|
|
|
|
|
|
|
|
|
|
|
|
|
|
|
|
|
|
|
|
|
|
|
|
|
|
|
|
|
|
|
Option Awards |
|
Stock Awards |
|
Name |
|
Grant
Date |
|
Number of
Securities
Underlying
Unexercised
Options (#)
Exercisable(a) |
|
|
Number of
Securities
Underlying
Unexercised
Options (#)
Unexercisable(a) |
|
|
Option
Exercise
Price
($) |
|
|
Option
Expiration
Date |
|
Number of
Shares or
Units of
Stock That
Have Not
Vested (#)(b) |
|
|
Market
Value of
Shares or
Units of
Stock That
Have Not
Vested ($)(b)(c) |
|
|
Equity
Incentive
Plan Awards:
Number of
Unearned
Shares, Units
or Other
Rights That
Have Not
Vested (#)(d) |
|
|
Equity
Incentive
Plan Awards:
Market or
Payout Value
of Unearned
Shares, Units
or Other
Rights That
Have Not
Vested ($)(c)(d) |
|
Charles V. Magro |
|
2/18/2022 |
|
|
129,311 |
|
|
|
— |
|
|
|
50.70 |
|
|
2/18/2032 |
|
|
— |
|
|
|
— |
|
|
|
— |
|
|
|
— |
|
|
|
2/28/2023 |
|
|
63,803 |
|
|
|
31,902 |
|
|
|
62.29 |
|
|
2/28/2033 |
|
|
11,349 |
|
|
|
760,706 |
|
|
|
— |
|
|
|
— |
|
|
|
2/20/2024 |
|
|
38,986 |
|
|
|
77,974 |
|
|
|
54.36 |
|
|
2/20/2034 |
|
|
27,586 |
|
|
|
1,849,073 |
|
|
|
121,413 |
|
|
|
8,138,313 |
|
|
|
2/18/2025 |
|
|
— |
|
|
|
97,859 |
|
|
|
64.46 |
|
|
2/18/2035 |
|
|
36,523 |
|
|
|
2,448,116 |
|
|
|
108,440 |
|
|
|
7,268,733 |
|
David P. Johnson |
|
9/16/2024 |
|
|
7,868 |
|
|
|
15,738 |
|
|
|
56.27 |
|
|
9/16/2034 |
|
|
38,898 |
|
|
|
2,607,332 |
|
|
|
23,459 |
|
|
|
1,572,457 |
|
|
|
2/18/2025 |
|
|
— |
|
|
|
18,480 |
|
|
|
64.46 |
|
|
2/18/2035 |
|
|
6,897 |
|
|
|
462,302 |
|
|
|
20,478 |
|
|
|
1,372,640 |
|
Samuel R. Eathington, Ph.D. |
|
2/26/2021 |
|
|
24,829 |
|
|
|
— |
|
|
|
45.15 |
|
|
2/25/2031 |
|
|
— |
|
|
|
— |
|
|
|
— |
|
|
|
— |
|
|
|
2/18/2022 |
|
|
18,679 |
|
|
|
— |
|
|
|
50.70 |
|
|
2/18/2032 |
|
|
— |
|
|
|
— |
|
|
|
— |
|
|
|
— |
|
|
|
2/28/2023 |
|
|
8,714 |
|
|
|
4,358 |
|
|
|
62.29 |
|
|
2/28/2033 |
|
|
1,551 |
|
|
|
103,960 |
|
|
|
— |
|
|
|
— |
|
|
|
2/20/2024 |
|
|
5,316 |
|
|
|
10,633 |
|
|
|
54.36 |
|
|
2/20/2034 |
|
|
3,763 |
|
|
|
252,214 |
|
|
|
16,557 |
|
|
|
1,109,816 |
|
|
|
2/18/2025 |
|
|
— |
|
|
|
13,860 |
|
|
|
64.46 |
|
|
2/18/2035 |
|
|
5,173 |
|
|
|
346,761 |
|
|
|
15,359 |
|
|
|
1,029,514 |
|
Judd M. O’Connor |
|
2/26/2021 |
|
|
20,548 |
|
|
|
— |
|
|
|
45.15 |
|
|
2/25/2031 |
|
|
— |
|
|
|
— |
|
|
|
— |
|
|
|
— |
|
|
|
2/18/2022 |
|
|
8,621 |
|
|
|
— |
|
|
|
50.70 |
|
|
2/18/2032 |
|
|
— |
|
|
|
— |
|
|
|
— |
|
|
|
— |
|
|
|
2/28/2023 |
|
|
3,735 |
|
|
|
1,868 |
|
|
|
62.29 |
|
|
2/28/2033 |
|
|
665 |
|
|
|
44,564 |
|
|
|
— |
|
|
|
— |
|
|
|
2/20/2024 |
|
|
2,481 |
|
|
|
4,962 |
|
|
|
54.36 |
|
|
2/20/2034 |
|
|
1,756 |
|
|
|
117,709 |
|
|
|
7,727 |
|
|
|
517,941 |
|
|
|
2/18/2025 |
|
|
— |
|
|
|
10,080 |
|
|
|
64.46 |
|
|
2/18/2035 |
|
|
3,763 |
|
|
|
252,214 |
|
|
|
11,170 |
|
|
|
748,725 |
|
Audrey R. Grimm |
|
2/15/2018 |
|
|
666 |
|
|
|
— |
|
|
|
41.94 |
|
|
2/15/2028 |
|
|
— |
|
|
|
— |
|
|
|
— |
|
|
|
— |
|
|
|
2/18/2022 |
|
|
1,437 |
|
|
|
— |
|
|
|
50.70 |
|
|
2/18/2032 |
|
|
— |
|
|
|
— |
|
|
|
— |
|
|
|
— |
|
|
|
4/4/2022 |
|
|
5,754 |
|
|
|
— |
|
|
|
58.67 |
|
|
4/4/2032 |
|
|
— |
|
|
|
— |
|
|
|
— |
|
|
|
— |
|
|
|
2/28/2023 |
|
|
5,446 |
|
|
|
2,724 |
|
|
|
62.29 |
|
|
2/28/2033 |
|
|
969 |
|
|
|
64,950 |
|
|
|
— |
|
|
|
— |
|
|
|
2/20/2024 |
|
|
3,721 |
|
|
|
7,444 |
|
|
|
54.36 |
|
|
2/20/2034 |
|
|
2,633 |
|
|
|
176,496 |
|
|
|
11,590 |
|
|
|
776,878 |
|
|
|
2/18/2025 |
|
|
— |
|
|
|
10,920 |
|
|
|
64.46 |
|
|
2/18/2035 |
|
|
4,076 |
|
|
|
273,209 |
|
|
|
12,101 |
|
|
|
811,130 |
|
(a)Stock option awards vest in three equal installments on the first, second and third anniversaries of the grant date.
(b)RSUs granted under the OIP generally vest in three equal installments on the first, second and third anniversaries of the grant date shown in the table.
(c)Market values based on the December 31, 2025, closing stock price of $67.03 per share of Corteva common stock.
(d)These PSUs reflect the number of shares deliverable at target performance. The actual number of shares to be delivered will be determined at the end of the respective performance period (December 31, 2026 or December 31, 2027, respectively).
Option Exercises and Stock Vested
The following table summarizes the value received from stock option exercises and stock grants vested during 2025. All shares reported are Corteva shares.
|
|
|
|
|
|
|
|
|
|
|
|
|
|
|
|
|
|
|
Option Awards |
|
|
Stock Awards |
|
Name |
|
Number of
Shares
Acquired
on Exercise
(#) |
|
|
Value
Realized
Upon
Exercise
($) |
|
|
Number of
Shares
Acquired on
Vesting
(#) |
|
|
Value
Realized
Upon
Vesting
($) |
|
Charles V. Magro |
|
|
— |
|
|
|
— |
|
|
|
95,642 |
|
|
|
6,639,642 |
|
David P. Johnson |
|
|
— |
|
|
|
— |
|
|
|
19,396 |
|
|
|
1,355,410 |
|
Samuel R. Eathington, Ph.D. |
|
|
— |
|
|
|
— |
|
|
|
13,156 |
|
|
|
912,828 |
|
Judd M. O’Connor |
|
|
— |
|
|
|
— |
|
|
|
5,768 |
|
|
|
399,526 |
|
Audrey R. Grimm |
|
|
— |
|
|
|
— |
|
|
|
8,121 |
|
|
|
558,774 |
|
Pension Benefits
The following table lists the pension program participation and actuarial present value of the defined benefit pension provided by Corteva as of December 31, 2025 for Mr. O’Connor, who is the only NEO eligible and participating in its defined benefit pension plans.
|
|
|
|
|
|
|
|
|
|
|
Name |
|
Plan Name |
|
Number of
Years Credited
Service
(#) |
|
|
Present Value
of Accumulated
Benefit
($) |
|
Judd M. O’Connor |
|
Pension and Retirement Plan |
|
|
20.0 |
|
|
|
457,609 |
|
|
|
Pioneer Hi-Bred International, Inc. GAP Retirement Plan |
|
|
20.0 |
|
|
|
520,772 |
|
Narrative Discussion of Pension Benefits
The Pension and Retirement Plan
Mr. O’Connor participates in the Pension and Retirement Plan (the “Pension Plan”), a Corteva tax-qualified defined benefit pension plan that generally covers a majority of those of Corteva's U.S. employees who were employees of historical DuPont prior to its separation from DowDuPont, Inc., except those hired or rehired by historical DuPont after December 31, 2006. The Pension Plan currently provides employees with a lifetime retirement income based on years of service and the employees’ final average pay near retirement. On November 30, 2018 (the “Effective Date”), Corteva froze the pay and service amounts used to calculate pension benefits for then-active employees who were participants in the Pension Plan.
The normal form of benefit for married individuals is a 50% qualified joint and survivor annuity. The normal form of benefit for unmarried individuals is a single life annuity, which is actuarially equivalent to the normal form for married individuals. Normal retirement age under the Pension Plan is generally age 65, and benefits are vested after five years of service.
Mr. O’Connor participates in Title IV of the Pension Plan. Under the provisions of Title IV of the Pension Plan, employees are eligible for unreduced pensions when they reach normal retirement age of age 65 or older with at least five years of service. An employee who is not eligible for retirement with an unreduced pension is eligible for retirement with a reduced pension if he or she is at least age 55 with at least five years of service. For participants with less than 30 years of service at retirement, the pension is reduced by 1/180 for each of the first 60 months prior to normal retirement age and reduced by 1/360 for each of the next 60 months that precede normal retirement age. For participants with 30 or more years of service at retirement, the pension is reduced by 1/400 for each month prior to normal retirement age. Title IV of the Pension Plan closed to new participants on January 1, 2012.
The primary pension formula under Title IV of the Pension Plan provides a monthly retirement benefit equal to:
|
|
|
|
|
|
|
|
|
|
|
|
|
|
|
|
|
|
|
|
|
|
|
|
|
|
|
|
|
|
|
|
|
|
|
|
|
|
|
|
|
|
|
|
|
|
|
|
|
|
|
|
|
|
|
|
|
|
|
|
|
|
( |
|
1.10% of Final
Average Earnings up
to Integration Level |
|
+ |
|
1.47% of Final Average
Earnings in excess of
Integration Level |
|
) |
|
× |
|
Years of Credited
Service Projected to
Normal Retirement
Date, up to 35 years |
|
|
|
× |
|
|
|
Years of Credited
Service Through
12/31/2011 |
|
|
|
|
|
|
|
|
|
|
|
+ |
|
|
|
|
|
|
|
|
|
|
|
|
|
÷ |
|
|
|
|
|
|
|
1.00% of Final Average Earnings |
|
|
|
× |
|
Years of Credited
Service Projected to
Normal Retirement
Date, in excess of 35
years, if any |
|
|
|
Total Years of
Credited Service at
Normal Retirement
Date |
|
|
|
|
|
|
|
|
|
|
|
|
|
|
|
|
|
|
|
|
|
|
|
|
|
|
|
|
|
|
|
|
|
|
|
PLUS |
|
|
|
|
|
|
|
|
|
|
|
|
|
|
|
|
|
|
|
|
|
|
|
|
|
|
|
|
|
|
|
|
|
|
|
|
|
|
|
( |
|
0.55% of Final
Average Earnings up
to Integration Level |
|
+ |
|
0.735% of Final
Average Earnings in
excess of Integration
Level |
|
) |
|
× |
|
Years of Credited
Service Projected to
Normal Retirement
Date, up to 35 years |
|
|
|
× |
|
|
|
Years of Credited
Service From
01/01/2012 Through
the Effective Date |
|
|
|
|
|
|
|
|
|
|
+ |
|
|
|
|
|
|
|
|
|
|
|
÷ |
|
|
|
|
|
|
0.50% of Final Average Earnings |
|
|
|
× |
|
Years of Credited
Service Projected to
Normal Retirement
Date, in excess of 35
years, if any |
|
|
|
Total Years of
Credited Service at
Normal Retirement
Date |
|
|
|
|
|
|
|
|
|
|
|
|
|
|
|
|
|
|
|
|
|
|
|
|
|
|
|
|
|
|
|
Final Average Earnings are based on the employee’s 60 highest consecutive months of earnings out of the last 120 months prior to the earlier of termination of employment or the Effective Date. Compensation includes regular compensation plus the PRP award. Integration Level is in accordance with IRC guidance but in no event will it increase after the Effective Date.
For the purpose of unreduced pension, employees’ age, and service post-Effective Date until termination of employment, will be counted in determining the retirement eligibility. Mr. O’Connor is eligible for a reduced pension.
The Pioneer Hi-Bred International Inc. GAP Retirement Plan
If benefits provided under the Pension Plan exceed the applicable IRC compensation or benefit limits, the excess benefit for Title IV of the Pension Plan is paid under the Pioneer Hi-Bred International Inc. GAP Retirement Plan (the “Pioneer GAP Plan”), an unfunded non-qualified plan. The form of benefit under the Pioneer GAP Plan for Mr. O’Connor would be a single life annuity. The mortality tables and interest rates used to determine lump sum payments are the Applicable Mortality Table and the Applicable Interest Rate prescribed by the Secretary of the Treasury in IRC Section 417(e)(3).
The company does not grant any extra years of credited service for pension benefit purposes. Key actuarial assumptions for the present value of accumulated benefit calculation can be found in Note 17 (“Pension Plans and Other Post-Employment Benefits”) to the Corteva Consolidated Financial Statements herein. All other assumptions are consistent with those used in Note 17, except that the present value of accumulated benefit uses a retirement age at which the NEO may retire with an unreduced benefit under the Pension Plan. The valuation method used for determining the present value of the accumulated benefit is the traditional unit credit cost method.
Non-qualified Deferred Compensation
The following table provides information on nonqualified deferred compensation of the NEOs during 2025.
|
|
|
|
|
|
|
|
|
|
|
|
|
|
|
|
|
|
|
|
|
Name |
|
Executive
Contributions
in Last Fiscal
Year
($)(1) |
|
|
Company
Contributions
in Last Fiscal
Year
($)(2) |
|
|
Aggregate
Earnings in
Last Fiscal
Year
($) |
|
|
Aggregate
Withdrawals /
Distributions
($) |
|
|
Aggregate
Balance at
Last Fiscal
Year-End
($) |
|
Charles V. Magro |
|
|
163,296 |
|
|
|
238,829 |
|
|
|
75,488 |
|
|
|
— |
|
|
|
1,102,880 |
|
David P. Johnson |
|
|
— |
|
|
|
— |
|
|
|
— |
|
|
|
— |
|
|
|
— |
|
Samuel R. Eathington, Ph.D. |
|
|
229,283 |
|
|
|
76,642 |
|
|
|
157,135 |
|
|
|
— |
|
|
|
1,430,039 |
|
Judd M. O’Connor |
|
|
44,790 |
|
|
|
63,157 |
|
|
|
200,407 |
|
|
|
— |
|
|
|
1,556,186 |
|
Audrey R. Grimm |
|
|
36,024 |
|
|
|
51,765 |
|
|
|
32,897 |
|
|
|
— |
|
|
|
285,862 |
|
(1)Executive contributions are included in salary for 2025 in the Summary Compensation Table.
(2)Corteva’s contributions for 2025 are included in All Other Compensation column of the Summary Compensation Table.
Narrative Discussion of the Nonqualified Deferred Compensation Table
Corteva offers two nonqualified deferred compensation programs under which participants may voluntarily elect to defer some portion of base salary, PRP, or LTI awards until a future date. Deferrals are credited to an account and earnings are calculated thereon in accordance with the applicable investment option or interest rate. With the exception of the Retirement Savings Restoration Plan (“RSRP”), there are no Corteva contributions or matches. The RSRP was adopted to restore Corteva contributions for certain U.S. employees that would be lost due to IRC limits on compensation under Corteva’s tax-qualified savings plan.
The following provides an overview of the various deferral options Corteva provided as of December 31, 2025.
RSRP
Under the RSRP, eligible employees can elect to defer eligible compensation (generally, base salary plus PRP) that exceeds the regulatory limits ($350,000 in 2025) in increments of 1% up to 6%. Corteva matches participant contributions on a dollar-for-dollar basis up to 6% of eligible pay. Corteva also makes an additional contribution of 3% of eligible compensation to participants in the RSRP as of December 31. The additional 3% contribution is made during the first quarter of the following calendar year. Participant investment options under the RSRP mirror the options available under the qualified plan. Distributions may be made in the form of a lump sum or annual installments after separation from service.
Management Deferred Compensation Program (“MDCP”)
Under the MDCP, a NEO can elect to defer the receipt of up to 60% of his base salary and/or PRP award. Corteva does not match deferrals under the MDCP. Participants may select from among seven core investment options under the MDCP, including Corteva common stock units with dividend equivalents credited as additional stock units. In general, distributions may be made in the form of a lump sum at a specified future date prior to separation from service or a lump sum or annual installments after separation from service.
In addition, under the MDCP, a NEO can elect to defer the receipt of 100% of his LTI awards (RSUs and/or PSUs). Corteva does not match LTI deferrals under the MDCP. LTI deferrals under the MDCP are in the form of Corteva common stock units with dividend equivalents credited as additional stock units.
Potential Payments Upon Termination or Change in Control
As described in the Compensation Discussion and Analysis, Corteva maintains a Change in Control and Executive Severance Plan. For a description of the plan, see the section titled “Compensation Discussion and Analysis — Components of Our Executive Compensation Program — Change in Control and Executive Severance Benefits.”
Benefits provided under the plan are highlighted in the table below.
|
|
|
|
|
Benefit Element |
|
Qualifying Termination Associated with a Change in Control |
|
Qualifying Termination NOT Associated with a Change in Control |
Severance benefit |
|
Lump sum cash payment equal to two times (2.99 times for the CEO) the sum of the executive’s base salary and target annual PRP award |
|
Lump sum cash payment equal to one and one-half times (two times for the CEO) the sum of the executive’s base salary and target annual PRP award |
PRP in year of termination |
|
Lump sum cash payment equal to the pro-rated portion of the executive’s target annual PRP award |
|
Lump sum cash payment equal to the pro-rated portion of the executive’s target annual PRP award |
Benefit continuation |
|
Continued health and welfare benefits, financial counseling (as applicable) and outplacement services for two years (2.99 years for the CEO) |
|
Continued health and welfare benefits and outplacement services for one and one-half years (two years for the CEO) |
Equity award treatment |
|
Acceleration of all unvested equity awards, with unexercised stock options remaining exercisable for their full term |
|
Treatment of awards subject to terms and conditions of each specific grant |
Potential payments under the plan are reflected in the table below. The table also includes potential payments under the OIP. The treatment of benefits under each plan on termination or change in control is detailed in the footnotes to the table.
The following information does not quantify payments under plans that are generally available to all salaried employees, similarly situated to the NEOs, including in age, years of service, date of hire, and that do not discriminate in scope, terms, or operation in favor of executive officers. For example, all participating employees who terminated on December 31, 2025, are entitled to receive any PRP awards for the 2025 performance year. See also the Pension Benefits and Nonqualified Deferred Compensation tables and accompanying narrative discussions for benefits or balances, as the case may be, under those plans as of December 31, 2025.
Due to the number of factors that affect the nature and amount of any benefits provided upon the events discussed below, any actual amounts paid or distributed may be different. Factors that could affect those amounts include the timing during the year of any such event, Corteva’s stock price and the executive’s age.
If an individual engages in misconduct, Corteva may demand that he/she repay any long-term or short-term incentive award, or cash payments received as a result of such an award, within 10 days following written demand by Corteva. See the section titled “Compensation Discussion and Analysis — How We Manage Compensation Risk — Compensation Recovery Policy (Clawback)” for further discussion.
For the CEO and other NEOs, the benefits that would become payable upon termination of employment, death, disability, or change in control as of December 31, 2025, are outlined below. The value of Corteva long-term incentives that would accelerate or otherwise continue to vest as a result of the executive’s termination is based in part in reference to Corteva’s closing stock price of $67.03 on December 31, 2025, as reported on the NYSE.
|
|
|
|
|
|
|
|
|
|
|
|
|
|
|
|
|
|
|
Name |
|
Benefit |
|
Termination
without Cause
or for Good
Reason 24
months following
a Change in
Control
($) |
|
|
Other
Termination
without Cause
of for
Good Reason
($)(1) |
|
|
Death or
Disability
($) |
|
|
Voluntary
Separation
($)(2) |
|
Charles V. Magro |
|
Severance(3) |
|
|
10,465,000 |
|
|
|
7,000,000 |
|
|
|
— |
|
|
|
— |
|
|
|
LTI Acceleration / Vesting(4) |
|
|
21,855,585 |
|
|
|
11,078,769 |
|
|
|
14,296,992 |
|
|
|
— |
|
|
|
Health & Welfare Benefits(5) |
|
|
88,761 |
|
|
|
59,274 |
|
|
|
— |
|
|
|
— |
|
|
|
Outplacement & Financial Planning(6) |
|
|
9,900 |
|
|
|
9,900 |
|
|
|
— |
|
|
|
— |
|
David P. Johnson |
|
Severance(3) |
|
|
3,000,000 |
|
|
|
2,250,000 |
|
|
|
— |
|
|
|
— |
|
|
|
LTI Acceleration / Vesting(4) |
|
|
6,231,566 |
|
|
|
3,064,117 |
|
|
|
4,792,320 |
|
|
|
— |
|
|
|
Health & Welfare Benefits(5) |
|
|
38,531 |
|
|
|
29,573 |
|
|
|
— |
|
|
|
— |
|
|
|
Outplacement & Financial Planning(6) |
|
|
9,900 |
|
|
|
9,900 |
|
|
|
— |
|
|
|
— |
|
Samuel R. |
|
Severance(3) |
|
|
2,780,000 |
|
|
|
2,085,000 |
|
|
|
— |
|
|
|
— |
|
Eathington, Ph.D. |
|
LTI Acceleration / Vesting(4) |
|
|
3,033,262 |
|
|
|
1,528,531 |
|
|
|
1,976,981 |
|
|
|
— |
|
|
|
Health & Welfare Benefits(5) |
|
|
13,176 |
|
|
|
9,684 |
|
|
|
— |
|
|
|
— |
|
|
|
Outplacement & Financial Planning(6) |
|
|
9,900 |
|
|
|
9,900 |
|
|
|
— |
|
|
|
— |
|
Judd M. O’Connor |
|
Severance(3) |
|
|
2,500,000 |
|
|
|
1,875,000 |
|
|
|
— |
|
|
|
— |
|
|
|
LTI Acceleration / Vesting(4) |
|
|
1,778,782 |
|
|
|
831,249 |
|
|
|
1,106,985 |
|
|
|
831,249 |
|
|
|
Health & Welfare Benefits(5) |
|
|
57,792 |
|
|
|
44,019 |
|
|
|
— |
|
|
|
— |
|
|
|
Outplacement & Financial Planning(6) |
|
|
35,900 |
|
|
|
29,400 |
|
|
|
— |
|
|
|
— |
|
Audrey R. Grimm |
|
Severance(3) |
|
|
2,164,500 |
|
|
|
1,623,375 |
|
|
|
— |
|
|
|
— |
|
|
|
LTI Acceleration / Vesting(4) |
|
|
2,237,954 |
|
|
|
1,101,707 |
|
|
|
1,438,242 |
|
|
|
— |
|
|
|
Health & Welfare Benefits(5) |
|
|
79,274 |
|
|
|
55,131 |
|
|
|
— |
|
|
|
— |
|
|
|
Outplacement & Financial Planning(6) |
|
|
35,900 |
|
|
|
29,400 |
|
|
|
— |
|
|
|
— |
|
(1)Generally represents Corteva-initiated terminations not associated with a Change in Control, but in certain cases may also be applicable to terminations associated with a mutually-agreed retirement.
(2)Per the provisions of Corteva’s OIP and of the terms and conditions of awards granted under the OIP, employees who voluntarily terminate their employment with Corteva after having reached age 55, and who have a minimum of 10 years of service with Corteva, are eligible to continue to vest in all or a portion of the outstanding equity awards they hold at the time of their separation.
(3)Per the provisions of Corteva’s Change in Control and Executive Severance Plan, amounts represent a lump sum payment equal to two times (or, in the case of the CEO, 2.99 times) the sum of an executive’s base salary plus target bonus in the case of a termination with respect to a Change in Control, or one and one-half times (two times, in the case of the CEO) the sum of the base salary plus target bonus in the case of a termination not with respect to a Change in Control. In each case, the plan also calls for a lump sum payment equal to the prorated portion of the executive’s target bonus in the year of termination (prorated for the number of months of service rendered during the year). However, because Corteva’s PRP provides for the payment of any bonus earned by an eligible employee who is an active employee through the last day of the fiscal year, and because the table above assumes the termination of employment occurs on such date, the amount due under the Change in Control and Executive Severance Plan with respect to a prorated bonus in year of termination is not incremental to the PRP, and as such is not included in the amounts above.
(4)In the case of termination with respect to a Change in Control, amounts include the value of all outstanding and unvested stock options, outstanding RSUs and outstanding and unearned PSUs, all of which immediately accelerate and become vested upon termination, with performance for the unearned PSUs deemed achieved at target performance levels. In the case of a termination without Cause or for Good Reason, amounts represent the value of those outstanding and unvested stock options which are scheduled to vest within 12 months of the assumed termination (and which would continue to vest during that period under the terms of the awards), as well as the value of all outstanding RSUs and of a prorated portion of outstanding PSUs, which would be earned at the end of the applicable performance period to the extent that performance metrics are achieved at a minimum of threshold performance levels. In the case of a termination related to Death or Disability, the amounts represent the value of all outstanding and unvested stock options and RSUs, as well as a prorated portion of unearned PSUs. In the case of a Voluntary Separation of employment, the amounts represent the value of those outstanding and unvested stock options which are scheduled to vest within 12 months of the assumed termination (and which would continue to vest during that period under the terms of the awards), the value of all outstanding RSUs and a prorated portion of PSUs. For purposes of the table above, performance of the prorated PSUs is assumed at target.
(5)Amounts represent the cost to Corteva of health and welfare benefits under the Consolidated Omnibus Budget Reconciliation Act (COBRA), the amount of which is payable to the executive for a period of months equal to the length of time implied by the severance multiple. Amount also includes the estimated cost of
participating in the diagnostic executive physical program, but only to the extent that the executive was actively participating in the program at the time of their termination.
(6)Represents the cost of outplacement services, as applicable, provided to executives during the period equal to the length of time implied by the severance multiple, in addition to the annual cost of financial counseling services over the same period, but only to the extent that the executive was actively participating in the financial counseling program at the time of their termination.
CERTAIN RELATIONSHIPS AND RELATED PERSON TRANSACTIONS
We intend to enter into a new related party transaction policy. This section will be populated, in an amendment to the Form 10, to provide information regarding our review and approval of transactions with related persons and restrictions on certain types of transactions.
SECURITY OWNERSHIP OF CERTAIN BENEFICIAL OWNERS AND MANAGEMENT
Before the distribution, all the outstanding shares of Vylor common stock will be owned beneficially and of record by Corteva. The following table sets forth information with respect to the expected beneficial ownership of Vylor common stock by: (1) each person who is expected to beneficially own more than five percent of Vylor common stock, (2) each expected director, director nominee and NEOs and (3) all our expected directors, director nominees and executive officers as a group. Except as noted below, we based the share amounts on each person’s beneficial ownership of Corteva common stock on , 2026, giving effect to a distribution ratio of share[s] of Vylor common stock for every share[s] of Corteva common stock. Immediately following the distribution, we estimate that million of our shares of common stock will be issued and outstanding based on Corteva common stock expected to be outstanding as of the record date. The actual number of our outstanding shares of Vylor common stock following the distribution will be determined on , 2026, the record date.
Security Ownership of Certain Beneficial Owners
Based solely on the information filed on Schedule 13G as of , 2026, reporting beneficial ownership of Corteva common stock, we anticipate the following stockholders will beneficially own more than five percent of Vylor common stock following the distribution.
|
|
|
|
|
|
|
|
Name and Address of Beneficial Owner |
|
Number of Shares
of Corteva
Common Stock |
|
Number of
Shares of Vylor
common stock |
|
Percent of
Shares
Outstanding |
|
|
|
|
|
|
|
|
|
|
|
|
|
|
|
|
|
|
|
|
|
|
|
|
|
Security Ownership of Directors and Executive Officers
The following table provides information regarding beneficial ownership of our NEOs, our expected directors, director nominees and all our expected directors, director nominees and executive officers as a group.
|
|
|
|
|
|
|
|
|
|
|
Name and Address of Beneficial Owner |
|
Number of
Shares of
Corteva
Common Stock |
|
Right to
Acquire
Beneficial
Ownership of
Corteva
Shares |
|
Corteva
Beneficial
Ownership
Total |
|
Number of
Shares of
Vylor
Common stock |
|
Percent of
Vylor Shares
Outstanding |
|
|
|
|
|
|
|
|
|
|
|
|
|
|
|
|
|
|
|
|
|
|
* Less than one percent of the total Vylor shares expected to be issued and outstanding.
.
OUR RELATIONSHIP WITH NEW CORTEVA FOLLOWING THE SPIN-OFF
Following the spin-off, we and Corteva (which we refer to, after the spin-off, as New Corteva) will operate separately, each as an independent, publicly traded company. To effect the spin-off and govern our ongoing relationship with New Corteva thereafter, we intend to enter into certain agreements with Corteva that will, among other matters, provide for the allocation between us and New Corteva of Corteva’s assets, employees, liabilities and obligations (including investments, property, employee benefits, intellectual property and tax-related assets and liabilities), and provide a framework for our relationship with New Corteva following the spin-off. The following is a summary of the material terms of certain of these agreements.
The terms of the agreements described below that will be in effect immediately prior to, or following, the spin-off have not yet been finalized; changes to these agreements, some of which may be material, may be made prior to the spin-off. Following the spin-off, however, no changes to such agreements may be made without the mutual agreement of New Corteva and Vylor.
Separation and Distribution Agreement
Prior to the distribution, we intend to enter into a separation and distribution agreement with Corteva (which we refer to, after the spin-off, as New Corteva) and, solely for the purpose of effectuating certain spin-off transactions, EIDP (the “Separation and Distribution Agreement”). The Separation and Distribution Agreement will set forth our agreements with New Corteva regarding the principal actions to be taken in connection with the spin-off, including those related to the internal reorganization. It will also set forth other agreements that will govern certain aspects of our relationship with New Corteva following the distribution. This summary of the Separation and Distribution Agreement is qualified in its entirety by reference to the full text of the agreement, the form of which is incorporated by reference herein and is to be filed as Exhibit to the Form 10 of which this information statement forms a part.
Transfer of Assets and Allocation of Liabilities. The Separation and Distribution Agreement will identify the assets and liabilities to be contractually allocated to each of us and New Corteva as part of the spin-off. We note, however, that (x) the contractual allocation of employee-related liabilities (including pension liabilities) and related assets is set forth in the Employee Matters Agreement (see the section below entitled “–Employee Matters Agreement” for a summary of such allocation) and (y) the contractual allocation of tax liabilities and assets is set forth in the Tax Matters Agreement (see the section below entitled “–Tax Matters Agreement” for a summary of such allocation). In particular, the Separation and Distribution Agreement will provide that, among other things, subject to the terms and conditions contained in the Separation and Distribution Agreement:
Assets
•Generally, assets to the extent primarily related to the Seed Business will be contractually allocated to us, and assets to the extent primarily related to the Crop Protection Business will be contractually allocated to New Corteva.
•Generally, any asset that is not related to either the Seed Business or the Crop Protection Business (other than in a de minimis respect) will be retained by the owner or holder of such asset immediately prior to the distribution.
•We and New Corteva will each be contractually allocated the equity interests of the subsidiaries that are intended to be our or New Corteva’s respective subsidiaries following the distribution.
•Generally, New Corteva will be contractually allocated the Prior Transaction Agreements (as defined below), and we will be contractually allocated all third-party beneficiary rights held by us or our subsidiaries under such agreements following the distribution.
•We and New Corteva will each be contractually allocated certain specified intellectual property that is related to the Seed Business or the Crop Protection Business, respectively, as well as joint interests in certain other specified intellectual property.
•We and New Corteva will each be contractually allocated accruals, counterclaims, insurance claims, rights to coverage under applicable insurance policies, warranties, contractual indemnities, control rights and other similar rights, in each case, to the extent related to any of our or New Corteva’s liabilities, respectively.
•We will be contractually allocated certain specified information technology assets and all information technology assets that are primarily related to the Seed Business (subject to certain limited exceptions), and New Corteva will be contractually allocated certain specified information technology assets and all information technology assets that are not primarily related to the Seed Business (subject to certain limited exceptions).
•We and New Corteva will each be contractually allocated all information, content and data exclusively related to the Seed Business or Crop Protection Business, as applicable, and all information, content and data to the extent related to our or New Corteva’s respective assets or liabilities.
•We and New Corteva will each be contractually allocated all of the cash, cash equivalents and other financial assets owned by it or its subsidiaries.
•We and New Corteva will each be allocated all accounts and notes receivable to the extent related to the Seed Business or the Crop Protection Business, respectively, subject to certain de minimis exceptions.
•We and New Corteva will each be allocated all credits, prepaid expenses, rebates, deferred charges, advance payments, security deposits and prepaid items, in each case, to the extent used, held for use in, or arising out of the Seed Business or the Crop Protection Business, respectively.
•We and New Corteva will each be contractually allocated certain specified corporate or enterprise-wide assets that are not related to either company’s business (other than in a de minimis respect).
•In addition, we and New Corteva will each be contractually allocated certain specified assets set forth on schedules to the Separation and Distribution Agreement.
Liabilities
•Generally, liabilities to the extent primarily related to the Seed Business will be contractually allocated to us, and liabilities to the extent primarily related to the Crop Protection Business will be contractually allocated to New Corteva.
•We and New Corteva will generally each be contractually allocated, based on the Applicable Percentage, any liabilities (including under applicable federal and state securities laws) relating to (i) any disclosure document filed or furnished with the SEC in connection with the distribution (including the Form 10 of which this information statement forms a part) and (ii) any prospectus, offering memorandum, offering circular or similar disclosure document, whether or not filed with the SEC, which offers for sale or registration of the transfer or distribution of securities or indebtedness of Vylor in connection with the Vylor financing arrangements.
•We will be contractually allocated all liabilities relating to the Vylor financing arrangements (other than any liabilities described in the preceding bullet).
•We and New Corteva will each be contractually allocated, based on the Applicable Percentage, certain out-of-pocket costs and expenses related to the spin-off transactions incurred by us, New Corteva or any of our respective subsidiaries, other than certain specified out-of-pocket costs and expenses related to the spin-off transactions incurred by us, New Corteva or any of our respective subsidiaries, which will be contractually allocated to us or New Corteva, as applicable.
•New Corteva will retain certain liabilities to the extent Corteva is responsible under the Prior Transaction Agreements, including obligations relating to historical PFAS and other environmental liabilities associated with legacy EIDP businesses, other than any such liabilities that are primarily related to the Seed Business, which will be contractually allocated to us.
•Liabilities related to businesses and operations of Corteva (or any of its predecessors) that were previously discontinued or divested will be contractually allocated between us and New Corteva as set forth on the schedules to the Separation and Distribution Agreement (with each of us and New Corteva retaining or being allocated our and its applicable liabilities) and if not set forth on the schedule, such liabilities that, at the time of such discontinuance or divestment, were primarily related to the Seed Business will be contractually allocated to us, and such liabilities that, at the time of such discontinuance or divestment, primarily related to the Crop Protection Business will be contractually allocated to New Corteva. To the extent any liability related to businesses and operations of Corteva (or any of its predecessors) that were previously discontinued or divested is not set forth on a schedule to the Separation and Distribution Agreement and, at the time of such discontinuance or divestment, was not primarily related to either the Seed Business or the Crop Protection Business, such liability will be contractually allocated to us or New Corteva based on the Applicable Percentage.
•We and New Corteva will each be contractually allocated certain environmental liabilities (i) to the extent relating to (x) the Seed Business or the Crop Protection Business, respectively, (y) the operations and activities of such company and (z) the ownership, leasing or occupancy of such company’s real property, and (ii) based on the Applicable Percentage, to the extent relating to occurrences prior to the spin-off and relating to (x) certain real property that is shared by the companies and owned by a third party or (y) the operations and activities at such shared property.
•We will be allocated liabilities for borrowed money that were incurred or guaranteed by us or our subsidiaries, and New Corteva will be allocated liabilities for borrowed money that were incurred or guaranteed by New Corteva or its subsidiaries (including EIDP).
•We and New Corteva will each be allocated all accounts payable to the extent related to the Seed Business or the Crop Protection Business, respectively, subject to certain de minimis exceptions.
•We and New Corteva will each be contractually allocated, based on the Applicable Percentage, certain general corporate liabilities of Corteva relating to occurrences on or prior to the spin-off, including liabilities of Corteva related to (i) claims made by or on behalf of holders of any of Corteva’s securities, (ii) Corteva’s filings with the SEC, (iii) any prospectus, offering memorandum, offering circular or similar disclosure document, whether or not filed with the SEC, which offers for sale or registration of the transfer or distribution of securities or indebtedness of Corteva, (iv) Corteva’s maintenance of the books and records, corporate compliance and other corporate-level actions and oversight and (v) subject to certain exceptions, indemnification obligations to, and claims for breaches of fiduciary duties brought against, any current or former director or officer of Corteva.
•In addition, we and New Corteva will each be contractually allocated certain specified liabilities set forth on schedules to the Separation and Distribution Agreement.
Except as may expressly be set forth in the Separation and Distribution Agreement or any ancillary agreement, all assets will be transferred on an “as is”, “where is” basis and the respective transferees will bear the economic and legal risks that (i) any conveyance will prove to be insufficient to vest in the transferee good title, free and clear of any security interest, and (ii) any necessary consents or governmental approvals are not obtained or that any requirements of laws or judgments are not complied with. In general, neither we nor New Corteva will make any representations or warranties regarding any assets or liabilities transferred or contractually allocated pursuant to the Separation and Distribution Agreement, any consents or governmental approvals that may be required in connection with such transfers or contractual allocations, or any other matters.
Information in this information statement with respect to the assets and liabilities of Vylor and New Corteva following the spin-off is presented based on the contractual allocation of such assets and liabilities pursuant to the Separation and Distribution Agreement, unless the context otherwise requires. Certain of the liabilities and obligations contractually allocated to one party or for which one party will have an indemnification obligation under the Separation and Distribution Agreement and the other agreements relating to the spin-off are, and following the spin-off may continue to be, the legal or contractual liabilities or obligations of another party. Each such party that continues to be subject to such legal or contractual liability or obligation will rely on the applicable party that was contractually allocated the liability or obligation or the applicable party that undertook an indemnification obligation with respect to the liability or obligation, as applicable, under the Separation and Distribution Agreement, to satisfy the performance and payment obligations or indemnification obligations with respect to such legal or contractual liability or obligation.
Further Assurances. To the extent that any transfers of assets or contractual allocations of liabilities contemplated by the Separation and Distribution Agreement have not been consummated on or prior to the distribution, we and New Corteva will agree to cooperate with each other to effect such transfers or allocations while holding such assets or liabilities for the benefit of the appropriate party so that all the benefits and burdens relating to such asset or liability inure to the party contractually allocated such asset or liability. We and New Corteva will each agree to use commercially reasonable efforts to take or to cause to be taken all actions, and to do, or to cause to be done, all things reasonably necessary under applicable law or contractual obligations to consummate and make effective the transactions contemplated by the Separation and Distribution Agreement.
The Distribution. The Separation and Distribution Agreement will govern the rights and obligations of the parties regarding the distribution and certain actions that must occur prior to the distribution.
Corteva will cause the distribution agent to distribute to holders of record of Corteva common stock as of the record date all of the then issued and outstanding shares of Vylor common stock. Corteva will have the sole and absolute discretion to determine the terms of, and whether to proceed with, the distribution and, to the extent it determines to so proceed, to determine the distribution date.
Conditions to the Distribution. The Separation and Distribution Agreement will provide that the distribution is subject to several conditions that must be satisfied or waived by the Corteva board of directors in its sole discretion. For further information regarding these conditions, see the section entitled “The Spin-Off–Conditions to the Distribution”.
Shared Contracts. Generally, shared contracts will be assigned in part if so assignable, or amended, bifurcated, replicated or otherwise modified to facilitate the spin-off so that we or New Corteva, as applicable, is allocated the rights, benefits and the related portion of any liabilities inuring to the Seed Business or the Crop Protection Business, respectively, and we and New Corteva will each use commercially reasonable efforts to obtain the consents required to partially assign, amend, bifurcate, replicate or otherwise modify any shared contract.
Non-Compete. For a period of twelve months following the date of the distribution, we and New Corteva will each be prohibited from directly or indirectly owning, managing, operating or engaging in the business of developing, designing, manufacturing, marketing, distributing or selling any product for use in the other company’s specified fields of use, subject to certain exceptions. As further described in the Separation and Distribution Agreement, our specified fields of use will include animal nutrition, biofuels and plant
genetics, and New Corteva’s specified fields of use will include animal health, biologicals, crop protection, industrial biosciences and seed applied technologies. Neither we nor New Corteva will be prohibited from, among other things, (i) acquiring or investing in any company if less than 15% of such company’s revenues, assets and income are derived from the restricted activities (subject to certain restrictions on the integration of businesses) and (ii) acquiring passive ownership of 5% or less of the outstanding equity securities of any company engaged in the restricted activities. The non-competition provisions further provide that, under certain circumstances, third parties acquiring us or New Corteva may become subject to the non-competition obligations to the same extent they apply prior to such acquisition.
Prior Transaction Agreements. The Separation and Distribution Agreement will provide that, subject to certain specified exceptions, Corteva is not required to assign or use any level of efforts to attempt to assign or otherwise transfer any agreement related to (i) the separation of DowDuPont’s material science business into a separate and independent public company by way of a distribution of Dow Inc. through a pro rata dividend in-kind of all of the then issued and outstanding shares of Dow Inc.’s common stock on April 1, 2019 and (ii) the separation of DowDuPont’s agriculture business into a separate and independent public company by way of a distribution of Corteva through a pro rata dividend in-kind of all of the then issued and outstanding shares of Corteva’s common stock on June 1, 2019 (such agreements, the “Prior Transaction Agreements”). The Separation and Distribution Agreement will further provide that, following the distribution, with respect to certain Prior Transaction Agreements, unless the benefits of such Prior Transaction Agreements are conveyed by an ancillary agreement, and subject to certain exceptions, New Corteva will, at New Corteva’s election, either (A) enforce at our request (or will cause its applicable subsidiary to enforce) or (B) allow us or our applicable subsidiaries to enforce in a commercially reasonable manner, any and all rights of New Corteva or any of its subsidiaries (after giving effect to the spin-off) under certain applicable Prior Transaction Agreements, to the extent related to the Seed Business or the assets or liabilities transferred or contractually allocated to us pursuant to the Separation and Distribution Agreement. We will (x) directly bear the out of pocket costs and expenses of such enforcement to the extent related to the rights being enforced for the benefit of Vylor and its subsidiaries, (y) indemnify New Corteva against any indemnifiable losses arising out of such enforcement to the extent related to the rights being enforced for the benefit of Vylor and its subsidiaries and (z) for the avoidance of doubt, be entitled to any recovery to the extent (1) related to the Seed Business or the assets or liabilities allocated to us pursuant to the Separation and Distribution Agreement and (2) related to, arising out of or resulting from such enforcement.
The Separation and Distribution Agreement further requires that we will, or will cause our applicable subsidiary to, pay, perform and discharge fully all of the obligations and liabilities of New Corteva, Vylor or any of New Corteva’s or our respective subsidiaries under the Prior Transaction Agreements to the extent constituting a liability contractually allocated to us pursuant to the Separation and Distribution Agreement and will otherwise use commercially reasonable efforts to pay, perform and discharge such obligations and liabilities related to the Seed Business or an asset or any obligation contractually allocated to Vylor pursuant to the Separation and Distribution Agreement that New Corteva is obligated to cause its affiliates to perform as if it were a party thereto. To the extent any such performance by Vylor is not permitted by any applicable counterparty, and subject to any separate arrangement reached in any ancillary agreement, New Corteva will continue to pay, perform and discharge fully all such obligations in coordination with us and at our direction, and any and all costs, expenses and liabilities incurred by New Corteva or its affiliates in connection with the performance by New Corteva or its affiliates of its obligations will be borne solely by us.
Intercompany Accounts. The Separation and Distribution Agreement will provide that, subject to certain specified exceptions in the Separation and Distribution Agreement, schedules or any ancillary agreement, certain accounts that were formerly intercompany accounts within Corteva will be settled prior to the distribution.
Release of Claims and Indemnification. Except as otherwise provided in the Separation and Distribution Agreement, we and New Corteva will each release and forever discharge the other company and its subsidiaries and affiliates from all liabilities existing or arising from any acts or events occurring or failing to occur or alleged to have occurred or to have failed to occur or any conditions existing or alleged to have existed on or before the spin-off. The releases will not extend to obligations or liabilities under any agreements between the parties that remain in effect following the spin-off pursuant to the Separation and Distribution Agreement or any ancillary agreement. These releases will be subject to certain exceptions set forth in the Separation and Distribution Agreement.
The Separation and Distribution Agreement will provide for cross-indemnities that, except as otherwise provided in the Separation and Distribution Agreement, are principally designed to place financial responsibility for the obligations and liabilities contractually allocated to us under the Separation and Distribution Agreement with us and financial responsibility for the obligations and liabilities contractually allocated to New Corteva under the Separation and Distribution Agreement with New Corteva. Specifically, we and New Corteva will each indemnify, defend and hold harmless the other company, its affiliates and subsidiaries and each of their respective officers, directors, employees and agents for any losses to the extent relating to, arising out of or resulting from:
•the liabilities we or New Corteva, as applicable, will be contractually allocated pursuant to the Separation and Distribution Agreement (or any third-party claim that would, if resolved in favor of the claimant, constitute such a liability); and
•any breach by us or New Corteva, as applicable, of any provision of the Separation and Distribution Agreement.
Our and New Corteva’s respective indemnification obligations with respect to such liabilities pursuant to the Separation and Distribution Agreement or such breach will be uncapped; provided that the amount of our or New Corteva’s respective indemnification obligations will be subject to reduction by any insurance proceeds or other third-party proceeds received by the company being indemnified that reduce the amount of the loss. The Separation and Distribution Agreement will also specify procedures with respect to claims subject to indemnification and related matters, including the control provisions with respect to certain historical liabilities allocated to New Corteva under the Prior Transaction Agreements, as described in the section entitled “–Separation and Distribution Agreement–Legal Matters”. Indemnification with respect to taxes is governed by the Tax Matters Agreement.
Legal Matters. Except as otherwise set forth in the Separation and Distribution Agreement or any ancillary agreement, we and New Corteva will be allocated as of the distribution the liability (or a share of the liability) for, and control of, all pending and threatened legal matters related to (x) the Seed Business or Crop Protection Business, as applicable, and (y) the respective liabilities we or New Corteva will be allocated pursuant to the Separation and Distribution Agreement, and will indemnify the other company for its respective indemnifiable losses, if any, arising out of or resulting from such allocated legal matters. We and New Corteva will agree to cooperate in defending any claims against both parties for events that took place prior to or after the distribution.
With respect to certain historical liabilities retained by New Corteva under the Separation and Distribution Agreement, New Corteva will have, on behalf of us and our subsidiaries (and our and their respective past, present and future affiliates), sole and exclusive authority to, among other things, commence, notice, prosecute, manage, control, conduct, administer, handle, defend (or assume the defense of), litigate, arbitrate, mediate, settle, resolve, dispose of, cover or otherwise determine all matters whatsoever (including, as applicable, litigation strategy and choice of legal counsel or other professionals and any amendment, modification or supplement to any contract (including contracts with third parties) related to such liabilities) with respect to any claims related to, arising out of or resulting from any such liabilities.
Vylor Cash Distribution. The Separation and Distribution Agreement provides that, as a condition to the distribution, Vylor will distribute approximately $ to New Corteva, funded by a portion of the proceeds from the Vylor financing arrangements.
Insurance. Following the spin-off, we will generally be responsible for obtaining and maintaining, at our own cost, our own insurance coverage for liabilities for which we are being allocated pursuant to the Separation and Distribution Agreement, although we will continue to have coverage under certain insurance policies issued to Corteva or other entities for certain matters that are related to occurrences prior to the spin-off, subject to the terms, conditions and exclusions of such policies.
Dispute Resolution. Except as otherwise set forth in the Separation and Distribution Agreement, if a dispute arises between us and New Corteva under the Separation and Distribution Agreement, the general counsels of the parties and/or such other executive officers as the parties may designate will negotiate to resolve such dispute for a reasonable period of time. If the parties are unable to resolve the dispute in this manner within 90 days (or 15 days if either party reasonably determines that the dispute would reasonably be expected to cause such party to suffer irreparable harm), then the dispute will be resolved through binding arbitration. If either company files an action in contravention of the arbitration provisions included in the Separation and Distribution Agreement, the other company will be entitled to any costs it may incur in defending such action, including a $25 million fee (subject to an annual adjustment of 5%), and any additional punitive, exemplary, treble or similar damages as may be awardable under applicable law.
Term, Termination and Amendment. Prior to the distribution, the Corteva board of directors has the unilateral right to terminate or modify the terms of the Separation and Distribution Agreement, without the prior written consent of us or the Corteva stockholders. After the distribution, the term of the Separation and Distribution Agreement is indefinite and it may only be terminated or modified with the prior written consent of both New Corteva and us.
Certain Matters Governed by the Separation and Distribution Agreement. Other matters governed by the Separation and Distribution Agreement will include access to financial and other information, confidentiality, access to and provision of records and separation of guarantees and other credit support instruments.
Tax Matters Agreement
Prior to the distribution, we intend to enter into a tax matters agreement with Corteva (which we refer to, after the spin-off, as New Corteva) (the “Tax Matters Agreement”) that will govern the parties’ respective rights, responsibilities and obligations with respect to tax liabilities and assets, the preparation and filing of tax returns, the control of audits and other tax proceedings, and certain restrictions imposed on us to preserve the tax-free status of the spin-off. This summary of the Tax Matters Agreement is qualified in
its entirety by reference to the full text of the agreement, the form of which is incorporated by reference herein and is to be filed as Exhibit to the Form 10 of which this information statement forms a part.
The party allocated any tax liability under the Tax Matters Agreement will generally indemnify the other party for such taxes.
Allocation of Historic Taxes. Under the Tax Matters Agreement, following the distribution, tax liabilities of New Corteva and Vylor will be contractually allocated between New Corteva and Vylor as follows:
•Ordinary Taxes. Taxes other than transfer taxes and taxes on the spin-off (“Ordinary Taxes”) will be allocated to New Corteva to the extent such taxes relate exclusively to the Crop Protection Business, to Vylor to the extent such taxes relate exclusively to the Seed Business, and otherwise to New Corteva and to Vylor, in accordance with each party’s Applicable Percentage. In addition, certain taxes will be specially allocated to New Corteva or Vylor as mutually agreed by the parties.
•Transfer Taxes. Transfer taxes (defined as transfer, sales, use, stamp, value-added and similar taxes incurred in connection with the spin-off transactions) that are paid after the distribution date shall be allocated to New Corteva and to Vylor, in accordance with each party’s Applicable Percentage.
•Transaction Taxes. Vylor or New Corteva will be responsible for transaction taxes (defined as taxes resulting from the failure of any step of the spin-off to qualify for its intended tax treatment) to the extent such transaction taxes would not have been imposed but for: (i) the failure of any of the representations made by such party or members of its group to be true, correct or complete when made; (ii) the breach by such party of any covenant in the Tax Matters Agreement, the Separation and Distribution Agreement or any ancillary agreement; (iii) the application of certain sections of the Code to the distribution by virtue of any acquisition of stock or assets of such party or members of its group, or (iv) any other act or omission by such party or members of its group that it knows or reasonably should have expected could give rise to transaction taxes. If transaction taxes would be allocated to both parties under any of the foregoing circumstances, such taxes shall be allocated in proportion to the relative contribution of each group to the circumstances giving rise to such taxes, subject to certain exceptions. Transaction taxes not otherwise allocated will be allocated to New Corteva and to Vylor, in accordance with each party’s Applicable Percentage.
•Foreign Transaction Taxes. Foreign transaction taxes will be allocated to New Corteva, unless attributable to certain actions by Vylor or its group.
Tax Refunds. All refunds of taxes shall be allocated to New Corteva, to the extent such refunds are of taxes for which New Corteva is responsible under the Tax Matters Agreement, and to Vylor, to the extent such refunds are of taxes for which Vylor is responsible. In addition, certain refunds will be specially allocated to New Corteva or Vylor as mutually agreed by the parties.
Rights and Obligations Pursuant to Prior Tax Matters Agreements. The Tax Matters Agreement will also contractually allocate certain rights to receive payments and obligations to make payments under the amended and restated tax matters agreement, dated as of April 1, 2019, by and among DuPont de Nemours, Inc. (then known as DowDuPont Inc.), Dow Inc. and Corteva Inc. and the tax matters agreement, dated as of June 26, 2015, by and among E.I. du Pont de Nemours and Company and The Chemours Company. Amounts payable or receivable under such agreements will be treated as Ordinary Taxes (or refunds of Ordinary Taxes), for purposes of the Tax Matters Agreement and shall be allocated as described above in “Allocation of Historic Taxes—Ordinary Taxes” and “Allocation of Historic Taxes—Refunds”.
Responsibility for Filing Tax Returns. The Tax Matters Agreement will also assign responsibilities for administrative matters, such as the filing of returns and payment of taxes due. For certain pre-distribution tax returns, the parties assign filing rights in accordance with mutually agreed schedules to the Tax Matters Agreement. For all other tax returns, New Corteva and Vylor shall prepare and file any tax return required to be filed by it or a member of its group under applicable law. To the extent any tax return relates to taxes for which another party may be liable pursuant to the Tax Matters Agreement, the party responsible for the taxes will have review and comment rights and, for returns reflecting liabilities in excess of a stated threshold, consent rights.
The Tax Matters Agreement will require all tax returns for the pre-distribution period to be prepared and filed in a manner consistent with past practices. In addition, no party will be permitted to amend any tax return if doing so would reasonably be expected to obligate the other party to make an indemnity payment, cause the other party to incur additional taxes for which it is not indemnified, or adversely affect a refund or tax attribute to which the other party is entitled, without the prior written consent of the other party.
Preservation of the Tax-Free Status of the Spin-Off. The spin-off is intended to be tax-free to Corteva stockholders for United States federal income tax purposes, except for cash received in lieu of fractional shares. The spin-off is subject to the satisfaction or waiver
by Corteva of certain conditions, including the receipt of the tax opinions of Cravath, Swaine & Moore LLP and Ernst & Young LLP confirming that the distribution and certain transactions entered into in connection with the spin-off generally will be tax-free to Corteva and its stockholders for U.S. federal income tax purposes, except for cash received in lieu of fractional shares. These opinions will rely on the continued validity of certain representations regarding the past and future conduct of Corteva and Vylor’s respective businesses and certain other matters.
Under the Tax Matters Agreement, Vylor will agree to certain covenants that contain restrictions intended to preserve the intended tax treatment of the spin-off. During the time period ending two years after the date of the distribution, these covenants will include specific restrictions (subject to certain exceptions) on Vylor’s ability to: (i) undertake or permit any transaction relating to Vylor stock, including issuances, redemptions or repurchases, other than certain limited permitted issuances and repurchases; (ii) merge, consolidate or liquidate; (iii) enter into any transaction resulting in acquisitions of a certain percentage of our assets, whether by merger or otherwise; (iv) affect the relative voting rights of Vylor stock, whether by amending Vylor’s certificate of incorporation or otherwise; or (v) cease to actively conduct Vylor’s business.
Vylor may take certain actions prohibited by these covenants only if New Corteva consents in writing. New Corteva may not withhold its consent if Vylor has received satisfactory guidance in the form of a ruling from a taxing authority or an unqualified “will” opinion of a tax advisor concluding that the proposed action will not cause the spin-off to fail to qualify for its intended tax treatment. In all other cases, New Corteva’s consent shall be at its sole discretion.
Tax Contests. If a party receives notice of an audit, examination or similar proceeding (each, a “Tax Contest”) relating to taxes for which it expects to be indemnified under the Tax Matters Agreement, it shall promptly notify the other party. Subject to certain exceptions, the party bearing the liability shall have the right to participate in all proceedings with respect to such Tax Contest, and if that party participates in good faith, the other party shall not settle any such Tax Contest without the participating party’s prior written consent. The parties shall have the right to jointly control any Tax Contest that relates to transaction taxes (as defined above in “Allocation of Historic Taxes—Transaction Taxes”), and no party shall compromise or settle any such Tax Contest without the other party’s consent.
Cooperation and Document Retention. The Tax Matters Agreement also provides for cooperation and information sharing with respect to tax matters, including that each party shall retain all tax records until the expiration of the relevant statute of limitations and give each other reasonable access to such records and personnel.
Term and Amendment. The Tax Matters Agreement shall terminate without further action at any time prior to the distribution upon termination of the Separation and Distribution Agreement. If terminated, no party shall have any liability of any kind to the other party or any other person on account of the Tax Matters Agreement. After the distribution, the term of the Tax Matters Agreement is indefinite and any provision may only be amended, supplemented or modified if such change is in writing and signed by the authorized representative of each party.
Employee Matters Agreement
Prior to the distribution, we intend to enter into an employee matters agreement with Corteva (which we refer to, after the spin-off, as New Corteva) (the “Employee Matters Agreement”). The Employee Matters Agreement will allocate certain employee and employee-related liabilities (and attributable assets) to us and New Corteva as part of the spin-off and describe when and how the relevant transfers and assignments occur or will occur. This summary of the Employee Matters Agreement is qualified in its entirety by reference to the full text of the agreement, the form of which is incorporated by reference herein and is to be filed as Exhibit to the Form 10 of which this information statement forms a part. The terms described in this summary are also subject to exceptions with respect to applicable law, applicable labor agreements and certain other situations.
Employees will be allocated to either New Corteva or Vylor and, with certain exceptions, will transfer to their specified employer prior to the distribution date. With certain exceptions, New Corteva and Vylor will offer employment to any employee who is receiving long-term disability benefits from the other company but was allocated to New Corteva or Vylor, as applicable, and returns to work within 12 months following the distribution date.
With certain exceptions, New Corteva and Vylor will generally be contractually allocated liabilities arising out of or in connection with the employment or termination of their respective employees, whether arising before or after the distribution. New Corteva and Vylor will generally retain liabilities relating to their respective former employees; however, liabilities relating to former employees or directors who were U.S.-based at the time of termination of employment or service will be allocated to New Corteva.
Vylor will honor all labor agreements covering its employees in accordance with the terms of those agreements notwithstanding any provisions in the Employee Matters Agreement to the contrary. Vylor will engage in, and cooperate with New Corteva to satisfy, any consultation or information obligations with respect to unions and works councils that may arise under applicable law or labor agreement prior to the distribution date. Vylor will cause its employees to commence participation in its benefit plans, on or prior to the date of the distribution, and will recognize prior years of service.
If New Corteva or Vylor terminates an employee’s employment within 12 months following the distribution and such employee is entitled to severance under the terms of the severance plan then applicable to the employee, the amount of severance will be not less than the cash severance to which the employee would have been entitled under the severance plan applicable to him or her immediately before the distribution (taking into account any service and changes in eligible compensation following the distribution).
New Corteva and Vylor will cooperate in good faith to effect a transfer of all assets and liabilities under the New Corteva U.S. tax-qualified defined contribution plan with respect to Vylor employees. In addition, the Employee Matters Agreement describes the transfer of assets and allocation of liabilities between or in respect of defined benefit pension plans, defined contribution plans and other post-employment pension benefit plans. With respect to defined benefit pension plans, Vylor will be contractually allocated all liabilities with respect to Vylor employees under any U.S. nonqualified defined benefit pension plan and Canadian and Brazilian defined benefit pension plans, New Corteva will generally retain all assets and liabilities relating to any U.S. tax-qualified defined benefit pension plan and all Argentinian pension liabilities, and all other non-U.S. defined benefit plan liabilities will generally remain with the applicable sponsoring entities.
With certain exceptions, the Employee Matters Agreement provides for the equitable adjustment of existing equity incentive compensation awards denominated in the common stock of Corteva to reflect the occurrence of the distribution. Vylor will cause its employees to cease participation in Corteva’s employee stock purchase plan and will adopt its replacement plan on or before the distribution date. For a discussion of the treatment of outstanding equity awards and equity-based compensation, see the section entitled “Executive Compensation–Treatment of Outstanding Equity Awards as of the Distribution Date”.
For a period commencing on the distribution date and ending 12 months following the distribution date, neither New Corteva nor Vylor will solicit for employment (not including through non-targeted public advertisements or job postings) or hire or engage for services any of the other companies’ current employees or the other companies’ former employees during the six months following the applicable termination (but excluding former employees whose employment was involuntarily terminated by the other company).
Intellectual Property Matters Agreement
Prior to the distribution, we intend to enter into an intellectual property matters agreement with Corteva (which we refer to, after the spin-off, as New Corteva) and certain of our and New Corteva’s respective affiliates (the “Intellectual Property Matters Agreement”) that will govern the cross-licensing of certain intellectual property that is not addressed by the other ancillary agreements. This summary of the Intellectual Property Matters Agreement is qualified in its entirety by reference to the full text of the Intellectual Property Matters Agreement, the form of which is incorporated by reference herein and is to be filed as Exhibit to the Form 10 of which this information statement forms a part.
Under the Intellectual Property Matters Agreement, New Corteva and certain New Corteva affiliates will grant to Vylor and certain Vylor affiliates an irrevocable, perpetual, royalty-free, sublicensable (to affiliates, third parties in the ordinary course for the benefit of and in connection with the products and services of the Vylor group, and third parties in connection with the sale or transfer by the Vylor group of any business, product line, or division (solely in connection with such business, product line, or division and its natural extensions or evolutions)), transferable (to affiliates and successors to all or part of the business or assets to which the Intellectual Property Matters Agreement relates), worldwide license to patents and patent applications, know-how, copyrights, software, environmental, health and safety standards and engineering standards controlled by New Corteva as of the spin-off, solely in Vylor’s designated field of operation (consisting of animal nutrition, biofuels and plant genetics). Vylor and certain Vylor affiliates will grant to New Corteva and certain New Corteva affiliates an irrevocable, perpetual, royalty-free, sublicensable (to affiliates, third parties in the ordinary course for the benefit of and in connection with the products and services of the Corteva group, and third parties in connection with the sale or transfer by the Corteva group of any business, product line, or division (solely in connection with such business, product line, or division and its natural extensions or evolutions)), transferable (to affiliates and successors to all or part of the business or assets to which the Intellectual Property Matters Agreement relates), worldwide license to patents and patent applications, know-how, copyrights and software controlled by Vylor as of the spin-off, solely in New Corteva’s designated field of operation (consisting of animal health, biologicals, crop protection, industrial biosciences and seed-applied technologies). Each license excludes certain scheduled intellectual property, intellectual property addressed by the other ancillary agreements and unscheduled patents and patent applications.
Each license will be non-exclusive to the licensee within the licensee’s field of use, except that until five years after the spin-off, the licensor group may not use or license its owned intellectual property that is licensed to the licensee group under the Intellectual Property Matters Agreement in connection with certain third-party collaborations with certain identified third parties in the licensee’s field of use. Each license is subject to third-party contracts existing as of the spin-off that bind the licensor group; the licensee group is responsible for any payments owed by the licensor group to a third party as a result of the grant to or exercise by the licensee group of a license under the Intellectual Property Matters Agreement. If Corteva or Vylor ceases to use a patent or patent application licensed to the other under the Intellectual Property Matters Agreement, the other party will have a right of first refusal to acquire the applicable patent or patent application.
The Intellectual Property Matters Agreement specifies that Corteva and Vylor each own an equal, undivided joint ownership interest in scheduled joint intellectual property. Each of Corteva and Vylor may exploit its interest in joint intellectual property in all fields of use (including the other company’s field of use), except that until five years after the spin-off, neither company may use or license its interest in joint intellectual property in connection with certain third-party collaborations with certain identified third parties in the other company’s field of use. Each of Corteva and Vylor agrees to cooperate on patent prosecution and maintenance relating to joint intellectual property.
Transition Services Agreements
Prior to the distribution, we intend to enter into transition services agreements with New Corteva (the “Transition Services Agreements”) pursuant to which (i) New Corteva will provide certain transitional services to us, and (ii) we will provide certain transitional services to New Corteva. The services that are anticipated to be provided under the Transition Services Agreements include finance support, facilities and office services, information technology services, human resources services, regulatory support and research and development support. The services will be provided for a limited time, generally for an initial term no longer than 24 months following the distribution date, and will be provided for specified fees, which are generally based on the cost of providing the applicable service plus a mutually agreed markup.
This summary of the Transition Services Agreements is qualified in its entirety by reference to the full text of the Transition Services Agreement under which New Corteva will provide transitional services to us, the form of which is incorporated by reference herein and is to be filed as Exhibit to the Form 10 of which this information statement forms a part. The full text of the Transition Services Agreement under which we will provide transitional services to New Corteva will be on substantially similar terms as such form.
Seed Applied Technologies Supply Agreement
Prior to the distribution, we intend to enter into a supply agreement (the “Seed Applied Technologies Supply Agreement”) with New Corteva, pursuant to which New Corteva will be required to sell, and we will be required to exclusively purchase, certain seed applied technology products in accordance with the terms and conditions of such agreement. The terms and conditions and costs of the Seed Applied Technologies Supply Agreement are intended to be on an arm’s-length basis and on market terms. We will be required to meet certain minimum purchase requirements for products supplied under the Seed Applied Technologies Supply Agreement. Such minimums are determined by country and crop based on the total volume of seed treatment product required to treat an agreed percentage of our seeds of such crop in the relevant country. The Seed Applied Technologies Supply Agreement will also contain quality, pricing and other terms.
Seed Applied Technologies Supply Agreement will continue until a specified date for current products and the term for certain pipeline products will continue for a specified period following the commercialization of such product on a country-and-crop basis. Either party may terminate the Seed Applied Technologies Supply Agreement following a material breach of the Seed Applied
Technologies Supply Agreement by the other party (which breach is not cured within 60 days of notice of such breach) or upon a change of control of the other party.
The Seed Applied Technologies Supply Agreement will restrict Vylor from selling or supplying any seed treatment product for a specified period of time (excluding to Vylor’s authorized representatives in North America to apply seed treatment products to its seeds).
This summary of the Seed Applied Technologies Supply Agreement is qualified in its entirety by reference to the full text of the agreement, the form of which is incorporated by reference herein and is to be filed as Exhibit to the Form 10 of which this information statement forms a part.
Other Agreements
Prior to the distribution, we intend to enter into certain confidentiality, promotion, collaboration, research and development, licensing and other commercial agreements with New Corteva, the terms and conditions and costs of which will be specified in each such agreement, which are intended to be on an arm’s-length basis and on market terms.
MATERIAL U.S. FEDERAL INCOME TAX CONSEQUENCES OF THE SPIN-OFF
The following is a summary of the material U.S. federal income tax consequences to Corteva, New Corteva and Corteva stockholders in connection with the spin-off. This summary is based on the Code, the Treasury Regulations promulgated thereunder, and judicial and administrative interpretations thereof, all as in effect as of the date of this information statement and all of which are subject to differing interpretations and may change at any time, possibly with retroactive effect. Any such change could affect the tax consequences described below. This summary assumes that the spin-off will be consummated in accordance with the Separation and Distribution Agreement and as described in this information statement.
Except as specifically described below, this summary is limited to Corteva stockholders that are “U.S. Holders,” as defined immediately below. For purposes of this summary, a U.S. Holder is a beneficial owner of Corteva common stock that is, for U.S. federal income tax purposes:
•an individual who is a citizen or a resident of the U.S.;
•a corporation, or other entity taxable as a corporation for U.S. federal income tax purposes, created or organized under the laws of the U.S. or any state thereof or the District of Columbia;
•an estate, the income of which is subject to U.S. federal income taxation regardless of its source; or
•a trust, if (1) a court within the U.S. is able to exercise primary jurisdiction over its administration and one or more U.S. persons have the authority to control all its substantial decisions, or (2) in the case of a trust that was treated as a domestic trust under the law in effect before 1997, a valid election is in place under applicable Treasury Regulations.
This summary also does not discuss all tax considerations that may be relevant to Corteva stockholders in light of their particular circumstances, nor does it address the consequences to Corteva stockholders subject to special treatment under the U.S. federal income tax laws, such as:
•dealers or traders in securities or currencies;
•banks, trusts, financial institutions, or insurance companies;
•persons who acquired shares of Corteva common stock pursuant to the exercise of employee stock options or otherwise as compensation;
•stockholders who own, or are deemed to own, at least 10 percent or more, by voting power or value, of Corteva’s equity;
•holders owning Corteva common stock as part of a position in a straddle or as part of a hedging, conversion, constructive sale, synthetic security, integrated investment, or other risk reduction transaction for U.S. federal income tax purposes;
•certain former citizens or former long-term residents of the U.S.;
•persons who hold Corteva common stock through an individual retirement account, tax-qualified retirement plan or other tax-deferred account;
•persons whose functional currency is not the U.S. dollar;
•holders who are subject to the alternative minimum tax; or
•persons that own Corteva common stock through partnerships or other pass-through entities.
This summary does not address the U.S. federal income tax consequences to stockholders who do not hold shares of Corteva common stock as a capital asset. Moreover, this summary does not address any state, local, or foreign tax consequences or any estate, gift or other non-income tax consequences.
If a partnership (or any other entity treated as a partnership for U.S. federal income tax purposes) holds shares of Corteva common stock, the tax treatment of a partner in that partnership generally will depend on the status of the partner and the activities of the partnership. Such a partner or partnership should consult its own tax advisor as to the tax consequences of the distribution.
YOU SHOULD CONSULT YOUR OWN TAX ADVISOR WITH RESPECT TO THE SPECIFIC U.S. FEDERAL, STATE AND LOCAL, AND NON-U.S. TAX CONSEQUENCES OF THE SPIN-OFF IN LIGHT OF YOUR PARTICULAR
CIRCUMSTANCES AND THE EFFECT OF POSSIBLE CHANGES IN LAW THAT MIGHT AFFECT THE TAX CONSEQUENCES DESCRIBED IN THIS INFORMATION STATEMENT.
1.1.1.Treatment of the Distribution
It is a condition to the distribution that Corteva receives the Tax Opinions, in form and substance acceptable to Corteva, substantially to the effect that the spin-off will qualify as a tax-free transaction under the Code.
Assuming the spin-off qualifies as tax-free under the Code, for U.S. federal income tax purposes:
•no gain or loss will be recognized by Corteva as a result of the spin-off;
•no gain or loss will be recognized by, or be includible in the income of, a Corteva stockholder solely as a result of the receipt of Vylor common stock in the distribution;
•the aggregate tax basis of the shares of New Corteva common stock and shares of Vylor common stock in the hands of each Corteva stockholder immediately after the distribution (including any fractional shares deemed received, as discussed below) will be the same as the aggregate tax basis of the shares of Corteva common stock held by such holder immediately before the distribution, allocated between the shares of New Corteva common stock and shares of Vylor common stock (including any fractional shares deemed received) in proportion to their relative fair market values immediately following the distribution; and
•the holding period with respect to shares of Vylor common stock received by Corteva stockholders (including any fractional shares deemed received) will include the holding period of their shares of Corteva common stock.
Corteva stockholders that have acquired different blocks of Corteva common stock at different times or at different prices should consult their tax advisors regarding the allocation of their aggregate adjusted basis among, and their holding period of, our shares distributed with respect to blocks of Corteva common stock.
The Tax Opinions will be based on, among other things, certain assumptions as well as on the accuracy of certain factual representations and statements that Vylor and Corteva make. In rendering the Tax Opinions, external counsel will also rely on certain covenants that Vylor and Corteva enter into, including the adherence by New Corteva and Vylor to certain restrictions on their future actions. The Tax Opinions will be expressed as of the distribution date and will not cover subsequent periods.
An opinion of counsel represents counsel’s best judgment based on current law and is not binding on the IRS or any court. We cannot assure you that the IRS will agree with the conclusions expected to be set forth in the Tax Opinions, and it is possible that the IRS or another tax authority could adopt a position contrary to one or all those conclusions and that a court could sustain that contrary position.
If, notwithstanding the conclusions that we expect to be included in the Tax Opinions, it is ultimately determined that the spin-off does not qualify as tax-free under the Code for U.S. federal income tax purposes, then New Corteva could incur significant income tax liabilities. In particular, if it is ultimately determined that the distribution does not qualify as tax-free under the Code for U.S. federal income tax purposes, then New Corteva would recognize corporate level taxable gain on the distribution in an amount equal to the excess, if any, of the fair market value of Vylor common stock distributed to Corteva stockholders on the distribution date over Corteva’s tax basis in such stock. In addition, if the distribution is ultimately determined not to qualify as tax-free under the Code for U.S. federal income tax purposes, each Corteva stockholder that receives shares of Vylor common stock in the distribution would be treated as receiving a distribution in an amount equal to the fair market value of Vylor common stock that was distributed to the stockholder, which generally would be taxed as a dividend to the extent of the stockholder’s pro rata share of New Corteva’s current and accumulated earnings and profits, including New Corteva’s taxable gain, if any, on the distribution, then treated as a non-taxable return of capital to the extent of the stockholder’s basis in Corteva stock and thereafter treated as capital gain from the sale or exchange of Corteva stock.
Even if the distribution otherwise qualifies for tax-free treatment under the Code, the distribution may result in corporate level taxable gain to New Corteva under Section 355(e) of the Code if either Vylor or New Corteva undergoes a 50 percent or greater ownership change as part of a plan or series of related transactions that includes the distribution, including transactions occurring after the distribution. The process for determining whether one or more acquisitions or issuances triggering this provision has occurred, the extent to which any such acquisitions or issuances results in a change of ownership and the cumulative effect of any such acquisitions or issuances together with any prior acquisitions or issuances is complex, inherently factual and subject to interpretation of the facts and circumstances of a particular case. If an acquisition or issuance of stock triggers the application of Section 355(e) of the Code, New Corteva would recognize taxable gain as described above, but the distribution would be tax-free to Corteva stockholders (except for tax on any cash received in lieu of fractional shares). In certain cases, Vylor may be required to indemnify New Corteva for all or part of the tax liability resulting from the application of Section 355(e). For further details regarding our potential indemnity obligation, see the section entitled “Our Relationship with New Corteva Following the Spin-Off—Tax Matters Agreement.”
A U.S. Holder that receives cash instead of fractional shares of Vylor common stock should be treated as though the U.S. Holder first received a distribution of a fractional share of Vylor common stock, and then sold it for the amount of cash. Such U.S. Holder should recognize capital gain or loss, measured by the difference between the cash received for such fractional share and the U.S. Holder’s basis in the fractional share, as determined above. Such capital gain or loss should generally be a long-term capital gain or loss if the U.S. Holder’s holding period for such U.S. Holder’s Corteva common stock exceeds one year.
U.S. Treasury Regulations require certain stockholders that receive stock in a distribution to attach a detailed statement setting forth certain information relating to the distribution to their respective U.S. federal income tax returns for the year in which the distribution occurs. Within 45 days after the distribution, New Corteva will provide stockholders who receive Vylor common stock in the distribution with the information necessary to comply with such requirement. In addition, all stockholders are required to retain permanent records relating to the amount, basis, and fair market value of Vylor common stock received in the distribution and to make those records available to the IRS upon request of the IRS.
DESCRIPTION OF MATERIAL INDEBTEDNESS
This section will be populated, in an amendment to the Form 10, to provide information in regard to our material indebtedness.
DESCRIPTION OF OUR CAPITAL STOCK
Our certificate of incorporation and bylaws will be amended and restated prior to the spin-off. The following is a summary of the material terms of our capital stock that will be contained in our amended and restated certificate of incorporation and amended and restated bylaws, and is qualified in its entirety by reference to such documents. This description does not purport to be complete and is qualified in its entirety by reference to the full text of the DGCL, as it may be amended from time to time, and our amended and restated certificate of incorporation and amended and restated bylaws, which are included as exhibits to the Form 10. Prior to the distribution date, Corteva, as our sole stockholder, will approve and adopt our amended and restated certificate of incorporation, and our board of directors will approve and adopt our amended and restated bylaws. For additional information on how you can obtain our amended and restated certificate of incorporation and amended and restated bylaws, see the section entitled “Where You Can Find More Information.” We urge you to read our amended and restated certificate of incorporation and amended and restated bylaws in their entirety.
Authorized Capital Stock
Immediately following the distribution, our authorized capital stock will consist of shares of common stock, par value $0.01 per share, and shares of preferred stock, par value $0.01 per share. The number of authorized shares of any class may be increased or decreased by an amendment to our certificate of incorporation proposed by our board of directors and approved by a majority of voting shares voted on the issue at a meeting at which a quorum exists.
Common Stock
Immediately following the distribution, we expect that approximately shares of our common stock will be issued and outstanding based on approximately shares of Corteva common stock outstanding as of , 2026.
Voting Rights
Each holder of a share of our common stock will be entitled to one vote for each such share held upon all questions presented to our stockholders (other than those reserved to the holders of our preferred stock as may be set forth in the applicable certificate of designation), and our common stock will have the exclusive right to vote for the election of directors and for all other purposes. All corporate actions, other than the election of directors and amendment of our certificate of incorporation and bylaws, are decided by a plurality vote by holders of our common stock.
Quorum
The holders of our common stock entitled to cast a majority of votes at a stockholders’ meeting constitute a quorum at such meeting.
Election of Directors
Directors are generally elected by a majority of the votes cast by holders of our common stock. However, directors are elected by a plurality of the votes cast by holders of our common stock if, as of the record date for such meeting, the number of nominees exceeds the number of directors to be elected. A majority of the votes cast means that the number of votes cast “for” a director’s election exceeds the number of votes cast “against” that director’s election.
Dividends and Liquidation Rights
Holders of common stock are entitled to dividends as may be declared by our board of directors whenever full accumulated dividends for all past dividend periods and for the current dividend period have been paid, or declared and set apart for payment, on then-outstanding preferred stock. Upon liquidation, dissolution or winding-up of Vylor, whether voluntary or involuntary, and after satisfaction of the rights of the holders of our preferred stock, our remaining assets and funds will be divided and paid to holders of our common stock according to their respective shares.
Miscellaneous
The shares of our common stock will be fully paid and non-assessable upon issuance and payment therefor. Holders of common stock will not have any conversion rights or preemptive rights to subscribe for any additional shares of capital stock or other obligations
convertible into or exercisable for shares of capital stock that we may issue in the future. There will not be any redemption or sinking fund provisions applicable to our common stock.
Preferred Stock
Our amended and restated certificate of incorporation will authorize our board of directors to provide for the issuance of preferred stock in multiple series without the approval of stockholders. With respect to each series of our preferred stock, the shares of such series will have such voting powers, full or limited, if any, and such designations, preferences and relative, participating, optional or other special rights, and qualifications, limitations or restrictions thereof, as are stated and expressed in the resolution or resolutions providing for the issue of such series, adopted by our board of directors. The authority of our board of directors with respect to such series includes, but is not limited to, the determination or fixing of the following:
•the designation of the series;
•the number of shares within the series, which number the board of directors may thereafter (except where otherwise provided in the certificate of designation for such series) increase or decrease (but not below the number of shares of such series then outstanding);
•the dividend rate, if any, payable to holders of shares of such series, any conditions and dates upon which such dividends will be payable, the relation which such dividends will bear to the dividends payable on any other class or classes of capital stock or any other series of any class of capital stock of Vylor, and whether such dividends will be cumulative or non-cumulative;
•whether the shares of such series will be subject to redemption by Vylor, in whole or in part, at the option of Vylor or of the holders thereof, and, if made subject to such redemption, the times, prices, form of payment and other terms and conditions of such redemption;
•the terms and amount of any sinking fund provided for the purchase or redemption of the shares of such series;
•whether or not the shares of such series will be convertible into or exchangeable for shares of any other class or classes of any capital stock or any other series of any class of capital stock of Vylor or any other security, and, if provision is made for conversion or exchange, the times, prices, rates, adjustments and other terms and conditions of such conversion or exchange;
•the extent, if any, to which the holders of shares of such series will be entitled to vote generally, with respect to the election of directors, upon specified events or otherwise;
•the restrictions, if any, on the issue or reissue of any additional preferred stock; and
•the rights and preferences of the holders of the shares of such series upon any voluntary or involuntary liquidation or dissolution of, or upon the distribution of assets of, Vylor.
Therefore, depending on the nature of any preferred stock issued, such issuance may diminish the relative voting power of holders of our common stock, or upon its conversion to Vylor common stock be dilutive to existing common stock holders. We will file a copy of the certificate of amendment to our certificate of incorporation that contains the terms of each new series of preferred stock with the Secretary of the State of Delaware and with the SEC each time we issue a new series of preferred stock. Each such certificate of amendment will establish the number of shares included in a designated series and fix the designation, powers, privileges, preferences and rights of the shares of each series as well as any applicable qualifications, limitations or restrictions. The right of a holder of preferred stock to receive payment in respect thereof upon any liquidation, dissolution or winding up of us will be subordinate to the rights of our general creditors.
The authority possessed by our board of directors to issue preferred stock could potentially be used to discourage attempts by third parties to obtain control of Vylor through a merger, tender offer, proxy contest or otherwise by making such attempts more difficult or more costly. Our board of directors may issue preferred stock with voting rights or conversion rights that, if exercised, could adversely affect the voting power of the holders of our common stock. There are no current agreements or understandings with respect to the issuance of preferred stock and our board of directors has no present intention to issue any shares of preferred stock.
Miscellaneous
Any shares of our preferred stock will be fully paid and non-assessable upon issuance and payment therefor. Unless otherwise stated in the certificate of designations, holders of preferred stock do not have any conversion rights or preemptive rights to subscribe for any additional shares of preferred stock or other obligations convertible into or exercisable for shares of preferred stock that we may issue in the future. Unless otherwise stated in the certificate of designations, there are no redemption or sinking fund provisions applicable to our preferred stock.
Anti-Takeover Considerations
The provisions of the DGCL, our amended and restated certificate of incorporation and our amended and restated bylaws contain provisions that could serve to discourage or to make more difficult a change in control of us without the support of our board of directors or without meeting various other conditions. These provisions, summarized below, are expected to discourage certain types of coercive takeover practices and takeover bids that our board of directors may consider inadequate and to encourage persons seeking to acquire control of us to first negotiate with our board of directors. We believe that the benefits of increased protection of our board of directors’ ability to negotiate with the proponent of an unfriendly or unsolicited takeover or acquisition proposal outweigh the disadvantages of discouraging such proposals because, among other things, negotiation of these proposals could result in an improvement of their terms.
Stockholder Action by Written Consent
Delaware law provides that, unless otherwise stated in the certificate of incorporation, any action which may be taken at an annual meeting or special meeting of stockholders may be taken without a meeting, if a consent in writing is signed by the holders of the outstanding stock having the minimum number of votes necessary to authorize the action at a meeting of stockholders. Our amended and restated certificate of incorporation will expressly eliminate the right of its stockholders to act by written consent and, as such, stockholder action must take place at the annual meeting or a special meeting of our stockholders.
Undesignated Preferred Stock
The authority that our board of directors will possess to issue preferred stock could potentially be used to discourage attempts by third parties to obtain control of Vylor through a merger, tender offer, proxy contest or otherwise by making such attempts more difficult or more costly. Our board of directors may be able to issue preferred stock with voting rights or conversion rights that, if exercised, could adversely affect the voting power of the holders of common stock.
Structure of Board
Our board of directors will be elected annually. Our amended and restated bylaws will provide that each director will hold office for a term expiring at the next succeeding annual meeting of stockholders and until such director’s successor is duly elected and qualified. The Vylor board, in accordance with our bylaws, will consist of between 6 and 16 directors, with the number of directors to be determined only by resolution adopted by a majority of the entire board. Furthermore, subject to the provisions of our amended and restated certificate of incorporation and the rights of the holders of any class or series of preferred stock to elect directors, any vacancies on the board caused by death, removal or resignation of any director or any other cause, and any newly created directorships resulting from an increase in the authorized number of directors, will be permitted to be filled only by a majority vote of the directors then in office, even if less than a quorum, or by a sole remaining director, and shall not be filled by stockholders. This provision could prevent a stockholder from obtaining majority representation on our board of directors by allowing our board of directors to enlarge and fill the new directorships with our board of director’s own nominees.
Removal of Directors
In accordance with the DGCL and subject to the rights of the holders of any class or series of preferred stock, the entire board of directors or any individual director will be able to be removed at any time, with or without cause, only by the affirmative vote of the holders of a majority of the voting power of all of the shares of capital stock of Vylor then entitled to vote generally in the election of directors, voting as a single class.
Advance Notice of Proposals and Nominations
Our amended and restated bylaws will provide that stockholders must give timely written notice to bring business before an annual meeting of stockholders or to nominate candidates for election as directors at an annual meeting of stockholders. Generally, to be timely, a stockholder’s notice will be required to be delivered to the Secretary of Vylor not later than the close of business on the 90th day nor earlier than the close of business on the 120th day prior to the first anniversary of the date we first distributed our proxy materials for the preceding year’s annual meeting. Our amended and restated bylaws will also specify the form and content of a stockholder’s notice. For purposes of the first annual meeting, the anniversary date of our 2026 annual meeting shall be deemed to be , 2027.
These advance-notice provisions may have the effect of precluding a contest for the election of our directors or the consideration of stockholder proposals if the proper procedures are not followed, and of discouraging or deterring a third party from conducting a
solicitation of proxies to elect its own slate of directors or to approve its own proposal, without regard to whether consideration of those nominees or proposals might be harmful or beneficial to us and our stockholders.
Limits on Special Meetings
Our amended and restated bylaws will provide that special meetings of our stockholders may be called by by order of our board of directors or by written request of stockholders holding together at least 25% of the voting power of all shares of our capital stock then entitled to vote on the matter or matters to be brought before the proposed special meeting. These provisions may prevent stockholders from bringing matters before an annual meeting of stockholders or from nominating candidates for election as directors at an annual meeting of stockholders.
Takeover Statutes
Upon the distribution, we will be subject to Section 203 of the DGCL, an anti-takeover statute. Section 203 of the DGCL generally prohibits “business combinations,” including mergers, sales and leases of assets, issuances of securities and similar transactions by a corporation or a subsidiary with an interested stockholder who beneficially owns 15% or more of a corporation’s voting stock, within three years after the person or entity becomes an interested stockholder, unless: (i) the board of directors of the target corporation has approved, before the acquisition time, either the business combination or the transaction that resulted in the person becoming an interested stockholder, (ii) upon consummation of the transaction that resulted in the person becoming an interested stockholder, the person owns at least 85% of the corporation’s voting stock (excluding shares owned by directors who are officers and shares owned by employee stock plans in which participants do not have the right to determine confidentially whether shares will be tendered in a tender or exchange offer) or (iii) after the person or entity becomes an interested stockholder, the business combination is approved by the board of directors and authorized at a meeting of stockholders by the affirmative vote of at least 66 2∕3% of the outstanding voting stock not owned by the interested stockholder.
The provisions of Section 203 of the DGCL may encourage persons interested in acquiring us to negotiate in advance with our board of directors, because the stockholder approval requirement would be avoided if a majority of the directors then in office approve either the business combination or the transaction which results in any such person becoming an interested stockholder. These provisions also may have the effect of preventing changes in our management. It is possible that these provisions could make it more difficult to accomplish transactions which our stockholders may otherwise deem to be in their best interests.
Limitations on Liability, Indemnification and Insurance
The DGCL authorizes corporations to limit or eliminate the personal liability of directors and officers to corporations and their stockholders for monetary damages for breaches of fiduciary duty as a director or officer to the full extent permitted by the DGCL, and our amended and restated certificate of incorporation will include such an exculpation provision. Under the provisions of our amended and restated certificate of incorporation and amended and restated bylaws, each of our directors, officers and employees shall be indemnified by us as of right to the full extent permitted by the DGCL.
As permitted by Delaware law, our amended and restated certificate of incorporation will authorize us to purchase and maintain insurance to protect any current or former director, officer, employee or agent against claims and liabilities that such persons may incur in such capacities.
The limitation of liability and indemnification provisions that will be in our amended and restated certificate of incorporation and amended and restated bylaws may discourage stockholders from bringing a lawsuit against directors for breach of their fiduciary duty. These provisions may also have the effect of reducing the likelihood of derivative litigation against our directors and officers, even though such an action, if successful, might otherwise benefit Vylor and our stockholders. However, these provisions will not limit or eliminate our rights, or those of any stockholder, to seek non-monetary relief such as an injunction or rescission in the event of a breach of a director’s duty of care. The provisions will not alter the liability of directors under the federal securities laws. In addition, your investment may be adversely affected to the extent that, in a class action or direct suit, we pay the costs of settlement and damage awards against directors and officers pursuant to these indemnification provisions. There is currently no pending material litigation or proceeding against any of our directors, officers, employees or agents for which indemnification is sought.
Exclusive Forum
Our amended and restated bylaws will provide that unless we consent in writing to the selection of an alternative forum, the Court of Chancery of the State of Delaware shall be the sole and exclusive forum for (i) any derivative action or proceeding brought on behalf of Vylor, (ii) any action asserting a claim of breach of a fiduciary duty owed by any Vylor director, officer or other employee to Vylor or our stockholders, (iii) any action asserting a claim arising pursuant to any provision of the DGCL, or (iv) any action asserting a claim governed by the internal affairs doctrine. Our amended and restated bylaws will also provide that unless we consent in writing to the selection of an alternative forum, the federal district courts of the United States shall be the sole and exclusive forum for the resolution of any complaint asserting a cause of action arising under the Securities Act or any rules or regulations promulgated thereunder. Our amended and restated bylaws will provide that the exclusive forum provision will not preclude or contract the scope of exclusive federal jurisdiction for actions brought under the Exchange Act or any rules or regulations promulgated thereunder. Our amended and restated bylaws will also provide that we are entitled to equitable relief, including injunctive relief and specific performance, to enforce such provisions regarding forum.
Sale of Unregistered Securities
On November 13, 2025, we issued 100 shares of our common stock to EIDP, pursuant to Section 4(a)(2) of the Securities Act. We did not register the issuance of the shares under the Securities Act because the issuance did not constitute a public offering.
Transfer Agent and Registrar
After the distribution, the transfer agent and registrar for our common stock will be Computershare.
Exchange Listing
We intend to apply to list Vylor common stock on the NYSE under the symbol “ .”
WHERE YOU CAN FIND MORE INFORMATION
We have filed the Form 10 with the SEC with respect to the shares of Vylor common stock being distributed as contemplated by this information statement. This information statement is a part of, and does not contain all of the information set forth in, the Form 10, including its exhibits. For further information with respect to us and Vylor common stock, please refer to the Form 10, including its exhibits. Statements made in this information statement relating to any contract or other document are not necessarily complete, and you should refer to the exhibits to the Form 10 for copies of the actual contract or document. You may review a copy of the Form 10, including its exhibits, at the SEC’s public reference room, located at 100 F Street, N.E., Washington, D.C. 20549, by calling the SEC at 1-800-SEC-0330 as well as on the Internet website maintained by the SEC at www.sec.gov.
As a result of the spin-off, we will become subject to the information and reporting requirements of the Exchange Act and, in accordance with the Exchange Act, we will file periodic reports, proxy statements and other information with the SEC, which will be available on the Internet website maintained by the SEC at www.sec.gov.
You can also find a copy of this Form 10, of which this information statement is a part, on our website, www. , which Vylor will make available free of charge. Vylor also plans to make available its annual report on Form 10-K, quarterly reports on Form 10-Q, current reports on Form 8-K and amendments to those reports, in each case, filed with or furnished to the SEC pursuant to the Exchange Act, on our website, www. , which Vylor will make available free of charge as soon as reasonably practicable after Vylor electronically files such material with, or furnishes it to, the SEC.
Information contained on any website referenced in this information statement is not incorporated by reference in this information statement.
Unless we have received contrary instructions, if multiple Corteva stockholders share an address, only one copy of this information statement is being delivered to such address. This practice, known as “householding,” is designed to reduce printing and postage costs.
We undertake to deliver promptly upon written or oral request a separate copy of this information statement to Corteva stockholders at a shared address to which a single copy of this information statement was delivered. If you are a holder of record of Corteva common stock, you may request such separate copy by contacting the Office of the Corporate Secretary at 1000 N. West Street, Suite 900, Wilmington DE, 19801. If you hold Corteva common stock with a bank or broker, you may request such separate copy by contacting or by calling . If you are a holder of record of Corteva common stock receiving multiple copies at the same address or if you have a number of accounts at a single brokerage firm, you may submit a request to receive a single copy in the future by contacting the Office of the Corporate Secretary. If you hold Corteva common stock with a bank or broker, contact at the address and telephone number provided above.
We intend to furnish holders of Vylor common stock with annual reports containing consolidated financial statements prepared in accordance with GAAP and audited and reported on, with an opinion expressed, by an independent registered public accounting firm.
You should rely only on the information contained in this information statement or to which this information statement has referred you. We have not authorized any person to provide you with different information or to make any representation not contained in this information statement.
INDEX TO FINANCIAL STATEMENTS
Corteva, Inc.
Interim Consolidated Financial Statements (Unaudited)
|
|
Consolidated Statements of Operations for the three months ended March 31, 2026 and 2025 |
F-2 |
Consolidated Statements of Comprehensive (Loss) Income for the three months ended March 31, 2026 and 2025 |
F-3 |
Consolidated Balance Sheets as of March 31, 2026, December 31, 2025, and March 31, 2025 |
F-4 |
Consolidated Statements of Cash Flows for the three months ended March 31, 2026 and 2025 |
F-5 |
Consolidated Statements of Equity as of March 31, 2026 and March 31, 2025 |
F-6 |
Notes to the Interim Consolidated Financial Statements (Unaudited) |
F-7 |
Audited Consolidated Financial Statements
|
|
|
|
Report of Independent Registered Public Accounting Firm |
F-38 |
Consolidated Statements of Operations for years ended December 31, 2025, 2024, and 2023 |
F-40 |
Consolidated Statements of Comprehensive Income (Loss) for the years ended December 31, 2025, 2024, and 2023 |
F-41 |
Consolidated Balance Sheets as of December 31, 2025 and 2024 |
F-42 |
Consolidated Statements of Cash Flows for the years ended December 31, 2025, 2024, and 2023 |
F-43 |
Consolidated Statements of Equity for the years ended December 31, 2025, 2024, and 2023 |
F-44 |
Notes to the Consolidated Financial Statements |
F-45 |
Schedule II—Valuation and Qualifying Accounts |
F-105 |
The Seed Business (Supplemental)
Interim Combined Financial Statements (Unaudited)
|
|
|
|
Combined Statements of Operations for the three months ended March 31, 2026 and 2025 |
F-106 |
Combined Statements of Comprehensive (Loss) Income for the three months ended March 31, 2026 and 2025 |
F-107 |
Combined Balance Sheets as of March 31, 2026, December 31, 2025, and March 31, 2025 |
F-108 |
Combined Statements of Cash Flows for the three months ended March 31, 2026 and 2025 |
F-109 |
Combined Statements of Equity for the three months ended March 31, 2026 and March 31, 2025 |
F-110 |
Notes to the Interim Combined Financial Statements (Unaudited) |
F-111 |
Audited Combined Financial Statements
|
|
|
|
Report of Independent Registered Public Accounting Firm |
F-130 |
Combined Statements of Operations for years ended December 31, 2025, 2024, and 2023 |
F-132 |
Combined Statements of Comprehensive Income (Loss) for the years ended December 31, 2025, 2024, and 2023 |
F-133 |
Combined Balance Sheets as of December 31, 2025 and 202 |
F-134 |
Combined Statements of Cash Flows for the years ended December 31 2025, 2024, and 2023 |
F-135 |
Combined Statements of Equity for the years ended December 31, 2025, 2024, and 2023 |
F-136 |
Notes to the Combined Financial Statements |
F-137 |
Schedule II – Valuation and Qualifying Accounts |
F-178 |
Corteva, Inc.
Consolidated Statements of Operations
(Unaudited)
|
|
|
|
|
|
|
|
|
|
Three Months Ended March 31, |
|
(In millions, except per share amounts) |
2026 |
|
2025 |
|
Net sales |
|
$ |
4,905 |
|
|
$ |
4,417 |
|
Cost of goods sold |
|
|
2,372 |
|
|
|
2,342 |
|
Research and development expense |
|
|
341 |
|
|
|
335 |
|
Selling, general and administrative expenses |
|
|
877 |
|
|
|
751 |
|
Amortization of intangibles |
|
|
160 |
|
|
|
162 |
|
Restructuring and asset related charges - net |
|
|
92 |
|
|
|
22 |
|
Separation costs |
|
|
52 |
|
|
|
— |
|
Other income (expense) - net |
|
|
(117 |
) |
|
|
15 |
|
Interest expense |
|
|
36 |
|
|
|
36 |
|
Income (loss) from continuing operations before income taxes |
|
|
858 |
|
|
|
784 |
|
Provision for (benefit from) income taxes on continuing operations |
|
|
133 |
|
|
|
117 |
|
Income (loss) from continuing operations after income taxes |
|
|
725 |
|
|
|
667 |
|
Income (loss) from discontinued operations after income taxes |
|
|
(2 |
) |
|
|
(11 |
) |
Net income (loss) |
|
|
723 |
|
|
|
656 |
|
Net income (loss) attributable to noncontrolling interests |
|
|
3 |
|
|
|
4 |
|
Net income (loss) attributable to Corteva |
|
$ |
720 |
|
|
$ |
652 |
|
Basic earnings (loss) per share of common stock: |
|
|
|
|
|
|
Basic earnings (loss) per share of common stock from continuing operations |
|
$ |
1.07 |
|
|
$ |
0.97 |
|
Basic earnings (loss) per share of common stock from discontinued operations |
|
|
— |
|
|
|
(0.02 |
) |
Basic earnings (loss) per share of common stock |
|
$ |
1.07 |
|
|
$ |
0.95 |
|
Diluted earnings (loss) per share of common stock: |
|
|
|
|
|
|
Diluted earnings (loss) per share of common stock from continuing operations |
|
$ |
1.07 |
|
|
$ |
0.97 |
|
Diluted earnings (loss) per share of common stock from discontinued operations |
|
|
— |
|
|
|
(0.02 |
) |
Diluted earnings (loss) per share of common stock |
|
$ |
1.07 |
|
|
$ |
0.95 |
|
See Notes to the Interim Consolidated Financial Statements
Corteva, Inc.
Consolidated Statements of Comprehensive Income (Loss)
(Unaudited)
|
|
|
|
|
|
|
|
|
|
Three Months Ended March 31, |
|
(In millions) |
2026 |
|
2025 |
|
Net income (loss) |
|
$ |
723 |
|
|
$ |
656 |
|
Other comprehensive income (loss) - net of tax: |
|
|
|
|
|
|
Cumulative translation adjustments |
|
|
(129 |
) |
|
|
186 |
|
Adjustments to pension benefit plans |
|
|
(4 |
) |
|
|
1 |
|
Adjustments to other benefit plans |
|
|
(3 |
) |
|
|
(3 |
) |
Unrealized gain (loss) on investments |
|
|
1 |
|
|
|
2 |
|
Derivative instruments |
|
|
(8 |
) |
|
|
12 |
|
Total other comprehensive income (loss) |
|
|
(143 |
) |
|
|
198 |
|
Comprehensive income (loss) |
|
|
580 |
|
|
|
854 |
|
Comprehensive income (loss) attributable to noncontrolling interests - net of tax |
|
|
3 |
|
|
|
4 |
|
Comprehensive income (loss) attributable to Corteva |
|
$ |
577 |
|
|
$ |
850 |
|
See Notes to the Interim Consolidated Financial Statements
Corteva, Inc.
Consolidated Balance Sheets
(Unaudited)
|
|
|
|
|
|
|
|
|
|
|
|
|
(In millions, except share amounts) |
March 31, 2026 |
|
December 31, 2025 |
|
March 31, 2025 |
|
Assets |
|
|
|
|
|
|
|
|
|
Current assets |
|
|
|
|
|
|
|
|
|
Cash and cash equivalents |
|
$ |
1,964 |
|
|
$ |
4,521 |
|
|
$ |
2,008 |
|
Marketable securities |
|
|
2 |
|
|
|
9 |
|
|
|
1 |
|
Accounts and notes receivable - net |
|
|
9,088 |
|
|
|
6,371 |
|
|
|
8,294 |
|
Inventories |
|
|
5,202 |
|
|
|
5,667 |
|
|
|
5,132 |
|
Other current assets |
|
|
1,129 |
|
|
|
767 |
|
|
|
1,152 |
|
Total current assets |
|
|
17,385 |
|
|
|
17,335 |
|
|
|
16,587 |
|
Investment in nonconsolidated affiliates |
|
|
165 |
|
|
|
160 |
|
|
|
136 |
|
Property, plant and equipment |
|
|
9,617 |
|
|
|
9,551 |
|
|
|
9,244 |
|
Less: Accumulated depreciation |
|
|
5,434 |
|
|
|
5,331 |
|
|
|
5,139 |
|
Net property, plant and equipment |
|
|
4,183 |
|
|
|
4,220 |
|
|
|
4,105 |
|
Goodwill |
|
|
10,409 |
|
|
|
10,465 |
|
|
|
10,332 |
|
Other intangible assets |
|
|
8,147 |
|
|
|
8,301 |
|
|
|
8,718 |
|
Deferred income taxes |
|
|
395 |
|
|
|
320 |
|
|
|
413 |
|
Other assets |
|
|
2,033 |
|
|
|
2,044 |
|
|
|
1,832 |
|
Total Assets |
|
$ |
42,717 |
|
|
$ |
42,845 |
|
|
$ |
42,123 |
|
Liabilities and Equity |
|
|
|
|
|
|
|
|
|
Current liabilities |
|
|
|
|
|
|
|
|
|
Short-term borrowings |
|
$ |
1,674 |
|
|
$ |
894 |
|
|
$ |
2,291 |
|
Accounts payable |
|
|
4,187 |
|
|
|
4,398 |
|
|
|
3,905 |
|
Income taxes payable |
|
|
229 |
|
|
|
155 |
|
|
|
322 |
|
Deferred revenue |
|
|
2,773 |
|
|
|
3,579 |
|
|
|
2,631 |
|
Accrued and other current liabilities |
|
|
2,991 |
|
|
|
3,099 |
|
|
|
2,332 |
|
Total current liabilities |
|
|
11,854 |
|
|
|
12,125 |
|
|
|
11,481 |
|
Long-term debt |
|
|
1,682 |
|
|
|
1,686 |
|
|
|
1,792 |
|
Other noncurrent liabilities |
|
|
|
|
|
|
|
|
|
Deferred income tax liabilities |
|
|
290 |
|
|
|
251 |
|
|
|
369 |
|
Pension and other post-employment benefits |
|
|
2,388 |
|
|
|
2,434 |
|
|
|
2,239 |
|
Other noncurrent obligations |
|
|
1,898 |
|
|
|
1,963 |
|
|
|
1,715 |
|
Total noncurrent liabilities |
|
|
6,258 |
|
|
|
6,334 |
|
|
|
6,115 |
|
Commitments and contingent liabilities |
|
|
|
|
|
|
|
|
|
Stockholders’ equity |
|
|
|
|
|
|
|
|
|
Common stock, $0.01 par value; 1,666,667,000 shares authorized; issued at March 31, 2026 - 670,044,000; December 31, 2025 - 672,163,000; and March 31, 2025 - 683,026,000 |
|
|
7 |
|
|
|
7 |
|
|
|
7 |
|
Additional paid-in capital |
|
|
26,859 |
|
|
|
27,001 |
|
|
|
26,962 |
|
Retained earnings (accumulated deficit) |
|
|
436 |
|
|
|
(67 |
) |
|
|
587 |
|
Accumulated other comprehensive income (loss) |
|
|
(2,940 |
) |
|
|
(2,797 |
) |
|
|
(3,271 |
) |
Total Corteva stockholders’ equity |
|
|
24,362 |
|
|
|
24,144 |
|
|
|
24,285 |
|
Noncontrolling interests |
|
|
243 |
|
|
|
242 |
|
|
|
242 |
|
Total equity |
|
|
24,605 |
|
|
|
24,386 |
|
|
|
24,527 |
|
Total Liabilities and Equity |
|
$ |
42,717 |
|
|
$ |
42,845 |
|
|
$ |
42,123 |
|
See Notes to the Interim Consolidated Financial Statements
Corteva, Inc.
Consolidated Statements of Cash Flows
(Unaudited)
|
|
|
|
|
|
|
|
|
(In millions) |
Three Months Ended March 31, |
|
|
2026 |
|
2025 |
|
Operating activities |
|
|
|
|
|
|
Net income (loss) |
|
$ |
723 |
|
|
$ |
656 |
|
(Income) loss from discontinued operations after income taxes |
|
|
2 |
|
|
|
11 |
|
Adjustments to reconcile net income (loss) to cash provided by (used for) operating activities: |
|
|
|
|
|
|
Depreciation and amortization |
|
|
297 |
|
|
|
296 |
|
Provision for (benefit from) deferred income tax |
|
|
(52 |
) |
|
|
(122 |
) |
Net periodic pension and OPEB (benefit) cost, net |
|
|
(3 |
) |
|
|
10 |
|
Pension and OPEB contributions |
|
|
(48 |
) |
|
|
(51 |
) |
Net (gain) loss on sales of property, businesses, consolidated companies and investments |
|
|
3 |
|
|
|
(4 |
) |
Restructuring and asset related charges - net |
|
|
92 |
|
|
|
22 |
|
Other net loss |
|
|
157 |
|
|
|
75 |
|
Changes in assets and liabilities, net |
|
|
|
|
|
|
Accounts and notes receivable |
|
|
(2,810 |
) |
|
|
(2,505 |
) |
Inventories |
|
|
439 |
|
|
|
379 |
|
Accounts payable |
|
|
(221 |
) |
|
|
(190 |
) |
Deferred revenue |
|
|
(790 |
) |
|
|
(667 |
) |
Other assets and liabilities |
|
|
(674 |
) |
|
|
(11 |
) |
Cash provided by (used for) operating activities - continuing operations |
|
|
(2,885 |
) |
|
|
(2,101 |
) |
Cash provided by (used for) operating activities - discontinued operations |
|
|
(6 |
) |
|
|
(8 |
) |
Cash provided by (used for) operating activities |
|
|
(2,891 |
) |
|
|
(2,109 |
) |
Investing activities |
|
|
|
|
|
|
Capital expenditures |
|
|
(81 |
) |
|
|
(94 |
) |
Proceeds from sales of property, businesses and consolidated companies - net of cash divested |
|
|
— |
|
|
|
8 |
|
Investments in and loans to nonconsolidated affiliates |
|
|
(3 |
) |
|
|
— |
|
Proceeds from sales and maturities of investments |
|
|
8 |
|
|
|
62 |
|
Other investing activities, net |
|
|
(1 |
) |
|
|
(10 |
) |
Cash provided by (used for) investing activities |
|
|
(77 |
) |
|
|
(34 |
) |
Financing activities |
|
|
|
|
|
|
Net change in borrowings (less than 90 days) |
|
|
521 |
|
|
|
745 |
|
Proceeds from debt |
|
|
268 |
|
|
|
637 |
|
Payments on debt |
|
|
(22 |
) |
|
|
(14 |
) |
Repurchase of common stock |
|
|
(250 |
) |
|
|
(270 |
) |
Proceeds from exercise of stock options |
|
|
17 |
|
|
|
35 |
|
Dividends paid to stockholders |
|
|
(121 |
) |
|
|
(116 |
) |
Other financing activities, net |
|
|
(24 |
) |
|
|
(22 |
) |
Cash provided by (used for) financing activities |
|
|
389 |
|
|
|
995 |
|
Effect of exchange rate changes on cash, cash equivalents and restricted cash equivalents |
|
|
(5 |
) |
|
|
21 |
|
Increase (decrease) in cash, cash equivalents and restricted cash equivalents |
|
|
(2,584 |
) |
|
|
(1,127 |
) |
Cash, cash equivalents and restricted cash equivalents at beginning of period |
|
|
4,725 |
|
|
|
3,422 |
|
Cash, cash equivalents and restricted cash equivalents at end of period 1 |
|
$ |
2,141 |
|
|
$ |
2,295 |
|
1.See Note 5 - Supplementary Information, to the interim Consolidated Financial Statements, for reconciliation of cash and cash equivalents and restricted cash equivalents presented in the interim Consolidated Balance Sheets to total cash, cash equivalents and restricted cash equivalents presented in the interim Consolidated Statements of Cash Flows.
See Notes to the Interim Consolidated Financial Statements
Corteva, Inc.
Consolidated Statements of Equity
(Unaudited)
|
|
|
|
|
|
|
|
|
|
|
|
|
|
|
|
|
|
|
|
|
|
|
|
|
(In millions, except per share amounts) |
Common Stock |
|
Additional Paid-in Capital |
|
Retained Earnings (Accum. Deficit) |
|
Accumulated Other Comp. Income (Loss) |
|
Non-Controlling Interests |
|
Total Equity |
|
2026 |
|
|
|
|
|
|
|
|
|
|
|
|
|
|
|
|
|
|
Balance at January 1, 2026 |
|
$ |
7 |
|
|
$ |
27,001 |
|
|
$ |
(67 |
) |
|
$ |
(2,797 |
) |
|
$ |
242 |
|
|
$ |
24,386 |
|
Net income (loss) |
|
|
|
|
|
|
|
|
720 |
|
|
|
|
|
|
3 |
|
|
|
723 |
|
Other comprehensive income (loss) |
|
|
|
|
|
|
|
|
|
|
|
(143 |
) |
|
|
|
|
|
(143 |
) |
Share-based compensation |
|
|
|
|
|
(2 |
) |
|
|
|
|
|
|
|
|
|
|
|
(2 |
) |
Common dividends ($0.18 per share) |
|
|
|
|
|
(121 |
) |
|
|
|
|
|
|
|
|
|
|
|
(121 |
) |
Issuance of Corteva stock |
|
|
|
|
|
17 |
|
|
|
|
|
|
|
|
|
|
|
|
17 |
|
Repurchase of common stock |
|
|
|
|
|
(36 |
) |
|
|
(214 |
) |
|
|
|
|
|
|
|
|
(250 |
) |
Other - net |
|
|
|
|
|
|
|
|
(3 |
) |
|
|
|
|
|
(2 |
) |
|
|
(5 |
) |
Balance at March 31, 2026 |
|
$ |
7 |
|
|
$ |
26,859 |
|
|
$ |
436 |
|
|
$ |
(2,940 |
) |
|
$ |
243 |
|
|
$ |
24,605 |
|
|
|
|
|
|
|
|
|
|
|
|
|
|
|
|
|
|
|
|
|
|
|
|
|
|
(In millions, except per share amounts) |
Common Stock |
|
Additional Paid-in Capital |
|
Retained Earnings (Accum. Deficit) |
|
Accumulated Other Comp. Income (Loss) |
|
Non-Controlling Interests |
|
Total Equity |
|
2025 |
|
|
|
|
|
|
|
|
|
|
|
|
|
|
|
|
|
|
Balance at January 1, 2025 |
|
$ |
7 |
|
|
$ |
27,196 |
|
|
$ |
55 |
|
|
$ |
(3,469 |
) |
|
$ |
241 |
|
|
$ |
24,030 |
|
Net income (loss) |
|
|
|
|
|
|
|
|
652 |
|
|
|
|
|
|
4 |
|
|
|
656 |
|
Other comprehensive income (loss) |
|
|
|
|
|
|
|
|
|
|
|
198 |
|
|
|
|
|
|
198 |
|
Share-based compensation |
|
|
|
|
|
(2 |
) |
|
|
|
|
|
|
|
|
|
|
|
(2 |
) |
Common dividends ($0.17 per share) |
|
|
|
|
|
(116 |
) |
|
|
|
|
|
|
|
|
|
|
|
(116 |
) |
Issuance of Corteva stock |
|
|
|
|
|
35 |
|
|
|
|
|
|
|
|
|
|
|
|
35 |
|
Repurchase of common stock |
|
|
|
|
|
(150 |
) |
|
|
(120 |
) |
|
|
|
|
|
|
|
|
(270 |
) |
Other - net |
|
|
|
|
|
(1 |
) |
|
|
|
|
|
|
|
|
(3 |
) |
|
|
(4 |
) |
Balance at March 31, 2025 |
|
$ |
7 |
|
|
$ |
26,962 |
|
|
$ |
587 |
|
|
$ |
(3,271 |
) |
|
$ |
242 |
|
|
$ |
24,527 |
|
See Notes to the Interim Consolidated Financial Statements
NOTE 1 — SUMMARY OF SIGNIFICANT ACCOUNTING POLICIES
Basis of Presentation
The accompanying unaudited interim Consolidated Financial Statements have been prepared in accordance with generally accepted accounting principles in the United States of America (“GAAP”) for interim financial information and the instructions to Form 10-Q and Rule 10-01 of Regulation S-X. In the opinion of management, all adjustments (consisting of normal recurring adjustments) considered necessary for a fair statement of the results for interim periods have been included. Results for interim periods should not be considered indicative of results for a full year. These interim Consolidated Financial Statements should be read in conjunction with the audited Consolidated Financial Statements and Notes thereto contained in the company’s Annual Report on Form 10-K for the year ended December 31, 2025, collectively referred to as the “2025 Annual Report.” The interim Consolidated Financial Statements include the accounts of the company and all of its subsidiaries in which a controlling interest is maintained. The interim Consolidated Financial Statements and other financial information included in this Form 10-Q, unless otherwise specified, have been presented to separately show the effects of discontinued operations.
Since 2018, Argentina has been considered a highly-inflationary economy under U.S. GAAP and therefore the U.S. Dollar (“USD”) is the functional currency for our related subsidiaries. Argentina contributes approximately 3 percent to the company's annual net sales and approximately 1 percent to each of the company's annual Seed and Crop Protection segment operating EBITDA. The company remeasures net monetary assets utilizing the official Argentine Peso (“Peso”) to USD exchange rate. The ability to draw down Peso cash balances is limited at this time due to government restrictions and market availability of U.S. Dollars. The devaluation of the Peso relative to the USD over the last several years has resulted in the recognition of exchange losses (refer to Note 5 – Supplementary Information, to the interim Consolidated Financial Statements, and Note 6 – Supplementary Information, to the Consolidated Financial Statements, in the company's 2025 Annual Report). The Argentina government has offered USD-denominated bonds to importers, the proceeds from which can be used to pay off outstanding intercompany payables. As of March 31, 2026, the company holds these foreign government bonds with an amortized cost of $25 million as part of its strategy to manage its net monetary asset exposure in Argentina. Refer to the “Debt Securities” section in Note 15 – Financial Instruments, to the interim Consolidated Financial Statements, for additional information. As of March 31, 2026, a further 10 percent deterioration in the official Peso to USD exchange rate would not have a significant impact on the USD value of our net monetary assets or pre-tax earnings. The company will continue to assess the implications to our operations and financial reporting.
NOTE 2 — RECENT ACCOUNTING GUIDANCE
Accounting Guidance Issued But Not Adopted as of March 31, 2026
In November 2024, the Financial Accounting Standards Board (“FASB”) issued Accounting Standards Update (“ASU”) 2024-03, Income Statement—Reporting Comprehensive Income—Expense Disaggregation Disclosures (Subtopic 220-40): Disaggregation of Income Statement Expenses. This ASU includes amendments that require entities to bifurcate specified expense line items on the income statement into underlying components, including purchases of inventory, employee compensation, depreciation, intangible asset amortization and depletion, as applicable. Qualitative descriptions of the remaining components are required. These enhanced disclosures are required for both interim and annual periods. Selling expenses must also be separately disclosed for both interim and annual periods, along with an annual qualitative description of the composition of selling expenses. In January 2025, the FASB subsequently issued ASU 2025-01, Income Statement—Reporting Comprehensive Income—Expense Disaggregation Disclosures (Subtopic 220-40): Clarifying the Effective Date, to provide clarification on the ASU's effective date. The new standard is effective for fiscal years beginning after December 15, 2026 on a prospective basis with the option to apply it retrospectively, and for interim periods within fiscal years beginning after December 15, 2027. Early adoption is permitted. The adoption of this guidance will result in the company being required to include enhanced disclosures around income statement expenses.
NOTE 3 — REVENUE
Remaining Performance Obligations
Remaining performance obligations represent the transaction price allocated to unsatisfied or partially unsatisfied performance obligations. The company applies the practical expedient to disclose the transaction price allocated to the remaining performance obligations for only those contracts with an original duration of more than one year. The transaction price allocated to remaining performance obligations with an original duration of more than one year related to material rights granted to customers for contract renewal options were $147 million, $150 million and $135 million at March 31, 2026, December 31, 2025 and March 31, 2025, respectively. The company expects revenue to be recognized for the remaining performance obligations evenly over a period of six years.
Contract Balances
Contract liabilities primarily reflect deferred revenue from prepayments under contracts with customers where the company receives advance payments for products to be delivered in future periods. Corteva classifies deferred revenue as current or noncurrent based on the timing of when the company expects to recognize revenue. Contract assets primarily include amounts related to conditional rights to consideration for completed performance not yet invoiced. Accounts receivable are recorded when the right to consideration becomes unconditional.
|
|
|
|
|
|
|
|
|
|
|
|
|
Contract Balances |
|
|
|
|
|
|
|
|
|
(In millions) |
March 31, 2026 |
|
December 31, 2025 |
|
March 31, 2025 |
|
Contract assets - current 1 |
|
$ |
34 |
|
|
$ |
34 |
|
|
$ |
30 |
|
Contract assets - noncurrent 2 |
|
$ |
82 |
|
|
$ |
83 |
|
|
$ |
73 |
|
Deferred revenue - current |
|
$ |
2,773 |
|
|
$ |
3,579 |
|
|
$ |
2,631 |
|
Deferred revenue - noncurrent 3 |
|
$ |
113 |
|
|
$ |
125 |
|
|
$ |
111 |
|
1.Included in other current assets in the interim Consolidated Balance Sheets.
2.Included in other assets in the interim Consolidated Balance Sheets.
3.Included in other noncurrent obligations in the interim Consolidated Balance Sheets.
Revenue recognized during the three months ended March 31, 2026 and 2025 from amounts included in deferred revenue at the beginning of the period was $1,268 million and $1,174 million, respectively.
Disaggregation of Revenue
Corteva's operations are classified into two operating segments: Seed and Crop Protection. The company disaggregates its revenue by major product line and geographic region, as the company believes it best depicts the nature, amount and timing of its revenue and cash flows. Net sales by major product line are included below:
|
|
|
|
|
|
|
|
|
|
Three Months Ended March 31, |
|
(In millions) |
2026 |
|
2025 |
|
Corn |
|
$ |
2,373 |
|
|
$ |
2,069 |
|
Soybean |
|
|
306 |
|
|
|
305 |
|
Other oilseeds |
|
|
245 |
|
|
|
223 |
|
Other |
|
|
99 |
|
|
|
110 |
|
Seed |
|
|
3,023 |
|
|
|
2,707 |
|
Herbicides |
|
|
1,027 |
|
|
|
860 |
|
Insecticides |
|
|
377 |
|
|
|
336 |
|
Fungicides |
|
|
334 |
|
|
|
304 |
|
Biologicals |
|
|
70 |
|
|
|
84 |
|
Other |
|
|
74 |
|
|
|
126 |
|
Crop Protection |
|
|
1,882 |
|
|
|
1,710 |
|
Total |
|
$ |
4,905 |
|
|
$ |
4,417 |
|
Sales are attributed to geographic regions based on customer location. Net sales by geographic region and segment are included below:
|
|
|
|
|
|
|
|
|
Seed |
Three Months Ended March 31, |
|
(In millions) |
2026 |
|
2025 |
|
North America 1 |
|
$ |
1,770 |
|
|
$ |
1,597 |
|
EMEA 2 |
|
|
928 |
|
|
|
826 |
|
Latin America |
|
|
224 |
|
|
|
185 |
|
Asia Pacific |
|
|
101 |
|
|
|
99 |
|
Total |
|
$ |
3,023 |
|
|
$ |
2,707 |
|
|
|
|
|
|
|
|
|
|
Crop Protection |
Three Months Ended March 31, |
|
(In millions) |
2026 |
|
2025 |
|
North America 1 |
|
$ |
669 |
|
|
$ |
613 |
|
EMEA 2 |
|
|
727 |
|
|
|
651 |
|
Latin America |
|
|
282 |
|
|
|
257 |
|
Asia Pacific |
|
|
204 |
|
|
|
189 |
|
Total |
|
$ |
1,882 |
|
|
$ |
1,710 |
|
1.Represents U.S. and Canada
2.Europe, Middle East and Africa ("EMEA")
NOTE 4 — RESTRUCTURING AND ASSET RELATED CHARGES - NET
2026 Restructuring Actions
On March 15, 2026, management of the company approved a restructuring program designed to align the company’s organizational structure and geographic footprint with the operational needs of each function as the company prepares for the intended separation of its businesses (the “2026 Restructuring Actions”). The restructuring actions primarily consist of workforce reductions across commercial and functional support areas and are intended to right‑size the organization and support the future standalone operating models. The restructuring actions are expected to be substantially complete by December 2026.
The company expects to incur aggregate pre‑tax restructuring and asset related charges of approximately $70 million to $80 million in connection with the 2026 Restructuring Actions, consisting solely of severance and related benefit costs. Reductions in workforce are subject to local regulatory requirements. For the three months ended March 31, 2026, the company recorded pre‑tax restructuring and asset related charges of $78 million, which consist entirely of severance and related benefit costs and are classified as corporate‑related charges. At March 31, 2026, the restructuring liability was $78 million.
Cash payments related to the 2026 Restructuring Actions are expected to total approximately $70 million to $80 million. Through March 31, 2026, the company has made no payments related to these restructuring actions; however, cash payments are expected to be paid over the course of the next year, with substantially all payments anticipated to occur during 2026. The company does not anticipate material revisions to the estimated costs or timing of payments related to the 2026 Restructuring Actions.
Crop Protection Operations Strategy Restructuring Program
On November 5, 2023, management of the company approved a plan to further optimize its Crop Protection network of manufacturing and external partners (the “Crop Protection Operations Strategy Restructuring Program”). The plan includes the exit of the company's production activities at its site in Pittsburg, California, as well as ceasing operations in select manufacturing lines at other locations. In October 2024, management of the company amended the Crop Protection Operations Strategy Restructuring Program to include updates to its previous estimates and decommissioning and demolition costs associated with the ceasing of operations, primarily at the Pittsburg, California site.
The company expects to record aggregate pre-tax restructuring and asset related charges of $650 million to $700 million, comprised of $85 million to $105 million of severance and related benefit costs, $320 million to $340 million of asset related and impairment charges and $245 million to $255 million of costs related to exiting the company’s production activities and ceasing operations (inclusive of contract terminations and decommissioning and demolition costs). Decommissioning and demolition costs are expensed on an as-incurred basis. Reductions in workforce are subject to local regulatory requirements. Through the first quarter of 2026, the company recorded net pre-tax restructuring and asset related charges of $625 million inception-to-date under the Crop Protection Operations Strategy Restructuring Program, consisting of $102 million of severance and related benefit costs, $340 million of asset related and impairment charges, $82 million of decommissioning and demolition costs, and $101 million of costs related to contract terminations.
Cash payments related to these charges are anticipated to be $330 million to $360 million, which primarily relate to the payment of severance and related benefits, decommissioning and demolition costs and contract terminations. Through the first quarter of 2026, the company paid $228 million associated with these charges. The restructuring actions associated with these charges are expected to be substantially complete by the end of 2026.
The following table is a summary of charges incurred related to the Crop Protection Operations Strategy Restructuring Program for the three months ended March 31, 2026 and 2025:
|
|
|
|
|
|
|
|
|
|
Three Months Ended March 31, |
|
(In millions) |
2026 |
|
2025 |
|
Severance and related benefit costs 1 |
|
$ |
— |
|
|
$ |
9 |
|
Asset related charges 2 |
|
|
— |
|
|
|
12 |
|
Decommissioning and demolition costs 2 |
|
|
12 |
|
|
|
5 |
|
Contract termination charges 2 |
|
|
2 |
|
|
|
— |
|
Total restructuring and asset related charges - net |
|
$ |
14 |
|
|
$ |
26 |
|
1.Reflects corporate-related charges.
2.Reflects charges which are substantially all associated with the Crop Protection segment
The following table summarizes changes to liability balances related to the Crop Protection Operations Strategy Restructuring Program for the quarter ended March 31, 2026:
|
|
|
|
|
|
|
|
|
|
|
|
|
|
|
|
|
(In millions) |
Severance and Related Benefit Costs |
|
Decommissioning and Demolition Costs |
|
Contract Termination Charges |
|
Total |
|
Balance at December 31, 2025 |
|
$ |
32 |
|
|
$ |
8 |
|
|
$ |
54 |
|
|
$ |
94 |
|
Charges to income from continuing operations |
|
|
— |
|
|
|
12 |
|
|
|
2 |
|
|
|
14 |
|
Payments |
|
|
(6 |
) |
|
|
(13 |
) |
|
|
(32 |
) |
|
|
(51 |
) |
Balance at March 31, 2026 |
|
$ |
26 |
|
|
$ |
7 |
|
|
$ |
24 |
|
|
$ |
57 |
|
NOTE 5 — SUPPLEMENTARY INFORMATION
|
|
|
|
|
|
|
|
|
Other Income (Expense) - Net |
Three Months Ended March 31, |
|
(In millions) |
2026 |
|
2025 |
|
Interest income |
|
$ |
34 |
|
|
$ |
32 |
|
Equity in earnings (losses) of affiliates - net |
|
|
16 |
|
|
|
11 |
|
Net gain (loss) on sales of businesses and other assets |
|
|
(3 |
) |
|
|
4 |
|
Net exchange gains (losses) 1 |
|
|
(67 |
) |
|
|
(27 |
) |
Non-operating pension and other post employment benefit credits (costs) 2 |
|
|
7 |
|
|
|
(6 |
) |
Miscellaneous income (expenses) - net 3 |
|
|
(104 |
) |
|
|
1 |
|
Other income (expense) - net |
|
$ |
(117 |
) |
|
$ |
15 |
|
1.Includes net pre-tax exchange gains (losses) of $4 million and $— million associated with impacts from the devaluation of the Argentine Peso for the three months ended March 31, 2026 and 2025, respectively.
2.Includes non-service related components of net periodic benefit credits (costs), comprised of interest cost, expected return on plan assets, amortization of unrecognized gain (loss), amortization of prior service benefit and settlement gain (loss).
3.The three months ended March 31, 2026 includes a settlement charge associated with the Crop Protection loyalty program multi-district litigation plaintiffs and tax expense related to intellectual property realignment. See Note 12 - Commitments and Contingent Liabilities, to the interim Consolidated Financial Statements, for additional information related to the litigation matter. The three months ended March 31, 2025 includes miscellaneous immaterial items.
The following table summarizes the impacts of the company's foreign currency hedging program on the company's results of operations. The company routinely uses foreign currency exchange contracts to offset its net exposures, by currency, related to the foreign currency-denominated monetary assets and liabilities. The objective of this program is to maintain an approximately balanced position in foreign currencies in order to minimize, on an after-tax basis, the effects of exchange rate changes on net monetary asset positions. The hedging program gains (losses) are largely taxable (tax deductible) in the U.S., whereas the offsetting exchange gains (losses) on the remeasurement of the net monetary asset positions are often not taxable (tax deductible) in their local jurisdictions. The net pre-tax exchange gains (losses) are recorded in other income (expense) - net and the related tax impact is recorded in provision for (benefit from) income taxes on continuing operations in the interim Consolidated Statements of Operations.
|
|
|
|
|
|
|
|
|
|
Three Months Ended March 31, |
|
(In millions) |
2026 |
|
2025 |
|
Subsidiary Monetary Position Gain (Loss) |
|
|
|
|
|
|
Pre-tax exchange gain (loss) |
|
$ |
85 |
|
|
$ |
(47 |
) |
Local tax (expenses) benefits |
|
|
(24 |
) |
|
|
(1 |
) |
Net after-tax impact from subsidiary exchange gain (loss) |
|
$ |
61 |
|
|
$ |
(48 |
) |
|
|
|
|
|
|
|
Hedging Program Gain (Loss) |
|
|
|
|
|
|
Pre-tax exchange gain (loss) |
|
$ |
(152 |
) |
|
$ |
20 |
|
Tax (expenses) benefits |
|
|
34 |
|
|
|
(2 |
) |
Net after-tax impact from hedging program exchange gain (loss) |
|
$ |
(118 |
) |
|
$ |
18 |
|
|
|
|
|
|
|
|
Total Exchange Gain (Loss) |
|
|
|
|
|
|
Pre-tax exchange gain (loss) |
|
$ |
(67 |
) |
|
$ |
(27 |
) |
Tax (expenses) benefits |
|
|
10 |
|
|
|
(3 |
) |
Net after-tax exchange gain (loss) |
|
$ |
(57 |
) |
|
$ |
(30 |
) |
Cash, cash equivalents and restricted cash equivalents
The following table provides a reconciliation of cash and cash equivalents and restricted cash equivalents presented in the interim Consolidated Balance Sheets to the total cash, cash equivalents and restricted cash equivalents presented in the interim Consolidated Statements of Cash Flows. Corteva classifies restricted cash equivalents as current or noncurrent based on the nature of the restrictions, and includes them within other current assets and other assets, respectively, in the interim Consolidated Balance Sheets.
|
|
|
|
|
|
|
|
|
|
|
|
|
(In millions) |
March 31, 2026 |
|
December 31, 2025 |
|
March 31, 2025 |
|
Cash and cash equivalents |
|
$ |
1,964 |
|
|
$ |
4,521 |
|
|
$ |
2,008 |
|
Restricted cash equivalents |
|
|
177 |
|
|
|
204 |
|
|
|
287 |
|
Total cash, cash equivalents and restricted cash equivalents |
|
$ |
2,141 |
|
|
$ |
4,725 |
|
|
$ |
2,295 |
|
Restricted cash equivalents primarily relates to a trust funded by EIDP for cash obligations under certain non-qualified benefit and deferred compensation plans due to the Merger, which was a change in control event, and contributions to escrow accounts established for the settlement of certain legal matters and the settlement of legacy PFAS matters and the associated qualified spend. All of the company's restricted cash equivalents are classified as current as of March 31, 2026, December 31, 2025 and March 31, 2025, except for the $15 million MOU Escrow Account balance at March 31, 2025. See Note 12 - Commitments and Contingent Liabilities, to the interim Consolidated Financial Statements, for additional information.
Accounts payable
At March 31, 2026, December 31, 2025 and March 31, 2025, accounts payable was $4,187 million, $4,398 million and $3,905 million, respectively, which includes accounts payable - trade of $2,066 million, $2,871 million, and $2,000 million, respectively. Included in accounts payable – trade was seed grower compensation of approximately $120 million, $420 million, and $145 million at March 31, 2026, December 31, 2025 and March 31, 2025, respectively, which is measured at fair value using Level 2 inputs for each period presented.
NOTE 6 — INCOME TAXES
The effective tax rate for the three months ended March 31, 2026 and 2025 was 15.5 percent and 14.9 percent, respectively.
During the three months ended March 31, 2026 and 2025, the company recognized $51 million and $27 million, respectively, of net tax benefits for income taxes on continuing operations associated with changes in deferred taxes and accruals for certain prior year tax positions in various jurisdictions as well as from stock-based compensation. During the three months ended March 31, 2026, the company recognized a $35 million tax benefit related to intellectual property realignment. During the three months ended March 31, 2025, the company recognized a $55 million deferred tax benefit associated with a change in a legal entity’s U.S. tax characterization.
The company routinely uses foreign currency exchange contracts to offset its net exposures, by currency, related to the foreign currency-denominated monetary assets and liabilities. The objective of the program, which resides in the U.S., is to maintain an approximately balanced position in foreign currencies in order to minimize, on an after-tax basis, the effects of exchange rate changes on net monetary asset positions, which can drive material impacts on the company's effective tax rate. For further discussion of pre-tax and after-tax
impacts of the company's foreign currency hedging program and net monetary asset programs, refer to Note 5 - Supplementary Information, to the interim Consolidated Financial Statements.
NOTE 7 — EARNINGS PER SHARE OF COMMON STOCK
The following tables provide earnings per share calculations for the periods indicated below:
|
|
|
|
|
|
|
|
|
Net Income (Loss) for Earnings (Loss) Per Share Calculations - Basic and Diluted |
Three Months Ended March 31, |
|
(In millions) |
2026 |
|
2025 |
|
Income (loss) from continuing operations after income taxes |
|
$ |
725 |
|
|
$ |
667 |
|
Net income (loss) attributable to continuing operations noncontrolling interests |
|
|
3 |
|
|
|
4 |
|
Income (loss) from continuing operations available to Corteva common stockholders |
|
|
722 |
|
|
|
663 |
|
Income (loss) from discontinued operations available to Corteva common stockholders |
|
|
(2 |
) |
|
|
(11 |
) |
Net income (loss) available to common stockholders |
|
$ |
720 |
|
|
$ |
652 |
|
|
|
|
|
|
|
|
|
|
Earnings (Loss) Per Share Calculations - Basic |
Three Months Ended March 31, |
|
(Dollars per share) |
2026 |
|
2025 |
|
Earnings (loss) per share of common stock from continuing operations |
|
$ |
1.07 |
|
|
$ |
0.97 |
|
Earnings (loss) per share of common stock from discontinued operations |
|
|
— |
|
|
|
(0.02 |
) |
Earnings (loss) per share of common stock |
|
$ |
1.07 |
|
|
$ |
0.95 |
|
|
|
|
|
|
|
|
|
|
Earnings (Loss) Per Share Calculations - Diluted |
Three Months Ended March 31, |
|
(Dollars per share) |
2026 |
|
2025 |
|
Earnings (loss) per share of common stock from continuing operations |
|
$ |
1.07 |
|
|
$ |
0.97 |
|
Earnings (loss) per share of common stock from discontinued operations |
|
|
— |
|
|
|
(0.02 |
) |
Earnings (loss) per share of common stock |
|
$ |
1.07 |
|
|
$ |
0.95 |
|
|
|
|
|
|
|
|
|
|
Share Count Information |
Three Months Ended March 31, |
|
(Shares in millions) |
2026 |
|
2025 |
|
Weighted-average common shares - basic |
|
|
672.5 |
|
|
|
684.9 |
|
Plus: dilutive effect of equity compensation plans 1 |
|
|
1.1 |
|
|
|
1.7 |
|
Weighted-average common shares - diluted |
|
|
673.6 |
|
|
|
686.6 |
|
Potential shares of common stock excluded from EPS calculations 2 |
|
|
2.6 |
|
|
|
3.1 |
|
1.Diluted earnings (loss) per share considers the impact of potentially dilutive securities except in periods in which there is a loss because the inclusion of the potential common shares would have an anti-dilutive effect.
2.These outstanding potential shares of common stock relating to stock options, restricted stock units and performance-based restricted stock units were excluded from the calculation of diluted earnings (loss) per share because (i) the effect of including them would have been anti-dilutive; or (ii) the performance metrics have not yet been achieved for the outstanding potential shares relating to performance-based restricted stock units, which are deemed to be contingently issuable.
NOTE 8 — ACCOUNTS AND NOTES RECEIVABLE - NET
|
|
|
|
|
|
|
|
|
|
|
|
|
(In millions) |
March 31, 2026 |
|
December 31, 2025 |
|
March 31, 2025 |
|
Accounts receivable – trade 1 |
|
$ |
7,262 |
|
|
$ |
4,881 |
|
|
$ |
6,765 |
|
Notes receivable – trade 1,2 |
|
|
497 |
|
|
|
153 |
|
|
|
486 |
|
Other 3 |
|
|
1,329 |
|
|
|
1,337 |
|
|
|
1,043 |
|
Total accounts and notes receivable - net |
|
$ |
9,088 |
|
|
$ |
6,371 |
|
|
$ |
8,294 |
|
1.Accounts and notes receivable – trade are net of allowances of $286 million, $241 million and $190 million at March 31, 2026, December 31, 2025 and March 31, 2025, respectively.
2.Notes receivable – trade primarily consists of receivables for deferred payment loan programs for the sale of seed and crop protection products to customers. These loans have terms of one year or less and are primarily concentrated in North America. The company maintains a rigid approval process for extending credit to customers in order to manage overall risk and exposure associated with credit losses. As of March 31, 2026, December 31, 2025 and March 31, 2025, there were no significant impairments related to current loan agreements.
3.Other includes receivables in relation to indemnification assets, royalties, value added tax, general sales tax and other taxes. No individual group represents more than 5 percent of total current assets. In addition, Other includes amounts due from nonconsolidated affiliates of $111 million, $117 million and $130 million as of March 31, 2026, December 31, 2025 and March 31, 2025, respectively.
Accounts and notes receivable are carried at the expected amount to be collected, which approximates fair value. The company establishes the allowance for doubtful receivables using a loss-rate method where the loss rate is developed using past events, historical experience, current conditions and forecasts that affect the collectability of the financial assets.
The following table summarizes changes in the allowance for doubtful receivables for the three months ended March 31, 2025 and 2026:
|
|
|
|
|
(In millions) |
|
|
|
2025 |
|
|
|
Balance at December 31, 2024 |
|
$ |
179 |
|
Net provision for credit losses |
|
|
21 |
|
Other - net of write-offs charged against allowance |
|
|
(10 |
) |
Balance at March 31, 2025 |
|
$ |
190 |
|
2026 |
|
|
|
Balance at December 31, 2025 |
|
$ |
241 |
|
Net provision for credit losses |
|
|
49 |
|
Other - net of write-offs charged against allowance |
|
|
(4 |
) |
Balance at March 31, 2026 |
|
$ |
286 |
|
The company enters into various factoring agreements with third-party financial institutions to sell its trade receivables under both recourse and non-recourse agreements in exchange for cash proceeds. These financing arrangements result in a transfer of the company's receivables and risks to the third party. As these transfers qualify as true sales under the applicable accounting guidance, the receivables are derecognized from the interim Consolidated Balance Sheets upon transfer, and the company receives a payment for the receivables from the third party within a mutually agreed upon time period. For arrangements involving an element of recourse, which is typically provided through a guarantee of accounts in the event of customer default, the guarantee obligation is measured using market data from similar transactions and reported as a current liability in the interim Consolidated Balance Sheets.
Trade receivables sold under these agreements were $27 million and $26 million for the three months ended March 31, 2026 and 2025, respectively. The trade receivables sold that remained outstanding under these agreements which include an element of recourse as of March 31, 2026, December 31, 2025 and March 31, 2025 were $6 million, $17 million and $16 million, respectively. The net proceeds received are included in cash provided by (used for) operating activities in the interim Consolidated Statements of Cash Flows. The difference between the carrying amount of the trade receivables sold and the sum of the cash received is recorded as a loss on sale of receivables in other income (expense) - net, in the interim Consolidated Statements of Operations. The loss on sale of receivables for the three months ended March 31, 2026 and 2025 was not material. See Note 12 - Commitments and Contingent Liabilities, to the interim Consolidated Financial Statements, for additional information on the company’s guarantees.
NOTE 9 — INVENTORIES
|
|
|
|
|
|
|
|
|
|
|
|
|
(In millions) |
March 31, 2026 |
|
December 31, 2025 |
|
March 31, 2025 |
|
Finished products |
|
$ |
3,044 |
|
|
$ |
2,956 |
|
|
$ |
2,827 |
|
Semi-finished products |
|
|
1,749 |
|
|
|
2,276 |
|
|
|
1,881 |
|
Raw materials and supplies |
|
|
409 |
|
|
|
435 |
|
|
|
424 |
|
Total inventories |
|
$ |
5,202 |
|
|
$ |
5,667 |
|
|
$ |
5,132 |
|
NOTE 10 — OTHER INTANGIBLE ASSETS
The gross carrying amounts and accumulated amortization of other intangible assets by major class are as follows:
|
|
|
|
|
|
|
|
|
|
|
|
|
|
|
|
|
|
|
|
|
|
|
|
|
|
|
|
|
|
|
|
|
|
|
|
|
|
March 31, 2026 |
|
December 31, 2025 |
|
March 31, 2025 |
|
(In millions) |
Gross |
|
Accumulated
Amortization |
|
Net |
|
Gross |
|
Accumulated
Amortization |
|
Net |
|
Gross |
|
Accumulated
Amortization |
|
Net |
|
Intangible assets subject to amortization (finite-lived): |
|
|
|
|
|
|
|
|
|
|
|
|
|
|
|
|
|
|
|
|
|
|
|
|
|
|
|
Germplasm |
|
$ |
6,291 |
|
|
$ |
(1,649 |
) |
|
$ |
4,642 |
|
|
$ |
6,291 |
|
|
$ |
(1,587 |
) |
|
$ |
4,704 |
|
|
$ |
6,291 |
|
|
$ |
(1,399 |
) |
|
$ |
4,892 |
|
Customer-related |
|
|
2,398 |
|
|
|
(1,059 |
) |
|
|
1,339 |
|
|
|
2,394 |
|
|
|
(1,024 |
) |
|
|
1,370 |
|
|
|
2,349 |
|
|
|
(896 |
) |
|
|
1,453 |
|
Developed technology |
|
|
1,854 |
|
|
|
(1,313 |
) |
|
|
541 |
|
|
|
1,860 |
|
|
|
(1,283 |
) |
|
|
577 |
|
|
|
1,838 |
|
|
|
(1,197 |
) |
|
|
641 |
|
Trademarks/trade names |
|
|
2,056 |
|
|
|
(488 |
) |
|
|
1,568 |
|
|
|
2,056 |
|
|
|
(466 |
) |
|
|
1,590 |
|
|
|
2,056 |
|
|
|
(402 |
) |
|
|
1,654 |
|
Other 1 |
|
|
368 |
|
|
|
(316 |
) |
|
|
52 |
|
|
|
368 |
|
|
|
(313 |
) |
|
|
55 |
|
|
|
388 |
|
|
|
(315 |
) |
|
|
73 |
|
Total other intangible assets with finite lives |
|
|
12,967 |
|
|
|
(4,825 |
) |
|
|
8,142 |
|
|
|
12,969 |
|
|
|
(4,673 |
) |
|
|
8,296 |
|
|
|
12,922 |
|
|
|
(4,209 |
) |
|
|
8,713 |
|
Intangible assets not subject to amortization (indefinite-lived): |
|
|
|
|
|
|
|
|
|
|
|
|
|
|
|
|
|
|
|
|
|
|
|
|
|
|
|
In-process research and development |
|
|
5 |
|
|
|
— |
|
|
|
5 |
|
|
|
5 |
|
|
|
— |
|
|
|
5 |
|
|
|
5 |
|
|
|
— |
|
|
|
5 |
|
Total other intangible assets with indefinite lives |
|
|
5 |
|
|
|
— |
|
|
|
5 |
|
|
|
5 |
|
|
|
— |
|
|
|
5 |
|
|
|
5 |
|
|
|
— |
|
|
|
5 |
|
Total other intangible assets |
|
$ |
12,972 |
|
|
$ |
(4,825 |
) |
|
$ |
8,147 |
|
|
$ |
12,974 |
|
|
$ |
(4,673 |
) |
|
$ |
8,301 |
|
|
$ |
12,927 |
|
|
$ |
(4,209 |
) |
|
$ |
8,718 |
|
1.Primarily consists of sales and farmer networks, marketing and manufacturing alliances and noncompetition agreements.
The aggregate pre-tax amortization expense from continuing operations for definite-lived intangible assets was $160 million and $162 million for the three months ended March 31, 2026 and 2025, respectively. The current estimated aggregate pre-tax amortization expense from continuing operations for the remainder of 2026 and each of the next five years is approximately $478 million, $577 million, $555 million, $532 million, $522 million and $522 million, respectively.
NOTE 11 — SHORT-TERM BORROWINGS, LONG-TERM DEBT AND AVAILABLE CREDIT FACILITIES
The following tables summarize Corteva's short-term borrowings and long-term debt:
|
|
|
|
|
|
|
|
|
|
|
|
|
Short-term borrowings |
|
|
|
|
|
|
|
|
|
(In millions) |
March 31, 2026 |
|
December 31, 2025 |
|
March 31, 2025 |
|
Commercial paper |
|
$ |
667 |
|
|
$ |
— |
|
|
$ |
1,357 |
|
364-Day Revolving Credit Facility |
|
|
— |
|
|
|
— |
|
|
|
— |
|
Other loans - various currencies |
|
|
216 |
|
|
|
112 |
|
|
|
261 |
|
Long-term debt payable within one year |
|
|
791 |
|
|
|
782 |
|
|
|
673 |
|
Total short-term borrowings |
|
$ |
1,674 |
|
|
$ |
894 |
|
|
$ |
2,291 |
|
|
|
|
|
|
|
|
|
|
|
|
|
|
|
|
|
|
|
|
|
|
|
|
|
|
Long-term debt |
|
|
March 31, 2026 |
|
December 31, 2025 |
|
March 31, 2025 |
|
(In millions) |
|
Amount |
|
|
Weighted Average Rate |
|
|
Amount |
|
|
Weighted Average Rate |
|
|
Amount |
|
|
Weighted Average Rate |
|
Promissory notes and debentures: |
|
|
|
|
|
|
|
|
|
|
|
|
|
|
|
|
|
|
Maturing in July 2025 |
|
$ |
— |
|
|
|
|
|
$ |
— |
|
|
|
|
|
$ |
500 |
|
|
|
1.70 |
% |
Maturing in May 2026 |
|
|
600 |
|
|
|
4.50 |
% |
|
|
600 |
|
|
|
4.50 |
% |
|
|
600 |
|
|
|
4.50 |
% |
Maturing in July 2030 |
|
|
500 |
|
|
|
2.30 |
% |
|
|
500 |
|
|
|
2.30 |
% |
|
|
500 |
|
|
|
2.30 |
% |
Maturing in May 2032 |
|
|
500 |
|
|
|
5.125 |
% |
|
|
500 |
|
|
|
5.125 |
% |
|
|
— |
|
|
|
|
Maturing in May 2033 |
|
|
600 |
|
|
|
4.80 |
% |
|
|
600 |
|
|
|
4.80 |
% |
|
|
600 |
|
|
|
4.80 |
% |
Other loans: |
|
|
|
|
|
|
|
|
|
|
|
|
|
|
|
|
|
|
Foreign currency loans |
|
|
191 |
|
|
|
15.65 |
% |
|
|
182 |
|
|
|
12.70 |
% |
|
|
173 |
|
|
|
12.70 |
% |
Medium-term notes, varying maturities through 2041 |
|
|
97 |
|
|
|
3.63 |
% |
|
|
102 |
|
|
|
3.76 |
% |
|
|
104 |
|
|
|
4.27 |
% |
Less: Unamortized debt discount and issuance costs |
|
|
15 |
|
|
|
|
|
|
16 |
|
|
|
|
|
|
12 |
|
|
|
|
Less: Long-term debt due within one year |
|
|
791 |
|
|
|
|
|
|
782 |
|
|
|
|
|
|
673 |
|
|
|
|
Total long-term debt |
|
$ |
1,682 |
|
|
|
|
|
$ |
1,686 |
|
|
|
|
|
$ |
1,792 |
|
|
|
|
The estimated fair value of the company's short-term and long-term borrowings, including interest rate financial instruments, was determined using Level 2 inputs within the fair value hierarchy. Based on quoted market prices for the same or similar issuances, or on current rates offered to the company for debt of the same remaining maturities, the fair value of the company's short-term borrowings approximated carrying value.
The fair value of the company’s long-term borrowings, including debt due within one year, was $2,448 million, $2,462 million and $2,404 million as of March 31, 2026, December 31, 2025 and March 31, 2025, respectively.
Debt Offering
In May 2025, the company issued $500 million of 5.125 percent Senior Notes due in May 2032 (the “May 2025 Debt Offering”). The proceeds were used to repay the $500 million senior notes that matured in July 2025.
Foreign Currency Loans
The company enters into short-term and long-term foreign currency loans from time-to-time by accessing uncommitted revolving credit lines to fund working capital needs of foreign subsidiaries in the normal course of business. Interest rates are variable and determined at the time of borrowing. Total unused bank credit lines on the short-term and long-term foreign currency loans at March 31, 2026 was approximately $69 million. The company’s short-term foreign currency loans have varying maturities through 2026. During the first quarter of 2026, the company's long-term foreign currency loans were amended to extend the maturity date to May 2026, which resulted in a corresponding change in the interest rate.
Available Committed Credit Facilities
The following table summarizes the company's credit facilities:
|
|
|
|
|
|
|
|
|
|
|
|
|
|
|
Committed and available credit facilities at March 31, 2026 |
|
|
|
|
|
|
|
|
|
|
|
|
(In millions) |
|
Effective Date |
|
Committed Credit |
|
|
Credit Available |
|
|
Maturity Date |
|
Interest |
Revolving Credit Facility |
|
June 2024 |
|
$ |
2,850 |
|
|
$ |
2,850 |
|
|
June 2029 |
|
Floating Rate |
Revolving Credit Facility |
|
June 2024 |
|
|
1,900 |
|
|
|
1,900 |
|
|
June 2027 |
|
Floating Rate |
364-Day Revolving Credit Facility |
|
February 2026 |
|
|
1,250 |
|
|
|
1,250 |
|
|
February 2027 |
|
Floating Rate |
Total committed and available credit facilities |
|
|
|
$ |
6,000 |
|
|
$ |
6,000 |
|
|
|
|
|
Revolving Credit Facilities
In May 2022, the company entered into a $3 billion, five-year revolving credit facility and a $2 billion, three-year revolving credit facility (the “Revolving Credit Facilities”) expiring in May 2027 and May 2025, respectively. Borrowings under the Revolving Credit Facilities will have an interest rate equal to Adjusted Term SOFR, which is Term SOFR plus 0.10 percent, plus the applicable margin. In June 2024, the Revolving Credit Facilities were refinanced for purposes of extending the maturity dates for the five-year and three-year revolving credit facilities to June 2029 and June 2027, respectively, and lowering the facility amount of the five-year revolving credit facility to $2.85 billion and the three-year revolving credit facility to $1.90 billion. The Revolving Credit Facilities may serve as a substitute to the company's commercial paper program, and can be used, from time to time, for general corporate purposes including, but not limited to, the funding of seasonal working capital needs. The Revolving Credit Facilities contain customary representations and warranties, affirmative and negative covenants and events of default that are typical for companies with similar credit ratings. Additionally, the Revolving Credit Facilities contain a financial covenant requiring that the ratio of total indebtedness to total capitalization for Corteva and its consolidated subsidiaries not exceed 0.60. At March 31, 2026, the company was in compliance with these covenants.
364-Day Revolving Credit Facility
In February 2026, the company amended its January 2023 (as amended in July 2023, January 2024, February 2024 and February 2025) 364-day revolving credit agreement (the “364-Day Revolving Credit Facility”), increasing the facility amount from $750 million to $1.25 billion, extending the expiration date to February 2027 and amending the interest rate to Term SOFR plus the applicable margin. In February 2025, the company amended the 364-Day Revolving Credit Facility, decreasing the facility amount from $1 billion to $750 million and extending the expiration date to February 2026. The 364-Day Revolving Credit Facility includes a provision under which the company may convert any advances outstanding prior to the maturity date into term loans having a maturity date up to one year later. The 364-Day Revolving Credit Facility contains customary representations and warranties, affirmative and negative covenants and events of default that are typical for companies with similar credit ratings. Additionally, the 364-Day Revolving Credit Facility contains a financial covenant requiring that the ratio of total indebtedness to total capitalization for Corteva and its consolidated subsidiaries not exceed 0.60. At March 31, 2026, the company was in compliance with these covenants.
NOTE 12 — COMMITMENTS AND CONTINGENT LIABILITIES
Guarantees
Indemnifications
In connection with acquisitions and divestitures, the company has indemnified respective parties against certain liabilities that may arise in connection with these transactions and business activities prior to the completion of the transactions. The term of these indemnifications, which typically pertain to environmental, tax and product liabilities, is generally indefinite. In addition, the company indemnifies its duly elected or appointed directors and officers to the fullest extent permitted by Delaware law, against liabilities incurred as a result of their activities for the company, such as adverse judgments relating to litigation matters. If the indemnified party were to incur a liability or have a liability increase as a result of a successful claim, pursuant to the terms of the indemnification, the company would be required to reimburse the indemnified party. The maximum amount of potential future payments is generally unlimited. See below for additional information relating to the indemnification obligations under the Chemours Separation Agreement and the Corteva Separation Agreement.
Obligations for Supplier Finance Programs
The company enters into supplier finance programs with various finance providers in which the company agrees to pay these finance providers the stated amount of confirmed invoices from participating suppliers by the original maturity date. The company or the finance provider may terminate the agreement upon providing, in most cases, at least thirty days’ written notice. The payment terms that the company has with its finance providers under supplier finance programs are less than one year. At March 31, 2026, December 31, 2025 and March 31, 2025, the outstanding obligations under supplier finance programs was $146 million, $121 million and $163 million, respectively, and included within accounts payable in the interim Consolidated Balance Sheets.
The rollforward of the company’s outstanding obligations confirmed as valid under its supplier finance programs for the period ended March 31, 2026 is as follows:
|
|
|
|
|
(In millions) |
|
|
|
Confirmed obligations outstanding at December 31, 2025 |
|
$ |
121 |
|
Invoices confirmed during the period |
|
|
176 |
|
Confirmed invoices paid during the period |
|
|
(151 |
) |
Confirmed obligations outstanding at March 31, 2026 |
|
$ |
146 |
|
Obligations for Customers and Other Third Parties
The company has directly guaranteed various debt obligations under agreements with third parties related to customers and other third parties. At March 31, 2026, December 31, 2025 and March 31, 2025, the company had directly guaranteed $78 million, $71 million and $73 million, respectively, of such obligations. These amounts represent the maximum potential amount of future (undiscounted) payments that the company could be required to make under the guarantees in the event of default by the guaranteed party. The maximum future payments include $4 million, $5 million and $7 million at March 31, 2026, December 31, 2025 and March 31, 2025, respectively, of guarantees related to the various factoring agreements into which the company enters with third-party financial institutions to sell its trade receivables. See Note 8 - Accounts and Notes Receivable - Net, to the interim Consolidated Financial Statements, for additional information.
The maximum future payments also include agreements with lenders to establish programs that provide financing for select customers. The terms of the guarantees are equivalent to the terms of the customer loans that are primarily made to finance customer invoices. The total amounts owed from customers to the lenders relating to these agreements was $138 million, $234 million and $130 million at March 31, 2026, December 31, 2025 and March 31, 2025, respectively.
The company assesses the payment/performance risk by assigning default rates based on the duration of the guarantees. These default rates are assigned based on the external credit rating of the counterparty or through internal credit analysis and historical default history for counterparties that do not have published credit ratings. For counterparties without an external rating or available credit history, a cumulative average default rate is used.
Indemnifications under Separation Agreements
The company has entered into various agreements where the company is indemnified for certain liabilities. The term of this indemnification is generally indefinite, with exceptions, and includes defense costs and expenses, as well as monetary and non-monetary settlements and judgments. In connection with the recognition of liabilities related to these matters, the company records an indemnification asset when recovery is deemed probable.
Chemours Separation Agreement (Performance Chemicals)
Pursuant to the Chemours Separation Agreement resulting from the 2015 spin-off of the Performance Chemicals segment from Historical DuPont, The Chemours Company (“Chemours”) indemnifies the company against certain litigation, environmental, workers' compensation and other liabilities that arose prior to the distribution. In 2017, the Chemours Separation Agreement was amended to provide for a limited sharing of potential future liabilities related to alleged historical releases of perfluorooctanoic acids and its ammonium salts (“PFOA”) for a five-year period that began on July 6, 2017. Additionally, in January 2021, a binding memorandum of understanding as described below replaced the potential future liability sharing arrangements established in the 2017 amendment to the Chemours Separation Agreement. At March 31, 2026, December 31, 2025 and March 31, 2025, the indemnification assets from Chemours were $135 million, $138 million, and $40 million, respectively, within accounts and notes receivable - net and $470 million, $470 million and $301 million, respectively, within other assets in the interim Consolidated Balance Sheets. These indemnification assets are regularly assessed for collectability and the company has concluded that these assets are recoverable. The liabilities subject to Chemours indemnification are considered stray liabilities under the Corteva Separation Agreement. Therefore, if Chemours fails to indemnify the company, these stray liabilities are subject to proportionate cost sharing between Corteva and DuPont, on a 29 percent and 71 percent basis, respectively, as further described in this footnote below.
On May 13, 2019, Chemours filed suit in the Delaware Court of Chancery against DuPont, EIDP, and Corteva, seeking, among other things, to limit its responsibility for the litigation and environmental liabilities allocated to and assumed by Chemours under the Chemours Separation Agreement (the “Delaware Litigation”). On March 30, 2020, the Court of Chancery granted a motion to dismiss. On December 15, 2020, the Delaware Supreme Court affirmed the judgment of the Court of Chancery. Meanwhile, a confidential arbitration process regarding the same and other claims proceeded (the “Arbitration”).
On January 22, 2021, Chemours, DuPont, Corteva and EIDP entered into a binding memorandum of understanding resolving legal disputes originating from the Delaware Litigation and Arbitration, and establishing a cost sharing arrangement and escrow account supporting and managing potential future legacy per- and polyfluoroalkyl substances (“PFAS”) liabilities arising out of pre-July 1, 2015 conduct (the “MOU”). The MOU replaced a prior 2017 amendment to the Chemours Separation Agreement. According to the terms of the MOU, Corteva and DuPont together, on one hand, and Chemours, on the other hand, agreed to a 50-50 split of certain qualified expenses related to PFAS liabilities incurred over a term not to exceed twenty years or $4 billion of qualified spend and escrow account contributions (see below for discussion of the escrow account) in the aggregate. DuPont’s and Corteva’s 50 percent share under the MOU will be limited to $2 billion, including qualified expenses and escrow account contributions. These expenses and escrow account contributions will be subject to the existing Letter Agreement, under which DuPont and Corteva will each bear 50 percent of the first $300 million (up to $150 million each), and thereafter DuPont bears 71 percent and Corteva bears the remaining 29 percent. Under the terms of the MOU, Corteva’s estimated aggregate share of the potential $2 billion is approximately $600 million.
In order to support and manage any potential future PFAS liabilities, the parties also agreed to establish an escrow account (“MOU Escrow Account”). The MOU provides that (1) no later than each of September 30, 2021 and September 30, 2022, Chemours shall deposit $100 million into an escrow account and DuPont and Corteva shall together deposit $100 million in the aggregate into an escrow account and (2) no later than September 30 of each subsequent year through and including 2028, Chemours shall deposit $50 million into an escrow account and DuPont and Corteva shall together deposit $50 million in the aggregate into an escrow account. Subject to the terms and conditions set forth in the MOU, each party may be permitted to defer funding in any year (excluding 2021). Over this period, Chemours will deposit a total of $500 million in the account and DuPont and Corteva will deposit an additional $500 million pursuant to the terms of the Letter Agreement. Additionally, if on December 31, 2028, the balance of the escrow account (including interest) is less than $700 million, Chemours will make 50 percent of the deposits and DuPont and Corteva together will make 50 percent of the deposits necessary to restore the balance of the escrow account to $700 million, pursuant to the terms of the Letter Agreement. Such payments will be made in a series of consecutive annual equal installments commencing on September 30, 2029, pursuant to the escrow account replenishment terms as set forth in the MOU. The MOU provides that no withdrawals from the MOU Escrow Account can be made before year six, except to fund mutually agreed upon third-party settlements in excess of $125 million. Starting with year six, withdrawals can only be made to fund qualified spend if the parties’ aggregate qualified spend in that particular year is greater than $200 million. Beginning with year 11, the amounts in the MOU Escrow Account can be used to fund any qualified spend.
In April 2024, Corteva, EIDP, DuPont, and Chemours received a final judgment resolving all drinking water claims related to PFAS of a defined class of U.S. public water systems that serve the vast majority of the United States population (the “Nationwide Water District Settlement”). In connection with the Nationwide Water District Settlement, the MOU was supplemented to waive funding due to the MOU Escrow Account by Chemours, DuPont and Corteva for 2023 provided that each party fully funds its portion of the Nationwide Water District Settlement and said settlement is consummated. The funding obligation to the MOU Escrow Account with respect to 2024 and due September 30, 2024 was to be waived if (i) between October 1, 2023 and September 30, 2024, the parties had entered into settlement agreements resolving liabilities under the MOU that in the aggregate exceed $100 million; (ii) each company had fully funded its respective share, in accordance with the MOU, of such settlements; and (iii) such settlements were consummated. No such waiver was triggered for the 2024 escrow funding obligation due September 30, 2024 and, therefore, the company made its required contribution.
The company made its annual installment deposits due to the MOU Escrow Account through March 31, 2026. The MOU escrow account contains $105 million as of March 31, 2026, representing the aggregate contributions from Chemours, DuPont and Corteva, less withdrawals to fund related settlements.
After the term of this arrangement, Chemours’ indemnification obligations under the original 2015 Chemours Separation Agreement, would continue unchanged, subject in each case to certain exceptions set out in the MOU. Under the MOU, Chemours waived specified claims regarding the construct of its 2015 spin-off transaction, and the parties dismissed the pending arbitration regarding those claims. Additionally, the parties have agreed to resolve the Ohio MDL PFOA personal injury litigation (as discussed below). The parties are expected to cooperate in good faith to enter into additional agreements reflecting the terms set forth in the MOU.
The Chemours Separation Agreement obligates Chemours to defend and indemnify EIDP in legacy asbestos cases. As of March 31, 2026, there were approximately 900 pending lawsuits, with most being allegations of personal injury from Historical DuPont contractors. At March 31, 2026, an accrual and related indemnification asset have been established for this matter, substantially all of which are recorded in other noncurrent obligations and other assets, respectively.
Corteva Separation Agreement
On April 1, 2019, in connection with the Dow Distribution, Corteva, DuPont and Dow entered into the Corteva Separation Agreement, the Tax Matters Agreement (“TMA”), the Employee Matters Agreement, and certain other agreements (collectively, the “Corteva Separation Agreements”). The Corteva Separation Agreements allocate among Corteva, DuPont and Dow assets, employees, certain liabilities and obligations (including its investments, property and employee benefits and tax-related assets and liabilities) and provides for indemnification obligation among the parties. Under the Corteva Separation Agreement, DuPont indemnifies Corteva against certain litigation, environmental, tax, workers' compensation and other liabilities that arose prior to the Corteva Distribution, Dow indemnifies Corteva against certain litigation, environmental, tax, workers' compensation and other liabilities that relate to the Historical Dow business, and Corteva indemnifies DuPont and Dow for certain liabilities.
Indemnification matters under the Corteva Separation Agreements contain dispute resolution clauses. Corteva and DuPont were pursuing a resolution of a matter under the terms of the TMA that had the potential to significantly impact the current carrying value of our indemnification liability. On September 15, 2025, the dispute resolution firm issued a decision resulting in no material impact to the current carrying value of our indemnification liability.
Under the Corteva Separation Agreements, certain legacy EIDP liabilities from discontinued and/or divested operations and businesses of EIDP (including Performance Chemicals) (a “stray liability”) were allocated to Corteva or DuPont. Costs and liabilities have been shared based on the terms of the Corteva Separation Agreement. All future stray liabilities are allocated to Corteva and DuPont proportionally on the basis of 29 percent and 71 percent, respectively, subject to a $1 million de minimis requirement.
On November 1, 2025, DuPont spun off its electronics business, Qnity Electronics, Inc. (“Qnity”). DuPont, Corteva and Qnity entered into a letter agreement, effective November 1, 2025, affirming that DuPont is not novated from its obligations with respect to Corteva for legacy liabilities allocated to Qnity in its spin-off (“Qnity Letter Agreement”). Additionally, under the Qnity Letter Agreement, Corteva has certain third-party beneficiary rights to enforce indemnity and payment obligations of DuPont's with respect to legacy liabilities allocated to Qnity subject to: (i) DuPont's consent; or (ii) Corteva's receipt of a judgment that includes payment obligations for legacy liabilities attributable to Qnity, and either DuPont does not use commercially reasonable efforts to enforce the payment obligation against Qnity, or DuPont files for bankruptcy.
At March 31, 2026, December 31, 2025 and March 31, 2025, the aggregate indemnification assets from DuPont and Dow were $103 million, $104 million and $40 million, respectively, within accounts and notes receivable - net and $283 million, $263 million and $138 million, respectively, within other assets in the interim Consolidated Balance Sheets. At March 31, 2026, December 31, 2025 and March 31, 2025, the aggregate indemnification liabilities to DuPont and Dow were $28 million, $26 million and $17 million, respectively, within accrued and other current liabilities and $103 million, $154 million and $149 million, respectively, within other noncurrent obligations in the interim Consolidated Balance Sheets.
Discontinued Operations Activity
The company recorded benefits (charges) of $(2) million and $(11) million for the three months ended March 31, 2026 and 2025, respectively, to income (loss) from discontinued operations after income taxes, in the interim Consolidated Statements of Operations. The after-tax charge for the three months ended March 31, 2026 and 2025 was driven by charges recognized relating to the MOU with Chemours and DuPont, relating to PFAS environmental remediation activities primarily at Chemours' Fayetteville Works facility, along with other environmental matters.
Litigation
The company is subject to various legal proceedings, including, but not limited to, product liability, intellectual property, antitrust, commercial, property damage, personal injury, environmental and regulatory matters arising out of the normal course of its current businesses or legacy EIDP businesses unrelated to Corteva’s current businesses but allocated to Corteva as part of the Corteva Separation from DuPont. It is not possible to predict the outcome of these various proceedings, as considerable uncertainty exists. The company records accruals for legal matters when the information available indicates that it is probable that a liability has been incurred and the amount of the loss can be reasonably estimated. Accruals may reflect the impact and status of negotiations, settlements, rulings, advice from counsel and other information and events that may pertain to a particular matter. For the litigation matters discussed below, management believes that it is reasonably possible that the company could incur liabilities in excess of amounts accrued, for which the ultimate liability could be material to the results of operations and the cash flows in the period recognized. However, the company is unable to estimate the possible loss beyond amounts accrued due to various reasons, including, among others, that the underlying matters are either in early stages and/or have significant factual issues to be resolved. In addition, even when the company believes it has substantial defenses, the company may consider settlement of matters if it believes it is in the best interest of the company.
At March 31, 2026, December 31, 2025 and March 31, 2025, current accrued litigation was $416 million, $874 million and $175 million respectively, within accrued and other current liabilities. A current indemnification asset of $182 million was recorded within accounts and notes receivable - net at March 31, 2026 in relation to the current accrued litigation. See the “Chemours Separation Agreement (Performance Chemicals)” and the “Corteva Separation Agreement” sections for further details on the indemnifications.
Bayer Dispute
In August 2022, Bayer filed a breach of contract/declaratory judgment lawsuit in Delaware state court against Corteva relating to an agrobacterium cross-license agreement and Enlist E3® soybeans. Bayer alleged that Corteva practiced two Bayer patents in developing Enlist E3® soybeans, and therefore, is entitled pursuant to the terms of the cross-license agreement to royalties for sales between 2019 through 2029, along with interest. In January 2025, the court issued several rulings precluding Corteva's invalidity and inequitable conduct defenses, while also aligning on key aspects of Corteva's patent claim construction. In May 2025, the Delaware state court granted Corteva’s motion for partial summary judgment agreeing that U.S. Supreme Court precedent precludes the collection of royalties after patent expiration. Bayer’s motion for reconsideration was denied in June 2025. In July 2025, a stipulated order allowed Bayer to appeal the summary judgment finding, while also allowing Corteva’s cross-appeal of the dismissal of its invalidity and inequitable conduct defenses.
In August 2022, Corteva filed a lawsuit against Bayer CropScience LLP and Monsanto Company (collectively “Bayer”) in federal court in Delaware for alleged infringement of Corteva’s patented AAD-1 herbicide resistance technology used in Enlist® corn. The complaint for this lawsuit was amended to include additional patents that are closely related to this patented technology for soybeans. Corteva seeks to enjoin Bayer from continuing to infringe, as well as appropriate monetary damages. Bayer has filed an answer to the complaint and has asserted various affirmative defenses including invalidity. In August 2023, the court issued a decision adopting Corteva’s claim construction for all five disputed patent terms subject to this litigation.
In December 2023, the Patent Trial and Appeal Board (“PTAB”) authorized an Inter Partes Review (“IPR”) proceeding initiated by Bayer to review the patentability of three patents subject to the AAD-1 litigation. Inari joined the IPR proceeding. In December 2024, the PTAB issued a decision invalidating these patents on the basis they were unpatentable. Corteva appealed this decision and Corteva's AAD-1 lawsuit remains stayed during pendency of the IPR appeal. Corteva holds numerous additional patents covering its Enlist® traits or Enlist® weed control system. Therefore, the IPR process is not expected to impact its ability to license and protect Enlist E3® traits.
In October 2022, Corteva filed a lawsuit against Bayer in Delaware state court seeking a declaration that, under the terms of Corteva’s licensing agreement and the law, Bayer is not entitled to collect patent royalties on the Roundup Ready® Corn 2 trait after Bayer’s U.S. patent protection expires, and therefore is no longer required to pay royalties under the licensing agreement and entitled to recover relevant royalties paid. In September 2024, the court granted Bayer’s motion for summary judgment. Corteva’s appeal was heard by the Delaware Supreme Court, en banc, in May 2025. Additionally, Corteva initiated arbitration of two additional agreements with Bayer seeking similar relief. The Delaware Supreme Court stayed the appeal proceedings pending resolution discussions between Corteva and Bayer.
As of January 2026, the parties agreed to settle the agrobacterium cross-license agreement dispute. In addition, Corteva and Bayer resolved several other disputes regarding post-patent royalties and other matters, including post-patent regulatory support, resulting in the termination or amendment of the related licenses, as applicable. As part of the resolution of these matters, the cross-license agreement has been terminated and Corteva agreed to drop its AAD-1 patent claims against Bayer, as well as a payment of $610 million of which approximately $546 million was paid through the first quarter of 2026 and the remainder due by September 15, 2026. Also as a result of the resolution of this litigation and the related license terminations and amendments, potential royalty obligations for Corteva's Enlist E3® soybeans, as well as future royalty payments due to Bayer under other licensing agreements in dispute were terminated. The settlement agreements support Corteva's product out-licensing growth in competitive corn, cotton and canola markets, including for the out-licensing of above and below ground triple-stack corn technology. In conjunction with resolution of these matters, the companies also agreed to new cotton licensing arrangements at terms reflective of market rates. There is no remaining litigation between the parties.
Federal Trade Commission Investigation
On May 26, 2020, Corteva received a subpoena from the Federal Trade Commission (“FTC”) directing it to submit documents pertaining to its Crop Protection products generally, as well as business plans, rebate programs, offers, pricing and marketing materials specifically related to its acetochlor, oxamyl, rimsulfuron and other related products in order to determine whether Corteva engaged in unfair methods of competition through anticompetitive conduct. Corteva has fully cooperated with all requests related to this subpoena. On September 29, 2022, the FTC, along with ten state attorneys general in California, Colorado, Illinois, Indiana, Iowa, Minnesota, Nebraska, Oregon, Wisconsin, and Texas, filed a lawsuit against Corteva and another competitor alleging the parties engaged in unfair methods of competition, unlawful conditioning of payments, unreasonably restrained trade, and have an unlawful monopoly (the “FTC lawsuit”). In December 2022, attorneys general in Tennessee and Washington joined the FTC lawsuit and the Arkansas state attorney general filed a separate lawsuit against Corteva and another competitor based on the allegations set forth in the FTC lawsuit. In July 2025, the Arkansas state attorney general amended the complaint to include methoxyfenozide, cyhalofop, picloram, triclopyr, and aminopyralid products. Several proposed private class action lawsuits were also filed in federal court alleging anticompetitive conduct based on the allegations set forth in the FTC lawsuit.
Virtually all of these private lawsuits were centralized into a multi-district litigation in the U.S. District Court for the Middle District of North Carolina. In January 2025, federal court for the multi-district litigation granted in part, and denied in part, Corteva's motion to dismiss. Specifically, the court order dismissed the plaintiff's federal damages claims and 13 of the 27 state consumer protection act claims. The plaintiffs amended their complaint to include methoxyfenozide products. Without admitting any wrongdoing, Corteva reached tentative settlements with the State of Arkansas in February 2026 and the multi-district litigation plaintiffs collectively in March 2026. The final terms of these settlements continue to be negotiated. The trial for the FTC claims is expected to begin in 2027. As of March 31, 2026, an accrual has been established for the estimated resolution of claims.
Lorsban® Lawsuits
As of March 31, 2026, there were asserted claims for personal injury against the former Dow Agrosciences LLC, alleging injuries related to chlorpyrifos exposure, the active ingredient in Lorsban®, an insecticide used by commercial farms for field fruit, nut and vegetable
crops. Corteva ended its production of Lorsban® in 2020. Chlorpyrifos products are restricted-use pesticides, which are not available for purchase or use by the general public, and may only be sold to, and used by, certified applicators or someone under the certified applicator's direct supervision. These lawsuits do not relate to Dursban®, a residential type chlorpyrifos product that was authorized for indoor purposes, which was discontinued over two decades ago prior to the Merger and Corteva’s formation and Separation. Claimants allege personal injury, including autism, developmental delays and/or decreased neurologic function, resulting from farm worker exposure and bystander drift and in utero exposure to chlorpyrifos. Certain claimants have also put forth remediation claims due to alleged property contamination from chlorpyrifos. As of March 31, 2026, an accrual has been established for the estimated resolution of certain claims.
Litigation related to legacy EIDP businesses unrelated to Corteva’s current businesses
For purposes of this report, the term PFOA means collectively perfluorooctanoic acid and its salts, including the ammonium salt and does not distinguish between the two forms, and PFAS, including PFOA, PFOS (perfluorooctanesulfonic acid), GenX and other perfluorinated chemicals and compounds (“PFCs”).
EIDP is a party to various legal proceedings relating to the use of PFOA by its former Performance Chemicals segment for which potential liabilities would be subject to the cost sharing arrangement under the MOU as long as it remains effective.
Leach Settlement and Ohio MDL Settlement
EIDP has residual liabilities under its 2004 settlement of a West Virginia state court class action, Leach v. EIDP, which alleged that PFOA from EIDP’s former Washington Works facility had contaminated area drinking water supplies and affected the health of area residents. The settlement class has about 80,000 members. In addition to relief that was provided to class members years ago, the settlement requires EIDP to continue providing PFOA water treatment to six area water districts and private well users and to fund, through an escrow account, up to $235 million for a medical monitoring program for eligible class members. As of March 31, 2026, approximately $2 million had been disbursed from the account since its establishment in 2012 and the remaining balance is approximately $1 million.
PFOA Personal Injury Claims
In December 2024, the defendants reached a settlement of all of the currently filed and unfiled personal injury cases in the Ohio MDL for $59 million, with $8 million contributed in aggregate by Corteva. The final installment was paid upon the court dissolving the MDL in March 2025.
Other PFOA Matters
EIDP is a party to other PFOA lawsuits involving claims for property damage, medical monitoring and personal injury. Defense costs and any future liabilities that may arise out of these lawsuits are subject to the MOU and the cost sharing arrangement disclosed above. Under the MOU, fraudulent conveyance claims associated with these matters are not qualified expenses, unless Corteva, Inc. and EIDP would prevail on the merits of these claims.
EIDP did not make film-forming foams, PFOS, or PFOS products. While EIDP made surfactants and intermediaries that some manufacturers used in making foams, which may have contained PFOA as an unintended byproduct or an impurity, EIDP’s products were not formulated with PFOA, nor was PFOA an ingredient of these products. EIDP has never made or sold PFOA as a commercial product.
Aqueous Film-Forming Foams. Approximately 12,000 cases filed against 3M and other defendants, including EIDP and Chemours, and some including Corteva and DuPont, alleging personal injury (primarily kidney, testicular, liver and thyroid cancer) from the use of aqueous film-forming foams (“AFFF”) or contamination, in most cases due to migration from military installations or airports, consolidated in a multi-district litigation proceeding in federal district court in South Carolina (“SC MDL”). Most of these recent cases also assert claims that the EIDP and Chemours separation constituted a fraudulent conveyance.
In August 2025, the SC MDL entered multiple case management orders requiring cases filed outside the SC MDL to be transferred to the SC MDL, establishing a 21-day window for unfiled cases to be filed, and allowing the filing of multi-plaintiff complaints. A significant number of new cases asserting personal injury were filed or transferred to the SC MDL. Many of the personal injury cases both inside and outside the SC MDL include and continue to include, as new cases are threatened, multiple plaintiffs. Therefore, the number of plaintiffs asserting such claims is substantially higher than the number of cases set forth above. The first bellwether personal injury trial is expected to be scheduled for 2026. Discussions between the parties on a resolution to these cases remain ongoing.
Nationwide Water District Settlement. In April 2024, a compromise and settlement with Corteva, EIDP, Inc, DuPont, and Chemours (collectively, the “settling companies”) was finalized to comprehensively resolve all drinking water claims related to PFAS of a defined
class of U.S. public water systems that serve the vast majority of the United States population, including, but not limited to the AFFF claims in the SC MDL, under the Nationwide Water District Settlement, for $1.185 billion in the aggregate. PFAS, as defined in the settlement, includes PFOA and HFPO-DA, among a broad range of fluorinated organic substances.
The class represented by the Nationwide Water District Settlement is composed of all Public Water Systems, as defined in 42 U.S.C. § 300f, with a current detection of PFAS or that are currently required to monitor for PFAS under the Environmental Protection Agency’s Fifth Unregulated Contaminant Monitoring Rule (“UCMR 5”) or other applicable federal or state law (the “Class”). Approximately 88 percent of the U.S. is served by systems required to test under UCMR 5. The Class does not include water systems owned and operated by a State or the United States government; small systems that have not detected the presence of PFAS and are not currently required to monitor for it under federal or state requirements; and, unless they otherwise request to be included, water systems in the lower Cape Fear River Basin of North Carolina.
The total number of requests for exclusion (“opt-outs”) was approximately 900 water districts while most public water districts (approximately 93 percent of the Class) remain in the class settlement. The company has been served complaints from opt-outs, as well as water district and municipal authority claims not covered by the Nationwide Water District Settlement.
New Jersey. In late March 2019, the New Jersey State Attorney General filed four lawsuits against EIDP, Chemours, and others alleging that operations at and discharges from former EIDP sites in New Jersey (Chambers Works, Parlin, Pompton Lakes and Repauno) damaged the State’s natural resources. Two of these lawsuits (those involving the Chambers Works and Parlin sites) allege contamination from PFAS. DuPont and Corteva were subsequently added as defendants to these lawsuits. These lawsuits include claims for remediation, fraudulent conveyance, as well as claims under the New Jersey Water Pollution Control Act and the New Jersey Industrial Site Recovery Act (“ISRA”).
On August 3, 2025, the company, together with Chemours and DuPont agreed to a proposed Judicial Consent Order with the State of New Jersey (the “NJ Statewide Settlement”) to resolve all outstanding claims by the State of New Jersey pending against the companies related to the legacy use of a wide variety of substances of concern, including, but not limited to DNAPL (dense non-aqueous phase liquids), chemical solvents, and PFAS. Subject to a public notice and comment period and subject to court approval following that period, the NJ Statewide Settlement will also resolve legacy claims related to four Historical DuPont operating sites (Chambers Works, Parlin, Pompton Lakes and Repauno) in the State, including claims under ISRA, alleged statewide PFAS contamination, including from the use of AFFF, claims of fraudulent conveyance, and claims for known natural resource damages from these Historical DuPont sites that the State of New Jersey and its departments have, or may have, in the future against the companies.
The NJ Statewide Settlement, after the expiration of the public notice and comment period, is subject to court approval. The court hearing for this approval occurred in January 2026 with a conclusion on the approval expected during the first half of 2026. The NJ Statewide Settlement includes aggregate cash payments to the State of New Jersey of $875 million, payable over a period of 25 years (net present value of approximately $500 million, using an 8 percent discount rate), responsibility for which will be allocated among the settling companies in accordance with the terms of the MOU. Of the $875 million, approximately $16 million is allocated to statewide natural resource damages unrelated to the four Historical DuPont sites, 25 percent of which relates to alleged statewide AFFF contamination. Accordingly, in the second quarter of 2025, the company recorded a pre-tax loss of $72 million ($58 million after-tax) within discontinued operations, reflecting the net present value of the company's share of the aggregate cash payment in accordance with the MOU. The settling companies have agreed to count the NJ Statewide Settlement against the MOU limit at net present value as of the date of the NJ Statewide Settlement. Entry into the NJ Statewide Settlement suspended the companies' 2025 MOU escrow funding obligations and funding of the initial payment under the NJ Statewide Settlement, expected in 2026, will be deemed to satisfy these obligations for 2025.
In addition to the cash payment, the NJ Statewide Settlement obligates certain settling companies to continue to undertake remediation at the four Historical DuPont sites, which will be determined in accordance with applicable law and the respective cost sharing arrangements between the settling companies, to the extent applicable. DuPont and Chemours will be responsible for the remediation at the sites under their current respective ownership. As part of the NJ Statewide Settlement, the companies have agreed to a binding third party review process of the remedial funding source (“RFS”) for each of the four Historical DuPont sites (in the form of a surety bond or similar financial instrument) to ensure available funds for future remediation of these sites. This review process could identify additional required remediation, and an increase to the RFS for each of these sites.
The company and DuPont will also establish a reserve fund (in the form of a surety bond or similar financial instrument) in the amount of $475 million (the “Reserve Fund”) with DuPont funding 71 percent and the company bearing the remaining 29 percent. The Reserve Fund is further financial security, separate from, and secondary to, the RFS, and the Reserve Fund will be accessible only in the event the RFS for a site has been exhausted and the party responsible for a site is not otherwise performing the required remediation. If a responsible party under the NJ Statewide Settlement defaults on their remediation or payment obligations (subject first to the cost sharing
arrangements under the Corteva Separation Agreements, which provides that these obligations are “stray liabilities”), EIDP will become responsible for such obligations.
Under the NJ Statewide Settlement, no settling party admits any liability or wrongdoing or agrees to waive any defenses as to any such liability or wrongdoing.
Pursuant to a separate agreement among the company, DuPont, and Chemours, DuPont and the company will purchase Chemours' future interest, if any, in certain insurance proceeds. DuPont and the company will make the purchase by contributing a total of $150 million, with $106 million from DuPont and $44 million from the company, into an escrow fund, with funds to be released to pay Chemours' share of the NJ Statewide Settlement. DuPont and the company will pay Chemours, as additional contingent consideration, amounts received from the acquired insurance proceeds in excess of $150 million plus an accrued fee. The accrued fee will equal the lesser of (a) $35 million, and (b) $3 million plus interest (at prime minus 2 percent) on an initial balance of $150 million, as reduced by any amounts received by DuPont and Corteva from the acquired insurance proceeds, until DuPont and the company have so received $150 million, plus the accrued fee. The purchase price to be paid to Chemours, and the insurance proceeds recovered, by DuPont and the company from the insurance proceeds acquired from Chemours, are subject to the sharing percentages under the Letter Agreement.
Ohio. EIDP is a defendant in two lawsuits, including an action by the State of Ohio based on alleged damage to natural resources. The natural resources damage claim was preliminarily resolved in December 2023. As of March 31, 2026, an accrual has been established for this matter. The second, a putative nationwide class action (the “Hardwick Class Action”) brought on behalf of anyone who has detectable levels of PFAS in their blood serum seeks declaratory and injunctive relief, including the establishment of a “PFAS Science Panel.” In December 2023, the Sixth Circuit Court of Appeals dismissed the Hardwick Class Action due to lack of standing by Mr. Hardwick. With further opportunities for appeals expired, the plaintiffs filed a new case, narrowing their original claims, in June 2024. EIDP's motion to dismiss the new case on the grounds it remains similar to the original claim was denied, but immediately certified an appeal to the Sixth Circuit and stayed all merits and class proceedings pending the Sixth Circuit's review of the district court's decision. The appellate review is expected to be as early as the fourth quarter of 2026.
New York. EIDP is a defendant in a putative class action (the “Baker Class Action”), brought by persons who live in and around Hoosick Falls, New York. These lawsuits assert claims for medical monitoring, property damage and personal injury based on alleged PFOA releases from manufacturing facilities owned and operated by co-defendants in Hoosick Falls. The lawsuits allege that EIDP and others supplied materials used at these facilities resulting in PFOA air and water contamination. A court approved settlement was reached between the plaintiffs and the other co-defendants regarding the Baker Class Action case. In September 2022, the class certification of the Baker Class Action was granted, with the court certifying three separate classes consisting of a private well property damage class, a medical monitoring class and a nuisance class. A settlement in principle of the Baker Class Action was reached in June 2025. As of March 31, 2026, an accrual for Corteva’s share of the expected settlement under the MOU has been established.
EIDP is a defendant in a lawsuit brought by the Town of East Hampton, New York alleging PFOA and PFOS contamination of the town’s well water. This district submitted a timely opt-out request from the Nationwide Water District Settlement. EIDP and Chemours are also defendants in two lawsuits by a private water utility provider in New Jersey and New York alleging damages from PFAS releases into the environment, that impacted water sources that the utilities use to provide water, as well as product liability, negligence, nuisance, and trespass claims. The court dismissed the New York plaintiff's trespass claims and limited plaintiffs’ nuisance claims to abatement damages.
Other Natural Resource Damage Cases. In addition to the natural resource damage cases in New Jersey and New York, natural resource damage lawsuits against EIDP, Chemours, and others, claiming, among other things, PFC (including PFOA) contamination of groundwater and drinking water, have been filed by attorneys general in 31 states, the District of Columbia and three U.S. territories. Certain cases also name DuPont and Corteva as defendants and include claims of fraudulent conveyance. The complaints seek reimbursement for past and future costs to monitor and remediate the alleged contamination and compensation for the loss of value and use of the state’s natural resources, as well as punitive damages. Due to overlapping AFFF allegations, virtually all of these cases have been transferred, or are pending transfer to the SC MDL. These cases are largely in the discovery phase.
On July 13, 2021, Chemours, DuPont, EIDP and Corteva entered into a settlement agreement with the State of Delaware reflecting the companies' and the State's agreement to settle and fully resolve claims alleged against the companies regarding their historical Delaware operations, manufacturing, use and disposal of all chemical compounds, including PFAS. Under the settlement, if the companies, individually or jointly, within 8 years of the settlement, enter into a proportionally similar agreement to settle or resolve claims of another state for PFAS-related natural resource damages, for an amount greater than $50 million, the companies shall make a supplemental payment directly to the Natural Resources and Sustainability Trust (the “NRS Trust”) in an amount equal to such other states’ recovery in excess of $50 million (“Supplemental Payment”). Supplemental Payment(s), if any, will not exceed $25 million in the aggregate. All amounts paid by the companies under the settlement are subject to the MOU and the Corteva Separation Agreement. Due to the
settlement of natural resource damages claims with the State of Ohio, the one-time Supplemental Payment will be triggered when the further opportunity for appeals expires under the Ohio judicial consent order process. As of March 31, 2026, an accrual has been established for Corteva's share under the MOU. Under the settlement, if the state sues other parties and those parties seek contribution from the companies, the companies will have protection from contribution up to the amounts previously paid under the settlement agreement. The companies will also receive a credit up to the amount of the payment if the state seeks natural resource damage claims against the companies outside the scope of the settlement’s release of claims.
Canada. The Province of British Columbia, filed a class action against various defendants, including 3M, DuPont Canada, EIDP, and Chemours alleging harms caused by PFAS/AFFF. The class consists of all municipalities, regional districts, and other governance authorities and other persons in Canada that were responsible for a “Drinking Water System” from 1970 to the present. The plaintiff seeks to recover costs for the treatment and restoration of natural resources, as well as property, economic, and punitive damages. A putative class action was also filed in July 2024 on behalf of citizens of Quebec, Canada seeking class certification to recover for alleged PFAS and AFFF contamination of private wells and public water treatment facilities. In January 2024, a class action was also filed in Canada against 3M and other defendants, including EIDP and Chemours, alleging PFOS and PFOA environmental contamination and personal injury from use of AFFF. Additionally, several lawsuits on behalf of consumers of PFAS-infused products in the Province of British Columbia for personal injury and PFAS contamination in Manitoba, Canada have been filed.
Netherlands. In April 2021, four municipalities in the Netherlands filed complaints alleging contamination of land and groundwater resulting from the emission of PFOA and GenX by Corteva, DuPont and Chemours. The municipalities seek to recover costs incurred due to the alleged emissions, including damages for investigation costs, construction project delays, depreciation of land, soil remediation, liabilities to contractors, and attorneys’ fees. In September 2023, the court entered a second interlocutory judgment, ruling, inter alia, that defendants were liable to the municipalities for PFOA emissions during a certain time period, and the removal costs of deposited emissions on the municipalities' land infringes their property rights by an objective standard. In June 2024, Chemours and these Dutch municipalities signed a letter of intent that included the implementation of a specific remediation plan for the restoration of restricted vegetable gardens in certain areas of those municipalities to be funded by Chemours, sampling and developing a program to address a recreational lake, and further settlement discussions, including a potential fund to cover certain other expenditures aimed at environmental-related activities. While the letter of intent contemplates the possibility of settlement, discussions between the parties related to the resolution to these matters remain ongoing. Although the company believes a loss is probable, it is not estimable at this time due to various reasons including, among others, the status of discussions between the parties. As of March 31, 2026, an accrual has been established for the estimated environmental remediation set forth in the letter of intent. Additionally, the Office of Public Prosecutor in the Netherlands opened a criminal investigation against certain Dutch subsidiaries of Chemours and Historical DuPont, as well as each subsidiary's directors, alleging unlawful PFOA and GenX emissions from Chemours' Dordrecht Works facility.
Carpet Mill Cases. The city of Centre, Alabama water district alleged defendants, including EIDP, Chemours, other chemical suppliers and large carpet mills, discharged PFAS in their industrial wastewater, and that this wastewater after treatment, resulted in PFAS contamination of drinking water supplies. The Centre, Alabama water district carpet mill case settled in February 2026 and an accrual has been established for this matter as of March 31, 2026. In July 2024, the town of Lyerly, Georgia filed a case making similar allegations as those brought in the Centre, Alabama case. Numerous carpet, textile, and paper manufacturers, their alleged suppliers and former suppliers, including EIDP and Chemours, and certain municipal or utility defendants are also subject to several lawsuits in Georgia, Alabama and South Carolina, alleging negligence, nuisance and trespass related to the release of PFOA, and requesting injunctive relief related to PFOA contamination.
Fayetteville Works Facility, North Carolina
Prior to the separation of Chemours, EIDP introduced GenX as a polymerization processing aid and a replacement for PFOA at the Fayetteville Works facility in Bladen County, North Carolina. The Historical DuPont facility is now owned and operated by Chemours, which continues to manufacture and use GenX. The current natural resources damage claims in North Carolina allege that direct discharges from this legacy facility are a source of PFOA contamination.
As of March 31, 2026, several actions, including personal injury, are pending in the North Carolina federal court against Chemours and EIDP relating to PFC discharges from the Fayetteville Works facility. One of these is a consolidated putative class action that asserts claims for medical monitoring and property damage on behalf of putative classes of property owners and residents in areas near or who draw drinking water from the Cape Fear River. Another action is a consolidated action brought by various North Carolina water authorities, including the Cape Fear Public Utility Authority (“CFPUA”) and Brunswick County, that seek actual and punitive damages as well as injunctive relief. EIDP and Chemours filed a motion for summary judgment on this consolidated action in March 2025. Cumberland County, North Carolina, which is not part of the forgoing consolidation action or the Nationwide Water District Settlement, filed an action for alleged PFOA contamination to its groundwater sources used in drinking water and seeking recovery for costs associated with water filtration, monitoring, and compliance costs. The pending mediation and trial for this matter are no longer scheduled.
In March 2023, CFPUA filed a Delaware Chancery Court action claiming the spin-off of Chemours and the Dow and Historical DuPont merger were unlawful and should be voided, so CFPUA is not precluded from recovering amounts it is entitled in its pending litigation. EIDP filed a motion to dismiss the Delaware Chancery Court action based upon failure to state a claim under Delaware law in June 2023, along with a counterclaim in October 2023. CFPUA’s motion to stay the case was granted in January 2024.
In a state court action, approximately 2,400 private property owners near the Fayetteville Works facility seek compensatory and punitive damages for their claims of private nuisance, trespass, negligence, water monitoring and property damage allegedly caused by release of certain PFCs. In addition, several personal injury cases have been filed in the North Carolina federal court alleging thyroid disease, and prostate, breast and kidney cancers as a result of PFAS exposure.
Generally, site-related expenses related to GenX claims are subject to the cost sharing arrangements as defined in the MOU.
Environmental
Accruals for environmental matters are recorded when it is probable that a liability has been incurred and the amount of the liability can be reasonably estimated based on current law and existing technologies. These obligations are included in accrued and other current liabilities and other noncurrent obligations in the interim Consolidated Balance Sheets. It is reasonably possible that environmental remediation and restoration costs in excess of amounts accrued could have a material impact on the company’s results of operations, financial condition and cash flows. Inherent uncertainties exist in these estimates primarily due to unknown conditions, changing governmental regulations and legal standards regarding liability, and emerging remediation technologies for handling site remediation and restoration.
Refer to the allocation of environmental liabilities, which is discussed under the header “Chemours Separation Agreement (Performance Chemicals)” and “Corteva Separation Agreement” within Note 12 - Commitments and Contingent Liabilities, to the interim Consolidated Financial Statements.
The accrued environmental obligations and indemnification assets include the following:
|
|
|
|
|
|
|
|
|
|
|
|
|
|
As of March 31, 2026 |
|
(In millions) |
Indemnification asset |
|
Accrual balance 3 |
|
Potential
exposure above
amount accrued 3 |
|
Environmental Remediation Stray Liabilities |
|
|
|
|
|
|
|
|
|
Chemours related obligations - subject to indemnity 1,2 |
|
$ |
251 |
|
|
$ |
263 |
|
|
$ |
205 |
|
Other discontinued or divested businesses obligations 1 |
|
|
35 |
|
|
|
71 |
|
|
|
202 |
|
|
|
|
|
|
|
|
|
|
|
Environmental remediation liabilities primarily related to DuPont - subject to indemnity from DuPont 2 |
|
|
49 |
|
|
|
54 |
|
|
|
53 |
|
|
|
|
|
|
|
|
|
|
|
Environmental remediation liabilities not subject to indemnity |
|
|
— |
|
|
|
113 |
|
|
|
106 |
|
|
|
|
|
|
|
|
|
|
|
Indemnification liabilities related to the MOU 4 |
|
|
— |
|
|
|
58 |
|
|
|
6 |
|
Total |
|
$ |
335 |
|
|
$ |
559 |
|
|
$ |
572 |
|
1.Represents liabilities that are subject to the $200 million threshold and sharing arrangements as discussed in the section entitled “Corteva Separation Agreement” within Note 12 - Commitments and Contingent Liabilities, to the interim Consolidated Financial Statements.
2.The company has recorded an indemnification asset related to these accruals, including $21 million related to the Superfund sites.
3.Accrual balance represents management’s best estimate of the costs of remediation and restoration, although it is reasonably possible that the potential exposure, as indicated, could range above the amounts accrued, as there are inherent uncertainties in these estimates. Accrual balance includes $48 million for remediation of Superfund sites. Amounts do not include possible impacts from the remediation elements of the EPA’s October 2021 PFAS Strategic Roadmap (as applicable), except as disclosed in the section entitled “Fayetteville Works Facility, North Carolina” within Note 12 - Commitments and Contingent Liabilities, to the interim Consolidated Financial Statements, relating to Chemours' remediation activities at the Fayetteville Works Facility pursuant to the Consent Order with the North Carolina Department of Environmental Quality (“NC DEQ”).
4.Represents liabilities that are subject to the $150 million threshold and sharing agreements as discussed in the section entitled “Chemours Separation Agreement (Performance Chemicals)” within Note 12 - Commitments and Contingent Liabilities, to the interim Consolidated Financial Statements.
Nebraska Department of Environment and Energy, AltEn Facility
The EPA and the Nebraska Department of Environment and Energy (“NDEE”) are pursuing investigations, response and removal actions, litigation and enforcement action related to an ethanol plant located near Mead, Nebraska that is owned and operated by AltEn
LLC (“AltEn”). The agencies have alleged violations under the Resource Conservation and Recovery Act (“RCRA”) and other federal and state laws stemming from AltEn’s lack of compliance with the terms and conditions of its operating permits and other regulatory requirements. Corteva is one of six seed companies, who were customers of AltEn (collectively, the “Facility Response Group”), participating in the NDEE’s Voluntary Cleanup Program to address certain interim remediation needs at the site. In March 2025, the Facility Response Group reached an agreement to settle its lawsuit against AltEn and certain of its affiliates to preserve certain contractual and common law indemnification claims. The settlement agreement, among other things, limits AltEn’s ability to dispose of the property or take any adverse action with respect to its property or assets. As of March 31, 2026, an accrual was established for Corteva’s estimated voluntary contribution to the solid waste and wastewater remedial action plans for the AltEn location.
California Department of Toxic Substances Control, Pittsburg Plant
The California Department of Toxic Substances Control (“DTSC”) has filed a state court lawsuit over challenging whether the Pittsburg plant’s high purity water system (“HPWS”), as operated by Dow and now Corteva, required a permit pursuant to the RCRA. Discussions between the parties remain ongoing and further litigation, including discovery, is stayed.
NOTE 13 — STOCKHOLDERS' EQUITY
Share Buyback Plan
On November 19, 2024, Corteva, Inc. announced that its Board of Directors authorized a $3 billion share repurchase program to purchase Corteva, Inc.’s common stock, par value $0.01 per share, without an expiration date (“2024 Share Buyback Plan”). The timing, price and volume of purchases will be based on market conditions, relevant securities laws and other factors. In connection with the 2024 Share Buyback Plan, the company repurchased and retired 3,190,000 shares in the open market for a total cost (excluding excise taxes) of $250 million during the three months ended March 31, 2026.
On September 13, 2022, Corteva, Inc. announced that its Board of Directors authorized a $2 billion share repurchase program to purchase Corteva, Inc.’s common stock, par value $0.01 per share, without an expiration date (“2022 Share Buyback Plan”). The timing, price and volume of purchases were based on market conditions, relevant securities laws and other factors. The company completed the 2022 Share Buyback Plan during the second quarter of 2025 and repurchased and retired 7,815,000, 17,909,000, and 10,026,000 shares in the open market and through privately-negotiated transactions for a cost (excluding excise taxes) of $500 million, $1 billion and $500 million during the years ended December 31, 2025, 2024 and 2023, respectively. Included within the shares repurchased during the years ended December 31, 2025 and 2024 were $145 million and $125 million, respectively, of shares from the master trust fund of the principal U.S. pension plan, as part of the Pension Investment Committee's periodic portfolio rebalancing process. Shares were repurchased by the company at the prevailing market rate authorized and agreed to by a third-party independent fiduciary for the plan.
Shares repurchased pursuant to Corteva's share buyback plans are immediately retired upon repurchase. Repurchased common stock is reflected as a reduction of stockholders' equity. The company's accounting policy related to its share repurchases is to reduce its common stock based on the par value of the shares and to reduce its retained earnings for the excess of the repurchase price over the par value. When Corteva has an accumulated deficit balance, the excess over the par value is applied to additional paid-in capital (“APIC”). When Corteva has retained earnings, the excess is charged entirely to retained earnings.
Noncontrolling Interest
Corteva, Inc. owns 100 percent of the outstanding common shares of EIDP. However, EIDP has preferred stock outstanding to third parties which is accounted for as a non-controlling interest in Corteva's interim Consolidated Balance Sheets. Each share of EIDP Preferred Stock - $4.50 Series and EIDP Preferred Stock - $3.50 Series issued and outstanding at the effective date of the Corteva Distribution remains issued and outstanding as to EIDP and was unaffected by the Corteva Distribution.
Below is a summary of the EIDP Preferred Stock at March 31, 2026, December 31, 2025 and March 31, 2025, which is classified as noncontrolling interests in Corteva's interim Consolidated Balance Sheets.
|
|
|
|
|
(Shares in thousands) |
Number of Shares |
|
Authorized |
|
|
23,000 |
|
$4.50 Series, callable at $120 |
|
|
1,673 |
|
$3.50 Series, callable at $102 |
|
|
700 |
|
Other Comprehensive Income (Loss)
The changes and after-tax balances of components comprising accumulated other comprehensive income (loss) are summarized below:
|
|
|
|
|
|
|
|
|
|
|
|
|
|
|
|
|
|
|
|
|
|
|
|
|
(In millions) |
Cumulative Translation Adjustment 1 |
|
Derivative Instruments |
|
Pension Benefit Plans |
|
Other Benefit Plans |
|
Unrealized Gain (Loss) on Investments |
|
Total |
|
2025 |
|
|
|
|
|
|
|
|
|
|
|
|
|
|
|
|
|
|
Balance at January 1, 2025 |
|
$ |
(3,472 |
) |
|
$ |
16 |
|
|
$ |
(226 |
) |
|
$ |
219 |
|
|
$ |
(6 |
) |
|
$ |
(3,469 |
) |
Other comprehensive income (loss) before reclassifications |
|
|
186 |
|
|
|
10 |
|
|
|
1 |
|
|
|
— |
|
|
|
2 |
|
|
|
199 |
|
Amounts reclassified from accumulated other comprehensive income (loss) |
|
|
— |
|
|
|
2 |
|
|
|
— |
|
|
|
(3 |
) |
|
|
— |
|
|
|
(1 |
) |
Net other comprehensive income (loss) |
|
|
186 |
|
|
|
12 |
|
|
|
1 |
|
|
|
(3 |
) |
|
|
2 |
|
|
|
198 |
|
Balance at March 31, 2025 |
|
$ |
(3,286 |
) |
|
$ |
28 |
|
|
$ |
(225 |
) |
|
$ |
216 |
|
|
$ |
(4 |
) |
|
$ |
(3,271 |
) |
2026 |
|
|
|
|
|
|
|
|
|
|
|
|
|
|
|
|
|
|
Balance at January 1, 2026 |
|
$ |
(2,605 |
) |
|
$ |
(7 |
) |
|
$ |
(378 |
) |
|
$ |
193 |
|
|
|
— |
|
|
$ |
(2,797 |
) |
Other comprehensive income (loss) before reclassifications |
|
|
(129 |
) |
|
|
(11 |
) |
|
|
(3 |
) |
|
|
— |
|
|
|
1 |
|
|
|
(142 |
) |
Amounts reclassified from accumulated other comprehensive income (loss) |
|
|
— |
|
|
|
3 |
|
|
|
(1 |
) |
|
|
(3 |
) |
|
|
— |
|
|
|
(1 |
) |
Net other comprehensive income (loss) |
|
|
(129 |
) |
|
|
(8 |
) |
|
|
(4 |
) |
|
|
(3 |
) |
|
|
1 |
|
|
|
(143 |
) |
Balance at March 31, 2026 |
|
$ |
(2,734 |
) |
|
$ |
(15 |
) |
|
$ |
(382 |
) |
|
$ |
190 |
|
|
$ |
1 |
|
|
$ |
(2,940 |
) |
1.The cumulative translation adjustment loss for the three months ended March 31, 2026 was primarily driven by the strengthening of the USD against the Euro (“EUR”) and Indian Rupee (“INR”), partially offset by the weakening of the USD against the Brazilian Real (“BRL”). The cumulative translation adjustment gain for the three months ended March 31, 2025 was primarily driven by the weakening of the USD against the Brazilian Real, Euro and South African Rand (“ZAR”).
The tax (expense) benefit on the net activity related to each component of other comprehensive income (loss) was as follows:
|
|
|
|
|
|
|
|
|
|
Three Months Ended March 31, |
|
(In millions) |
2026 |
|
2025 |
|
Derivative instruments |
|
$ |
(6 |
) |
|
$ |
(13 |
) |
Pension benefit plans - net |
|
|
(1 |
) |
|
|
1 |
|
Other benefit plans - net |
|
|
1 |
|
|
|
2 |
|
Unrealized gains (losses) on investments |
|
|
— |
|
|
|
— |
|
(Provision for) benefit from income taxes related to other comprehensive income (loss) items |
|
$ |
(6 |
) |
|
$ |
(10 |
) |
A summary of the reclassifications out of accumulated other comprehensive income (loss) is provided as follows:
|
|
|
|
|
|
|
|
|
|
Three Months Ended March 31, |
|
(In millions) |
2026 |
|
2025 |
|
Derivative instruments 1: |
|
$ |
3 |
|
|
$ |
13 |
|
Tax (benefit) expense 2 |
|
|
— |
|
|
|
(11 |
) |
After-tax |
|
$ |
3 |
|
|
$ |
2 |
|
Amortization of pension benefit plans: |
|
|
|
|
|
|
Prior service (benefit) cost 3,4 |
|
$ |
(1 |
) |
|
$ |
(1 |
) |
Total before tax |
|
|
(1 |
) |
|
|
(1 |
) |
Tax (benefit) expense 2 |
|
|
— |
|
|
|
1 |
|
After-tax |
|
$ |
(1 |
) |
|
$ |
— |
|
Amortization of other benefit plans: |
|
|
|
|
|
|
Actuarial (gains) losses 3,4 |
|
$ |
(4 |
) |
|
$ |
(5 |
) |
Total before tax |
|
|
(4 |
) |
|
|
(5 |
) |
Tax (benefit) expense 2 |
|
|
1 |
|
|
|
2 |
|
After-tax |
|
$ |
(3 |
) |
|
$ |
(3 |
) |
Total reclassifications for the period, after-tax |
|
$ |
(1 |
) |
|
$ |
(1 |
) |
1.Reflected in cost of goods sold in the interim Consolidated Statements of Operations.
2.Reflected in provision for (benefit from) income taxes from continuing operations in the interim Consolidated Statements of Operations.
3.These accumulated other comprehensive income (loss) components are included in the computation of net periodic benefit (credit) cost of the company's pension and other benefit plans. See Note 14 - Pension Plans and Other Post Employment Benefits, to the interim Consolidated Financial Statements, for additional information.
4.Reflected in other income (expense) - net in the interim Consolidated Statements of Operations.
NOTE 14 — PENSION PLANS AND OTHER POST EMPLOYMENT BENEFITS
The following sets forth the components of the company's net periodic benefit (credit) cost for defined benefit pension plans and other post employment benefits (“OPEB”):
|
|
|
|
|
|
|
|
|
|
Three Months Ended March 31, |
|
(In millions) |
2026 |
|
2025 |
|
Defined Benefit Pension Plans: |
|
|
|
|
|
|
Service cost |
|
$ |
4 |
|
|
$ |
4 |
|
Interest cost |
|
|
138 |
|
|
|
157 |
|
Expected return on plan assets |
|
|
(148 |
) |
|
|
(155 |
) |
Amortization of prior service (benefit) cost |
|
|
(1 |
) |
|
|
(1 |
) |
Net periodic benefit (credit) cost |
|
$ |
(7 |
) |
|
$ |
5 |
|
Other Post Employment Benefits: |
|
|
|
|
|
|
Interest cost |
|
|
8 |
|
|
|
10 |
|
Amortization of unrecognized (gain) loss |
|
|
(4 |
) |
|
|
(5 |
) |
Net periodic benefit (credit) cost |
|
$ |
4 |
|
|
$ |
5 |
|
NOTE 15 — FINANCIAL INSTRUMENTS
Time Deposits and Money Market Funds
At March 31, 2026, December 31, 2025 and March 31, 2025, the company held investments in held-to-maturity securities at amortized cost, which approximates fair value. At March 31, 2025, the company held additional held-to-maturity securities, and at March 31, 2026, December 31, 2025 and March 31, 2025, the company also held available-for-sale securities, consisting of investments in foreign government bonds which are discussed further in the section entitled “Debt Securities.” Reclassifications of certain prior year held-to-maturity balances have been made in the current year to disaggregate between those that are time deposits and foreign government bonds.
The following table summarizes investments in time deposits and money market funds classified as held-to-maturity securities at March 31, 2026, December 31, 2025 and March 31, 2025:
|
|
|
|
|
|
|
|
|
|
|
|
|
|
|
Held-to-Maturity Securities |
Amortized Cost |
|
(in millions) |
Balance Sheet Location |
March 31, 2026 |
|
December 31, 2025 |
|
March 31, 2025 |
|
Time deposits and money market funds |
|
Cash equivalents 1 |
|
$ |
1,113 |
|
|
$ |
3,431 |
|
|
$ |
1,314 |
|
Time deposits |
|
Marketable securities 2 |
|
$ |
1 |
|
|
$ |
1 |
|
|
$ |
1 |
|
1.Maturity at time of purchase was three months or less.
2.Maturity at time of purchase was more than three months to less than one year.
Derivative Instruments
Objectives and Strategies for Holding Derivative Instruments
In the ordinary course of business, the company enters into contractual arrangements (derivatives) to reduce its exposure to foreign currency and commodity price risks. The company has established a variety of derivative programs to be utilized for financial risk management. These programs reflect varying levels of exposure coverage and time horizons based on an assessment of risk.
Derivative programs have procedures and controls and are approved by the Corporate Financial Risk Management Committee, consistent with the company's financial risk management policies and guidelines. Derivative instruments used are forwards, options, futures and swaps. The company has not designated any non-derivatives as hedging instruments.
The company's financial risk management procedures also address counterparty credit approval, limits and routine exposure monitoring and reporting. The counterparties to these contractual arrangements are major financial institutions and major commodity exchanges, and multinational grain exporters. The company is exposed to credit loss in the event of nonperformance by these counterparties. The company utilizes collateral support annex agreements with certain counterparties to limit its exposure to credit losses. The company anticipates performance by counterparties to these contracts and therefore no material loss is expected. Market and counterparty credit risks associated with these instruments are regularly reported to management.
The aggregate notional amounts for the company's derivative instruments (both designated and not designated) was a net buy position of $1,027 million, $1,280 million and $1,252 million at March 31, 2026, December 31, 2025 and March 31, 2025, respectively.
Foreign Currency Risk
The company's objective in managing exposure to foreign currency fluctuations is to reduce earnings and cash flow volatility associated with foreign currency rate changes and to mitigate the exposure of certain investments in foreign subsidiaries against changes in the EUR/USD exchange rate. Accordingly, the company enters into various contracts that change in value as foreign exchange rates change to protect the value of its existing foreign currency-denominated assets, liabilities, commitments, investments and cash flows.
The company uses foreign currency exchange contracts to offset its net exposures, by currency, related to the foreign currency denominated monetary assets and liabilities of its operations. The primary business objective of this hedging program is to maintain an approximately balanced position in foreign currencies so that exchange gains and losses resulting from exchange rate changes, after related tax effects, are minimized. The company also uses foreign currency exchange contracts to offset a portion of the company’s exposure to certain forecasted transactions as well as the translation of foreign currency-denominated earnings. The company also frequently uses commodity contracts to offset risks associated with foreign currency devaluation in certain countries.
Commodity Price Risk
Commodity price risk management programs serve to reduce exposure to price fluctuations on purchases of inventory such as corn and soybeans. The company enters into over-the-counter and exchange-traded derivative commodity instruments to hedge the commodity price risk associated with agricultural commodity exposures.
Derivatives Designated as Cash Flow Hedges
Commodity Contracts
The company enters into over-the-counter and exchange-traded derivative commodity instruments, including options, forwards, futures and swaps, to hedge the commodity price risk associated with agricultural commodity exposures.
While each risk management program has a different maturity period, most programs currently do not extend beyond the next two years. Cash flow hedge results are reclassified into earnings during the same period in which the related exposure impacts earnings. Reclassifications are made sooner if it appears that a forecasted transaction is not probable of occurring.
The following table summarizes the after-tax effect of commodity contract cash flow hedges on accumulated other comprehensive income (loss):
|
|
|
|
|
|
|
|
|
|
Three Months Ended March 31, |
|
(In millions) |
2026 |
|
2025 |
|
Beginning balance |
|
$ |
9 |
|
|
$ |
(49 |
) |
Additions and revaluations of derivatives designated as cash flow hedges |
|
|
21 |
|
|
|
2 |
|
Clearance of hedge results to earnings |
|
|
3 |
|
|
|
15 |
|
Ending balance |
|
$ |
33 |
|
|
$ |
(32 |
) |
At March 31, 2026, an after-tax net gain of $8 million is expected to be reclassified from accumulated other comprehensive income (loss) into earnings over the next twelve months.
Foreign Currency Contracts
The company enters into forward contracts to hedge the foreign currency risk associated with forecasted transactions within certain foreign subsidiaries.
While each risk management program has a different time maturity period, most programs currently do not extend beyond the next two years. Cash flow hedge results are reclassified into earnings during the same period in which the related exposure impacts earnings. Reclassifications are made sooner if it appears that a forecasted transaction is not probable of occurring.
The following table summarizes the after-tax effect of foreign currency cash flow hedges on accumulated other comprehensive income (loss):
|
|
|
|
|
|
|
|
|
|
Three Months Ended March 31, |
|
(In millions) |
2026 |
|
2025 |
|
Beginning balance |
|
$ |
5 |
|
|
$ |
13 |
|
Additions and revaluations of derivatives designated as cash flow hedges |
|
|
(32 |
) |
|
|
— |
|
Clearance of hedge results to earnings |
|
|
— |
|
|
|
(13 |
) |
Ending balance |
|
$ |
(27 |
) |
|
$ |
— |
|
At March 31, 2026, an after-tax net loss of $(27) million is expected to be reclassified from accumulated other comprehensive income (loss) into earnings over the next twelve months.
Derivatives Designated as Net Investment Hedges
Foreign Currency Contracts
In March 2025, the company designated €1.7 billion of forward contracts to exchange Euro as net investment hedges. Of these hedges, €1.2 billion expired and were settled in May 2025, while the remaining €500 million expired and were settled in December 2025. The purpose of these forward contracts is to mitigate foreign exchange exposure related to a portion of the company’s Euro net investments in certain foreign subsidiaries against changes in EUR/USD exchange rates. The company elected to apply the spot method in testing for effectiveness of the hedging relationship.
Derivatives not Designated in Hedging Relationships
Foreign Currency Contracts
The company uses foreign exchange contracts to reduce its net exposure, by currency, related to foreign currency-denominated monetary assets and liabilities of its operations so that exchange gains and losses resulting from exchange rate changes are minimized. The netting of such exposures precludes the use of hedge accounting; however, the required revaluation of the forward contracts and the associated foreign currency-denominated monetary assets and liabilities intends to achieve a minimal earnings impact, after taxes. The company also frequently uses foreign currency exchange contracts to offset a portion of the company’s exposure to the translation of certain foreign currency-denominated earnings so that gains and losses on the contracts offset changes in the USD value of the related foreign currency-denominated earnings over the relevant aggregate period.
Commodity Contracts
The company utilizes options, futures and swaps that are not designated as hedging instruments to reduce exposure to commodity price fluctuations on purchases of inventory such as corn and soybeans. The company uses commodity contracts to offset a portion of the company’s exposure to commodity price fluctuations so that gains and losses on the contracts offset changes in the commodity price over the relevant aggregate period. The company uses forward agreements, with durations of less than one year, to buy and sell USD-priced commodities in order to reduce its exposure to currency devaluation for a portion of its local currency cash balances.
Counterparties to the forward sales agreements are multinational grain exporters and subject to the company’s financial risk management procedures.
Fair Value of Derivative Instruments
Asset and liability derivatives subject to an enforceable master netting arrangement with the same counterparty are presented on a net basis in the interim Consolidated Balance Sheets. The presentation of the company's derivative assets and liabilities is as follows:
|
|
|
|
|
|
|
|
|
|
|
|
|
|
|
|
|
|
March 31, 2026 |
|
(In millions) |
Balance Sheet Location |
Gross |
|
Counterparty and Cash Collateral Netting 1 |
|
Net Amounts Included in the Interim Consolidated Balance Sheets |
|
Asset derivatives: |
|
|
|
|
|
|
|
|
|
|
|
Derivatives designated as hedging instruments: |
|
|
|
|
|
|
|
|
|
|
|
Commodity contracts |
|
Other current assets |
|
$ |
5 |
|
|
$ |
— |
|
|
$ |
5 |
|
Derivatives not designated as hedging instruments: |
|
|
|
|
|
|
|
|
|
|
|
Foreign currency contracts |
|
Other current assets |
|
|
28 |
|
|
|
(28 |
) |
|
|
— |
|
Commodity contracts |
|
Other current assets |
|
|
2 |
|
|
|
— |
|
|
|
2 |
|
Total asset derivatives |
|
|
|
$ |
35 |
|
|
$ |
(28 |
) |
|
$ |
7 |
|
|
|
|
|
|
|
|
|
|
|
|
|
Liability derivatives: |
|
|
|
|
|
|
|
|
|
|
|
Derivatives designated as hedging instruments: |
|
|
|
|
|
|
|
|
|
|
|
Foreign currency contracts |
|
Accrued and other current liabilities |
|
$ |
24 |
|
|
$ |
— |
|
|
$ |
24 |
|
Commodity contracts |
|
Accrued and other current liabilities |
|
|
1 |
|
|
|
— |
|
|
|
1 |
|
Derivatives not designated as hedging instruments: |
|
|
|
|
|
|
|
|
|
|
|
Foreign currency contracts |
|
Accrued and other current liabilities |
|
|
153 |
|
|
|
(28 |
) |
|
|
125 |
|
Commodity contracts |
|
Accrued and other current liabilities |
|
|
3 |
|
|
|
— |
|
|
|
3 |
|
Total liability derivatives |
|
|
|
$ |
181 |
|
|
$ |
(28 |
) |
|
$ |
153 |
|
|
|
|
|
|
|
|
|
|
|
|
|
|
|
|
|
|
|
December 31, 2025 |
|
(In millions) |
Balance Sheet Location |
Gross |
|
Counterparty and Cash Collateral Netting 1 |
|
Net Amounts Included in the Consolidated Balance Sheets |
|
Asset derivatives: |
|
|
|
|
|
|
|
|
|
|
|
Derivatives designated as hedging instruments: |
|
|
|
|
|
|
|
|
|
|
|
Foreign currency contracts |
|
Other current assets |
|
$ |
5 |
|
|
$ |
— |
|
|
$ |
5 |
|
Commodity contracts |
|
Other current assets |
|
|
1 |
|
|
|
— |
|
|
|
1 |
|
Derivatives not designated as hedging instruments: |
|
|
|
|
|
|
|
|
|
|
|
Foreign currency contracts |
|
Other current assets |
|
|
23 |
|
|
|
(21 |
) |
|
|
2 |
|
Commodity contracts |
|
Other current assets |
|
|
3 |
|
|
|
— |
|
|
|
3 |
|
Total asset derivatives |
|
|
|
$ |
32 |
|
|
$ |
(21 |
) |
|
$ |
11 |
|
|
|
|
|
|
|
|
|
|
|
|
|
Liability derivatives: |
|
|
|
|
|
|
|
|
|
|
|
Derivatives designated as hedging instruments: |
|
|
|
|
|
|
|
|
|
|
|
Foreign currency contracts |
|
Accrued and other current liabilities |
|
$ |
1 |
|
|
$ |
— |
|
|
$ |
1 |
|
Commodity contracts |
|
Accrued and other current liabilities |
|
|
3 |
|
|
|
— |
|
|
|
3 |
|
Derivatives not designated as hedging instruments: |
|
|
|
|
|
|
|
|
|
|
|
Foreign currency contracts |
|
Accrued and other current liabilities |
|
|
40 |
|
|
|
(21 |
) |
|
|
19 |
|
Commodity contracts |
|
Accrued and other current liabilities |
|
|
6 |
|
|
|
— |
|
|
|
6 |
|
Total liability derivatives |
|
|
|
$ |
50 |
|
|
$ |
(21 |
) |
|
$ |
29 |
|
|
|
|
|
|
|
|
|
|
|
|
|
|
|
|
|
|
|
March 31, 2025 |
|
(In millions) |
Balance Sheet Location |
Gross |
|
Counterparty and Cash Collateral Netting 1 |
|
Net Amounts Included in the Interim Consolidated Balance Sheets |
|
Asset derivatives: |
|
|
|
|
|
|
|
|
|
|
|
Derivatives designated as hedging instruments: |
|
|
|
|
|
|
|
|
|
|
|
Foreign currency contracts |
|
Other current assets |
|
$ |
12 |
|
|
$ |
— |
|
|
$ |
12 |
|
Commodity contracts |
|
Other current assets |
|
|
2 |
|
|
|
— |
|
|
|
2 |
|
Derivatives not designated as hedging instruments: |
|
|
|
|
|
|
|
|
|
|
|
Foreign currency contracts |
|
Other current assets |
|
|
101 |
|
|
|
(58 |
) |
|
|
43 |
|
Commodity contracts |
|
Other current assets |
|
|
5 |
|
|
|
— |
|
|
|
5 |
|
Total asset derivatives |
|
|
|
$ |
120 |
|
|
$ |
(58 |
) |
|
$ |
62 |
|
|
|
|
|
|
|
|
|
|
|
|
|
Liability derivatives: |
|
|
|
|
|
|
|
|
|
|
|
Derivatives designated as hedging instruments: |
|
|
|
|
|
|
|
|
|
|
|
Commodity contracts |
|
Accrued and other current liabilities |
|
$ |
2 |
|
|
$ |
— |
|
|
$ |
2 |
|
Derivatives not designated as hedging instruments: |
|
|
|
|
|
|
|
|
|
|
|
Foreign currency contracts |
|
Accrued and other current liabilities |
|
|
63 |
|
|
|
(58 |
) |
|
|
5 |
|
Commodity contracts |
|
Accrued and other current liabilities |
|
|
5 |
|
|
|
— |
|
|
|
5 |
|
Total liability derivatives |
|
|
|
$ |
70 |
|
|
$ |
(58 |
) |
|
$ |
12 |
|
1.Counterparty and cash collateral amounts represent the estimated net settlement amount when applying netting and set-off rights included in master netting arrangements between the company and its counterparties and the payable or receivable for cash collateral held or placed with the same counterparty.
Effect of Derivative Instruments
|
|
|
|
|
|
|
|
|
|
Amount of Gain (Loss) Recognized in OCI - Pre-Tax 1 |
|
|
Three Months Ended March 31, |
|
(In millions) |
2026 |
|
2025 |
|
Derivatives designated as hedging instruments: |
|
|
|
|
|
|
Net investment hedges: |
|
|
|
|
|
|
Foreign currency contracts |
|
$ |
— |
|
|
$ |
10 |
|
Cash flow hedges: |
|
|
|
|
|
|
Foreign currency contracts |
|
|
(32 |
) |
|
|
— |
|
Commodity contracts |
|
|
27 |
|
|
|
2 |
|
Total derivatives designated as hedging instruments |
|
$ |
(5 |
) |
|
$ |
12 |
|
1.OCI is defined as other comprehensive income (loss).
|
|
|
|
|
|
|
|
|
|
Amount of Gain (Loss) Recognized in Income - Pre-Tax 1 |
|
|
Three Months Ended March 31, |
|
(In millions) |
2026 |
|
2025 |
|
Derivatives designated as hedging instruments: |
|
|
|
|
|
|
Cash flow hedges: |
|
|
|
|
|
|
Foreign currency contracts 2 |
|
$ |
— |
|
|
$ |
6 |
|
Commodity contracts 2 |
|
|
(3 |
) |
|
|
(19 |
) |
Total derivatives designated as hedging instruments |
|
$ |
(3 |
) |
|
$ |
(13 |
) |
Derivatives not designated as hedging instruments: |
|
|
|
|
|
|
Foreign currency contracts 3 |
|
$ |
(152 |
) |
|
$ |
20 |
|
Foreign currency contracts 2 |
|
|
(11 |
) |
|
|
(9 |
) |
Commodity contracts 2,4 |
|
|
8 |
|
|
|
7 |
|
Commodity contracts 3 |
|
|
— |
|
|
|
— |
|
Total derivatives not designated as hedging instruments |
|
$ |
(155 |
) |
|
$ |
18 |
|
Total derivatives |
|
$ |
(158 |
) |
|
$ |
5 |
|
1.For cash flow hedges, this represents the portion of the gain (loss) reclassified from accumulated OCI into income during the period.
2.Recorded in cost of goods sold in the interim Consolidated Statements of Operations.
3.Recognized in other income (expense) - net in the interim Consolidated Statements of Operations. Note that net gain (loss) from foreign currency contracts was partially offset by the related gain (loss) on the foreign currency-denominated monetary assets and liabilities of the company's operations. See Note 5 - Supplementary Information, to the interim Consolidated Financial Statements, for additional information.
4.The net gain (loss) relating to commodity contracts that are not designated as hedging instruments that were recorded in cost of goods sold, in the interim Consolidated Statements of Operations, are mostly offset by the related net gain (loss) on third-party grower contracts denominated as liabilities.
Debt Securities
The company held debt securities, which consisted of foreign government bonds classified as available-for-sale securities, at March 31, 2026, December 31, 2025 and March 31, 2025. The company's investments in available-for-sale securities are recorded at fair value with unrealized gains and losses recorded in accumulated other comprehensive income (loss), within the interim Consolidated Statements of Equity, or current period earnings if an allowance for credit losses has been established, within the interim Consolidated Statements of Operations.
|
|
|
|
|
|
|
|
|
|
|
|
|
|
|
Available-for-Sale Securities |
Fair Value |
|
(In millions) |
Balance Sheet Location |
March 31, 2026 |
|
December 31, 2025 |
|
March 31, 2025 |
|
Foreign government bonds |
|
Marketable securities 1 |
|
$ |
1 |
|
|
$ |
8 |
|
|
$ |
— |
|
Foreign government bonds |
|
Other assets 2 |
|
$ |
23 |
|
|
$ |
22 |
|
|
$ |
99 |
|
1.Maturity at time of purchase was more than three months to less than one year.
2.Maturity at time of purchase was more than one year.
At March 31, 2026, available-for-sale debt securities with contractual maturities of less than one year and of one year through five years included gross unrealized gains (losses) of $— million and $1 million, respectively.
The estimated fair value of the available-for-sale securities as of March 31, 2026, December 31, 2025 and March 31, 2025 was determined using Level 2 inputs within the fair value hierarchy. Level 2 measurements were based on the end of period quoted closing market prices in active markets for identical assets and liabilities.
NOTE 16 — FAIR VALUE MEASUREMENTS
The following tables summarize the basis used to measure certain assets and liabilities at fair value on a recurring basis:
|
|
|
|
|
|
|
|
|
|
|
|
|
|
March 31, 2026 |
|
December 31, 2025 |
|
March 31, 2025 |
|
(In millions) |
Level 2 1 |
|
Level 2 1 |
|
Level 2 1 |
|
Assets at fair value: |
|
|
|
|
|
|
|
|
|
Marketable securities |
|
$ |
1 |
|
|
$ |
1 |
|
|
$ |
1 |
|
Debt securities: |
|
|
|
|
|
|
|
|
|
Foreign government bonds 2 |
|
|
24 |
|
|
|
30 |
|
|
|
99 |
|
Derivatives relating to: 3 |
|
|
|
|
|
|
|
|
|
Foreign currency |
|
|
28 |
|
|
|
28 |
|
|
|
113 |
|
Commodity contracts |
|
|
7 |
|
|
|
4 |
|
|
|
7 |
|
Total assets at fair value |
|
$ |
60 |
|
|
$ |
63 |
|
|
$ |
220 |
|
Liabilities at fair value: |
|
|
|
|
|
|
|
|
|
Derivatives relating to: 3 |
|
|
|
|
|
|
|
|
|
Foreign currency |
|
|
177 |
|
|
|
41 |
|
|
|
63 |
|
Commodity contracts |
|
|
4 |
|
|
|
9 |
|
|
|
7 |
|
Total liabilities at fair value |
|
$ |
181 |
|
|
$ |
50 |
|
|
$ |
70 |
|
1.Reflects significant other observable inputs.
2.Represents the company's investments in debt securities that are classified as available-for-sale, which are included in marketable securities and other assets in the interim Consolidated Balance Sheets.
3.See Note 15 - Financial Instruments, to the interim Consolidated Financial Statements, for the classification of derivatives in the interim Consolidated Balance Sheets.
NOTE 17 — SEGMENT INFORMATION
Corteva’s reportable segments reflects the manner in which its chief operating decision maker (“CODM”) allocates resources and assesses performance, which is at the operating segment level (Seed and Crop Protection). The company's CODM is the Chief Executive Officer. The primary measure used by Corteva's CODM for purposes of allocating resources to the segments and assessing segment performance is segment operating EBITDA.
Segment operating EBITDA is primarily utilized in the annual planning and monthly forecasting processes. On a monthly basis, the CODM considers variances between comparable prior year actual results and current year actual or forecasted results when evaluating the company's success in delivering its innovative proprietary technology to farmers and monitoring of expected savings from cost and productivity actions. The CODM also utilizes segment operating EBITDA when evaluating the impacts of market-driven trends on segment performance, such as input costs and inflationary and currency impacts. The CODM does not use segment assets to inform resource allocation decisions or assess segment performance.
The company defines segment operating EBITDA as earnings (loss) (i.e., income (loss) from continuing operations before income taxes) before interest, depreciation, amortization, corporate expenses, non-operating benefits (costs), foreign exchange gains (losses), and net unrealized gain or loss from mark-to-market activity for certain foreign currency derivative instruments that do not qualify for hedge accounting, excluding the impact of significant items and separation costs. Non-operating benefits (costs) consists of non-operating pension and other post-employment benefit (OPEB) credits (costs), tax indemnification adjustments and environmental remediation and legal costs associated with legacy businesses and sites. Tax indemnification adjustments relate to changes in indemnification balances, as a result of the application of the terms of the Tax Matters Agreement, between Corteva and Dow and/or DuPont that are recorded by the company as pre-tax income or expense. Net unrealized gain or loss from mark-to-market activity for certain foreign currency derivative instruments that do not qualify for hedge accounting represents the non-cash net gain (loss) from changes in fair value of certain undesignated foreign currency derivative contracts. Upon settlement, which is within the same calendar year of execution of the contract, the realized gain (loss) from the changes in fair value of the non-qualified foreign currency derivative contracts will be reported in the respective segment results to reflect the economic effects of the foreign currency derivative contracts without the resulting unrealized mark to fair value volatility.
|
|
|
|
|
|
|
|
|
|
|
|
|
As of and for the Three Months Ended March 31,
(In millions) |
Seed |
|
Crop Protection |
|
Total |
|
2026 |
|
|
|
|
|
|
|
|
|
Net sales |
|
$ |
3,023 |
|
|
$ |
1,882 |
|
|
$ |
4,905 |
|
Segment operating EBITDA |
|
|
1,034 |
|
|
|
434 |
|
|
|
1,468 |
|
Depreciation and amortization |
|
|
192 |
|
|
|
105 |
|
|
|
297 |
|
Purchases of property, plant and equipment |
|
|
51 |
|
|
|
30 |
|
|
|
81 |
|
|
|
|
|
|
|
|
|
|
|
2025 |
|
|
|
|
|
|
|
|
|
Net sales |
|
$ |
2,707 |
|
|
$ |
1,710 |
|
|
$ |
4,417 |
|
Segment operating EBITDA |
|
|
842 |
|
|
|
377 |
|
|
|
1,219 |
|
Depreciation and amortization |
|
|
191 |
|
|
|
105 |
|
|
|
296 |
|
Purchases of property, plant and equipment |
|
|
47 |
|
|
|
47 |
|
|
|
94 |
|
Reconciliation of Segment Profitability
|
|
|
|
|
|
|
|
|
|
|
|
|
(In millions) |
Seed |
|
Crop Protection |
|
Total |
|
For the Three Months Ended March 31, 2026 |
|
|
|
|
|
|
|
|
|
Net sales |
|
$ |
3,023 |
|
|
$ |
1,882 |
|
|
$ |
4,905 |
|
Cost of goods sold |
|
|
1,306 |
|
|
|
1,057 |
|
|
|
2,363 |
|
Other expenses 1 |
|
|
683 |
|
|
|
391 |
|
|
|
1,074 |
|
Segment operating EBITDA |
|
$ |
1,034 |
|
|
$ |
434 |
|
|
$ |
1,468 |
|
|
|
|
|
|
|
|
|
|
|
(In millions) |
Seed |
|
Crop Protection |
|
Total |
|
For the Three Months Ended March 31, 2025 |
|
|
|
|
|
|
|
|
|
Net sales |
|
$ |
2,707 |
|
|
$ |
1,710 |
|
|
$ |
4,417 |
|
Cost of goods sold |
|
|
1,275 |
|
|
|
1,018 |
|
|
|
2,293 |
|
Other expenses 1 |
|
|
590 |
|
|
|
315 |
|
|
|
905 |
|
Segment operating EBITDA |
|
$ |
842 |
|
|
$ |
377 |
|
|
$ |
1,219 |
|
1.Other expenses consisted primarily of selling, general and administrative expenses and research and development expense, net of depreciation add-back.
Reconciliation to Interim Consolidated Financial Statements
|
|
|
|
|
|
|
|
|
Income (loss) from continuing operations after income taxes to segment operating EBITDA |
Three Months Ended March 31, |
|
(In millions) |
2026 |
|
2025 |
|
Income (loss) from continuing operations after income taxes |
|
$ |
725 |
|
|
$ |
667 |
|
Provision for (benefit from) income taxes on continuing operations |
|
|
133 |
|
|
|
117 |
|
Income (loss) from continuing operations before income taxes |
|
$ |
858 |
|
|
$ |
784 |
|
Depreciation and amortization |
|
|
297 |
|
|
|
296 |
|
Interest income |
|
|
(34 |
) |
|
|
(32 |
) |
Interest expense |
|
|
36 |
|
|
|
36 |
|
Exchange (gains) losses - net |
|
|
67 |
|
|
|
27 |
|
Non-operating (benefits) costs - net |
|
|
(18 |
) |
|
|
10 |
|
Mark-to-market (gains) losses on certain foreign currency contracts not designated as hedges |
|
|
3 |
|
|
|
9 |
|
Significant items (benefit) charge |
|
|
177 |
|
|
|
59 |
|
Separation costs |
|
|
52 |
|
|
|
— |
|
Corporate expenses |
|
|
30 |
|
|
|
30 |
|
Segment operating EBITDA |
|
$ |
1,468 |
|
|
$ |
1,219 |
|
Significant Pre-tax (Charges) Benefits Not Included in Segment Operating EBITDA
The three months ended March 31, 2026 and 2025, respectively, included the following significant pre-tax (charges) benefits which are excluded from segment operating EBITDA:
|
|
|
|
|
|
|
|
|
|
|
|
|
|
|
|
|
(In millions) |
Seed |
|
Crop Protection |
|
Corporate |
|
Total |
|
For the Three Months Ended March 31, 2026 |
|
|
|
|
|
|
|
|
|
|
|
|
Restructuring and asset related charges - net 1 |
|
$ |
— |
|
|
$ |
(14 |
) |
|
$ |
(78 |
) |
|
$ |
(92 |
) |
Litigation settlement 2 |
|
|
— |
|
|
|
(85 |
) |
|
|
— |
|
|
|
(85 |
) |
Total |
|
$ |
— |
|
|
$ |
(99 |
) |
|
$ |
(78 |
) |
|
$ |
(177 |
) |
|
|
|
|
|
|
|
|
|
|
|
|
|
|
|
|
|
(In millions) |
Seed |
|
Crop Protection |
|
Corporate |
|
Total |
|
For the Three Months Ended March 31, 2025 |
|
|
|
|
|
|
|
|
|
|
|
|
Restructuring and asset related charges - net 1 |
|
$ |
(3 |
) |
|
$ |
(14 |
) |
|
$ |
(5 |
) |
|
$ |
(22 |
) |
AltEn facility remediation charges 3 |
|
|
(37 |
) |
|
|
— |
|
|
|
— |
|
|
|
(37 |
) |
Total |
|
$ |
(40 |
) |
|
$ |
(14 |
) |
|
$ |
(5 |
) |
|
$ |
(59 |
) |
1.Includes restructuring plans and asset related charges. See Note 4 - Restructuring and Asset Related Charges - Net, to the interim Consolidated Financial Statements, for additional information.
2.Relates to a settlement charge associated with the Crop Protection loyalty program multi-district litigation plaintiffs. See Note 12 - Commitments and Contingent Liabilities, to the interim Consolidated Financial Statements, for additional information.
3.Relates to a charge to increase the remediation accrual at the AltEn facility relating to Corteva's estimated voluntary contribution to the solid waste and wastewater remedial action plans. See Note 12 - Commitments and Contingent Liabilities, to the interim Consolidated Financial Statements, for additional information.
Report of Independent Registered Public Accounting Firm
To the Board of Directors and Stockholders of Corteva, Inc
Opinion on the Financial Statements
We have audited the accompanying consolidated balance sheets of Corteva, Inc. and its subsidiaries (the “Company”) as of December 31, 2025 and 2024, and the related consolidated statements of operations, of comprehensive income (loss), of equity and of cash flows for each of the three years in the period ended December 31, 2025, including the related notes and schedule of valuation and qualifying accounts for each of the three years in the period ended December 31, 2025 listed in the accompanying index (collectively referred to as the “consolidated financial statements”). In our opinion, the consolidated financial statements present fairly, in all material respects, the financial position of the Company as of December 31, 2025 and 2024, and the results of its operations and its cash flows for each of the three years in the period ended December 31, 2025 in conformity with accounting principles generally accepted in the United States of America.
Basis for Opinion
These consolidated financial statements are the responsibility of the Company's management. Our responsibility is to express an opinion on the Company’s consolidated financial statements based on our audits. We are a public accounting firm registered with the Public Company Accounting Oversight Board (United States) (PCAOB) and are required to be independent with respect to the Company in accordance with the U.S. federal securities laws and the applicable rules and regulations of the Securities and Exchange Commission and the PCAOB.
We conducted our audits of these consolidated financial statements in accordance with the standards of the PCAOB. Those standards require that we plan and perform the audits to obtain reasonable assurance about whether the consolidated financial statements are free of material misstatement, whether due to error or fraud.
Our audits included performing procedures to assess the risks of material misstatement of the consolidated financial statements, whether due to error or fraud, and performing procedures that respond to those risks. Such procedures included examining, on a test basis, evidence regarding the amounts and disclosures in the consolidated financial statements. Our audits also included evaluating the accounting principles used and significant estimates made by management, as well as evaluating the overall presentation of the consolidated financial statements. We believe that our audits provide a reasonable basis for our opinion.
Critical Audit Matters
The critical audit matter communicated below is a matter arising from the current period audit of the consolidated financial statements that was communicated or required to be communicated to the audit committee and that (i) relates to accounts or disclosures that are material to the consolidated financial statements and (ii) involved our especially challenging, subjective, or complex judgments. The communication of critical audit matters does not alter in any way our opinion on the consolidated financial statements, taken as a whole, and we are not, by communicating the critical audit matter below, providing a separate opinion on the critical audit matter or on the accounts or disclosures to which it relates.
Revenue Recognition - Product Sales
As described in Notes 2 and 4 to the consolidated financial statements, net sales were $17.401 billion for the year ended December 31, 2025. Substantially all of Corteva’s revenue is derived from product sales. Revenue is recognized from product sales when the customer obtains control of promised goods or services, in an amount that reflects the consideration which the Company expects to receive in exchange for those goods or services. Control transfer occurs at a point in time according to shipping terms. The transaction price includes estimates of variable consideration, such as rights of return, rebates, and discounts, that are reductions in revenue. All estimates are based on the Company’s historical experience, anticipated performance, and management’s best judgment at the time the estimate is made. Estimates of variable consideration included in the transaction price primarily utilize the expected value method based on historical experience. These estimates are reassessed each reporting period and are included in the transaction price to the extent it is probable that a significant reversal of cumulative revenue recognized will not occur upon resolution of uncertainty associated with the variable consideration. The majority of contracts have a single performance obligation satisfied at a point in time and the transaction price is stated in the contract, usually as quantity times price per unit.
The principal consideration for our determination that performing procedures relating to revenue recognition for product sales is a critical audit matter is a high degree of auditor effort in performing procedures related to the Company’s revenue recognition.
Addressing the matter involved performing procedures and evaluating audit evidence in connection with forming our overall opinion on the consolidated financial statements. These procedures included testing the effectiveness of controls relating to the revenue recognition process. These procedures also included, among others (i) evaluating revenue transactions by testing, on a sample basis, the revenue recognized by obtaining and inspecting source documents, such as purchase orders, invoices, shipment or delivery documents, and cash receipts, as applicable; (ii) testing, on a sample basis, the recognition of variable consideration for rebates issued and discounts granted during the year by obtaining and inspecting source documents, such as support for the nature of the variable consideration, amount, and agreement with the customer; and (iii) confirming, on a sample basis, outstanding customer invoice balances as of year-end, and, for confirmations not returned, obtaining and inspecting source documents, including invoices, shipment or delivery documents, and subsequent cash receipts, as applicable.
/s/ PricewaterhouseCoopers LLP
Philadelphia, Pennsylvania
February 12, 2026
We have served as the Company’s or its predecessor’s auditor since 1946.
Corteva, Inc.
Consolidated Statements of Operations
|
|
|
|
|
|
|
|
|
|
|
|
|
(In millions, except per share amounts) |
For the Year Ended December 31, |
|
|
2025 |
|
2024 |
|
2023 |
|
Net sales |
|
$ |
17,401 |
|
|
$ |
16,908 |
|
|
$ |
17,226 |
|
Cost of goods sold |
|
|
9,172 |
|
|
|
9,529 |
|
|
|
9,920 |
|
Research and development expense |
|
|
1,474 |
|
|
|
1,402 |
|
|
|
1,337 |
|
Selling, general and administrative expenses |
|
|
3,492 |
|
|
|
3,196 |
|
|
|
3,176 |
|
Amortization of intangibles |
|
|
644 |
|
|
|
685 |
|
|
|
683 |
|
Restructuring and asset related charges - net |
|
|
146 |
|
|
|
288 |
|
|
|
336 |
|
Separation costs |
|
|
35 |
|
|
|
— |
|
|
|
— |
|
Other income (expense) - net |
|
|
(570 |
) |
|
|
(300 |
) |
|
|
(448 |
) |
Interest expense |
|
|
180 |
|
|
|
233 |
|
|
|
233 |
|
Income (loss) from continuing operations before income taxes |
|
|
1,688 |
|
|
|
1,275 |
|
|
|
1,093 |
|
Provision for (benefit from) income taxes on continuing operations |
|
|
484 |
|
|
|
412 |
|
|
|
152 |
|
Income (loss) from continuing operations after income taxes |
|
|
1,204 |
|
|
|
863 |
|
|
|
941 |
|
Income (loss) from discontinued operations after income taxes |
|
|
(99 |
) |
|
|
56 |
|
|
|
(194 |
) |
Net income (loss) |
|
|
1,105 |
|
|
|
919 |
|
|
|
747 |
|
Net income (loss) attributable to noncontrolling interests |
|
|
11 |
|
|
|
12 |
|
|
|
12 |
|
Net income (loss) attributable to Corteva |
|
$ |
1,094 |
|
|
$ |
907 |
|
|
$ |
735 |
|
Basic earnings (loss) per share of common stock: |
|
|
|
|
|
|
|
|
|
Basic earnings (loss) per share of common stock from continuing operations |
|
$ |
1.75 |
|
|
$ |
1.23 |
|
|
$ |
1.31 |
|
Basic earnings (loss) per share of common stock from discontinued operations |
|
|
(0.15 |
) |
|
|
0.08 |
|
|
|
(0.27 |
) |
Basic earnings (loss) per share of common stock |
|
$ |
1.60 |
|
|
$ |
1.31 |
|
|
$ |
1.04 |
|
Diluted earnings (loss) per share of common stock: |
|
|
|
|
|
|
|
|
|
Diluted earnings (loss) per share of common stock from continuing operations |
|
$ |
1.75 |
|
|
$ |
1.22 |
|
|
$ |
1.30 |
|
Diluted earnings (loss) per share of common stock from discontinued operations |
|
|
(0.15 |
) |
|
|
0.08 |
|
|
|
(0.27 |
) |
Diluted earnings (loss) per share of common stock |
|
$ |
1.60 |
|
|
$ |
1.30 |
|
|
$ |
1.03 |
|
See Notes to the Consolidated Financial Statements
Corteva, Inc.
Consolidated Statements of Comprehensive Income (Loss)
|
|
|
|
|
|
|
|
|
|
|
|
|
|
For the Year Ended December 31, |
|
(In millions) |
2025 |
|
2024 |
|
2023 |
|
Net Income (loss) |
|
$ |
1,105 |
|
|
$ |
919 |
|
|
$ |
747 |
|
Other comprehensive income (loss) - net of tax: |
|
|
|
|
|
|
|
|
|
Cumulative translation adjustments |
|
|
867 |
|
|
|
(1,014 |
) |
|
|
425 |
|
Adjustments to pension benefit plans |
|
|
(152 |
) |
|
|
127 |
|
|
|
(190 |
) |
Adjustments to other benefit plans |
|
|
(26 |
) |
|
|
30 |
|
|
|
29 |
|
Unrealized gain (loss) on investments |
|
|
6 |
|
|
|
(6 |
) |
|
|
— |
|
Derivative instruments |
|
|
(23 |
) |
|
|
71 |
|
|
|
(135 |
) |
Total other comprehensive income (loss) |
|
|
672 |
|
|
|
(792 |
) |
|
|
129 |
|
Comprehensive income (loss) |
|
|
1,777 |
|
|
|
127 |
|
|
|
876 |
|
Comprehensive income (loss) attributable to noncontrolling interests - net of tax |
|
|
11 |
|
|
|
12 |
|
|
|
12 |
|
Comprehensive income (loss) attributable to Corteva |
|
$ |
1,766 |
|
|
$ |
115 |
|
|
$ |
864 |
|
See Notes to the Corteva Consolidated Financial Statements
Corteva, Inc.
Consolidated Balance Sheets
|
|
|
|
|
|
|
|
|
(In millions) |
December 31, 2025 |
|
December 31, 2024 |
|
Assets |
|
|
|
|
|
|
Current assets |
|
|
|
|
|
|
Cash and cash equivalents |
|
$ |
4,521 |
|
|
$ |
3,106 |
|
Marketable securities |
|
|
9 |
|
|
|
63 |
|
Accounts and notes receivable - net |
|
|
6,371 |
|
|
|
5,676 |
|
Inventories |
|
|
5,667 |
|
|
|
5,432 |
|
Other current assets |
|
|
767 |
|
|
|
820 |
|
Total current assets |
|
|
17,335 |
|
|
|
15,097 |
|
Investment in nonconsolidated affiliates |
|
|
160 |
|
|
|
134 |
|
Property, plant and equipment |
|
|
9,551 |
|
|
|
9,074 |
|
Less: Accumulated depreciation |
|
|
5,331 |
|
|
|
4,975 |
|
Net property, plant and equipment |
|
|
4,220 |
|
|
|
4,099 |
|
Goodwill |
|
|
10,465 |
|
|
|
10,408 |
|
Other intangible assets |
|
|
8,301 |
|
|
|
8,876 |
|
Deferred income taxes |
|
|
320 |
|
|
|
401 |
|
Other assets |
|
|
2,044 |
|
|
|
1,810 |
|
Total Assets |
|
$ |
42,845 |
|
|
$ |
40,825 |
|
Liabilities and Equity |
|
|
|
|
|
|
Current liabilities |
|
|
|
|
|
|
Short-term borrowings and finance lease obligations |
|
$ |
894 |
|
|
$ |
750 |
|
Accounts payable |
|
|
4,398 |
|
|
|
4,039 |
|
Income taxes payable |
|
|
155 |
|
|
|
207 |
|
Deferred revenue |
|
|
3,579 |
|
|
|
3,287 |
|
Accrued and other current liabilities |
|
|
3,099 |
|
|
|
2,103 |
|
Total current liabilities |
|
|
12,125 |
|
|
|
10,386 |
|
Long-term debt |
|
|
1,686 |
|
|
|
1,953 |
|
Other noncurrent liabilities |
|
|
|
|
|
|
Deferred income tax liabilities |
|
|
251 |
|
|
|
478 |
|
Pension and other post-employment benefits |
|
|
2,434 |
|
|
|
2,271 |
|
Other noncurrent obligations |
|
|
1,963 |
|
|
|
1,707 |
|
Total noncurrent liabilities |
|
|
6,334 |
|
|
|
6,409 |
|
Commitments and contingent liabilities |
|
|
|
|
|
|
Stockholders' equity |
|
|
|
|
|
|
Common stock, $0.01 par value;1,666,667,000 shares authorized;
issued at December 31, 2025 - 672,163,000 and December 31, 2024 - 685,595,000 |
|
|
7 |
|
|
|
7 |
|
Additional paid-in capital |
|
|
27,001 |
|
|
|
27,196 |
|
Retained earnings (accumulated deficit) |
|
|
(67 |
) |
|
|
55 |
|
Accumulated other comprehensive income (loss) |
|
|
(2,797 |
) |
|
|
(3,469 |
) |
Total Corteva stockholders' equity |
|
|
24,144 |
|
|
|
23,789 |
|
Noncontrolling interests |
|
|
242 |
|
|
|
241 |
|
Total equity |
|
|
24,386 |
|
|
|
24,030 |
|
Total Liabilities and Equity |
|
$ |
42,845 |
|
|
$ |
40,825 |
|
See Notes to the Consolidated Financial Statements
Corteva, Inc.
Consolidated Statements of Cash Flows
|
|
|
|
|
|
|
|
|
|
|
|
|
|
For the Year Ended December 31, |
|
(In millions) |
2025 |
|
2024 |
|
2023 |
|
Operating activities |
|
|
|
|
|
|
|
|
|
Net income (loss) |
|
$ |
1,105 |
|
|
$ |
919 |
|
|
$ |
747 |
|
(Income) loss from discontinued operations after income taxes |
|
|
99 |
|
|
|
(56 |
) |
|
|
194 |
|
Adjustments to reconcile net income (loss) to cash provided by (used for) operating activities: |
|
|
|
|
|
|
|
|
|
Depreciation and amortization |
|
|
1,203 |
|
|
|
1,227 |
|
|
|
1,211 |
|
Provision for (benefit from) deferred income tax |
|
|
(41 |
) |
|
|
(365 |
) |
|
|
(438 |
) |
Net periodic pension and OPEB (benefit) cost, net |
|
|
36 |
|
|
|
160 |
|
|
|
138 |
|
Pension and OPEB contributions |
|
|
(136 |
) |
|
|
(151 |
) |
|
|
(149 |
) |
Net (gain) loss on sales of property, businesses, consolidated companies and investments |
|
|
(41 |
) |
|
|
(17 |
) |
|
|
(22 |
) |
Restructuring and asset related charges – net |
|
|
146 |
|
|
|
288 |
|
|
|
336 |
|
Other net loss |
|
|
545 |
|
|
|
383 |
|
|
|
578 |
|
Changes in assets and liabilities, net |
|
|
|
|
|
|
|
|
|
Accounts and notes receivable |
|
|
(261 |
) |
|
|
(705 |
) |
|
|
358 |
|
Inventories |
|
|
(35 |
) |
|
|
1,110 |
|
|
|
57 |
|
Accounts payable |
|
|
231 |
|
|
|
(115 |
) |
|
|
(663 |
) |
Deferred revenue |
|
|
270 |
|
|
|
(86 |
) |
|
|
(11 |
) |
Other assets and liabilities |
|
|
336 |
|
|
|
(296 |
) |
|
|
(527 |
) |
Cash provided by (used for) operating activities - continuing operations |
|
|
3,457 |
|
|
|
2,296 |
|
|
|
1,809 |
|
Cash provided by (used for) operating activities - discontinued operations |
|
|
(51 |
) |
|
|
(151 |
) |
|
|
(40 |
) |
Cash provided by (used for) operating activities |
|
|
3,406 |
|
|
|
2,145 |
|
|
|
1,769 |
|
Investing activities |
|
|
|
|
|
|
|
|
|
Capital expenditures |
|
|
(591 |
) |
|
|
(597 |
) |
|
|
(595 |
) |
Proceeds from sales of property, businesses and consolidated companies - net of cash divested |
|
|
54 |
|
|
|
5 |
|
|
|
57 |
|
Acquisitions of businesses - net of cash acquired |
|
|
— |
|
|
|
— |
|
|
|
(1,456 |
) |
Investments in and loans to nonconsolidated affiliates |
|
|
(20 |
) |
|
|
(7 |
) |
|
|
(32 |
) |
Purchases of investments |
|
|
— |
|
|
|
(144 |
) |
|
|
(148 |
) |
Proceeds from sales and maturities of investments |
|
|
135 |
|
|
|
130 |
|
|
|
147 |
|
Proceeds from (payments for) settlement of net investment hedge |
|
|
(83 |
) |
|
|
63 |
|
|
|
42 |
|
Other investing activities, net |
|
|
(38 |
) |
|
|
(39 |
) |
|
|
(2 |
) |
Cash provided by (used for) investing activities |
|
|
(543 |
) |
|
|
(589 |
) |
|
|
(1,987 |
) |
Financing activities |
|
|
|
|
|
|
|
|
|
Net change in borrowings (less than 90 days) |
|
|
— |
|
|
|
53 |
|
|
|
(6 |
) |
Proceeds from debt |
|
|
1,730 |
|
|
|
3,072 |
|
|
|
3,429 |
|
Payments on debt |
|
|
(1,871 |
) |
|
|
(2,885 |
) |
|
|
(2,309 |
) |
Repurchase of common stock |
|
|
(1,071 |
) |
|
|
(1,009 |
) |
|
|
(756 |
) |
Proceeds from exercise of stock options |
|
|
88 |
|
|
|
60 |
|
|
|
31 |
|
Dividends paid to stockholders |
|
|
(475 |
) |
|
|
(458 |
) |
|
|
(439 |
) |
Other financing activities, net |
|
|
(45 |
) |
|
|
(32 |
) |
|
|
(49 |
) |
Cash provided by (used for) financing activities |
|
|
(1,644 |
) |
|
|
(1,199 |
) |
|
|
(99 |
) |
Effect of exchange rate changes on cash, cash equivalents and restricted cash equivalents |
|
|
84 |
|
|
|
(93 |
) |
|
|
(143 |
) |
Increase (decrease) in cash, cash equivalents and restricted cash equivalents |
|
|
1,303 |
|
|
|
264 |
|
|
|
(460 |
) |
Cash, cash equivalents and restricted cash equivalents at beginning of period |
|
|
3,422 |
|
|
|
3,158 |
|
|
|
3,618 |
|
Cash, cash equivalents and restricted cash equivalents at end of period |
|
$ |
4,725 |
|
|
$ |
3,422 |
|
|
$ |
3,158 |
|
Supplemental cash flow information |
|
|
|
|
|
|
|
|
|
Cash paid during the period for: |
|
|
|
|
|
|
|
|
|
Interest, net of amounts capitalized |
|
$ |
191 |
|
|
$ |
244 |
|
|
$ |
234 |
|
Income taxes |
|
|
750 |
|
|
|
707 |
|
|
|
535 |
|
1. See Note 6 - Supplemental Information, to the Corteva Consolidated Financial Statements for reconciliation of cash and cash equivalents and restricted cash equivalents presented in the Consolidated Balance Sheets to total cash, cash equivalents and restricted cash equivalents presented in the Consolidated Statements of Cash Flows.
See Notes to the Consolidated Financial Statements
Corteva, Inc.
Consolidated Statements of Equity
|
|
|
|
|
|
|
|
|
|
|
|
|
|
|
|
|
|
|
|
|
|
|
|
|
(In millions) |
Common Stock |
|
Additional Paid-in Capital |
|
Retained Earnings (Accum. Deficit) |
|
Accumulated
Other
Comp.
Income (Loss) |
|
Non-Controlling
Interests |
|
Total
Equity |
|
Balance at January 1, 2023 |
|
$ |
7 |
|
|
$ |
27,851 |
|
|
$ |
250 |
|
|
$ |
(2,806 |
) |
|
$ |
239 |
|
|
$ |
25,541 |
|
Net income (loss) |
|
|
|
|
|
|
|
|
735 |
|
|
|
|
|
|
12 |
|
|
|
747 |
|
Other comprehensive income (loss) |
|
|
|
|
|
|
|
|
|
|
|
129 |
|
|
|
|
|
|
129 |
|
Share-based compensation |
|
|
|
|
|
28 |
|
|
|
(2 |
) |
|
|
|
|
|
|
|
|
26 |
|
Common dividends ($0.62 per share) |
|
|
|
|
|
|
|
|
(439 |
) |
|
|
|
|
|
|
|
|
(439 |
) |
Repurchase of common stock |
|
|
|
|
|
(171 |
) |
|
|
(585 |
) |
|
|
|
|
|
|
|
|
(756 |
) |
Issuance of Corteva stock |
|
|
|
|
|
40 |
|
|
|
|
|
|
|
|
|
|
|
|
40 |
|
Other - net |
|
|
|
|
|
|
|
|
|
|
|
|
|
|
(9 |
) |
|
|
(9 |
) |
Balance at December 31, 2023 |
|
$ |
7 |
|
|
$ |
27,748 |
|
|
$ |
(41 |
) |
|
$ |
(2,677 |
) |
|
$ |
242 |
|
|
$ |
25,279 |
|
Net income (loss) |
|
|
|
|
|
|
|
|
907 |
|
|
|
|
|
|
12 |
|
|
|
919 |
|
Other comprehensive income (loss) |
|
|
|
|
|
|
|
|
|
|
|
(792 |
) |
|
|
|
|
|
(792 |
) |
Share-based compensation |
|
|
|
|
|
47 |
|
|
|
(2 |
) |
|
|
|
|
|
|
|
|
45 |
|
Common dividends ($0.66 per share) |
|
|
|
|
|
(229 |
) |
|
|
(229 |
) |
|
|
|
|
|
|
|
|
(458 |
) |
Repurchase of common stock |
|
|
|
|
|
(430 |
) |
|
|
(579 |
) |
|
|
|
|
|
|
|
|
(1,009 |
) |
Issuance of Corteva stock |
|
|
|
|
|
60 |
|
|
|
|
|
|
|
|
|
|
|
|
60 |
|
Other - net |
|
|
|
|
|
|
|
|
(1 |
) |
|
|
|
|
|
(13 |
) |
|
|
(14 |
) |
Balance at December 31, 2024 |
|
$ |
7 |
|
|
$ |
27,196 |
|
|
$ |
55 |
|
|
$ |
(3,469 |
) |
|
$ |
241 |
|
|
$ |
24,030 |
|
Net income (loss) |
|
|
|
|
|
|
|
|
1,094 |
|
|
|
|
|
|
11 |
|
|
|
1,105 |
|
Other comprehensive income (loss) |
|
|
|
|
|
|
|
|
|
|
|
672 |
|
|
|
|
|
|
672 |
|
Share-based compensation |
|
|
|
|
|
57 |
|
|
|
(2 |
) |
|
|
|
|
|
|
|
|
55 |
|
Common dividends ($0.70 per share) |
|
|
|
|
|
(116 |
) |
|
|
(359 |
) |
|
|
|
|
|
|
|
|
(475 |
) |
Repurchase of common stock |
|
|
|
|
|
(221 |
) |
|
|
(850 |
) |
|
|
|
|
|
|
|
|
(1,071 |
) |
Issuance of Corteva stock |
|
|
|
|
|
88 |
|
|
|
|
|
|
|
|
|
|
|
|
88 |
|
Other - net |
|
|
|
|
|
(3 |
) |
|
|
(5 |
) |
|
|
|
|
|
(10 |
) |
|
|
(18 |
) |
Balance at December 31, 2025 |
|
$ |
7 |
|
|
$ |
27,001 |
|
|
$ |
(67 |
) |
|
$ |
(2,797 |
) |
|
$ |
242 |
|
|
$ |
24,386 |
|
See Notes to the Consolidated Financial Statements
Corteva, Inc.
Notes to Consolidated Financial Statements
NOTE 1 - BACKGROUND AND BASIS OF PRESENTATION
Corteva, Inc. is a leading global provider of seed and crop protection solutions focused on the agriculture industry. The company intends to leverage its rich heritage of scientific achievement to advance its robust innovation pipeline and continue to shape the future of responsible agriculture. The company's broad portfolio of agriculture solutions fuels farmer productivity around the globe. Corteva has two operating segments: Seed and Crop Protection. See Note 22 - Segment Information, to the Consolidated Financial Statements, for additional information on the company's operating segments.
Throughout these financial statements, except as otherwise noted by the context, the terms "Corteva" or "company" used herein mean Corteva, Inc. and its consolidated subsidiaries (including EIDP) and the term “EIDP” used herein means EIDP, Inc. (formerly known as E. I. du Pont de Nemours and Company) and its consolidated subsidiaries or EIDP, Inc. excluding its consolidated subsidiaries, as the context may indicate.
Principles of Consolidation and Basis of Presentation
The consolidated financial statements contained in this Annual Report were prepared in accordance with accounting principles generally accepted in the United States of America ("U.S. GAAP") for all periods presented and include the accounts of the company, its majority owned subsidiaries over which the company exercises control. The Consolidated Financial Statements and other financial information included in this Annual Report, unless otherwise specified, have been presented to separately show the effects of discontinued operations.
On June 1, 2019, Corteva, Inc. became an independent, publicly traded company through the completed separation of the agriculture business (the “Corteva Separation”) of DuPont de Nemours, Inc. (formerly known as DowDuPont Inc.) (“DowDuPont” or “DuPont”). The Corteva Separation was effectuated through a pro rata distribution (the “Corteva Distribution”) of all of the then-issued and outstanding shares of common stock of Corteva, Inc.
Prior to the Corteva Separation, subsequent to the Merger, Historical Dow and EIDP engaged in a series of internal reorganization and realignment steps to realign their businesses into three subgroups: agriculture, materials science and specialty products ("Internal Reorganization"). On April 1, 2019, DowDuPont completed the separation of its materials science business into a separate and independent public company by way of a distribution of Dow common stock to holders of DowDuPont's common stock (the “Dow Distribution” and together with the Corteva Distribution, the “Distributions”).
On April 1, 2019, Historical Dow entities, which held certain assets and liabilities aligned with Historical Dow’s agriculture business and the assets and liabilities associated with its specialty products business, respectively, were transferred and conveyed to DowDuPont.
On April 1, 2019 and May 1, 2019, EIDP’s materials science and specialty products entities, along with their respective assets and liabilities, were conveyed to Dow and DowDuPont, respectively. On May 2, 2019, DowDuPont conveyed Historical Dow agricultural entities to EIDP.
On May 6, 2019, the Board of Directors of DowDuPont approved the distribution of all the then issued and outstanding shares of common stock of Corteva, Inc., then a wholly-owned subsidiary of DowDuPont, to DowDuPont stockholders. On May 31, 2019, DowDuPont contributed EIDP to Corteva, Inc. and on June 1, 2019, the Corteva Separation was completed. Information related to the Corteva Distribution and its effect on the company's financial statements is discussed throughout these Notes to the Consolidated Financial Statements.
Since 2018, Argentina has been considered a highly-inflationary economy under U.S. GAAP and, therefore, the U.S. Dollar (“USD”) is the functional currency for our related subsidiaries. Argentina contributes approximately 3 percent to the company's annual net sales and approximately 1 percent to each of the company's annual Seed and Crop Protection segment operating EBITDA. The company remeasures net monetary assets and translates the financial statements utilizing the official Argentine Peso (“Peso”) to USD exchange rate. The ability to draw down Peso cash balances is limited at this time due to government restrictions and market availability of U.S. Dollars. The devaluation of the Peso relative to the USD over the last several years has resulted in the recognition of exchange losses (refer to Note 6 – Supplementary Information, to the Consolidated Financial Statements). The Argentina government has offered USD-denominated bonds to importers, the proceeds from which could be used to pay off outstanding intercompany payables. As of December 31, 2025, the company holds these foreign government bonds with an amortized cost of $30 million as part of its strategy to manage its net monetary asset exposure in Argentina. Refer to the “Debt Securities” section in Note 19 - Financial Instruments, to the Consolidated Financial Statements, for additional information. As of December 31, 2025, a further 10 percent deterioration in the official Peso to
USD exchange rate would not have a significant impact on the USD value of our net monetary assets or pre-tax earnings. The company will continue to assess the implications to its operations and financial reporting.
NOTE 2 - SUMMARY OF SIGNIFICANT ACCOUNTING POLICIES
The Consolidated Financial Statements include the accounts of the company and subsidiaries in which a controlling interest is maintained. For those consolidated subsidiaries in which the company's ownership is less than 100 percent, the outside stockholders' interests are shown as noncontrolling interests. Investments in affiliates over which the company has the ability to exercise significant influence but does not have a controlling interest are accounted for under the equity method.
The company is also involved with certain joint ventures accounted for under the equity method of accounting that are variable interest entities ("VIEs"). The company is not the primary beneficiary, as the nature of the company's involvement with each VIE does not provide it the power to direct the VIE's significant activities. Future events may require these VIEs to be consolidated if the company becomes the primary beneficiary. At December 31, 2025 and 2024, the maximum exposure to loss related to the nonconsolidated VIEs is not considered material to the Consolidated Financial Statements.
Use of Estimates in Financial Statement Preparation
The preparation of financial statements in accordance with U.S. GAAP requires the use of estimates and assumptions that affect the reported amounts of assets and liabilities, the disclosure of contingent assets and liabilities at the date of the financial statements, and the reported amounts of revenues and expenses during the reporting period. The company’s consolidated financial statements include amounts that are based on management’s best estimates and judgments. Actual results could differ from those estimates.
Cash and Cash Equivalents
Cash equivalents represent highly liquid investments with maturities of three months or less from time of purchase. They are carried at cost plus accrued interest.
Restricted Cash Equivalents
Restricted cash equivalents primarily relates to a trust funded by EIDP for cash obligations under certain non-qualified benefit and deferred compensation plans due to the Merger, which was a change in control event, and contributions to escrow accounts established for the settlement of certain legal matters and the settlement of legacy PFAS matters and the associated qualified spend. Corteva classifies restricted cash equivalents as current or noncurrent based on the nature of the restrictions, which are included in other current assets and other assets, respectively, in the Consolidated Balance Sheets. See Note 6 - Supplementary Information, to the Consolidated Financial Statements, for further information.
Marketable Securities
Marketable securities represent investments in fixed and floating rate financial instruments with maturities greater than three months and up to twelve months at time of purchase. Investments classified as held-to-maturity are recorded at amortized cost. The carrying value approximates fair value due to the short-term nature of the investments. Investments classified as debt securities that are available-for-sale are carried at estimated fair value with unrealized gains and losses recorded as a component of accumulated other comprehensive income (loss) or current period earnings if an allowance for credit losses has been established. The cost of investments sold is determined by specific identification.
Fair Value Measurements
Under the accounting guidance for fair value measurements and disclosures, a fair value hierarchy was established that prioritizes the inputs to valuation techniques used to measure fair value. A financial instrument's level within the fair value hierarchy is based on the lowest level of any input that is significant to the fair value measurement.
The company uses the following hierarchy to classify assets and liabilities measured at fair value:
|
|
|
Level 1 |
– |
Quoted market prices in active markets for identical assets or liabilities. |
|
|
|
Level 2 |
– |
Significant other observable inputs (e.g., quoted prices for similar items in active markets, quoted prices for identical or similar items in markets that are not active, inputs other than quoted prices that are observable such as interest rate and yield curves, and market-corroborated inputs). |
|
|
|
Level 3 |
– |
Unobservable inputs for the asset or liability, which are valued based on management's estimates of assumptions that market participants would use in pricing the asset or liability. |
Foreign Currency Translation
The company's worldwide operations utilize the USD or a related foreign currency as the functional currency, where applicable. The company identifies its separate and distinct foreign entities and groups the foreign entities into two categories: (i) extension of the parent or foreign subsidiaries operating in a highly-inflationary environment (USD functional currency) and (ii) self-contained (related foreign functional currency). If a foreign entity does not align with either category, factors are evaluated and a judgment is made to determine the functional currency.
For foreign entities where the USD is the functional currency, all foreign currency-denominated asset and liability amounts are re-measured into USD at end-of-period exchange rates, except for inventories, prepaid expenses, property, plant and equipment, goodwill and other intangible assets, which are re-measured at historical rates. Foreign currency income and expenses are re-measured at average exchange rates in effect during each month, except for expenses related to balance sheet amounts re-measured at historical exchange rates. Exchange gains and losses arising from re-measurement of foreign currency-denominated monetary assets and liabilities are included in income in the period in which they occur.
For foreign entities where a related foreign currency is the functional currency, assets and liabilities denominated in the related foreign currencies are translated into USD at end-of-period exchange rates and the resultant translation adjustments are reported, net of their related tax effects, as a component of accumulated other comprehensive income (loss) in equity. Assets and liabilities denominated in other than the functional currency are re-measured into the functional currency prior to translation into USD and the resultant exchange gains or losses are included in income in the period in which they occur. Income and expenses are translated into USD at average exchange rates in effect during each month.
The company changes the functional currency of its separate and distinct foreign entities only when significant changes in economic facts and circumstances indicate clearly that the functional currency has changed.
Inventories
The company's inventories are valued at the lower of cost or net realizable value. Elements of cost in inventories include raw materials, direct labor and manufacturing overhead. Stores and supplies are valued at cost or net realizable value, whichever is lower; cost is generally determined by the average cost method.
As of both December 31, 2025 and 2024, approximately 60 percent and 40 percent of the company's inventories were accounted for under the first-in, first-out ("FIFO") and average cost methods, respectively. Inventories accounted for under the FIFO method are primarily comprised of products with shorter shelf lives such as seeds. See Note 10 - Inventories, to the Consolidated Financial Statements, for further information.
The company establishes an obsolescence reserve for inventory based upon quality considerations and assumptions about future demand and market conditions.
Goodwill and Other Intangible Assets
The company records goodwill when the purchase price of a business acquisition exceeds the estimated fair value of net identified tangible and intangible assets acquired. Goodwill is tested for impairment at the reporting unit level at least annually, or more frequently when events or changes in circumstances indicate that the fair value of a reporting unit has more likely than not declined below its carrying value. The company performs an annual goodwill impairment test in the fourth quarter at the reporting unit level, which is defined as the operating segment or one level below the operating segment. One level below the operating segment, or component, is a business in which discrete financial information is available and regularly reviewed by segment management. The company aggregates certain components into reporting units based on economic similarities. The company’s reporting units are Seed and Crop Protection.
When testing goodwill for impairment, the company has the option to first perform qualitative testing to determine whether it is more likely than not that the fair value of a reporting unit is less than its carrying value. If the company chooses not to complete a qualitative assessment for a given reporting unit or if the initial assessment indicates that it is more likely than not that the carrying value of a reporting unit exceeds its estimated fair value, additional quantitative testing is required. If additional quantitative testing is required, the reporting unit's fair value is compared with its carrying amount, and an impairment charge, if any, is recognized for the amount by which the carrying amount exceeds the reporting unit's fair value, limited to the amount of goodwill associated with the reporting unit. The company determines fair values for each of the reporting units using a discounted cash flow model (a form of the income approach). Under the income approach, fair value is determined based on the present value of estimated future cash flows, discounted at an appropriate risk-adjusted rate. The company's significant assumptions in this analysis include future cash flow projections, weighted average cost of capital, the terminal growth rate, and the tax rate. See Note 12 - Goodwill and Other Intangible Assets, to the Consolidated Financial Statements, for further information on goodwill.
Definite-lived intangible assets are amortized over their estimated useful lives, generally on a straight-line basis for periods ranging primarily from 2 years to 25 years. The company continually evaluates the reasonableness of the useful lives of these assets. Once these assets are no longer considered held and used, they are removed from the Consolidated Balance Sheets.
Acquisitions
Acquisitions are recorded using the acquisition method of accounting which recognizes and measures the identifiable assets acquired and liabilities assumed as of the acquisition date at fair value, where applicable. The excess, if any, of total consideration transferred in a business combination over the fair value of identifiable assets acquired and liabilities assumed is recognized as goodwill. Costs incurred as a result of a business combination other than costs related to the issuance of debt or equity securities are recorded in the period the costs are incurred. The company includes the operating results of acquired entities from their respective dates of acquisition.
Leases
The company determines whether an arrangement is a lease at the inception of the arrangement based on the terms and conditions in the contract. A contract contains a lease if there is an identified asset and the company has the right to control the asset. Operating lease right-of-use ("ROU") assets are included in other assets on the company’s Consolidated Balance Sheets. Operating lease liabilities are included in accrued and other current liabilities and other noncurrent obligations on the company’s Consolidated Balance Sheets. Finance lease assets are included in property, plant and equipment on the company’s Consolidated Balance Sheets. Finance lease liabilities are included in short-term borrowings and finance lease obligations and long-term debt on the company’s Consolidated Balance Sheets.
Operating lease ROU assets represent the company’s right to use an underlying asset for the lease term and lease liabilities represent the company’s obligation to make lease payments arising from the lease. Operating lease ROU assets and liabilities are recognized at the commencement date based on the present value of lease payments over the lease term. As most of the company’s leases do not provide the lessor's implicit rate, the company uses its incremental borrowing rate at the commencement date in determining the present value of lease payments. Lease terms include options to extend the lease when it is reasonably certain those options will be exercised. Leases with an initial term of 12 months or less are not recorded on the Consolidated Balance Sheets. The company recognizes lease expense for these leases on a straight-line basis over the lease term.
The company has lease agreements with lease and non-lease components, which are accounted for as a single lease component for all asset classes. In the Consolidated Statements of Operations, lease expense for operating leases is recognized on a straight-line basis over the lease term. For finance leases, interest expense is recognized on the lease liability and the ROU asset is amortized over the lease term. See Note 13 - Leases, to the Consolidated Financial Statements, for further information.
Impairment of Long-Lived Assets
The company evaluates the carrying value of long-lived assets to be held and used when events or changes in circumstances indicate the carrying value may not be recoverable. The carrying value of a long-lived asset group is considered impaired when the total projected undiscounted cash flows from the assets are separately identifiable and are less than its carrying value. In that event, a loss is recognized based on the amount by which the carrying value exceeds the fair value of the long-lived asset group. The company's fair value methodology is an estimate of fair market value which is made based on prices of similar assets or other valuation methodologies including present value techniques. Long-lived assets to be disposed of by sale, if material, are classified as held for sale and reported at the lower of carrying amount or fair value less cost to sell, and depreciation is ceased. Long-lived assets to be disposed of other than by sale are classified as held and used until they are disposed of and reported at the lower of carrying amount or fair value. Depreciation is recognized over the remaining useful life of the assets.
Derivative Instruments
Derivative instruments are reported in the Consolidated Balance Sheets at their fair values. The company utilizes derivatives to manage exposures to foreign currency exchange rates and commodity prices. Changes in the fair values of derivative instruments that are not designated as hedges are recorded in current period earnings. For derivative instruments designated as cash flow hedges, the gain (loss) is reported in accumulated other comprehensive income (loss) until it is cleared to earnings during the same period in which the hedged item affects earnings. For derivative instruments designated as net investment hedges, the gain (loss) is reported within accumulated other comprehensive income (loss) until the subsidiary is divested.
In the event that a derivative designated as a hedge of a firm commitment or an anticipated transaction is terminated prior to the maturation of the hedged transaction, the net gain or loss in accumulated other comprehensive income (loss) generally remains in accumulated other comprehensive income (loss) until the item that was hedged affects earnings. If a hedged transaction matures, or is sold, extinguished, or terminated prior to the maturity of a derivative designated as a hedge of such transaction, gains or losses associated with the derivative through the date the transaction matured are included in the measurement of the hedged transaction and the derivative
is reclassified as for trading purposes. Derivatives designated as hedges of anticipated transactions are reclassified as for trading purposes if the anticipated transaction is no longer probable.
The company included foreign currency exchange contract settlements within cash flows from operating activities, regardless of hedge accounting qualification. See Note 19 - Financial Instruments, to the Consolidated Financial Statements, for additional discussion regarding the company's objectives and strategies for derivative instruments.
Environmental Matters
Accruals for environmental matters are recorded when it is probable that a liability has been incurred and the amount of the liability can be reasonably estimated. These accruals are adjusted periodically as assessment and remediation efforts progress or as additional technical or legal information becomes available. Accruals for environmental liabilities are included in the Consolidated Balance Sheets in accrued and other current liabilities and other noncurrent obligations at undiscounted amounts. Accruals for related insurance or other third-party recoveries for environmental liabilities are recorded when it is probable that a recovery will be realized and are included in the Consolidated Balance Sheets as accounts and notes receivable - net.
Environmental costs are capitalized if the costs extend the life of the property, increase its capacity, and/or mitigate or prevent contamination from future operations. Environmental costs are also capitalized in recognition of legal asset retirement obligations resulting from the acquisition, construction and/or normal operation of a long-lived asset. Costs related to environmental contamination treatment and cleanup are charged to expense. Estimated future incremental operations, maintenance and management costs directly related to remediation are accrued when such costs are probable and reasonably estimable.
Revenue Recognition
The company recognizes revenue when its customer obtains control of promised goods or services, in an amount that reflects the consideration which the company expects to receive in exchange for those goods or services. To determine the revenue recognition for an arrangement considered to be a contract with a customer, the company performs the following five steps: (1) identify the contract(s) with a customer, (2) identify the performance obligations in the contract, (3) determine the transaction price, (4) allocate the transaction price to the performance obligations in the contract, and (5) recognize revenue when (or as) the entity satisfies a performance obligation. See Note 4 - Revenue, to the Consolidated Financial Statements, for additional information on revenue recognition.
Cost of Goods Sold
Cost of goods sold primarily includes the cost of manufacture and delivery, ingredients or raw materials, direct salaries, wages and benefits and overhead, non-capitalizable costs associated with capital projects, royalties and other operational expenses. No amortization of intangibles is included within cost of goods sold.
Research and Development
Research and development costs are expensed as incurred. Research and development expense includes costs (primarily consisting of employee costs, materials, contract services, research agreements, and other external spend) relating to the discovery and development of new products.
Selling, General and Administrative Expenses
Selling, general and administrative expenses primarily include selling and marketing expenses, commissions, functional costs, and business management expenses.
Litigation and Other Contingencies
Accruals for legal matters and other contingencies are recorded when it is probable that a liability has been incurred and the amount of the liability can be reasonably estimated. Legal costs, such as outside counsel fees and expenses, are charged to expense in the period incurred.
Severance Costs
Severance benefits are provided to employees under the company's ongoing benefit arrangements. Severance costs are accrued when management commits to a plan of termination and it becomes probable that employees will be entitled to benefits at amounts that can be reasonably estimated.
Insurance/Self-Insurance
The company self-insures certain risks where permitted by law or regulation, including workers' compensation, vehicle liability and employee related benefits. Liabilities associated with these risks are estimated in part by considering historical claims experience, demographic factors and other actuarial assumptions. For other risks, the company uses a combination of insurance and self-insurance,
reflecting comprehensive reviews of relevant risks. A receivable for an insurance recovery is generally recognized when the loss has occurred and collection is considered probable.
Income Taxes
The company accounts for income taxes using the asset and liability method. Under this method, deferred tax assets and liabilities are recognized for the future tax consequences of temporary differences between the carrying amounts and tax bases of assets and liabilities using enacted tax rates. The effect of a change in tax rates on deferred tax assets or liabilities is recognized in income in the period that includes the enactment date.
The company recognizes the financial statement effects of an uncertain income tax position when it is more likely than not, based on the technical merits, that the position will be sustained upon examination. The current portion of uncertain income tax positions is included in income taxes payable or accounts and notes receivable - net, and the long-term portion is included in other noncurrent obligations or other assets in the Consolidated Balance Sheets.
Income tax related penalties are included in the provision for (benefit from) income taxes in the Consolidated Statements of Operations. Interest accrued related to unrecognized tax benefits is included within the provision for (benefit from) income taxes from continuing operations in the Consolidated Statements of Operations.
Earnings per Common Share
The calculation of earnings per common share is based on the weighted-average number of the company’s common shares outstanding for the applicable period. The calculation of diluted earnings per common share reflects the effect of all potential common shares that were outstanding during the respective periods, unless the effect of doing so is antidilutive.
NOTE 3 - RECENT ACCOUNTING GUIDANCE
Recently Adopted Accounting Guidance
In December 2023, the Financial Accounting Standards Board (“FASB”) issued Accounting Standards Update ("ASU") 2023-09, Income Taxes (Topic 740): Improvements to Income Tax Disclosures. The ASU requires that an entity disclose specific categories in the effective tax rate reconciliation as well as reconciling items that meet a quantitative threshold. Further, the ASU requires additional disclosures on income tax expense and taxes paid, net of refunds received, by jurisdiction. The new standard is effective for annual periods beginning after December 15, 2024 on a prospective basis with the option to apply it retrospectively. Early adoption is permitted. The company adopted this guidance on a prospective basis and has included enhanced income tax related disclosures in Note 7 - Income Taxes, to the Consolidated Financial Statements.
In November 2023, the FASB issued ASU 2023-07, Segment Reporting (Topic 280): Improvements to Reportable Segment Disclosures. This ASU includes amendments that expand the existing reportable segment disclosure requirements and requires disclosure of (i) significant expense categories and amounts by reportable segment as well as the segment’s profit or loss measure(s) that are regularly provided to the chief operating decision maker (the “CODM”) to allocate resources and assess performance; (ii) how the CODM uses each reported segment profit or loss measure to allocate resources and assess performance; (iii) the nature of other segment balances contributing to reported segment profit or loss that are not captured within segment revenues or expenses; and (iv) the title and position of the individual or name of the group or committee identified as the CODM. This guidance requires retrospective application to all prior periods presented in the financial statements and is effective for fiscal years beginning after December 15, 2023 and interim periods within fiscal years beginning after December 15, 2024. Early adoption is permitted. The company adopted this guidance and has included enhanced disclosures relating to its reportable segments. See Note 22 - Segment Information, to the Consolidated Financial Statements, for the company's updated disclosure.
Accounting Guidance Issued But Not Adopted as of December 31, 2025
In November 2024, the FASB issued ASU 2024-03, Income Statement—Reporting Comprehensive Income—Expense Disaggregation Disclosures (Subtopic 220-40): Disaggregation of Income Statement Expenses. This ASU includes amendments that require entities to bifurcate specified expense line items on the income statement into underlying components, including purchases of inventory, employee compensation, depreciation, intangible asset amortization and depletion, as applicable. Qualitative descriptions of the remaining components are required. These enhanced disclosures are required for both interim and annual periods. Selling expenses must also be separately disclosed for both interim and annual periods, along with an annual qualitative description of the composition of selling expenses. In January 2025, the FASB subsequently issued ASU 2025-01, Income Statement—Reporting Comprehensive Income—Expense Disaggregation Disclosures (Subtopic 220-40): Clarifying the Effective Date, to provide clarification on the ASU's effective date. The new standard is effective for fiscal years beginning after December 15, 2026 on a prospective basis with the option to apply it retrospectively, and for interim periods within fiscal years beginning after December 15, 2027. Early adoption is permitted. The adoption of this guidance will result in the company being required to include enhanced disclosures around income statement expenses.
NOTE 4 - REVENUE
Revenue Recognition
Products
Substantially all of Corteva's revenue is derived from product sales, which consist of sales of Corteva's products to farmers, distributors, and manufacturers. Corteva considers purchase orders, which in some cases are governed by master supply agreements, to be a contract with a customer. Contracts with customers are considered to be short-term when the time between order confirmation and satisfaction of the performance obligations is equal to or less than one year. However, the company has some long-term contracts which can span multiple years.
Revenue from product sales is recognized when the customer obtains control of the company's product, which occurs at a point in time according to shipping terms. Payment terms are generally less than one year from invoicing. The company elected the practical expedient and does not adjust the promised amount of consideration for the effects of a significant financing component when the company expects it will be one year or less between when a customer obtains control of the company's product and when payment is due. When the company performs shipping and handling activities after the transfer of control to the customer (e.g., when control transfers prior to or at shipment), these are considered fulfillment activities, and accordingly, the costs are accrued when the related revenue is recognized. Taxes collected from customers relating to product sales and remitted to governmental authorities are excluded from revenues. In addition, the company elected the practical expedient to expense any costs to obtain contracts as incurred, as the amortization period for these costs would have been one year or less.
The transaction price includes estimates of variable consideration, such as rights of return, rebates, and discounts, that are reductions in revenue. All estimates are based on the company's historical experience, anticipated performance, and the company's best judgment at the time the estimate is made. Estimates of variable consideration included in the transaction price primarily utilize the expected value method based on historical experience. These estimates are reassessed each reporting period and are included in the transaction price to the extent it is probable that a significant reversal of cumulative revenue recognized will not occur upon resolution of uncertainty associated with the variable consideration. The majority of contracts have a single performance obligation satisfied at a point in time and the transaction price is stated in the contract, usually as quantity times price per unit. For contracts with multiple performance obligations, the company allocates the transaction price to each performance obligation based on the relative standalone selling price. The standalone selling price is the observable price which depicts the price as if sold to a similar customer in similar circumstances.
Licenses of Intellectual Property
Corteva enters into licensing arrangements with customers to license its intellectual property. Revenue from the majority of intellectual property licenses is derived from sales-based royalties. Revenue for licensing agreements that contain sales-based royalties is recognized at the later of (i) when the subsequent sale occurs or (ii) when the performance obligation to which some or all of the royalty has been allocated is satisfied.
Remaining Performance Obligations
Remaining performance obligations represent the transaction price allocated to unsatisfied or partially unsatisfied performance obligations. The company applies the practical expedient to disclose the transaction price allocated to the remaining performance obligations for only those contracts with an original duration of more than one year. The transaction price allocated to remaining performance obligations with an original duration of more than one year related to material rights granted to customers for contract renewal options were $150 million and $139 million at December 31, 2025 and December 31, 2024, respectively. The company expects revenue to be recognized for the remaining performance obligations evenly over a period of six years.
Contract Balances
Contract liabilities primarily reflect deferred revenue from prepayments under contracts with customers where the company receives advance payments for products to be delivered in future periods. Corteva classifies deferred revenue as current or noncurrent based on the timing of when the company expects to recognize revenue. Contract assets primarily include amounts related to conditional rights to consideration for completed performance not yet invoiced. Accounts receivable are recorded when the right to consideration becomes unconditional.
|
|
|
|
|
|
|
|
|
Contract Balances |
December 31, 2025 |
|
December 31, 2024 |
|
(In millions) |
|
|
|
|
Accounts and notes receivable - trade 1 |
|
$ |
5,034 |
|
|
$ |
4,615 |
|
Contract assets — current 2 |
|
|
34 |
|
|
|
30 |
|
Contract assets — noncurrent 3 |
|
|
83 |
|
|
|
74 |
|
Deferred revenue — current |
|
|
3,579 |
|
|
|
3,287 |
|
Deferred revenue — noncurrent 4 |
|
|
125 |
|
|
|
114 |
|
1.Included in accounts and notes receivable - net in the Consolidated Balance Sheets.
2.Included in other current assets in the Consolidated Balance Sheets.
3.Included in other assets in the Consolidated Balance Sheets.
4.Included in other noncurrent obligations in the Consolidated Balance Sheets.
Revenue recognized during the years ended December 31, 2025, 2024 and 2023 from amounts included in deferred revenue at the beginning of the period was $3,247 million, $3,359 million and $3,342 million, respectively.
Disaggregation of Revenue
Corteva's operations are classified into two operating segments: Seed and Crop Protection. The company disaggregates its revenue by major product line and geographic region, as the company believes it best depicts the nature, amount and timing of its revenue and cash flows. Net sales by major product line are included below:
|
|
|
|
|
|
|
|
|
|
|
|
|
|
For the Year Ended December 31, |
|
(In millions) |
2025 |
|
2024 |
|
2023 |
|
Corn |
|
$ |
7,002 |
|
|
$ |
6,496 |
|
|
$ |
6,447 |
|
Soybean |
|
|
1,878 |
|
|
|
1,927 |
|
|
|
1,858 |
|
Other oilseeds |
|
|
644 |
|
|
|
653 |
|
|
|
708 |
|
Other |
|
|
374 |
|
|
|
469 |
|
|
|
459 |
|
Seed |
|
|
9,898 |
|
|
|
9,545 |
|
|
|
9,472 |
|
Herbicides |
|
|
3,730 |
|
|
|
3,599 |
|
|
|
4,034 |
|
Insecticides |
|
|
1,669 |
|
|
|
1,715 |
|
|
|
1,598 |
|
Fungicides |
|
|
1,140 |
|
|
|
1,081 |
|
|
|
1,112 |
|
Biologicals |
|
|
519 |
|
|
|
476 |
|
|
|
491 |
|
Other |
|
|
445 |
|
|
|
492 |
|
|
|
519 |
|
Crop Protection |
|
|
7,503 |
|
|
|
7,363 |
|
|
|
7,754 |
|
Total |
|
$ |
17,401 |
|
|
$ |
16,908 |
|
|
$ |
17,226 |
|
Sales are attributed to geographic regions based on customer location. Net sales by geographic region and segment are included below:
|
|
|
|
|
|
|
|
|
|
|
|
|
Seed |
For the Year Ended December 31, |
|
(In millions) |
2025 |
|
2024 |
|
2023 |
|
North America 1 |
|
$ |
6,271 |
|
|
$ |
6,033 |
|
|
$ |
5,768 |
|
EMEA 2 |
|
|
1,560 |
|
|
|
1,581 |
|
|
|
1,622 |
|
Latin America |
|
|
1,614 |
|
|
|
1,523 |
|
|
|
1,637 |
|
Asia Pacific |
|
|
453 |
|
|
|
408 |
|
|
|
445 |
|
Total |
|
$ |
9,898 |
|
|
$ |
9,545 |
|
|
$ |
9,472 |
|
|
|
|
|
|
|
|
|
|
|
|
|
|
Crop Protection |
For the Year Ended December 31, |
|
(In millions) |
2025 |
|
2024 |
|
2023 |
|
North America 1 |
|
$ |
2,753 |
|
|
$ |
2,627 |
|
|
$ |
2,822 |
|
EMEA 2 |
|
|
1,550 |
|
|
|
1,543 |
|
|
|
1,745 |
|
Latin America |
|
|
2,314 |
|
|
|
2,253 |
|
|
|
2,269 |
|
Asia Pacific |
|
|
886 |
|
|
|
940 |
|
|
|
918 |
|
Total |
|
$ |
7,503 |
|
|
$ |
7,363 |
|
|
$ |
7,754 |
|
1.Represents U.S. & Canada.
2.Europe, Middle East, and Africa ("EMEA").
Refer to Note 21 - Geographic Information, to the Consolidated Financial Statements, for the breakout of consolidated net sales by geographic area.
NOTE 5 - RESTRUCTURING AND ASSET RELATED CHARGES – NET
Crop Protection Operations Strategy Restructuring Program
On November 5, 2023, management of the company approved a plan to further optimize its Crop Protection network of manufacturing and external partners (the "Crop Protection Operations Strategy Restructuring Program"). The plan includes the exit of the company’s production activities at its site in Pittsburg, California, as well as ceasing operations in select manufacturing lines at other locations. In October 2024, management of the company amended the Crop Protection Operations Strategy Restructuring Program to include updates to its previous estimates and decommissioning and demolition costs associated with the ceasing of operations, primarily at the Pittsburg, California site.
The company expects to record aggregate pre-tax restructuring and asset related charges of $650 million to $700 million, comprised of $85 million to $105 million of severance and related benefit costs, $320 million to $340 million of asset-related and impairment charges, and $245 million to $255 million of costs related to exiting the company's production activities and ceasing operations (inclusive of decommissioning and demolition costs and contract terminations). Decommissioning and demolition costs are expensed on an as-incurred basis. Reductions in workforce are subject to local regulatory requirements. Through the year ended December 31, 2025, the company recorded net pre-tax restructuring and asset related charges of $611 million inception-to-date under the Crop Protection Operations Strategy Restructuring Program, consisting of $102 million of severance and related benefit costs, $340 million of asset-related and impairment charges, $70 million of decommissioning and demolition costs and $99 million of costs related to contract terminations. The pre-tax restructuring and asset related charges noted above include charges relating to spare parts write-offs recognized during the fourth quarter of 2023, which impacted the Crop Protection segment, and were included in cost of goods sold, in the company's Consolidated Statements of Operations for the year ended December 31, 2023. See Note 22 - Segment Information, to the Consolidated Financial Statements, for additional information.
Cash payments related to these charges are anticipated to be $330 million to $360 million, which primarily relate to the payment of severance and related benefits, decommissioning and demolition costs and contract terminations. Through December 31, 2025, the company paid $177 million associated with these charges. The restructuring actions associated with these charges are expected to be substantially complete by the end of 2026.
The following table is a summary of charges incurred related to the Crop Protection Operations Strategy Restructuring Program for the years ended December 31, 2025, 2024 and 2023:
|
|
|
|
|
|
|
|
|
|
|
|
|
|
For the Year Ended December 31, |
|
(In millions) |
2025 |
|
2024 |
|
2023 |
|
Severance and related benefit costs 1 |
|
$ |
11 |
|
|
$ |
91 |
|
|
$ |
— |
|
Asset related charges 2,3 |
|
|
13 |
|
|
|
101 |
|
|
|
214 |
|
Decommissioning and demolition costs 2 |
|
|
60 |
|
|
|
10 |
|
|
|
— |
|
Contract termination charges 2 |
|
|
66 |
|
|
|
30 |
|
|
|
3 |
|
Total restructuring and asset related charges - net 4 |
|
$ |
150 |
|
|
$ |
232 |
|
|
$ |
217 |
|
1.Reflects corporate related charges.
2.Reflects charges which are substantially all associated with the Crop Protection segment.
3.Asset-related charges includes impairment charges related to operating lease assets and property, plant and equipment.
4.This amount excludes charges relating to spare parts write-offs included in cost of goods sold for the year ended December 31, 2023, in the company's Consolidated Statement of Operations.
The following table summarizes changes to liability balances related to the Crop Protection Operations Strategy Restructuring Program for the years ended December 31, 2024 and 2025, respectively:
|
|
|
|
|
|
|
|
|
|
|
|
|
|
|
|
(In millions) |
Severance and Related Benefit Costs |
Asset Related Charges1 |
Decommissioning and Demolition Costs |
Contract Termination Charges |
Total |
Balance at December 31, 2023 |
|
$ |
— |
|
$ |
— |
|
$ |
— |
|
$ |
— |
|
$ |
— |
Charges to income from continuing operations |
|
|
91 |
|
|
101 |
|
|
10 |
|
|
30 |
|
|
232 |
Payments |
|
|
(21) |
|
|
— |
|
|
(10) |
|
|
(30) |
|
|
(61) |
Asset write-offs |
|
|
— |
|
|
(101) |
|
|
— |
|
|
— |
|
|
(101) |
Balance at December 31, 2024 |
|
$ |
70 |
|
$ |
— |
|
$ |
— |
|
$ |
— |
|
$ |
70 |
Charges to income from continuing operations |
|
|
11 |
|
|
13 |
|
|
60 |
|
|
66 |
|
|
150 |
Payments |
|
|
(49) |
|
|
— |
|
|
(52) |
|
|
(12) |
|
|
(113) |
Asset write-offs |
|
|
— |
|
|
(13) |
|
|
— |
|
|
— |
|
|
(13) |
Balance at December 31, 2025 |
|
$ |
32 |
|
$ |
— |
|
$ |
8 |
|
$ |
54 |
|
$ |
94 |
1.Asset-related charges includes impairment charges related to operating lease assets and property, plant and equipment.
Other Asset Related Charges
The company holds a non-exclusive license in the United States and Canada for the Monsanto Company's Genuity® Roundup Ready 2 Yield®glyphosate tolerance trait and Roundup Ready 2 Xtend® glyphosate and dicamba tolerance trait for soybeans, which was obtained by the company’s wholly owned subsidiary, Pioneer Hi-Bred International, Inc. (“Pioneer”) (“Roundup Ready 2 License Agreement”). Each of these licensed technologies are now trademarks of the Bayer Group, which acquired the Monsanto Company in 2018. The prepaid royalty asset relates to a series of up-front, fixed and variable royalty payments to utilize the traits in Pioneer’s soybean product mix. The company’s historical expectation was that the technology licensed under the Roundup Ready 2 License Agreement would be used as the primary herbicide tolerance trait platform in the Pioneer® brand soybean through the term of the agreement. Dow Agrosciences LLC and MS Technologies, L.L.C. jointly developed and own the Enlist E3TM herbicide tolerance trait for soybeans which provides tolerance to 2,4-D choline in Enlist Duo® and Enlist One® herbicides, as well as glyphosate and glufosinate herbicides. In connection with the validation of breeding plans and large-scale product development timelines, during 2019 the company committed to accelerate the ramp up of the Enlist E3TM trait platform in the company’s soybean portfolio mix across all brands, including Pioneer® brands. Due to the five-year ramp-up of Enlist E3TM, the company significantly reduced the volume of products with the Roundup Ready 2 Yield® and Roundup Ready 2 Xtend® herbicide tolerance traits, with expected minimal use of the trait platform thereafter for the remainder of the Roundup Ready 2 License Agreement (the “Transition Plan”). The rate of royalty expense had therefore increased significantly through higher amortization of the prepaid royalty as fewer seeds containing the respective trait were expected to be utilized.
In connection with the departure from these traits, beginning January 1, 2020 the company presents and discloses the non-cash accelerated prepaid royalty amortization expense as a component of restructuring and asset related charges - net, in the Consolidated Statements of Operations. For the years ended December 31, 2025, 2024 and 2023, the company recognized $— million, $55 million and $72 million, respectively, in restructuring and asset related charges - net in the Consolidated Statements of Operations, from non-cash accelerated prepaid royalty amortization expense related to Roundup Ready 2 Yield® and Roundup Ready 2 Xtend® herbicide tolerance traits, which as of the end of the second quarter of 2024 was complete.
NOTE 6 - SUPPLEMENTARY INFORMATION
|
|
|
|
|
|
|
|
|
|
|
|
|
Other Income (Expense) - Net |
For the Year Ended December 31, |
|
(In millions) |
2025 |
|
2024 |
|
2023 |
|
Interest income |
|
$ |
136 |
|
|
$ |
132 |
|
|
$ |
283 |
|
Equity in earnings (losses) of affiliates - net |
|
|
13 |
|
|
|
15 |
|
|
|
10 |
|
Net gain (loss) on sales of businesses and other assets |
|
|
41 |
|
|
|
17 |
|
|
|
22 |
|
Net exchange gains (losses) 1 |
|
|
(181 |
) |
|
|
(284 |
) |
|
|
(397 |
) |
Non-operating pension and other post-employment benefit credits (costs) 2 |
|
|
(23 |
) |
|
|
(144 |
) |
|
|
(119 |
) |
Miscellaneous income (expenses) - net 3 |
|
|
(556 |
) |
|
|
(36 |
) |
|
|
(247 |
) |
Other income (expense) - net |
|
$ |
(570 |
) |
|
$ |
(300 |
) |
|
$ |
(448 |
) |
1.Includes net pre-tax exchange gains (losses) of $(34) million, $(66) million and $(284) million, associated with impacts from the devaluation of the Argentine peso for the years ended December 31, 2025, 2024 and 2023, respectively.
2.Includes non-service related components of net periodic benefit credits (costs) (interest cost, expected return on plan assets, amortization of unrecognized gain (loss), amortization of prior service benefit and settlement gain (loss)).
3.Includes losses from sale of receivables, tax indemnification adjustments related to changes in indemnification balances as a result of the application of the terms of the Tax Matters Agreement between Corteva and Dow and/or DuPont, and other items. The year ended December 31, 2025 includes a charge related to the Bayer resolution offset by the receipt of insurance proceeds. The year ended December 31, 2024 includes the receipt of insurance proceeds and an indemnification payment negotiated with the prior Stoller owners. The years ended December 31, 2024 and 2023 also include estimated settlement reserves. The year ended December 31, 2023 also includes an Employee Retention Credit pursuant to the Coronavirus Aid, Relief, and Economic Security (“CARES”) Act as enhanced by the Consolidated Appropriations Act (“CAA”) and American Rescue Plan Act (“ARPA”). See Note 22 - Segment Information, to the Consolidated Financial Statements, for additional information on significant items.
The following table summarizes the impacts of the company's foreign currency hedging program on the company's results of operations. The company routinely uses foreign currency exchange contracts to offset its net exposures, by currency, related to the foreign currency-denominated monetary assets and liabilities. The objective of this program is to maintain an approximately balanced position in foreign currencies in order to minimize, on an after-tax basis, the effects of exchange rate changes on net monetary asset positions. The hedging program gains (losses) are largely taxable (tax deductible) in the United States, whereas the offsetting exchange gains (losses) on the remeasurement of the net monetary asset positions are often not taxable (tax deductible) in their local jurisdictions. The net pre-tax exchange gains (losses) are recorded in other income (expense) - net and the related tax impact is recorded in provision for (benefit from) income taxes on continuing operations in the Consolidated Statements of Operations.
|
|
|
|
|
|
|
|
|
|
|
|
|
|
For the Year Ended December 31, |
|
(In millions) |
2025 |
|
2024 |
|
2023 |
|
Subsidiary Monetary Position Gain (Loss) |
|
|
|
|
|
|
|
|
|
Pre-tax exchange gain (loss) |
|
$ |
(254 |
) |
|
$ |
(152 |
) |
|
$ |
(371 |
) |
Local tax (expenses) benefits |
|
|
11 |
|
|
|
11 |
|
|
|
55 |
|
Net after-tax impact from subsidiary exchange gain (loss) |
|
$ |
(243 |
) |
|
$ |
(141 |
) |
|
$ |
(316 |
) |
|
|
|
|
|
|
|
|
|
|
Hedging Program Gain (Loss) |
|
|
|
|
|
|
|
|
|
Pre-tax exchange gain (loss) |
|
$ |
73 |
|
|
$ |
(132 |
) |
|
$ |
(26 |
) |
Tax (expenses) benefits |
|
|
(8 |
) |
|
|
26 |
|
|
|
7 |
|
Net after-tax impact from hedging program exchange gain (loss) |
|
$ |
65 |
|
|
$ |
(106 |
) |
|
$ |
(19 |
) |
|
|
|
|
|
|
|
|
|
|
Total Exchange Gain (Loss) |
|
|
|
|
|
|
|
|
|
Pre-tax exchange gain (loss) |
|
$ |
(181 |
) |
|
$ |
(284 |
) |
|
$ |
(397 |
) |
Tax (expenses) benefits |
|
|
3 |
|
|
|
37 |
|
|
|
62 |
|
Net after-tax exchange gain (loss) |
|
$ |
(178 |
) |
|
$ |
(247 |
) |
|
$ |
(335 |
) |
|
|
|
|
|
|
|
|
|
|
Noncontrolling interest adjustment |
|
|
— |
|
|
|
1 |
|
|
|
— |
|
|
|
|
|
|
|
|
|
|
|
Net after-tax exchange gain (loss) attributable to Corteva |
|
$ |
(178 |
) |
|
$ |
(246 |
) |
|
$ |
(335 |
) |
Cash, Cash Equivalents and Restricted Cash Equivalents
The following table provides a reconciliation of cash and cash equivalents and restricted cash equivalents presented in the Consolidated Balance Sheets to the total cash, cash equivalents and restricted cash equivalents presented in the Consolidated Statements of Cash Flows. Corteva classifies restricted cash equivalents as current or noncurrent based on the nature of the restrictions, which are included in other current assets and other assets, respectively, in the Consolidated Balance Sheets.
|
|
|
|
|
|
|
|
|
(In millions) |
December 31, 2025 |
|
December 31, 2024 |
|
Cash and cash equivalents |
|
$ |
4,521 |
|
|
$ |
3,106 |
|
Restricted cash equivalents |
|
|
204 |
|
|
|
316 |
|
Total cash, cash equivalents and restricted cash equivalents |
|
$ |
4,725 |
|
|
$ |
3,422 |
|
Restricted cash equivalents primarily relates to a trust funded by EIDP for cash obligations under certain non-qualified benefit and deferred compensation plans due to the Merger, which was a change in control event, and contributions to escrow accounts established for the settlement of certain legal matters and the settlement of legacy PFAS matters and the associated qualified spend. During the second quarter of 2024, the company's previously-restricted cash in the Water District Settlement Fund, which was established by Corteva, EIDP, Inc., DuPont and Chemours in September 2023 under the Nationwide Water District Settlement, was released. All of the company's restricted cash equivalents are classified as current as of December 31, 2025 and 2024, except for the $15 million MOU Escrow Account balance at December 31, 2024.
Accounts Payable
Accounts payable was $4,398 million and $4,039 million at December 31, 2025 and 2024, respectively. Accounts payable - trade, which is a component of accounts payable, was $2,871 million and $2,632 million at December 31, 2025 and 2024, respectively. Included in accounts payable – trade was seed grower compensation of approximately $420 million and $410 million at December 31, 2025 and 2024, respectively, which is measured at fair value using Level 2 inputs. Accrued discounts and rebates, which is a component of accounts payable, was $1,328 million and $1,207 million at December 31, 2025 and 2024, respectively. No other components of accounts payable were more than five percent of total current liabilities.
NOTE 7 - INCOME TAXES
Domestic and foreign components of income (loss) from continuing operations before income taxes and the provision for (benefit from) current and deferred tax expense (benefit) are shown below:
|
|
|
|
|
|
|
|
|
|
|
|
|
Geographic Allocation of Income (Loss) and Provision for (Benefit from) Income Taxes |
For the Year Ended December 31, |
|
(In millions) |
2025 |
|
2024 |
|
2023 |
|
Income (loss) from continuing operations before income taxes |
|
|
|
|
|
|
|
|
|
Domestic |
|
$ |
325 |
|
|
$ |
324 |
|
|
$ |
(414 |
) |
Foreign |
|
|
1,363 |
|
|
|
951 |
|
|
|
1,507 |
|
Income (loss) from continuing operations before income taxes |
|
$ |
1,688 |
|
|
$ |
1,275 |
|
|
$ |
1,093 |
|
Current tax expense (benefit) |
|
|
|
|
|
|
|
|
|
Federal |
|
$ |
87 |
|
|
$ |
285 |
|
|
$ |
143 |
|
State and local |
|
|
26 |
|
|
|
45 |
|
|
|
40 |
|
Foreign |
|
|
412 |
|
|
|
447 |
|
|
|
407 |
|
Total current tax expense (benefit) |
|
$ |
525 |
|
|
$ |
777 |
|
|
$ |
590 |
|
Deferred tax expense (benefit) |
|
|
|
|
|
|
|
|
|
Federal |
|
$ |
(139 |
) |
|
$ |
(300 |
) |
|
$ |
(326 |
) |
State and local |
|
|
(24 |
) |
|
|
(28 |
) |
|
|
(50 |
) |
Foreign |
|
|
122 |
|
|
|
(37 |
) |
|
|
(62 |
) |
Total deferred tax expense (benefit) |
|
$ |
(41 |
) |
|
$ |
(365 |
) |
|
$ |
(438 |
) |
Provision for (benefit from) income taxes on continuing operations |
|
|
484 |
|
|
|
412 |
|
|
|
152 |
|
Net income (loss) from continuing operations after taxes |
|
$ |
1,204 |
|
|
$ |
863 |
|
|
$ |
941 |
|
The table below provides the updated disclosure requirements of ASU 2023-09, which was adopted on a prospective basis for the year ended December 31, 2025. See Note 3 - Recent Accounting Guidance, to the Consolidated Financial Statements, for a description of the relevant disclosure requirements.
The effective income tax rate applicable to income (loss) from continuing operations before income taxes was different from the statutory U.S. federal income tax rate due to the factors listed in the following table:
|
|
|
|
|
|
|
|
|
Reconciliation to U.S. Statutory Rate |
For the Year Ended December 31, |
|
|
2025 |
|
($ In millions) |
$ |
|
% |
|
U.S. Federal statutory tax rate |
|
$ |
354 |
|
|
|
21.0 |
% |
State and local income tax, net of federal (national) income tax effect 1 |
|
|
5 |
|
|
|
0.3 |
% |
Foreign tax effects |
|
|
|
|
|
|
Argentina |
|
|
|
|
|
|
Statutory tax rate differential |
|
|
(17 |
) |
|
|
(1.0 |
)% |
Withholding tax |
|
|
18 |
|
|
|
1.1 |
% |
Exchange gains/losses |
|
|
(31 |
) |
|
|
(1.8 |
)% |
Changes in valuation allowances |
|
|
73 |
|
|
|
4.3 |
% |
Other |
|
|
(3 |
) |
|
|
(0.2 |
)% |
Brazil |
|
|
|
|
|
|
Withholding tax |
|
|
37 |
|
|
|
2.2 |
% |
Changes in valuation allowances 2 |
|
|
153 |
|
|
|
9.1 |
% |
Other |
|
|
(4 |
) |
|
|
(0.2 |
)% |
India |
|
|
|
|
|
|
Statutory tax rate differential |
|
|
17 |
|
|
|
1.0 |
% |
Agriculture exemption |
|
|
(41 |
) |
|
|
(2.4 |
)% |
Withholding tax |
|
|
31 |
|
|
|
1.8 |
% |
Other |
|
|
1 |
|
|
|
0.1 |
% |
Switzerland |
|
|
|
|
|
|
Statutory tax rate differential |
|
|
(91 |
) |
|
|
(5.4 |
)% |
Cantonal income tax, net |
|
|
59 |
|
|
|
3.5 |
% |
Other |
|
|
(1 |
) |
|
|
(0.1 |
)% |
Other foreign jurisdictions |
|
|
49 |
|
|
|
2.9 |
% |
Effect of cross-border tax laws (net of related foreign tax credits) |
|
|
|
|
|
|
Global Intangible Low-Taxed Income (GILTI) |
|
|
24 |
|
|
|
1.4 |
% |
Other |
|
|
12 |
|
|
|
0.7 |
% |
Tax credits |
|
|
|
|
|
|
U.S. research and development credit |
|
|
(47 |
) |
|
|
(2.8 |
)% |
Other foreign tax credits |
|
|
(52 |
) |
|
|
(3.1 |
)% |
Changes in valuation allowances 3 |
|
|
74 |
|
|
|
4.4 |
% |
Nontaxable or nondeductible items |
|
|
31 |
|
|
|
1.8 |
% |
Changes in unrecognized tax benefits |
|
|
(19 |
) |
|
|
(1.1 |
)% |
Other |
|
|
|
|
|
|
Capital loss 3 |
|
|
(77 |
) |
|
|
(4.6 |
)% |
Legal entity tax characterization 4 |
|
|
(49 |
) |
|
|
(2.9 |
)% |
Other |
|
|
(22 |
) |
|
|
(1.3 |
)% |
Effective tax rate |
|
$ |
484 |
|
|
|
28.7 |
% |
1.State taxes in Minnesota made up the majority (greater than 50%) of the tax effect in this category.
2.For the year ended December 31, 2025, the company established a valuation allowance recorded against the net deferred tax asset position of a legal entity in Brazil (Crop Protection business) in the amount of $132 million.
3.For the year ended December 31, 2025, a U.S. federal tax benefit of $(27) million, net of valuation allowance, was recorded to recognize a capital loss in a wholly owned foreign investment.
4.For the year ended December 31, 2025, a U.S. federal deferred tax benefit was recorded associated with a change in a legal entity's U.S. tax characterization in the amount of $(49) million.
As previously disclosed for the years ended December 31, 2024 and 2023, prior to the adoption of ASU 2023-09, the effective income tax rate differs from the statutory federal income tax rate as follows:
|
|
|
|
|
|
|
|
|
Reconciliation to U.S. Statutory Rate |
For the Year Ended December 31, |
|
|
2024 |
|
2023 |
|
Statutory U.S. federal income tax rate |
|
|
21.0 |
% |
|
|
21.0 |
% |
Effective tax rates on international operations - net 1 |
|
|
4.8 |
|
|
|
(1.8 |
) |
Acquisitions, divestitures and ownership restructuring activities 2 |
|
|
(1.1 |
) |
|
|
3.6 |
|
U.S. research and development credit |
|
|
(4.7 |
) |
|
|
(5.9 |
) |
Exchange gains/losses 3 |
|
|
1.7 |
|
|
|
2.0 |
|
State and local incomes taxes - net |
|
|
1.3 |
|
|
|
0.9 |
|
Impact of Swiss Tax Changes 4 |
|
|
— |
|
|
|
(7.9 |
) |
Excess tax benefits/deficiencies from stock compensation |
|
|
(0.2 |
) |
|
|
(0.5 |
) |
Tax settlements and expiration of statute of limitations |
|
|
(1.7 |
) |
|
|
(0.3 |
) |
Impact of Brazil valuation allowance 6 |
|
|
9.4 |
|
|
|
— |
|
Repatriation of foreign earnings 5 |
|
|
1.7 |
|
|
|
2.9 |
|
Other – net |
|
|
0.1 |
|
|
|
(0.1 |
) |
Effective tax rate on income from continuing operations |
|
|
32.3 |
% |
|
|
13.9 |
% |
1.Includes the effects of local and U.S. taxes related to earnings of non-U.S. subsidiaries, changes in the amount of unrecognized tax benefits associated with these earnings, losses at non-U.S. subsidiaries without local tax benefits due to valuation allowances, and other permanent differences between tax and U.S. GAAP results.
2.Includes net tax charge of $46 million for the year ended December 31, 2023, associated with intellectual property realignment.
3.Principally reflects the impact of foreign exchange gains and losses on net monetary assets for which no corresponding tax impact is realized. Further information about the company's foreign currency hedging program is included in Note 6 - Supplementary Information, and Note 19 - Financial Instruments, to the Consolidated Financial Statements, under the heading "Foreign Currency Risk."
4.Includes net tax benefits of $(62) million and $(24) million for the year ended December 31, 2023, related to changes in deferred taxes and a tax currency change, respectively.
5.Includes the effect of withholding tax on distribution of foreign earnings to the U.S., net of U.S. foreign tax credits.
6.For the year ended December 31, 2024, a charge of $120 million was recorded to establish a valuation allowance against the net deferred tax asset position of a legal entity in Brazil (Seed business).
Significant jurisdictions in which income taxes were paid (net of refunds received) are shown below:
|
|
|
|
|
Income Taxes Paid, Net |
For the Year Ended December 31, |
|
(In millions) |
2025 |
|
US Federal |
|
$ |
195 |
|
US State and Local |
|
|
49 |
|
Brazil |
|
|
72 |
|
India |
|
|
42 |
|
Switzerland, Federal |
|
|
59 |
|
Switzerland, Geneva |
|
|
46 |
|
Other Foreign |
|
|
287 |
|
Total |
|
$ |
750 |
|
Significant components of the company's net deferred tax asset (liability) were attributable to:
|
|
|
|
|
|
|
|
|
|
|
|
|
|
|
|
|
Deferred Tax Balances |
December 31, 2025 |
|
December 31, 2024 |
|
(In millions) |
Assets |
|
Liabilities |
|
Assets |
|
Liabilities |
|
Property |
|
$ |
— |
|
|
$ |
347 |
|
|
$ |
— |
|
|
$ |
278 |
|
Operating loss and tax credit carryforwards 1 |
|
631 |
|
|
|
— |
|
|
|
552 |
|
|
|
— |
|
Accrued employee benefits |
|
678 |
|
|
|
— |
|
|
|
671 |
|
|
|
— |
|
Other accruals and reserves |
|
767 |
|
|
|
— |
|
|
|
590 |
|
|
|
— |
|
Intangibles |
|
|
— |
|
|
|
1,828 |
|
|
|
— |
|
|
|
1,950 |
|
Inventory |
|
275 |
|
|
|
— |
|
|
|
184 |
|
|
|
— |
|
Research and development capitalization |
|
689 |
|
|
|
— |
|
|
|
761 |
|
|
|
— |
|
Investments |
|
53 |
|
|
|
— |
|
|
|
69 |
|
|
|
— |
|
Unrealized exchange gains/losses |
|
|
— |
|
|
4 |
|
|
|
— |
|
|
|
50 |
|
Other — net |
|
42 |
|
|
|
— |
|
|
|
40 |
|
|
|
— |
|
Subtotal |
|
$ |
3,135 |
|
|
$ |
2,179 |
|
|
$ |
2,867 |
|
|
$ |
2,278 |
|
Valuation allowances 2 |
|
|
(887 |
) |
|
|
— |
|
|
|
(666 |
) |
|
|
— |
|
Total |
|
$ |
2,248 |
|
|
$ |
2,179 |
|
|
$ |
2,201 |
|
|
$ |
2,278 |
|
Net deferred tax asset (liability) |
|
$ |
69 |
|
|
|
|
|
$ |
(77 |
) |
|
|
|
1.Primarily related to tax loss and credit carryforwards from operations in the United States, Argentina, Brazil, Switzerland, and Spain.
2.During the year ended December 31, 2025, the company established a valuation allowance recorded against the net deferred tax asset position of a legal entity in Brazil (Crop Protection business) in the amount of $132 million. During the year ended December 31, 2024, the company established a valuation allowance against the net deferred tax asset position of a legal entity in Brazil (Seed business) in the amount of $120 million.
Details of the company’s operating loss and tax credit carryforwards are shown in the following table:
|
|
|
|
|
|
|
|
|
Operating Loss and Tax Credit Carryforwards |
Deferred Tax Asset |
|
(In millions) |
December 31, 2025 |
|
December 31, 2024 |
|
Operating loss carryforwards |
|
|
|
|
|
|
Expire within 5 years |
|
$ |
290 |
|
|
$ |
222 |
|
Expire after 5 years or indefinite expiration |
|
|
213 |
|
|
|
226 |
|
Total operating loss carryforwards |
|
$ |
503 |
|
|
$ |
448 |
|
Tax credit carryforwards |
|
|
|
|
|
|
Expire within 5 years |
|
$ |
25 |
|
|
$ |
13 |
|
Expire after 5 years or indefinite expiration |
|
|
103 |
|
|
|
91 |
|
Total tax credit carryforwards |
|
$ |
128 |
|
|
$ |
104 |
|
Total operating loss and tax credit carryforwards |
|
$ |
631 |
|
|
$ |
552 |
|
A reconciliation of the beginning and ending amount of gross unrecognized tax benefits is as follows:
|
|
|
|
|
|
|
|
|
|
|
|
|
Total Gross Unrecognized Tax Benefits |
For the Year Ended December 31, |
|
(In millions) |
2025 |
|
2024 |
|
2023 |
|
Total unrecognized tax benefits as of beginning of period |
|
$ |
263 |
|
|
$ |
390 |
|
|
$ |
357 |
|
Decreases related to positions taken on items from prior years |
|
|
(1 |
) |
|
|
(4 |
) |
|
|
— |
|
Increases related to positions taken on items from prior years |
|
|
94 |
|
|
|
13 |
|
|
|
23 |
|
Increases related to positions taken in the current year |
|
|
9 |
|
|
|
12 |
|
|
|
16 |
|
Settlement of uncertain tax positions with tax authorities |
|
|
(24 |
) |
|
|
(140 |
) |
|
|
(4 |
) |
Decreases due to expiration of statutes of limitations |
|
|
(5 |
) |
|
|
(5 |
) |
|
|
(2 |
) |
Exchange (gain) loss |
|
|
(1 |
) |
|
|
(3 |
) |
|
|
— |
|
Total unrecognized tax benefits as of end of period |
|
$ |
335 |
|
|
$ |
263 |
|
|
$ |
390 |
|
Total unrecognized tax benefits that, if recognized, would impact the effective tax rate |
|
$ |
243 |
|
|
$ |
176 |
|
|
$ |
173 |
|
Total amount of interest and penalties (benefits) recognized in provision for (benefit from) income taxes on continuing operations |
|
$ |
(9 |
) |
|
$ |
(4 |
) |
|
$ |
1 |
|
Total accrual (receivable) for interest and penalties associated with unrecognized tax benefits at end of period |
|
$ |
(15 |
) |
|
$ |
(2 |
) |
|
$ |
11 |
|
Each year the company files hundreds of tax returns in the various national, state and local income taxing jurisdictions in which it operates. These tax returns are subject to examination and possible challenge by the tax authorities. Positions challenged by the tax authorities may be settled or appealed by the company. As a result, there is an uncertainty in income taxes recognized in the company's financial statements in accordance with accounting for income taxes and accounting for uncertainty in income taxes. As of December 31, 2025 and 2024, the company has an advance deposit balance of $95 million and $100 million, respectively, to a foreign taxing authority, partially as a prerequisite to petition the court related to an open tax examination. These payments are accounted for as a prepaid asset, included in other assets in the Consolidated Balance Sheets.
Tax years that remain subject to examination for the company’s major tax jurisdictions are shown below:
|
|
Tax Years Subject to Examination by Major Tax Jurisdiction at December 31, 2025 |
Earliest Open Year |
Jurisdiction |
|
Argentina |
2018 |
Brazil |
2018 |
Canada |
2017 |
China |
2015 |
France |
2023 |
India |
2023 |
Italy |
2019 |
Spain |
2020 |
Switzerland |
2020 |
United States: |
|
Federal income tax |
2012 |
State and local income tax |
2012 |
Undistributed earnings of foreign subsidiaries and related companies that are deemed to be indefinitely invested amounted to $4,158 million at December 31, 2025. Distributions of profits from non-U.S. subsidiaries are subject to certain taxes upon repatriation, primarily where foreign withholding taxes apply; these taxes are partially offset by U.S. foreign tax credits. The company is asserting indefinite reinvestment related to certain investments in foreign subsidiaries. Determination of the amount of unrecognized deferred tax liability related to indefinitely reinvested profits is not feasible primarily due to our legal entity structure and the complexity of U.S. and local tax laws.
For periods between the Merger on August 31, 2017, and the Corteva Distribution, Corteva and its subsidiaries were included in DowDuPont's consolidated federal income tax group and consolidated tax return. Generally, the consolidated tax liability of the DowDuPont U.S. tax group for each year was apportioned among the members of the consolidated group based on each member’s separate taxable income. Corteva, DuPont and Dow intend that to the extent federal and/or state corporate income tax liabilities are reduced through the utilization of tax attributes of the other, settlement of any receivable and payable generated from the use of the other
party’s sub-group attributes will be in accordance with a tax sharing agreement and/or Tax Matters Agreement. See Note 15 - Commitments and Contingent Liabilities, to the Consolidated Financial Statements for further information related to indemnifications between Corteva, DuPont and Dow.
On July 4, 2025, the One Big Beautiful Bill Act ("OBBBA") was signed into law, enacting changes in a wide array of policy areas, including federal tax law. The impacts of OBBBA are included in the financial statements for the year ended December 31, 2025, including the reinstatement of expensing of domestic research and development expenditures.
On August 16, 2022, the U.S. federal government enacted the Inflation Reduction Act of 2022 (“the Act”). The Act includes tax provisions, among other things, which implement (i) a 15 percent minimum tax on book income of certain large corporations and (ii) a one percent excise tax on net stock repurchases. The Act did not have a material impact on the company’s financial position, results of operations or cash flows.
In December 2021, the Organization for Economic Cooperation and Development ("OECD") released the Pillar Two Model rules (also referred to as the global minimum tax or Global Anti-Base Erosion "GloBE" rules), which were designed to ensure multinational enterprises pay a certain level of tax within every jurisdiction in which they operate. Several jurisdictions in which we operate have enacted these rules. For the year ended December 31, 2025, there is no material tax charge associated with these rules. The company will continue to monitor and evaluate legislative developments.
NOTE 8 - EARNINGS PER SHARE OF COMMON STOCK
The following tables provide earnings per share calculations for the periods indicated below:
|
|
|
|
|
|
|
|
|
|
|
|
|
Net Income (Loss) for Earnings Per Share Calculations - Basic and Diluted |
For the Year Ended December 31, |
|
(In millions) |
2025 |
|
2024 |
|
2023 |
|
Income (loss) from continuing operations after income taxes |
|
$ |
1,204 |
|
|
$ |
863 |
|
|
$ |
941 |
|
Net income (loss) attributable to continuing operations noncontrolling interests |
|
|
11 |
|
|
|
12 |
|
|
|
12 |
|
Income (loss) from continuing operations available to Corteva common stockholders |
|
$ |
1,193 |
|
|
$ |
851 |
|
|
$ |
929 |
|
Income (loss) from discontinued operations available to Corteva common stockholders |
|
|
(99 |
) |
|
|
56 |
|
|
|
(194 |
) |
Net income (loss) available to common stockholders |
|
$ |
1,094 |
|
|
$ |
907 |
|
|
$ |
735 |
|
|
|
|
|
|
|
|
|
|
|
|
|
|
Earnings (Loss) Per Share Calculations - Basic |
For the Year Ended December 31, |
|
(Dollars per share) |
2025 |
|
2024 |
|
2023 |
|
Earnings (loss) per share of common stock from continuing operations |
|
$ |
1.75 |
|
|
$ |
1.23 |
|
|
$ |
1.31 |
|
Earnings (loss) per share of common stock from discontinued operations |
|
|
(0.15 |
) |
|
|
0.08 |
|
|
|
(0.27 |
) |
Earnings (loss) per share of common stock |
|
$ |
1.60 |
|
|
$ |
1.31 |
|
|
$ |
1.04 |
|
|
|
|
|
|
|
|
|
|
|
|
|
|
Earnings (Loss) Per Share Calculations - Diluted |
For the Year Ended December 31, |
|
(Dollars per share) |
2025 |
|
2024 |
|
2023 |
|
Earnings (loss) per share of common stock from continuing operations |
|
$ |
1.75 |
|
|
$ |
1.22 |
|
|
$ |
1.30 |
|
Earnings (loss) per share of common stock from discontinued operations |
|
|
(0.15 |
) |
|
|
0.08 |
|
|
|
(0.27 |
) |
Earnings (loss) per share of common stock |
|
$ |
1.60 |
|
|
$ |
1.30 |
|
|
$ |
1.03 |
|
|
|
|
|
|
|
|
|
|
|
|
|
|
Share Count Information |
For the Year Ended December 31, |
|
(Shares in millions) |
2025 |
|
2024 |
|
2023 |
|
Weighted-average common shares - basic |
|
|
680.0 |
|
|
|
693.7 |
|
|
|
709.0 |
|
Plus dilutive effect of equity compensation plans 1 |
|
|
1.4 |
|
|
|
2.3 |
|
|
|
2.9 |
|
Weighted-average common shares - diluted |
|
|
681.4 |
|
|
|
696.0 |
|
|
|
711.9 |
|
Potential shares of common stock excluded from EPS calculations 2 |
|
|
2.3 |
|
|
|
3.1 |
|
|
|
2.3 |
|
1.Diluted earnings (loss) per share considers the impact of potentially dilutive securities except in periods in which there is a loss because the inclusion of the potential common shares would have an anti-dilutive effect.
2.These outstanding potential shares of common stock relating to stock options, restricted stock units and performance-based restricted stock units were excluded from the calculation of diluted earnings (loss) per share because (i) the effect of including them would have been anti-dilutive; or (ii) the performance metrics have not yet been achieved for the outstanding potential shares relating to performance-based restricted stock units, which are deemed to be contingently issuable.
NOTE 9 - ACCOUNTS AND NOTES RECEIVABLE - NET
|
|
|
|
|
|
|
|
|
(In millions) |
December 31, 2025 |
|
December 31, 2024 |
|
Accounts receivable – trade 1 |
|
$ |
4,881 |
|
|
$ |
4,448 |
|
Notes receivable – trade 1,2 |
|
|
153 |
|
|
|
167 |
|
Other 3 |
|
|
1,337 |
|
|
|
1,061 |
|
Total accounts and notes receivable - net |
|
$ |
6,371 |
|
|
$ |
5,676 |
|
1.Accounts and notes receivable – trade are net of allowances of $241 million and $179 million at December 31, 2025 and 2024, respectively.
2.Notes receivable – trade primarily consists of receivables for deferred payment loan programs for the sale of seed and crop protection products to customers. These loans have terms of one year or less and are primarily concentrated in North America. The company maintains a rigid pre-approval process for extending credit to customers in order to manage overall risk and exposure associated with credit losses. As of December 31, 2025 and 2024, there were no significant impairments related to current loan agreements.
3.Other includes receivables in relation to indemnification assets, royalties, value added tax, general sales tax and other taxes. No individual group represents more than 5 percent of total current assets. In addition, Other includes amounts due from nonconsolidated affiliates of $117 million and $144 million as of December 31, 2025 and 2024, respectively.
Accounts and notes receivable are carried at the expected amount to be collected, which approximates fair value. The company establishes the allowance for doubtful receivables using a loss-rate method where the loss rate is developed using past events, historical experience, current conditions and forecasts that affect the collectability of the financial assets.
The following table summarizes changes in the allowance for doubtful receivables for the years ended December 31, 2024 and 2025, respectively:
|
|
|
|
|
(In millions) |
|
|
Balance at December 31, 2023 |
|
$ |
205 |
|
Net provision for credit losses |
|
|
39 |
|
Other - net of write-offs charged against allowance |
|
|
(65 |
) |
Balance at December 31, 2024 |
|
$ |
179 |
|
Net provision for credit losses |
|
|
104 |
|
Other - net of write-offs charged against allowance |
|
|
(42 |
) |
Balance at December 31, 2025 |
|
$ |
241 |
|
The company enters into various factoring agreements with third-party financial institutions to sell its trade receivables under both recourse and non-recourse agreements in exchange for cash proceeds. These financing arrangements result in a transfer of the company's receivables and risks to the third-party. As these transfers qualify as true sales under the applicable accounting guidance, the receivables are derecognized from the Consolidated Balance Sheets upon transfer, and the company receives a payment for the receivables from the third-party within a mutually agreed upon time period. For arrangements involving an element of recourse, which is typically provided through a guarantee of accounts in the event of customer default, the guarantee obligation is measured using market data from similar transactions and reported as a current liability in the Consolidated Balance Sheets.
Trade receivables sold under these agreements were $166 million, $131 million, and $112 million for the years ended December 31, 2025, 2024 and 2023, respectively. The trade receivables sold that remained outstanding under these agreements which include an element of recourse as of December 31, 2025 and 2024 were $17 million and $15 million, respectively. The net proceeds received were
included in cash provided by (used for) operating activities, in the Consolidated Statements of Cash Flows. The difference between the carrying amount of the trade receivables sold and the sum of the cash received is recorded as a loss on sale of receivables in other income (expense) - net in the Consolidated Statements of Operations. The loss on sale of receivables were $5 million, $9 million and $17 million for the years ended December 31, 2025, 2024 and 2023, respectively. See Note 15 - Commitments and Contingent Liabilities, to the Consolidated Financial Statements, for additional information on the company’s guarantees.
NOTE 10 - INVENTORIES
|
|
|
|
|
|
|
|
|
(In millions) |
December 31, 2025 |
|
December 31, 2024 |
|
Finished products |
|
$ |
2,956 |
|
|
$ |
2,649 |
|
Semi-finished products |
|
|
2,276 |
|
|
|
2,297 |
|
Raw materials and supplies |
|
|
435 |
|
|
|
486 |
|
Total inventories |
|
$ |
5,667 |
|
|
$ |
5,432 |
|
NOTE 11 - PROPERTY, PLANT AND EQUIPMENT
|
|
|
|
|
|
|
|
|
(In millions) |
December 31, 2025 |
|
December 31, 2024 |
|
Land and land improvements |
|
$ |
449 |
|
|
$ |
425 |
|
Buildings |
|
|
1,867 |
|
|
|
1,715 |
|
Machinery and equipment |
|
|
6,849 |
|
|
|
6,472 |
|
Construction in progress |
|
|
386 |
|
|
|
462 |
|
Total property, plant, and equipment |
|
$ |
9,551 |
|
|
$ |
9,074 |
|
Accumulated depreciation |
|
|
(5,331 |
) |
|
|
(4,975 |
) |
Total property, plant, and equipment - net |
|
$ |
4,220 |
|
|
$ |
4,099 |
|
Buildings, machinery and equipment and land improvements are depreciated over useful lives on a straight-line basis ranging from 2 to 25 years. Capitalizable costs associated with computer software for internal use are amortized on a straight-line basis over 2 to 7 years.
|
|
|
|
|
|
|
|
|
|
|
|
|
|
For the Year Ended December 31, |
|
(In millions) |
2025 |
|
2024 |
|
2023 |
|
Depreciation expense |
|
$ |
559 |
|
|
$ |
542 |
|
|
$ |
528 |
|
NOTE 12 - GOODWILL AND OTHER INTANGIBLE ASSETS
Goodwill
The following table summarizes changes in the carrying amount of goodwill by segment for the years ended December 31, 2024 and 2025, respectively.
|
|
|
|
|
|
|
|
|
|
|
|
|
(In millions) |
Seed |
|
Crop Protection |
|
Total |
|
Balance at December 31, 2023 |
|
$ |
5,422 |
|
|
$ |
5,183 |
|
|
$ |
10,605 |
|
Currency translation adjustment |
|
|
(96 |
) |
|
|
(139 |
) |
|
|
(235 |
) |
Other goodwill adjustments 1 |
|
|
— |
|
|
|
38 |
|
|
|
38 |
|
Balance at December 31, 2024 |
|
$ |
5,326 |
|
|
$ |
5,082 |
|
|
$ |
10,408 |
|
Currency translation adjustment |
|
|
(14 |
) |
|
|
71 |
|
|
|
57 |
|
Balance at December 31, 2025 |
|
$ |
5,312 |
|
|
$ |
5,153 |
|
|
$ |
10,465 |
|
1.Includes measurement period adjustments related to the acquisitions of Stoller and Symborg, which were not material.
The company performed annual qualitative testing on all of its reporting units in 2025 and 2024, determining that no goodwill impairments existed in either year. As of December 31, 2025, accumulated impairment losses on goodwill were $4,503 million.
Other Intangible Assets
The gross carrying amounts and accumulated amortization of other intangible assets by major class are as follows:
|
|
|
|
|
|
|
|
|
|
|
|
|
|
|
|
|
|
|
|
|
|
|
|
|
|
December 31, 2025 |
|
December 31, 2024 |
|
(In millions) |
Gross |
|
Accumulated
Amortization |
|
Net |
|
Gross |
|
Accumulated
Amortization |
|
Net |
|
Intangible assets subject to amortization (finite-lived): |
|
|
|
|
|
|
|
|
|
|
|
|
|
|
|
|
|
|
Germplasm |
|
$ |
6,291 |
|
|
$ |
(1,587 |
) |
|
$ |
4,704 |
|
|
$ |
6,291 |
|
|
$ |
(1,336 |
) |
|
$ |
4,955 |
|
Customer-related |
|
|
2,394 |
|
|
|
(1,024 |
) |
|
|
1,370 |
|
|
|
2,350 |
|
|
|
(863 |
) |
|
|
1,487 |
|
Developed technology |
|
|
1,860 |
|
|
|
(1,283 |
) |
|
|
577 |
|
|
|
1,838 |
|
|
|
(1,161 |
) |
|
|
677 |
|
Trademarks/trade names |
|
|
2,056 |
|
|
|
(466 |
) |
|
|
1,590 |
|
|
|
2,056 |
|
|
|
(380 |
) |
|
|
1,676 |
|
Other 1 |
|
|
368 |
|
|
|
(313 |
) |
|
|
55 |
|
|
|
388 |
|
|
|
(312 |
) |
|
|
76 |
|
Total other intangible assets with finite lives |
|
$ |
12,969 |
|
|
$ |
(4,673 |
) |
|
$ |
8,296 |
|
|
$ |
12,923 |
|
|
$ |
(4,052 |
) |
|
$ |
8,871 |
|
|
|
|
|
|
|
|
|
|
|
|
|
|
|
|
|
|
|
|
Intangible assets not subject to amortization (indefinite-lived): |
|
|
|
|
|
|
|
|
|
|
|
|
|
|
|
|
|
|
In-process research and development |
|
|
5 |
|
|
|
— |
|
|
|
5 |
|
|
|
5 |
|
|
|
— |
|
|
|
5 |
|
Total other intangible assets with indefinite lives |
|
|
5 |
|
|
|
— |
|
|
|
5 |
|
|
|
5 |
|
|
|
— |
|
|
|
5 |
|
Total other intangible assets |
|
$ |
12,974 |
|
|
$ |
(4,673 |
) |
|
$ |
8,301 |
|
|
$ |
12,928 |
|
|
$ |
(4,052 |
) |
|
$ |
8,876 |
|
1.Primarily consists of sales and farmer networks, marketing and manufacturing alliances and noncompetition agreements.
The aggregate pre-tax amortization expense from continuing operations for finite-lived intangible assets was $644 million, $685 million, and $683 million for the years ended December 31, 2025, 2024 and 2023, respectively.
Total estimated amortization expense for the next five fiscal years is as follows:
|
|
|
|
|
(In millions) |
|
|
|
2026 |
|
$ |
637 |
|
2027 |
|
|
576 |
|
2028 |
|
|
555 |
|
2029 |
|
|
531 |
|
2030 |
|
|
521 |
|
NOTE 13 - LEASES
The company has operating and finance leases for real estate, transportation, certain machinery and equipment, and information technology assets. The company’s leases have remaining lease terms of approximately 1 to 37 years. For purposes of calculating operating lease liabilities, lease terms may be deemed to include options to extend the lease when it is reasonably certain that the company will exercise that option. Some leasing arrangements require variable payments that are dependent on usage, output, or may vary for other reasons, such as insurance and tax payments. The variable lease payments are not presented as part of the initial ROU asset or lease liability.
Certain of the company's leases include residual value guarantees. These residual value guarantees are based on a percentage of the lessor's asset acquisition price and the amount of such guarantee generally declines over the course of the lease term. The portion of residual value guarantees that are probable of payment are included in the related lease liability. At December 31, 2025, the company has future maximum payments for residual value guarantees in operating leases of $183 million with final expirations through 2035. The company's lease agreements do not contain any material restrictive covenants.
The components of lease cost for the years ended December 31, 2025, 2024 and 2023 were as follows:
|
|
|
|
|
|
|
|
|
|
|
|
|
|
For the Year Ended December 31, |
|
(In millions) |
2025 |
|
2024 |
|
2023 |
|
Operating lease cost |
|
$ |
161 |
|
|
$ |
176 |
|
|
$ |
169 |
|
Finance lease cost |
|
|
|
|
|
|
|
|
|
Amortization of right-of-use assets |
|
|
— |
|
|
|
1 |
|
|
|
1 |
|
Total finance lease cost |
|
$ |
— |
|
|
$ |
1 |
|
|
$ |
1 |
|
Short-term lease cost |
|
|
37 |
|
|
|
27 |
|
|
|
23 |
|
Variable lease cost |
|
|
7 |
|
|
|
8 |
|
|
|
11 |
|
Total lease cost |
|
$ |
205 |
|
|
$ |
212 |
|
|
$ |
204 |
|
Supplemental cash flow information related to leases for the years ended December 31, 2025, 2024 and 2023 was as follows:
|
|
|
|
|
|
|
|
|
|
|
|
|
|
For the Year Ended December 31, |
|
(In millions) |
2025 |
|
2024 |
|
2023 |
|
Cash paid for amounts included in the measurement of lease liabilities: |
|
|
|
|
|
|
|
|
|
Operating cash outflows from operating leases |
|
$ |
166 |
|
|
$ |
188 |
|
|
$ |
169 |
|
Financing cash outflows from finance leases |
|
$ |
— |
|
|
$ |
1 |
|
|
$ |
1 |
|
New leases entered into during the years ended December 31, 2025 and 2024 were not material, on an individual basis.
Supplemental balance sheet information related to leases is as follows:
|
|
|
|
|
|
|
|
|
(In millions) |
December 31, 2025 |
|
December 31, 2024 |
|
Operating Leases |
|
|
|
|
|
|
Operating lease right-of-use assets 1 |
|
$ |
411 |
|
|
$ |
414 |
|
Current operating lease liabilities 2 |
|
|
122 |
|
|
|
134 |
|
Noncurrent operating lease liabilities 3 |
|
|
293 |
|
|
|
342 |
|
Total operating lease liabilities |
|
$ |
415 |
|
|
$ |
476 |
|
|
|
|
|
|
|
|
Finance Leases |
|
|
|
|
|
|
Property, plant, and equipment, gross |
|
$ |
14 |
|
|
$ |
14 |
|
Accumulated depreciation |
|
|
(14 |
) |
|
|
(14 |
) |
Property, plant, and equipment, net |
|
$ |
— |
|
|
$ |
— |
|
Short-term borrowings and finance lease obligations |
|
|
— |
|
|
|
— |
|
Long-term debt |
|
|
— |
|
|
|
— |
|
Total finance lease liabilities |
|
$ |
— |
|
|
$ |
— |
|
1.Included in other assets in the Consolidated Balance Sheets.
2.Included in accrued and other current liabilities in the Consolidated Balance Sheets.
3.Included in other noncurrent obligations in the Consolidated Balance Sheets.
The company utilizes the incremental borrowing rate in determining the present value of lease payments unless the implicit rate is readily determinable.
|
|
|
|
|
|
|
|
|
Lease Term and Discount Rate |
December 31, 2025 |
|
December 31, 2024 |
|
Weighted-average remaining lease term (years) |
|
|
|
|
|
|
Operating leases |
|
|
6.20 |
|
|
|
6.44 |
|
Finance leases |
|
|
0 |
|
|
|
0.38 |
|
Weighted average discount rate |
|
|
|
|
|
|
Operating leases |
|
|
3.85 |
% |
|
|
3.32 |
% |
Finance leases |
|
|
— |
% |
|
|
3.29 |
% |
Maturities of lease liabilities are as follows:
|
|
|
|
|
Maturity of Lease Liabilities at December 31, 2025
(In millions) |
Operating Leases |
|
2026 |
|
$ |
136 |
|
2027 |
|
|
95 |
|
2028 |
|
|
71 |
|
2029 |
|
|
51 |
|
2030 |
|
|
33 |
|
2031 and thereafter |
|
|
87 |
|
Total lease payments |
|
$ |
473 |
|
Less: Interest |
|
|
58 |
|
Present value of lease liabilities |
|
$ |
415 |
|
NOTE 14 - SHORT-TERM BORROWINGS, LONG-TERM DEBT AND AVAILABLE CREDIT FACILITIES
The following tables summarize Corteva's short-term borrowings and finance lease obligations and long-term debt:
|
|
|
|
|
|
|
|
|
Short-Term Borrowings and Finance Lease Obligations |
|
|
|
|
|
|
(In millions) |
December 31, 2025 |
|
December 31, 2024 |
|
364-Day Revolving Credit Facility |
|
$ |
— |
|
|
$ |
— |
|
Other loans - various currencies |
|
|
112 |
|
|
|
250 |
|
Long-term debt payable within one year |
|
|
782 |
|
|
|
500 |
|
Finance lease obligations payable within one year |
|
|
— |
|
|
|
— |
|
Total short-term borrowings and finance lease obligations |
|
$ |
894 |
|
|
$ |
750 |
|
|
|
|
|
|
|
|
|
|
|
|
|
|
|
|
|
|
Long-Term Debt |
|
|
|
|
|
|
|
|
|
|
|
|
|
December 31, 2025 |
|
December 31, 2024 |
|
(In millions) |
Amount |
|
Weighted Average Rate |
|
Amount |
|
Weighted Average Rate |
|
Promissory notes and debentures: |
|
|
|
|
|
|
|
|
|
|
|
|
Maturing in July 2025 |
|
$ |
— |
|
|
|
— |
% |
|
$ |
500 |
|
|
|
1.70 |
% |
Maturing in May 2026 |
|
|
600 |
|
|
|
4.50 |
% |
|
|
600 |
|
|
|
4.50 |
% |
Maturing in July 2030 |
|
|
500 |
|
|
|
2.30 |
% |
|
|
500 |
|
|
|
2.30 |
% |
Maturing in May 2032 |
|
|
500 |
|
|
|
5.125 |
% |
|
|
— |
|
|
|
— |
% |
Maturing in May 2033 |
|
|
600 |
|
|
|
4.80 |
% |
|
|
600 |
|
|
|
4.80 |
% |
Other loans: |
|
|
|
|
|
|
|
|
|
|
|
|
Foreign currency loans, various rates and maturities |
|
|
182 |
|
|
|
12.70 |
% |
|
|
161 |
|
|
|
12.70 |
% |
Medium-term notes, varying maturities through 2041 |
|
|
102 |
|
|
|
3.76 |
% |
|
|
104 |
|
|
|
4.41 |
% |
Finance lease obligations |
|
|
— |
|
|
|
|
|
|
— |
|
|
|
|
Less: Unamortized debt discount and issuance costs |
|
|
16 |
|
|
|
|
|
|
12 |
|
|
|
|
Less: Long-term debt due within one year |
|
|
782 |
|
|
|
|
|
|
500 |
|
|
|
|
Total long-term debt |
|
$ |
1,686 |
|
|
|
|
|
$ |
1,953 |
|
|
|
|
Principal payments of long-term debt are $782 million and $500 million for debt maturing in 2026 and 2030, respectively. There is no debt maturing in 2027, 2028 or 2029.
The estimated fair value of the company's short-term and long-term borrowings, including interest rate financial instruments was determined using Level 2 inputs within the fair value hierarchy, as described in Note 2 - Summary of Significant Accounting Policies. Based on quoted market prices for the same or similar issues, or on current rates offered to the company for debt of the same remaining maturities, the fair value of the company's short-term borrowings and finance lease obligations was approximately carrying value.
The fair value of the company's long-term borrowings, including long-term debt due within one year, was $2,462 million and $2,366 million at December 31, 2025 and 2024, respectively.
Debt Offering
In May 2025, the company issued $500 million of 5.125 percent Senior Notes due in May 2032 (the “May 2025 Debt Offering”). The proceeds were used to repay the $500 million senior notes that matured in July 2025.
In May 2023, the company issued $600 million of 4.5 percent Senior Notes due in 2026 and $600 million of 4.8 percent Senior Notes due in 2033 (the “May 2023 Debt Offering”). The proceeds of this offering are intended to be used for general corporate purposes, which may include funding of working capital, capital expenditures and share repurchases.
Foreign Currency Loans
The company enters into short-term and long-term foreign currency loans from time-to-time by accessing uncommitted revolving credit lines to fund working capital needs of foreign subsidiaries in the normal course of business ("Foreign Currency Loans"). Interest rates are variable and determined at the time of borrowing. Total unused bank credit lines on the Foreign Currency Loans at December 31, 2025 was approximately $86 million. The company's long-term Foreign Currency Loans are maturing in March 2026.
Available Committed Credit Facilities
The following table summarizes the company's credit facilities:
|
|
|
|
|
|
|
|
|
|
|
|
|
|
|
Committed and Available Credit Facilities at December 31, 2025 |
(In millions) |
Effective Date |
Committed Credit |
|
Credit Available |
|
Maturity Date |
Interest |
Revolving Credit Facility |
|
June 2024 |
|
$ |
2,850 |
|
|
$ |
2,850 |
|
|
June 2029 |
|
Floating Rate |
Revolving Credit Facility |
|
June 2024 |
|
|
1,900 |
|
|
|
1,900 |
|
|
June 2027 |
|
Floating Rate |
364-Day Revolving Credit Facility |
|
February 2025 |
|
|
750 |
|
|
|
750 |
|
|
February 2026 |
|
Floating Rate |
Total committed and available credit facilities |
|
|
|
$ |
5,500 |
|
|
$ |
5,500 |
|
|
|
|
|
Revolving Credit Facilities
In May 2022, the company entered into a $3 billion, five year revolving credit facility and a $2 billion, three-year revolving credit facility (the "Revolving Credit Facilities”) expiring in May 2027 and May 2025, respectively. Borrowings under the revolving credit facilities have an interest rate equal to Adjusted Term SOFR, which is Term SOFR plus 0.10 percent, plus the applicable margin. In June 2024, the Revolving Credit Facilities were refinanced for purposes of extending the maturity dates for the five-year and three-year revolving credit facilities to June 2029 and June 2027, respectively, and lowering the facility amount of the five-year revolving credit facility to $2.85 billion and the three-year revolving credit facility to $1.9 billion. The Revolving Credit Facilities may serve as a substitute to the company's commercial paper program, and can be used from time to time, for general corporate purposes including, but not limited to, the funding of seasonal working capital needs. The Revolving Credit Facilities contain customary representations and warranties, affirmative and negative covenants and events of default that are typical for companies with similar credit ratings. Additionally, the Revolving Credit Facilities contain a financial covenant requiring that the ratio of total indebtedness to total capitalization for Corteva and its consolidated subsidiaries not exceed 0.60. At December 31, 2025, the company was in compliance with these covenants.
364-Day Revolving Credit Facility
In January 2023, the company amended and restated its May 2022 364-day revolving credit agreement (the “364-Day Revolving Credit Facility”) increasing the facility amount to $1 billion and extending the expiration date to January 2024. Borrowings under the 364-Day Revolving Credit Facility have an interest rate equal to Adjusted Term SOFR, which is Term SOFR plus 0.10 percent, plus the applicable margin. The 364-Day Revolving Credit Facility includes a provision under which the company may convert any advances outstanding prior to the maturity date into term loans having a maturity date up to one year later. In February 2023, the company drew down $1 billion under the 364-Day Revolving Credit Facility, which was used for general corporate purposes, including funding seasonal working capital needs, capital spending, dividend payments, share repurchases and to partially fund the Stoller and Symborg acquisitions. In May 2023, the company repaid the $1 billion loan using the proceeds from the May 2023 Debt Offering and subsequently, in July 2023 reduced the available credit from $1 billion to $500 million. In February 2024, the company amended and restated the 364-Day Revolving Credit Facility, increasing the facility amount to $1 billion and extending the expiration date to February 2025. In February 2025, the company amended and restated the 364-Day Revolving Credit Facility, decreasing the facility amount from $1 billion to $750 million and extending the expiration date to February 2026. In February 2026, the company amended and restated the 364-Day Revolving Credit Facility, increasing the facility amount from $750 million to $1.25 billion, extended the expiration date to February 2027 and amended the interest rate to Term SOFR plus the applicable margin. The 364-Day Revolving Credit Facility contains customary representations and warranties, affirmative and negative covenants and events of default that are typical for companies with similar credit ratings. Additionally, the 364-Day Revolving Credit Facility contains a financial covenant requiring that the ratio of total indebtedness to total capitalization for Corteva and its consolidated subsidiaries not exceed 0.60. At December 31, 2025, the company was in compliance with these covenants.
Uncommitted Credit Facilities and Outstanding Letters of Credit
Unused bank credit lines on uncommitted credit facilities were $696 million at December 31, 2025. These lines are available to support short-term liquidity needs and general corporate purposes, including letters of credit. Outstanding letters of credit were $248 million at December 31, 2025. These letters of credit support commitments made in the ordinary course of business.
NOTE 15 - COMMITMENTS AND CONTINGENT LIABILITIES
Guarantees
Indemnifications
In connection with acquisitions and divestitures, the company has indemnified respective parties against certain liabilities that may arise in connection with these transactions and business activities prior to the completion of the transactions. The term of these indemnifications, which typically pertain to environmental, tax and product liabilities, is generally indefinite. In addition, the company indemnifies its duly elected or appointed directors and officers to the fullest extent permitted by Delaware law, against liabilities incurred as a result of their activities for the company, such as adverse judgments relating to litigation matters. If the indemnified party were to incur a liability or have a liability increase as a result of a successful claim, pursuant to the terms of the indemnification, the company would be required to reimburse the indemnified party. The maximum amount of potential future payments is generally unlimited. See below for additional information relating to the indemnification obligations under the Chemours Separation Agreement and the Corteva Separation Agreement.
Obligations for Supplier Finance Programs
The company enters into supplier finance programs with various finance providers in which the company agrees to pay these finance providers the stated amount of confirmed invoices from participating suppliers by the original maturity date. The company or the finance provider may terminate the agreement upon providing at least thirty days’ written notice. The payment terms that the company has with its finance providers under supplier finance programs are less than one year. At December 31, 2025 and 2024, the outstanding obligations under supplier finance programs was approximately $121 million and $88 million, respectively, and included within accounts payable in the Consolidated Balance Sheets.
The rollforward of the company’s outstanding obligations confirmed as valid under its supplier finance programs for the years ended December 31, 2024 and 2025 is as follows:
|
|
|
|
|
(In millions) |
|
|
Confirmed obligations outstanding at December 31, 2023 |
|
$ |
115 |
|
Invoices confirmed during the year |
|
|
571 |
|
Confirmed invoices paid during the year |
|
|
(598 |
) |
Confirmed obligations outstanding at December 31, 2024 |
|
$ |
88 |
|
Invoices confirmed during the year |
|
|
690 |
|
Confirmed invoices paid during the year |
|
|
(657 |
) |
Confirmed obligations outstanding at December 31, 2025 |
|
$ |
121 |
|
Obligations for Customers and Other Third Parties
The company has directly guaranteed various debt obligations under agreements with third parties related to customers and other third parties. At December 31, 2025 and 2024, the company had directly guaranteed $71 million and $64 million, respectively, of such obligations. These amounts represent the maximum potential amount of future (undiscounted) payments that the company could be required to make under the guarantees in the event of default by the guaranteed party. The maximum future payments include $5 million and $4 million of guarantees related to the various factoring agreements that the company enters into with third-party financial institutions to sell its trade receivables at December 31, 2025 and 2024, respectively. See Note 9 - Accounts and Notes Receivable - Net, to the Consolidated Financial Statements, for additional information.
The maximum future payments also include agreements with lenders to establish programs that provide financing for select customers. The terms of the guarantees are equivalent to the terms of the customer loans that are primarily made to finance customer invoices. The total amounts owed from customers to the lenders relating to these agreements was $234 million and $223 million at December 31, 2025 and 2024, respectively.
The company assesses the payment/performance risk by assigning default rates based on the duration of the guarantees. These default rates are assigned based on the external credit rating of the counterparty or through internal credit analysis and historical default history for counterparties that do not have published credit ratings. For counterparties without an external rating or available credit history, a cumulative average default rate is used.
Indemnifications under Separation Agreements
The company has entered into various agreements where the company is indemnified for certain liabilities. The term of this indemnification is generally indefinite, with exceptions, and includes defense costs and expenses, as well as monetary and non-monetary settlements and judgments. In connection with the recognition of liabilities related to these matters, the company records an indemnification asset when recovery is deemed probable.
Chemours Separation Agreement (Performance Chemicals)
Pursuant to the Chemours Separation Agreement resulting from the 2015 spin-off of the Performance Chemicals segment from Historical DuPont, Chemours indemnifies the company against certain litigation, environmental, workers' compensation and other liabilities that arose prior to the distribution.
In 2017, the Chemours Separation Agreement was amended to provide for a limited sharing of potential future liabilities related to alleged historical releases of perfluorooctanoic acids and its ammonium salts (“PFOA”) for a five-year period that began on July 6, 2017. Additionally, in January 2021, a binding memorandum of understanding as described below replaced the potential future liability sharing arrangements established in the 2017 amendment to the Chemours Separation Agreement. At December 31, 2025 and December 31, 2024, the indemnification assets from Chemours were $138 million and $43 million, respectively, within accounts and notes receivable - net and $470 million and $280 million, respectively, within other assets in the interim Consolidated Balance Sheets. These indemnification assets are regularly assessed for collectability and the company has concluded that these assets are recoverable. The liabilities subject to Chemours indemnification are considered stray liabilities under the Corteva Separation Agreement. Therefore, if Chemours fails to indemnify the company, these stray liabilities are subject to proportionate cost sharing between Corteva and DuPont, on a 29 percent and 71 percent basis, respectively, as further described in this footnote below.
On May 13, 2019, Chemours filed suit in the Delaware Court of Chancery against DuPont, EIDP, and Corteva, seeking, among other things, to limit its responsibility for the litigation and environmental liabilities allocated to and assumed by Chemours under the Chemours Separation Agreement (the “Delaware Litigation”). On March 30, 2020, the Court of Chancery granted a motion to dismiss. On December 15, 2020, the Delaware Supreme Court affirmed the judgment of the Court of Chancery. Meanwhile, a confidential arbitration process regarding the same and other claims proceeded (the “Arbitration”).
On January 22, 2021, Chemours, DuPont, Corteva and EIDP entered into a binding memorandum of understanding resolving legal disputes originating from the Delaware Litigation and Arbitration, and establishing a cost sharing arrangement and escrow account supporting and managing potential future legacy per- and polyfluoroalkyl substances (“PFAS”) liabilities arising out of pre-July 1, 2015 conduct (the “MOU”). The MOU replaced a prior 2017 amendment to the Chemours Separation Agreement. According to the terms of the MOU, Corteva and DuPont together, on one hand, and Chemours, on the other hand, agreed to a 50-50 split of certain qualified expenses related to PFAS liabilities incurred over a term not to exceed twenty years or $4 billion of qualified spend and escrow account contributions (see below for discussion of the escrow account) in the aggregate. DuPont’s and Corteva’s 50 percent share under the MOU will be limited to $2 billion, including qualified expenses and escrow account contributions. These expenses and escrow account contributions will be subject to the existing Letter Agreement, under which DuPont and Corteva will each bear 50 percent of the first $300 million (up to $150 million each), and thereafter DuPont bears 71 percent and Corteva bears the remaining 29 percent. Under the terms of the MOU, Corteva’s estimated aggregate share of the potential $2 billion is approximately $600 million.
In order to support and manage any potential future PFAS liabilities, the parties also agreed to establish an escrow account (“MOU Escrow Account”). The MOU provides that (1) no later than each of September 30, 2021 and September 30, 2022, Chemours shall deposit $100 million into an escrow account and DuPont and Corteva shall together deposit $100 million in the aggregate into an escrow account and (2) no later than September 30 of each subsequent year through and including 2028, Chemours shall deposit $50 million into an escrow account and DuPont and Corteva shall together deposit $50 million in the aggregate into an escrow account. Subject to the terms and conditions set forth in the MOU, each party may be permitted to defer funding in any year (excluding 2021). Over this period, Chemours will deposit a total of $500 million in the account and DuPont and Corteva will deposit an additional $500 million pursuant to the terms of the Letter Agreement. Additionally, if on December 31, 2028, the balance of the escrow account (including interest) is less than $700 million, Chemours will make 50 percent of the deposits and DuPont and Corteva together will make 50 percent of the deposits necessary to restore the balance of the escrow account to $700 million, pursuant to the terms of the Letter Agreement. Such payments will be made in a series of consecutive annual equal installments commencing on September 30, 2029, pursuant to the escrow account replenishment terms as set forth in the MOU. The MOU provides that no withdrawals from the MOU Escrow Account can be made before year six, except to fund mutually agreed upon third-party settlements in excess of $125 million. Starting with year six, withdrawals can only be made to fund qualified spend if the parties’ aggregate qualified spend in that particular year is greater than $200 million. Beginning with year 11, the amounts in the MOU Escrow Account can be used to fund any qualified spend.
In April 2024, Corteva, EIDP, DuPont, and Chemours received a final judgment resolving all drinking water claims related to PFAS of a defined class of U.S. public water systems that serve the vast majority of the United States population (the “Nationwide Water District Settlement”). In connection with the Nationwide Water District Settlement, the MOU was supplemented to waive funding due to the MOU Escrow Account by Chemours, DuPont and Corteva for 2023 provided that each party fully funds its portion of the Nationwide Water District Settlement and said settlement is consummated. The funding obligation to the MOU Escrow Account with respect to 2024 and due September 30, 2024 was to be waived if (i) between October 1, 2023 and September 30, 2024, the parties had entered into settlement agreements resolving liabilities under the MOU that in the aggregate exceed $100 million; (ii) each company had fully funded
its respective share, in accordance with the MOU, of such settlements; and (iii) such settlements were consummated. No such waiver was triggered for the 2024 escrow funding obligation due September 30, 2024 and, therefore, the company made its required contribution.
The company made its annual installment deposits due to the MOU Escrow Account through December 31, 2025. The MOU escrow account contains $105 million as of December 31, 2025, representing the aggregate contributions from Chemours, DuPont and Corteva, less withdrawals to fund related settlements.
After the term of this arrangement, Chemours’ indemnification obligations under the original 2015 Chemours Separation Agreement, would continue unchanged, subject in each case to certain exceptions set out in the MOU. Under the MOU, Chemours waived specified claims regarding the construct of its 2015 spin-off transaction, and the parties dismissed the pending arbitration regarding those claims. Additionally, the parties have agreed to resolve the Ohio MDL PFOA personal injury litigation (as discussed below). The parties are expected to cooperate in good faith to enter into additional agreements reflecting the terms set forth in the MOU.
The Chemours Separation Agreement obligates Chemours to defend and indemnify EIDP in legacy asbestos cases. As of December 31, 2025, there were approximately 900 pending lawsuits, with most being allegations of personal injury from Historical DuPont contractors. At December 31, 2025 and 2024, the company has a litigation accrual of $88 million and $38 million, respectively, and related indemnification assets of $87 million and $38 million, respectively, recorded.
Corteva Separation Agreement
On April 1, 2019, in connection with the Dow Distribution, Corteva, DuPont and Dow entered into the Corteva Separation Agreement, the Tax Matters Agreement ("TMA"), the Employee Matters Agreement, and certain other agreements (collectively, the “Corteva Separation Agreements”). The Corteva Separation Agreements allocate among Corteva, DuPont and Dow assets, employees, certain liabilities and obligations (including its investments, property and employee benefits and tax-related assets and liabilities) and provides for indemnification obligation among the parties. Under the Corteva Separation Agreement, DuPont indemnifies Corteva against certain litigation, environmental, tax, workers' compensation and other liabilities that arose prior to the Corteva Distribution, Dow indemnifies Corteva against certain litigation, environmental, tax, workers' compensation and other liabilities that relate to the Historical Dow business, and Corteva indemnifies DuPont and Dow for certain liabilities.
Under the Corteva Separation Agreements, certain legacy EIDP liabilities from discontinued and/or divested operations and businesses of EIDP (including Performance Chemicals) (a “stray liability”) were allocated to Corteva or DuPont. Costs and liabilities have been shared based on the terms of the Corteva Separation Agreement. All future stray liabilities are allocated to Corteva and DuPont proportionally on the basis of 29 percent and 71 percent, respectively, subject to a $1 million de minimis requirement.
On November 1, 2025, DuPont spun off its electronics business, Qnity Electronics, Inc. ("Qnity"). DuPont, Corteva and Qnity entered into a letter agreement, effective November 1, 2025, affirming that DuPont is not novated from its obligations with respect to Corteva for legacy liabilities allocated to Qnity in its spin-off ("Qnity Letter Agreement"). Additionally, under the Qnity Letter Agreement, Corteva has certain third-party beneficiary rights to enforce indemnity and payment obligations of DuPont's with respect to legacy liabilities allocated to Qnity subject to: (i) DuPont's consent; or (ii) Corteva's receipt of a judgment that includes payment obligations for legacy liabilities attributable to Qnity, and either DuPont does not use commercially reasonable efforts to enforce the payment obligation against Qnity, or DuPont files for bankruptcy.
At December 31, 2025 and 2024, the aggregate indemnification assets from DuPont and Dow were $104 million and $47 million, respectively, within accounts and notes receivable - net and $263 million and $143 million, respectively, within other assets in the Consolidated Balance Sheets. At December 31, 2025 and December 31, 2024, the aggregate indemnification liabilities were $26 million and $9 million, respectively, within accrued and other current liabilities and $154 million and $149 million, respectively, within other noncurrent obligations in the Consolidated Balance Sheets.
Discontinued Operations Activity
For the years ended December 31, 2025 and 2024, the company recorded benefits (charges) of $(99) million and $56 million, to income (loss) from discontinued operations after income taxes, in the Consolidated Statement of Operations. The after-tax charge recognized during the year ended December 31, 2025 was driven by charges relating to the MOU with Chemours and DuPont, comprised of a litigation charge associated with the NJ Statewide Settlement as well as PFAS environmental remediation activities primarily at Chemours' Fayetteville Works facility, along with other environmental matters. The after-tax benefit recognized during the year ended December 31, 2024 was driven by charges pursuant to the MOU with Chemours and DuPont relating to PFAS remediation activities primarily at Chemours' Fayetteville Works facility and litigation activity, which were more than offset by a favorable adjustment of certain prior year tax positions for previously divested businesses, the derecognition of an indemnification liability associated with the Water District Settlement Fund contribution, and insurance proceeds related to legacy matters.
Litigation
The company is subject to various legal proceedings, including, but not limited to, product liability, intellectual property, antitrust, commercial, property damage, personal injury, environmental and regulatory matters arising out of the normal course of its current businesses or legacy EIDP businesses unrelated to Corteva’s current businesses but allocated to Corteva as part of the Corteva Separation from DuPont. It is not possible to predict the outcome of these various proceedings, as considerable uncertainty exists. The company records accruals for legal matters when the information available indicates that it is probable that a liability has been incurred and the amount of the loss can be reasonably estimated. Accruals may reflect the impact and status of negotiations, settlements, rulings, advice from counsel and other information and events that may pertain to a particular matter. For the litigation matters discussed below, management believes that it is reasonably possible that the company could incur liabilities in excess of amounts accrued, for which the ultimate liability could be material to the results of operations and the cash flows in the period recognized. However, the company is unable to estimate the possible loss beyond amounts accrued due to various reasons, including, among others, that the underlying matters are either in early stages and/or have significant factual issues to be resolved. In addition, even when the company believes it has substantial defenses, the company may consider settlement of matters if it believes it is in the best interest of the company. At December 31, 2025 and 2024, current accrued litigation was $874 million and $228 million, respectively, within accrued and other current liabilities. A current indemnification asset of $188 million was recorded within accounts and notes receivable - net at December 31, 2025 in relation to the current accrued litigation. See the "Chemours Separation Agreement (Performance Chemicals)" and the "Corteva Separation Agreement" sections for further details on the indemnifications.
Bayer Dispute
In August 2022, Bayer filed a breach of contract/declaratory judgment lawsuit in Delaware state court against Corteva relating to an agrobacterium cross-license agreement and Enlist E3® soybeans. Bayer alleged that Corteva practiced two Bayer patents in developing Enlist E3® soybeans, and therefore, is entitled pursuant to the terms of the cross-license agreement to royalties for sales between 2019 through 2029, along with interest. In January 2025, the court issued several rulings precluding Corteva's invalidity and inequitable conduct defenses, while also aligning on key aspects of Corteva's patent claim construction. In May 2025, the Delaware state court granted Corteva’s motion for partial summary judgment agreeing that U.S. Supreme Court precedent precludes the collection of royalties after patent expiration. Bayer’s motion for reconsideration was denied in June 2025. In July 2025, a stipulated order allowed Bayer to appeal the summary judgment finding, while also allowing Corteva’s cross-appeal of the dismissal of its invalidity and inequitable conduct defenses.
In August 2022, Corteva filed a lawsuit against Bayer CropScience LLP and Monsanto Company (collectively “Bayer”) in federal court in Delaware for alleged infringement of Corteva’s patented AAD-1 herbicide resistance technology used in Enlist® corn. The complaint for this lawsuit was amended to include additional patents that are closely related to this patented technology for soybeans. Corteva seeks to enjoin Bayer from continuing to infringe, as well as appropriate monetary damages. Bayer has filed an answer to the complaint and has asserted various affirmative defenses including invalidity. In August 2023, the court issued a decision adopting Corteva’s claim construction for all five disputed patent terms subject to this litigation.
In December 2023, the Patent Trial and Appeal Board ("PTAB") authorized an Inter Partes Review (“IPR”) proceeding initiated by Bayer to review the patentability of three patents subject to the AAD-1 litigation. Inari joined the IPR proceeding. In December 2024, the PTAB issued a decision invalidating these patents on the basis they were unpatentable. Corteva appealed this decision and Corteva's AAD-1 lawsuit remains stayed during pendency of the IPR appeal. Corteva holds numerous additional patents covering its Enlist® traits or Enlist® weed control system. Therefore, the IPR process is not expected to impact its ability to license and protect Enlist E3® traits.
In October 2022, Corteva filed a lawsuit against Bayer in Delaware state court seeking a declaration that, under the terms of Corteva’s licensing agreement and the law, Bayer is not entitled to collect patent royalties on the Roundup Ready® Corn 2 trait after Bayer’s U.S. patent protection expires, and therefore is no longer required to pay royalties under the licensing agreement and entitled to recover relevant royalties paid. In September 2024, the court granted Bayer’s motion for summary judgment. Corteva’s appeal was heard by the Delaware Supreme Court, en banc, in May 2025. Additionally, Corteva initiated arbitration of two additional agreements with Bayer seeking similar relief. The Delaware Supreme Court stayed the appeal proceedings pending resolution discussions between Corteva and Bayer.
As of January 2026, the parties agreed to settle the agrobacterium cross-license agreement dispute. In addition, Corteva and Bayer resolved several other disputes regarding post-patent royalties and other matters, including post-patent regulatory support, resulting in the termination or amendment of the related licenses, as applicable. As part of the resolution of these matters, the cross-license agreement has been terminated and Corteva has agreed to a payment of $610 million and to drop its AAD-1 patent claims against Bayer. Also as a result of the resolution of this litigation and the related license terminations and amendments, potential royalty obligations for Corteva's Enlist E3® soybeans, as well as future royalty payments due to Bayer under other licensing agreements in dispute were terminated. The
settlement agreements support Corteva's product out-licensing growth in competitive corn, cotton and canola markets, including for the out-licensing of above and below ground triple-stack corn technology. In conjunction with resolution of these matters, the companies also agreed to new cotton licensing arrangements at terms reflective of market rates. There is no remaining litigation between the parties.
Federal Trade Commission Investigation
On May 26, 2020, Corteva received a subpoena from the Federal Trade Commission (“FTC”) directing it to submit documents pertaining to its Crop Protection products generally, as well as business plans, rebate programs, offers, pricing and marketing materials specifically related to its acetochlor, oxamyl, rimsulfuron and other related products in order to determine whether Corteva engaged in unfair methods of competition through anticompetitive conduct. Corteva has fully cooperated with all requests related to this subpoena. On September 29, 2022, the FTC, along with ten state attorneys general in California, Colorado, Illinois, Indiana, Iowa, Minnesota, Nebraska, Oregon, Wisconsin, and Texas, filed a lawsuit against Corteva and another competitor alleging the parties engaged in unfair methods of competition, unlawful conditioning of payments, unreasonably restrained trade, and have an unlawful monopoly (the “FTC lawsuit”). In December 2022, attorneys general in Tennessee and Washington joined the FTC lawsuit and the Arkansas state attorney general filed a separate lawsuit against Corteva and another competitor based on the allegations set forth in the FTC lawsuit. In July 2025, the Arkansas state attorney general amended the complaint to include methoxyfenozide, cyhalofop, picloram, triclopyr, and aminopyralid products. Several proposed private class action lawsuits were also filed in federal court alleging anticompetitive conduct based on the allegations set forth in the FTC lawsuit.
Virtually all of these private lawsuits were centralized into a multi-district litigation in the U.S. District Court for the Middle District of North Carolina. In January 2025, federal court for the multi-district litigation granted in part, and denied in part, Corteva's motion to dismiss. Specifically, the court order dismissed the plaintiff's federal damages claims and 13 of the 27 state consumer protection act claims. The plaintiffs amended their complaint to include methoxyfenozide products. The trials for these claims are expected to begin in 2027.
Lorsban® Lawsuits
As of December 31, 2024, there were asserted claims for personal injury against the former Dow Agrosciences LLC, alleging injuries related to chlorpyrifos exposure, the active ingredient in Lorsban®, an insecticide used by commercial farms for field fruit, nut and vegetable crops. Corteva ended its production of Lorsban® in 2020. Chlorpyrifos products are restricted-use pesticides, which are not available for purchase or use by the general public, and may only be sold to, and used by, certified applicators or someone under the certified applicator's direct supervision. These lawsuits do not relate to Dursban®, a residential type chlorpyrifos product that was authorized for indoor purposes, which was discontinued over two decades ago prior to the merger of Dow and Historical DuPont and Corteva’s formation and Separation. Claimants allege personal injury, including autism, developmental delays and/or decreased neurologic function, resulting from farm worker exposure and bystander drift and in utero exposure to chlorpyrifos. Certain claimants have also put forth remediation claims due to alleged property contamination from chlorpyrifos. As of December 31, 2025, an accrual has been established for the estimated resolution of certain claims.
Litigation related to legacy EIDP businesses unrelated to Corteva’s current businesses
For purposes of this report, the term PFOA means collectively perfluorooctanoic acid and its salts, including the ammonium salt and does not distinguish between the two forms, and PFAS, including PFOA, PFOS (perfluorooctanesulfonic acid), GenX and other perfluorinated chemicals and compounds ("PFCs").
EIDP is a party to various legal proceedings relating to the use of PFOA by its former Performance Chemicals segment for which potential liabilities would be subject to the cost sharing arrangement under the MOU as long as it remains effective.
Leach Settlement and Ohio MDL Settlement
EIDP has residual liabilities under its 2004 settlement of a West Virginia state court class action, Leach v. EIDP, which alleged that PFOA from EIDP’s former Washington Works facility had contaminated area drinking water supplies and affected the health of area residents. The settlement class has about 80,000 members. In addition to relief that was provided to class members years ago, the settlement requires EIDP to continue providing PFOA water treatment to six area water districts and private well users and to fund, through an escrow account, up to $235 million for a medical monitoring program for eligible class members. As of December 31, 2025, approximately $2 million had been disbursed from the account since its establishment in 2012 and the remaining balance is approximately $1 million.
PFOA Personal Injury Claims
In December 2024, the defendants reached a settlement of all of the currently filed and unfiled personal injury cases in the Ohio MDL for $59 million. The settlement was payable in two installments, with $8 million contributed in aggregate by Corteva. The final installment was paid upon the court dissolving the MDL in March 2025.
Other PFOA Matters
EIDP is a party to other PFOA lawsuits involving claims for property damage, medical monitoring and personal injury. Defense costs and any future liabilities that may arise out of these lawsuits are subject to the MOU and the cost sharing arrangement disclosed above. Under the MOU, fraudulent conveyance claims associated with these matters are not qualified expenses, unless Corteva, Inc. and EIDP would prevail on the merits of these claims.
EIDP did not make film-forming foams, PFOS, or PFOS products. While EIDP made surfactants and intermediaries that some manufacturers used in making foams, which may have contained PFOA as an unintended byproduct or an impurity, EIDP’s products were not formulated with PFOA, nor was PFOA an ingredient of these products. EIDP has never made or sold PFOA as a commercial product.
Aqueous Film-Forming Foams. Approximately 10,100 cases filed against 3M and other defendants, including EIDP and Chemours, and some including Corteva and DuPont, alleging personal injury (primarily kidney, testicular, liver and thyroid cancer) from the use of aqueous film-forming foams (“AFFF”) or contamination, in most cases due to migration from military installations or airports, consolidated in a multi-district litigation proceeding in federal district court in South Carolina (“SC MDL”). Most of these recent cases also assert claims that the EIDP and Chemours separation constituted a fraudulent conveyance.
In August 2025, the SC MDL entered multiple case management orders requiring cases filed outside the SC MDL to be transferred to the SC MDL, establishing a 21-day window for unfiled cases to be filed, and allowing the filing of multi-plaintiff complaints. A significant number of new cases asserting personal injury were filed or transferred to the SC MDL. Many of the personal injury cases both inside and outside the SC MDL include and continue to include, as new cases are threatened, multiple plaintiffs. Therefore, the number of plaintiffs asserting such claims is substantially higher than the number of cases set forth above. The first bellwether personal injury trial is expected to be scheduled for 2026. Discussions between the parties on a resolution to these cases remain ongoing.
Nationwide Water District Settlement. On June 1, 2023, Corteva, EIDP, Inc., DuPont, and Chemours (collectively, the “settling companies”) entered into a binding agreement in principle to comprehensively resolve all drinking water claims related to PFAS of a defined class of U.S. public water systems that serve the vast majority of the United States population, including, but not limited to the AFFF claims in the SC MDL, under the Nationwide Water District Settlement, for $1.185 billion in the aggregate. PFAS, as defined in the settlement, includes PFOA and HFPO-DA, among a broad range of fluorinated organic substances. In April 2024, the settlement was deemed final resulting in the release of the previously restricted cash in the Water District Settlement Fund and derecognition of the associated liability. The Nationwide Water District Settlement was entered into solely by way of compromise and settlement and is not in any way an admission of liability or fault by Corteva or EIDP.
The class represented by the Nationwide Water District Settlement is composed of all Public Water Systems, as defined in 42 U.S.C. § 300f, with a current detection of PFAS or that are currently required to monitor for PFAS under the Environmental Protection Agency’s Fifth Unregulated Contaminant Monitoring Rule (“UCMR 5”) or other applicable federal or state law (the “Class”). Approximately 88 percent of the U.S. is served by systems required to test under UCMR 5. The Class does not include water systems owned and operated by a State or the United States government; small systems that have not detected the presence of PFAS and are not currently required to monitor for it under federal or state requirements; and, unless they otherwise request to be included, water systems in the lower Cape Fear River Basin of North Carolina.
The total number of requests for exclusion (“opt-outs”) was approximately 900 water districts while most public water districts (approximately 93 percent of the Class) remain in the class settlement. The company has been served complaints from opt-outs, as well as water district and municipal authority claims not covered by the Nationwide Water District Settlement.
New Jersey. In late March 2019, the New Jersey State Attorney General filed four lawsuits against EIDP, Chemours, and others alleging that operations at and discharges from former EIDP sites in New Jersey (Chambers Works, Parlin, Pompton Lakes, and Repauno) damaged the State’s natural resources. Two of these lawsuits (those involving the Chambers Works and Parlin sites) allege contamination from PFAS. DuPont and Corteva were subsequently added as defendants to these lawsuits. These lawsuits include claims for remediation, fraudulent conveyance, as well as claims under the New Jersey Water Pollution Control Act and the New Jersey Industrial Site Recovery Act (“ISRA”).
On August 3, 2025, the company, together with Chemours and DuPont agreed to a proposed Judicial Consent Order with the State of New Jersey (the "NJ Statewide Settlement") to resolve all outstanding claims by the State of New Jersey pending against the companies related to the legacy use of a wide variety of substances of concern, including, but not limited to DNAPL (dense non-aqueous phase liquids), chemical solvents, and PFAS. Subject to a public notice and comment period and subject to court approval following that period, the NJ Statewide Settlement will also resolve legacy claims related to four Historical DuPont operating sites (Chambers Works,
Parlin, Pompton Lakes and Repauno) in the State, including claims under ISRA, alleged statewide PFAS contamination, including from the use of AFFF, claims of fraudulent conveyance, and claims for known natural resource damages from these Historical DuPont sites that the State of New Jersey and its departments have, or may have, in the future against the companies.
The NJ Statewide Settlement, after the expiration of the public notice and comment period, is subject to court approval. The court hearing for this approval occurred in January 2026 with a conclusion on the approval expected during the first half of 2026. The NJ Statewide Settlement includes aggregate cash payments to the State of New Jersey of $875 million, payable over a period of 25 years (net present value of approximately $500 million, using an 8 percent discount rate), responsibility for which will be allocated among the settling companies in accordance with the terms of the MOU. Of the $875 million, approximately $16 million is allocated to statewide natural resource damages unrelated to the four Historical DuPont sites, 25 percent of which relates to alleged statewide AFFF contamination. Accordingly, in the second quarter of 2025, the company recorded a pre-tax loss of $72 million ($58 million after-tax) within discontinued operations, reflecting the net present value of the company's share of the aggregate cash payment in accordance with the MOU. The settling companies have agreed to count the NJ Statewide Settlement against the MOU limit at net present value as of the date of the NJ Statewide Settlement. Entry into the NJ Statewide Settlement suspended the companies' 2025 MOU escrow funding obligations and funding of the initial payment under the NJ Statewide Settlement, expected in 2026, will be deemed to satisfy these obligations for 2025.
In addition to the cash payment, the NJ Statewide Settlement obligates certain settling companies to continue to undertake remediation at the four Historical DuPont sites, which will be determined in accordance with applicable law and the respective cost sharing arrangements between the settling companies, to the extent applicable. DuPont and Chemours will be responsible for the remediation at the sites under their current respective ownership. As part of the NJ Statewide Settlement, the companies have agreed to a binding third party review process of the remedial funding source ("RFS") for each of the four Historical DuPont sites (in the form of a surety bond or similar financial instrument) to ensure available funds for future remediation of these sites. This review process could identify additional required remediation, and an increase to the RFS for each of these sites.
The company and DuPont will also establish a reserve fund (in the form of a surety bond or similar financial instrument) in the amount of $475 million (the "Reserve Fund") with DuPont funding 71 percent and the company bearing the remaining 29 percent. The Reserve Fund is further financial security, separate from, and secondary to, the RFS, and the Reserve Fund will be accessible only in the event the RFS for a site has been exhausted and the party responsible for a site is not otherwise performing the required remediation. If a responsible party under the NJ Statewide Settlement defaults on their remediation or payment obligations (subject first to the cost sharing arrangements under the Corteva Separation Agreements, which provides that these obligations are "stray liabilities"), EIDP will become responsible for such obligations.
Under the NJ Statewide Settlement, no settling party admits any liability or wrongdoing or agrees to waive any defenses as to any such liability or wrongdoing.
Pursuant to a separate agreement among the company, DuPont, and Chemours, DuPont and the company will purchase Chemours' future interest, if any, in certain insurance proceeds. DuPont and the company will make the purchase by contributing a total of $150 million, with $106 million from DuPont and $44 million from the company, into an escrow fund, with funds to be released to pay Chemours' share of the NJ Statewide Settlement. DuPont and the company will pay Chemours, as additional contingent consideration, amounts received from the acquired insurance proceeds in excess of $150 million plus an accrued fee. The accrued fee will equal the lesser of (a) $35 million, and (b) $3 million plus interest (at prime minus 2 percent) on an initial balance of $150 million, as reduced by any amounts received by DuPont and Corteva from the acquired insurance proceeds, until DuPont and the company have so received $150 million, plus the accrued fee. The purchase price to be paid to Chemours, and the insurance proceeds recovered, by DuPont and the company from the insurance proceeds acquired from Chemours, are subject to the sharing percentages under the Letter Agreement.
Ohio. EIDP is a defendant in two lawsuits, including an action by the State of Ohio based on alleged damage to natural resources. The natural resources damage claim was preliminarily resolved in December 2023 for $110 million, with Corteva’s share of the settlement under the MOU being approximately $16 million of which $13 million has been paid. As of December 31, 2025, an accrual has been established. The second, a putative nationwide class action ("the Hardwick Class Action") brought on behalf of anyone who has detectable levels of PFAS in their blood serum seeks declaratory and injunctive relief, including the establishment of a “PFAS Science Panel.” In December 2023, the Sixth Circuit Court of Appeals dismissed the Hardwick Class Action due to lack of standing by Mr. Hardwick. With further opportunities for appeals expired, the plaintiffs filed a new case, narrowing their original claims, in June 2024. In January 2025, EIDP filed a motion to dismiss the new case on the grounds it remains similar to the original claim.
New York. EIDP is a defendant in a putative class action (the "Baker Class Action"), brought by persons who live in and around Hoosick Falls, New York. These lawsuits assert claims for medical monitoring, property damage and personal injury based on alleged PFOA releases from manufacturing facilities owned and operated by co-defendants in Hoosick Falls. The lawsuits allege that EIDP and others
supplied materials used at these facilities resulting in PFOA air and water contamination. A court approved settlement was reached between the plaintiffs and the other co-defendants regarding the Baker Class Action case. In September 2022, the class certification of the Baker Class Action was granted, with the court certifying three separate classes consisting of a private well property damage class, a medical monitoring class and a nuisance class. A settlement in principle of the Baker Class Action was reached in June 2025 for $22 million, plus funding $1 million annually to a medical monitoring fund for five years. As of December 31, 2025, an accrual for Corteva’s share of the expected settlement under the MOU was established.
EIDP is a defendant in a lawsuit brought by the Town of East Hampton, New York alleging PFOA and PFOS contamination of the town’s well water. This district submitted a timely opt-out request from the Nationwide Water District Settlement. EIDP and Chemours are also defendants in two lawsuits by a private water utility provider in New Jersey and New York alleging damages from PFAS releases into the environment, that impacted water sources that the utilities use to provide water, as well as product liability, negligence, nuisance, and trespass claims. The court dismissed the New York plaintiff's trespass claims and limited plaintiffs’ nuisance claims to abatement damages
Other Natural Resource Damage Cases. In addition to the natural resource damage cases in New Jersey and New York, natural resource damage lawsuits against EIDP, Chemours, and others, claiming, among other things, PFC (including PFOA) contamination of groundwater and drinking water, have been filed by attorneys general in 31 states, the District of Columbia and three U.S. territories. Certain cases also name DuPont and Corteva as defendants and include claims of fraudulent conveyance. The complaints seek reimbursement for past and future costs to monitor and remediate the alleged contamination and compensation for the loss of value and use of the state’s natural resources, as well as punitive damages. Due to overlapping AFFF allegations, virtually all of these cases have been transferred, or are pending transfer to the SC MDL. These cases are largely in the discovery phase.
On July 13, 2021, Chemours, DuPont, EIDP and Corteva entered into a settlement agreement with the State of Delaware reflecting the companies' and the State's agreement to settle and fully resolve claims alleged against the companies regarding their historical Delaware operations, manufacturing, use and disposal of all chemical compounds, including PFAS. Under the settlement, if the companies, individually or jointly, within 8 years of the settlement, enter into a proportionally similar agreement to settle or resolve claims of another state for PFAS-related natural resource damages, for an amount greater than $50 million, the companies shall make a supplemental payment directly to the Natural Resources and Sustainability Trust (the “NRS Trust”) in an amount equal to such other states’ recovery in excess of $50 million ("Supplemental Payment"). Supplemental Payment(s), if any, will not exceed $25 million in the aggregate. All amounts paid by the companies under the settlement are subject to the MOU and the Corteva Separation Agreement. Due to the settlement of natural resource damages claims with the State of Ohio, the one-time Supplemental Payment will be triggered when the further opportunity for appeals expires under the Ohio judicial consent order process. As of December 31, 2025, an accrual has been established for Corteva's share under the MOU. Under the settlement, if the state sues other parties and those parties seek contribution from the companies, the companies will have protection from contribution up to the amounts previously paid under the settlement agreement. The companies will also receive a credit up to the amount of the payment if the state seeks natural resource damage claims against the companies outside the scope of the settlement’s release of claims.
Canada. The Province of British Columbia, filed a class action against various defendants, including 3M, DuPont Canada, EIDP, and Chemours alleging harms caused by PFAS/AFFF. The class consists of all municipalities, regional districts, and other governance authorities and other persons in Canada that were responsible for a “Drinking Water System” from 1970 to the present. The plaintiff seeks to recover costs for the treatment and restoration of natural resources, as well as property, economic, and punitive damages. A putative class action was also filed in July 2024 on behalf of citizens of Quebec, Canada seeking class certification to recover for alleged PFAS and AFFF contamination of private wells and public water treatment facilities. In January 2024, a class action was also filed in Canada against 3M and other defendants, including EIDP and Chemours, alleging PFOS and PFOA environmental contamination and personal injury from use of AFFF. Additionally, several lawsuits on behalf of consumers of PFAS-infused products in the Province of British Columbia for personal injury and PFAS contamination in Manitoba, Canada have been filed.
Netherlands. In April 2021, four municipalities in the Netherlands filed complaints alleging contamination of land and groundwater resulting from the emission of PFOA and GenX by Corteva, DuPont and Chemours. The municipalities seek to recover costs incurred due to the alleged emissions, including damages for investigation costs, construction project delays, depreciation of land, soil remediation, liabilities to contractors, and attorneys’ fees. In September 2023, the court entered a second interlocutory judgment, ruling, inter alia, that defendants were liable to the municipalities for PFOA emissions during a certain time period, and the removal costs of deposited emissions on the municipalities' land infringes their property rights by an objective standard. In June 2024, Chemours and these Dutch municipalities signed a letter of intent that included the implementation of a specific remediation plan for the restoration of restricted vegetable gardens in certain areas of those municipalities to be funded by Chemours, sampling and developing a program to address a recreational lake, and further settlement discussions, including a potential fund to cover certain other expenditures aimed at environmental-related activities. While the letter of intent contemplates the possibility of settlement, discussions between the parties related to the resolution to these matters remain ongoing. Although the company believes a loss is probable, it is not estimable at this
time due to various reasons including, among others, the status of discussions between the parties. As of December 31, 2025, an accrual has been established for the estimated environmental remediation set forth in the letter of intent. Additionally, the Office of Public Prosecutor in the Netherlands opened a criminal investigation against certain Dutch subsidiaries of Chemours and Historical DuPont, as well as each subsidiary's directors, alleging unlawful PFOA and GenX emissions from Chemours' Dordrecht Works facility.
Carpet Mill Cases. The city of Centre, Alabama water district alleged defendants, including EIDP, Chemours, other chemical suppliers and large carpet mills, discharged PFAS in their industrial wastewater, and that this wastewater after treatment, resulted in PFAS contamination of drinking water supplies. The trial for the Centre, Alabama water district carpet mill case is set to begin January 2026. In July 2024, the town of Lyerly, Georgia filed a case making similar allegations as those brought in the Centre, Alabama case. Numerous carpet, textile and paper manufacturers, their alleged suppliers and former suppliers, including EIDP and Chemours, and certain municipal or utility defendants are also subject to several lawsuits in Georgia, Alabama and South Carolina, alleging negligence, nuisance and trespass related to the release of PFOA, and requesting injunctive relief related to PFOA contamination.
Fayetteville Works Facility, North Carolina
Prior to the separation of Chemours, EIDP introduced GenX as a polymerization processing aid and a replacement for PFOA at the Fayetteville Works facility in Bladen County, North Carolina. This Historical DuPont facility is now owned and operated by Chemours, which continues to manufacture and use GenX. The current natural resources damage claims in North Carolina allege that direct discharges from this legacy facility are a source of PFOA contamination.
At December 31, 2025, several actions, including personal injury, are pending in the North Carolina federal court against Chemours and EIDP relating to PFC discharges from the Fayetteville Works facility. One of these is a consolidated putative class action that asserts claims for medical monitoring and property damage on behalf of putative classes of property owners and residents in areas near or who draw drinking water from the Cape Fear River. Another action is a consolidated action brought by various North Carolina water authorities, including the Cape Fear Public Utility Authority (“CFPUA”) and Brunswick County, that seek actual and punitive damages as well as injunctive relief. EIDP and Chemours filed a motion for summary judgment on this consolidated action in March 2025. Cumberland County, North Carolina, which is not part of the forgoing consolidation action or the Nationwide Water District Settlement, filed an action for alleged PFOA contamination to its groundwater sources used in drinking water and seeking recovery for costs associated with water filtration, monitoring, and compliance costs. The pending mediation and trial for this matter are no longer scheduled.
In March 2023, CFPUA filed a Delaware Chancery Court action claiming the spin-off of Chemours and the Dow and Historical DuPont merger were unlawful and should be voided, so CFPUA is not precluded from recovering amounts it is entitled in its pending litigation. EIDP filed a motion to dismiss the Delaware Chancery Court action based upon failure to state a claim under Delaware law in June 2023, along with a counterclaim in October 2023. CFPUA’s motion to stay the case was granted in January 2024.
In a state court action approximately 2,400 private property owners near the Fayetteville Works facility seek compensatory and punitive damages for their claims of private nuisance, trespass, negligence, water monitoring and property damage allegedly caused by release of certain PFCs. In addition, several personal injury cases have been filed in the North Carolina federal court alleging thyroid disease, and prostate, breast and kidney cancers as a result of PFAS exposure.
Generally, site-related expenses related to GenX claims are subject to the cost sharing arrangements as defined in the MOU.
Environmental
Accruals for environmental matters are recorded when it is probable that a liability has been incurred and the amount of the liability can be reasonably estimated based on current law and existing technologies. These obligations are included in accrued and other current liabilities and other noncurrent obligations in the Consolidated Balance Sheets. It is reasonably possible that environmental remediation and restoration costs in excess of amounts accrued could have a material impact on the company’s results of operations, financial condition and cash flows. Inherent uncertainties exist in these estimates primarily due to unknown conditions, changing governmental regulations and legal standards regarding liability, and emerging remediation technologies for handling site remediation and restoration.
For a discussion of the allocation of environmental liabilities under the Chemours Separation Agreement and the Corteva Separation Agreement, see page F-71-72.
The accrued environmental obligations and indemnification assets include the following:
|
|
|
|
|
|
|
|
|
|
|
|
|
|
As of December 31, 2025 |
|
(In millions) |
Indemnification asset |
|
Accrual balance 3 |
|
Potential exposure above amount accrued 3 |
|
Environmental Remediation Stray Liabilities |
|
|
|
|
|
|
|
|
|
Chemours related obligations - subject to indemnity 1,2 |
|
$ |
254 |
|
|
$ |
264 |
|
|
$ |
204 |
|
Other discontinued or divested businesses obligations 1 |
|
|
33 |
|
|
|
71 |
|
|
|
201 |
|
|
|
|
|
|
|
|
|
|
|
Environmental remediation liabilities primarily related to DuPont - subject to indemnity from DuPont 2 |
|
|
50 |
|
|
|
55 |
|
|
|
55 |
|
|
|
|
|
|
|
|
|
|
|
Environmental remediation liabilities not subject to indemnity |
|
|
— |
|
|
|
112 |
|
|
|
86 |
|
|
|
|
|
|
|
|
|
|
|
Indemnification liabilities related to the MOU 4 |
|
|
— |
|
|
|
60 |
|
|
|
7 |
|
Total |
|
$ |
337 |
|
|
$ |
562 |
|
|
$ |
553 |
|
1.Represents liabilities that are subject to the $200 million threshold and sharing arrangements as discussed on page F-72, under the header "Corteva Separation Agreement."
2.The company has recorded an indemnification asset related to these accruals, including $22 million related to the Superfund sites.
3.Accrual balance represents management’s best estimate of the costs of remediation and restoration, although it is reasonably possible that the potential exposure, as indicated, could range above the amounts accrued, as there are inherent uncertainties in these estimates. Accrual balance includes $49 million for remediation of Superfund sites. Amounts do not include possible impacts from the remediation elements of the EPAs October 2021 PFAS Strategic Roadmap (as applicable), except as disclosed on page F-78 relating to Chemours' remediation activities at the Fayetteville Works Facility pursuant to the Consent Order with the North Carolina Department of Environmental Quality ("NC DEQ").
4.Represents liabilities that are subject to the $150 million threshold and sharing agreements as discussed on page F-71, under the header "Chemours Separation Agreement (Performance Chemicals).
Nebraska Department of Environment and Energy, AltEn Facility
The EPA and the Nebraska Department of Environment and Energy (“NDEE”) are pursuing investigations, response and removal actions, litigation and enforcement action related to an ethanol plant located near Mead, Nebraska that is owned and operated by AltEn LLC (“AltEn”). The agencies have alleged violations under the Resource Conservation and Recovery Act (“RCRA”) and other federal and state laws stemming from AltEn’s lack of compliance with the terms and conditions of its operating permits and other regulatory requirements. Corteva is one of six seed companies, who were customers of AltEn (collectively, the "Facility Response Group"), participating in the NDEE’s Voluntary Cleanup Program to address certain interim remediation needs at the site. In March 2025, the Facility Response Group reached an agreement to settle its lawsuit against AltEn and certain of its affiliates to preserve certain contractual and common law indemnification claims. The settlement agreement, among other things, limits AltEn’s ability to dispose of the property or take any adverse action with respect to its property or assets. As of December 31, 2025, an accrual was established for Corteva’s estimated voluntary contribution to the solid waste and wastewater remedial action plans for the AltEn location.
California Department of Toxic Substances Control, Pittsburg Plant
The California Department of Toxic Substances Control (“DTSC”) has filed a state court lawsuit over challenging whether the Pittsburg plant’s high purity water system (“HPWS”), as operated by Dow and now Corteva, required a permit pursuant to the RCRA. Discussions between the parties remain ongoing and further litigation, including discovery, is stayed.
NOTE 16 - STOCKHOLDERS' EQUITY
Common Stock
Set forth below is a reconciliation of common stock share activity for the years ended December 31, 2025, 2024, and 2023:
|
|
|
|
|
Shares of common stock |
Issued |
|
Balance at December 31, 2022 |
|
|
713,419,000 |
|
Issued |
|
|
1,965,000 |
|
Repurchased and retired |
|
|
(14,124,000 |
) |
Balance at December 31, 2023 |
|
|
701,260,000 |
|
Issued |
|
|
2,244,000 |
|
Repurchased and retired |
|
|
(17,909,000 |
) |
Balance at December 31, 2024 |
|
|
685,595,000 |
|
Issued |
|
|
2,701,000 |
|
Repurchased and retired |
|
|
(16,133,000 |
) |
Balance at December 31, 2025 |
|
|
672,163,000 |
|
Share Buyback Plan
On November 19, 2024, Corteva, Inc. announced that its Board of Directors authorized a $3 billion share repurchase program to purchase Corteva, Inc.'s common stock, par value $0.01 per share, without an expiration date ("2024 Share Buyback Plan"). The timing, price and volume of purchases will be based on market conditions, relevant securities laws and other factors. In connection with the 2024 Share Buyback Plan, the company repurchased and retired 8,318,000 shares in the open market for a cost (excluding excise taxes) of $571 million during the year ended December 31, 2025.
On September 13, 2022, Corteva, Inc. announced that its Board of Directors authorized a $2 billion share repurchase program to purchase Corteva, Inc.'s common stock, par value $0.01 per share, without an expiration date ("2022 Share Buyback Plan"). The company completed the 2022 Share Buyback Plan during the second quarter of 2025 and repurchased and retired 7,815,000, 17,909,000 and 10,026,000 shares in the open market and through privately-negotiated transactions for a cost (excluding excise taxes) of $500 million, $1 billion and $500 million during the years ended December 31, 2025, 2024 and 2023, respectively. Included within the shares repurchased during the years ended December 31, 2025 and 2024 were $145 million and $125 million, respectively, of shares from the master trust fund of the principal U.S. pension plan, as part of the Pension Investment Committee's periodic portfolio rebalancing process. Shares were repurchased by the company at the prevailing market rate authorized and agreed to by a third-party independent fiduciary for the plan.
On August 5, 2021, Corteva, Inc. announced that its Board of Directors authorized a $1.5 billion share repurchase program to purchase Corteva, Inc.'s common stock, par value $0.01 per share, without an expiration date ("2021 Share Buyback Plan"). The company completed the 2021 Share Buyback Plan during the first quarter of 2023 and repurchased and retired 4,098,000, 17,425,000 and 5,572,000 shares in the open market for a total cost of $250 million, $1 billion and $250 million during the years ended December 31, 2023, 2022 and 2021, respectively.
Shares repurchased pursuant to Corteva's share buyback plans are immediately retired upon repurchase. Repurchased common stock is reflected as a reduction of stockholders' equity. The company's accounting policy related to its share repurchases is to reduce its common stock based on the par value of the shares and to reduce its retained earnings for the excess of the repurchase price over the par value. When Corteva has an accumulated deficit balance, the excess over the par value is applied to additional paid-in capital ("APIC"). When Corteva has retained earnings, the excess is charged entirely to retained earnings.
Noncontrolling Interest
Corteva, Inc. owns 100 percent of the outstanding common shares of EIDP. However, EIDP has preferred stock outstanding to third parties which is accounted for as a non-controlling interest in Corteva's Consolidated Balance Sheets. Each share of EIDP Preferred Stock - $4.50 Series and EIDP Preferred Stock - $3.50 Series issued and outstanding at the effective date of the Corteva Distribution remains issued and outstanding as to EIDP and was unaffected by the Corteva Distribution.
Below is a summary of the EIDP Preferred Stock at December 31, 2025 and 2024 which is classified as noncontrolling interests in the Corteva Consolidated Balance Sheets.
|
|
|
|
|
(Shares in thousands) |
Number of Shares |
|
Authorized |
|
|
23,000 |
|
$4.50 Series, callable at $120 |
|
|
1,673 |
|
$3.50 Series, callable at $102 |
|
|
700 |
|
Other Comprehensive Income (Loss)
The changes and after-tax balances of components comprising accumulated other comprehensive income (loss) are summarized below:
|
|
|
|
|
|
|
|
|
|
|
|
|
|
|
|
|
|
|
|
|
|
|
|
|
(In millions) |
Cumulative Translation Adjustment1 |
|
Derivative Instruments |
|
Pension Benefit Plans |
|
Other Benefit Plans |
|
Unrealized Gain (Loss) on Investments |
|
Total |
|
2023 |
|
|
|
|
|
|
|
|
|
|
|
|
|
|
|
|
|
|
Balance at January 1, 2023 |
|
$ |
(2,883 |
) |
|
$ |
80 |
|
|
$ |
(163 |
) |
|
$ |
160 |
|
|
|
— |
|
|
$ |
(2,806 |
) |
Other comprehensive income (loss) before reclassifications |
|
|
425 |
|
|
|
(123 |
) |
|
|
(188 |
) |
|
|
38 |
|
|
|
— |
|
|
|
152 |
|
Amounts reclassified from accumulated other comprehensive income (loss) |
|
|
— |
|
|
|
(12 |
) |
|
|
(2 |
) |
|
|
(9 |
) |
|
|
— |
|
|
|
(23 |
) |
Net other comprehensive income (loss) |
|
$ |
425 |
|
|
$ |
(135 |
) |
|
$ |
(190 |
) |
|
$ |
29 |
|
|
$ |
— |
|
|
$ |
129 |
|
Balance at December 31, 2023 |
|
$ |
(2,458 |
) |
|
$ |
(55 |
) |
|
$ |
(353 |
) |
|
$ |
189 |
|
|
$ |
— |
|
|
$ |
(2,677 |
) |
2024 |
|
|
|
|
|
|
|
|
|
|
|
|
|
|
|
|
|
|
Other comprehensive income (loss) before reclassifications |
|
|
(1,014 |
) |
|
|
27 |
|
|
|
127 |
|
|
|
40 |
|
|
|
(6 |
) |
|
|
(826 |
) |
Amounts reclassified from accumulated other comprehensive income (loss) |
|
|
— |
|
|
|
44 |
|
|
|
— |
|
|
|
(10 |
) |
|
|
— |
|
|
|
34 |
|
Net other comprehensive income (loss) |
|
$ |
(1,014 |
) |
|
$ |
71 |
|
|
$ |
127 |
|
|
$ |
30 |
|
|
$ |
(6 |
) |
|
$ |
(792 |
) |
Balance at December 31, 2024 |
|
$ |
(3,472 |
) |
|
$ |
16 |
|
|
$ |
(226 |
) |
|
$ |
219 |
|
|
$ |
(6 |
) |
|
$ |
(3,469 |
) |
2025 |
|
|
|
|
|
|
|
|
|
|
|
|
|
|
|
|
|
|
Other comprehensive income (loss) before reclassifications |
|
|
867 |
|
|
|
(65 |
) |
|
|
(149 |
) |
|
|
(12 |
) |
|
|
6 |
|
|
|
647 |
|
Amounts reclassified from accumulated other comprehensive income (loss) |
|
|
— |
|
|
|
42 |
|
|
|
(3 |
) |
|
|
(14 |
) |
|
|
— |
|
|
|
25 |
|
Net other comprehensive income (loss) |
|
$ |
867 |
|
|
$ |
(23 |
) |
|
$ |
(152 |
) |
|
$ |
(26 |
) |
|
$ |
6 |
|
|
$ |
672 |
|
Balance at December 31, 2025 |
|
$ |
(2,605 |
) |
|
$ |
(7 |
) |
|
$ |
(378 |
) |
|
$ |
193 |
|
|
$ |
— |
|
|
$ |
(2,797 |
) |
1.The cumulative translation adjustment gain for the year ended December 31, 2025 was primarily driven by the weakening of the U.S. Dollar ("USD") against the Euro ("EUR"), Brazilian Real ("BRL"), South African Rand (“ZAR”) and Mexican Peso ("MXN"). The cumulative translation adjustment loss for the year ended December 31, 2024 was primarily driven by the strengthening of the U.S. Dollar against the Brazilian Real, Euro, Swiss Franc ("CHF") and Mexican Peso. The cumulative translation adjustment gain for the year ended December 31, 2023 was primarily driven by the weakening of the U.S. Dollar against the Swiss Franc, Brazilian Real and Euro.
The tax (expense) benefit on the net activity related to each component of other comprehensive income (loss) was as follows:
|
|
|
|
|
|
|
|
|
|
|
|
|
|
For the Year Ended December 31, |
|
(In millions) |
2025 |
|
2024 |
|
2023 |
|
Derivative instruments |
|
$ |
(5 |
) |
|
$ |
(12 |
) |
|
$ |
50 |
|
Pension benefit plans - net |
|
|
51 |
|
|
|
(35 |
) |
|
|
60 |
|
Other benefit plans - net |
|
|
7 |
|
|
|
(8 |
) |
|
|
(9 |
) |
Unrealized gains (losses) on investments |
|
|
— |
|
|
|
— |
|
|
|
— |
|
(Provision for) benefit from income taxes related to other comprehensive income (loss) items |
|
$ |
53 |
|
|
$ |
(55 |
) |
|
$ |
101 |
|
A summary of the reclassifications out of accumulated other comprehensive income (loss) is provided as follows:
|
|
|
|
|
|
|
|
|
|
|
|
|
(In millions) |
For the Year Ended December 31, |
|
|
2025 |
|
2024 |
|
2023 |
|
Derivative instruments 1: |
|
$ |
66 |
|
|
$ |
65 |
|
|
$ |
(8 |
) |
Tax (benefit) expense 2 |
|
|
(24 |
) |
|
|
(21 |
) |
|
|
(4 |
) |
After-tax |
|
$ |
42 |
|
|
$ |
44 |
|
|
$ |
(12 |
) |
Amortization of pension benefit plans: |
|
|
|
|
|
|
|
|
|
Prior service (benefit) cost 3,4 |
|
$ |
(4 |
) |
|
$ |
(4 |
) |
|
$ |
(3 |
) |
Actuarial (gains) losses 3,4 |
|
|
— |
|
|
|
1 |
|
|
|
— |
|
Settlement (gain) loss 3,4 |
|
|
— |
|
|
|
2 |
|
|
|
— |
|
Total before tax |
|
$ |
(4 |
) |
|
$ |
(1 |
) |
|
$ |
(3 |
) |
Tax (benefit) expense 2 |
|
|
1 |
|
|
|
1 |
|
|
|
1 |
|
After-tax |
|
$ |
(3 |
) |
|
$ |
— |
|
|
$ |
(2 |
) |
Amortization of other benefit plans: |
|
|
|
|
|
|
|
|
|
Prior service (benefit) cost 3,4 |
|
$ |
(1 |
) |
|
$ |
(1 |
) |
|
$ |
(2 |
) |
Actuarial (gains) losses 3,4 |
|
|
(17 |
) |
|
|
(13 |
) |
|
|
(10 |
) |
Total before tax |
|
$ |
(18 |
) |
|
$ |
(14 |
) |
|
$ |
(12 |
) |
Tax (benefit) expense 2 |
|
|
4 |
|
|
|
4 |
|
|
|
3 |
|
After-tax |
|
$ |
(14 |
) |
|
$ |
(10 |
) |
|
$ |
(9 |
) |
Total reclassifications for the period, after-tax |
|
$ |
25 |
|
|
$ |
34 |
|
|
$ |
(23 |
) |
1.Reflected in cost of goods sold in the Consolidated Statements of Operations.
2.Reflected in provision for (benefit from) income taxes from continuing operations in the Consolidated Statements of Operations.
3.These accumulated other comprehensive income (loss) components are included in the computation of net periodic benefit (credit) cost of the company's pension and other benefit plans. See Note 17 - Pension Plans and Other Post-Employment Benefits, to the Consolidated Financial Statements, for additional information.
4.Reflected in other income (expense) - net in the Consolidated Statements of Operations.
NOTE 17 - PENSION PLANS AND OTHER POST-EMPLOYMENT BENEFITS
The company offers various long-term benefits to its employees. Where permitted by applicable law, the company reserves the right to change, modify or discontinue the plans.
Defined Benefit Pension Plans
The company has both funded and unfunded noncontributory defined benefit pension plans covering employees in the U.S. and non-U.S. countries. The principal U.S. pension plan is the largest pension plan held by Corteva. Effective January 1, 2007, most new hires were no longer eligible to participate in the U.S. defined benefit pension plans. On November 30, 2018, the company froze the pay and service amounts used to calculate the pension benefits for active employees who participate in the pension plan. As a result, no participants are currently accruing additional benefits in the pension plan.
The company's funding policy is consistent with the funding requirements of federal laws and regulations. Pension coverage for employees of the company's non-U.S. consolidated subsidiaries is provided, to the extent deemed appropriate, through separate plans. Obligations under such plans are funded by depositing funds with trustees, covered by insurance contracts, or remain unfunded.
The company made total contributions of $40 million, $50 million and $52 million to its pension plans other than the principal U.S. pension plan for the years ended December 31, 2025, 2024 and 2023, respectively. Corteva expects to contribute approximately $40 million to its pension plans other than the principal U.S. pension plan in 2026. In planning for the Proposed Separation, including the future capital structures of the two new companies, the company expects to evaluate discretionary contributions to its principal U.S. pension plan in 2026.
The weighted-average assumptions used to determine pension plan obligations for all pension plans are summarized in the table below:
|
|
|
|
|
|
|
|
|
Weighted-Average Assumptions used to Determine Benefit Obligations |
December 31, 2025 |
|
December 31, 2024 |
|
Discount rate |
|
|
5.31 |
% |
|
|
5.59 |
% |
Rate of increase in future compensation levels 1 |
|
|
2.82 |
% |
|
|
2.87 |
% |
1.The rate of compensation increase excludes U.S. pension plans since the employees who participate in the U.S. pension plans no longer accrue additional benefits for future service and eligible compensation.
The weighted-average assumptions used to determine net periodic benefit costs for all pension plans are summarized in the table below:
|
|
|
|
|
|
|
|
|
|
|
|
|
|
For the Year Ended December 31, |
|
Weighted-Average Assumptions used to Determine Net Periodic Benefit Cost |
2025 |
|
2024 |
|
2023 |
|
Discount rate |
|
|
5.59 |
% |
|
|
4.97 |
% |
|
|
5.17 |
% |
Rate of increase in future compensation levels 1 |
|
|
2.87 |
% |
|
|
2.87 |
% |
|
|
2.83 |
% |
Expected long-term rate of return on plan assets |
|
|
4.56 |
% |
|
|
4.57 |
% |
|
|
4.55 |
% |
1.The rate of compensation increase excludes U.S. pension plans since the employees who participate in the U.S. pension plans no longer accrue additional benefits for future service and eligible compensation.
Other Post-Employment Benefits
The company has historically provided medical, dental and life insurance benefits to certain pensioners and survivors. The majority of U.S. employees hired on or after January 1, 2007, and eligible employees under the age of 50 as of November 30, 2018, are not eligible to participate in the post-employment medical, dental and life insurance plans. Substantially all of the cost and liabilities for these retiree benefit plans are attributable to the U.S. benefit plans. The non-Medicare eligible retiree medical plan is contributory with costs shared between the company and pensioners and survivors. For Medicare eligible pensioners and survivors, Corteva provides a company-funded Health Reimbursement Arrangement ("HRA"). In December 2020, the company amended its retiree medical, dental and life insurance plans to no longer provide retiree dental and life insurance benefits effective January 1, 2022 and to cap Corteva’s portion of the cost of non-Medicare retiree medical coverage to the level in effect as of December 31, 2021 ("2020 OPEB Plan Amendments").
The company also provides disability benefits to employees. In most countries, employee disability benefit plans are insured. In the U.S., these plans are generally self-insured. Obligations and expenses for self-insured plans are reflected in the change in projected benefit obligations table on page F-85.
The company's OPEB plans are unfunded and the cost of the approved claims is paid from operating cash flows. Pre-tax cash requirements to cover actual net claims costs and related administrative expenses were $96 million, $101 million, and $97 million for the years ended December 31, 2025, 2024 and 2023, respectively. Changes in cash requirements reflect the net impact of per capita health care costs, demographic changes, plan amendments and changes in participant premiums, co-payments and deductibles. In 2026, the company expects to contribute approximately $100 million for its OPEB plans.
The weighted-average assumptions used to determine benefit obligations for OPEB plans are summarized in the table below:
|
|
|
|
|
|
|
|
|
Weighted-Average Assumptions used to Determine Benefit Obligations |
December 31, 2025 |
|
December 31, 2024 |
|
Discount rate |
|
|
5.14 |
% |
|
|
5.50 |
% |
The weighted-average assumptions used to determine net periodic benefit costs for the OPEB plans are summarized in the table below:
|
|
|
|
|
|
|
|
|
|
|
|
|
Weighted-Average Assumptions used to Determine Net Periodic Benefit Cost |
For the Year Ended December 31, |
|
|
2025 |
|
2024 |
|
2023 |
|
Discount rate |
|
|
5.50 |
% |
|
|
4.92 |
% |
|
|
5.09 |
% |
As of December 31, 2025, 2024 and 2023, health care cost trend rates do not impact the benefit obligations for the OPEB plans because of the 2020 OPEB Plan Amendments.
Assumptions
For the U.S. plan, the company establishes strategic asset allocation percentage targets and appropriate benchmarks for significant asset classes with the aim of achieving a prudent balance between return and risk. Where appropriate, asset-liability studies are also taken
into consideration. The expected long-term rate of return on plan assets is based upon historical real returns (net of inflation) for the asset classes covered by the investment policy, expected performance, and projections of inflation and interest rates over the long-term period during which benefits are payable to plan participants. For non-U.S. plans, assumptions reflect economic assumptions applicable to each country.
In the U.S., Corteva calculates service costs and interest costs by applying individual spot rates from a yield curve (based on high-quality corporate bond yields) to the separate expected cash flows components of service cost and interest cost. Service cost and interest cost for all other plans are determined based on the single equivalent discount rates derived in determining those plan obligations.
For U.S. benefit plans, the discount rates utilized to measure the pension and other post-employment benefit obligations are based on the yield of high-quality corporate fixed income investments at the measurement date. Future expected actuarially determined cash flows are individually discounted at the spot rates under the Aon AA_Above Median yield curve (based on high-quality corporate bond yields) to arrive at the plan’s obligations as of the measurement date. For non-U.S. benefit plans, historically the company utilized prevailing long-term high quality corporate bond indices to determine the discount rate, applicable to each country, at the measurement date.
The company adopts the most recently published mortality tables and mortality improvement scale released by the Society of Actuaries in measuring its U.S. pension and other post-employment benefit obligations. The effect of these adoptions is amortized into net periodic benefit cost for the years following the adoption.
Summarized information on the company's pension and other post-employment benefit plans is as follows:
|
|
|
|
|
|
|
|
|
|
|
|
|
|
|
|
|
|
Change in Projected Benefit Obligations, Plan Assets and Funded Status |
|
|
|
|
|
|
|
|
|
|
|
|
|
|
Defined Benefit Pension Plans |
|
|
Other Post-Employment Benefits |
|
|
For the Year Ended December 31, |
|
|
For the Year Ended December 31, |
|
(In millions) |
2025 |
|
2024 |
|
|
2025 |
|
2024 |
|
Change in benefit obligations: |
|
|
|
|
|
|
|
|
|
|
|
|
|
Benefit obligation at beginning of the period |
|
$ |
12,222 |
|
|
$ |
13,440 |
|
|
|
$ |
812 |
|
|
$ |
925 |
|
Service cost |
|
|
13 |
|
|
|
16 |
|
|
|
|
— |
|
|
|
— |
|
Interest cost |
|
|
627 |
|
|
|
648 |
|
|
|
|
40 |
|
|
|
42 |
|
Plan participants' contributions |
|
|
1 |
|
|
|
2 |
|
|
|
|
16 |
|
|
|
18 |
|
Actuarial (gain) loss |
|
|
383 |
|
|
|
(580 |
) |
|
|
|
15 |
|
|
|
(51 |
) |
Benefits paid |
|
|
(1,228 |
) |
|
|
(1,241 |
) |
|
|
|
(112 |
) |
|
|
(120 |
) |
Plan amendments |
|
|
1 |
|
|
|
— |
|
|
|
|
— |
|
|
|
(1 |
) |
New plans/merger |
|
|
1 |
|
|
|
— |
|
|
|
|
— |
|
|
|
— |
|
Effect of foreign exchange rates |
|
|
37 |
|
|
|
(63 |
) |
|
|
|
1 |
|
|
|
(1 |
) |
Benefit obligations at end of the period |
|
$ |
12,057 |
|
|
$ |
12,222 |
|
|
|
$ |
772 |
|
|
$ |
812 |
|
|
|
|
|
|
|
|
|
|
|
|
|
|
|
Change in plan assets: |
|
|
|
|
|
|
|
|
|
|
|
|
|
Fair value of plan assets at beginning of the period |
|
$ |
10,630 |
|
|
$ |
11,755 |
|
|
|
$ |
— |
|
|
$ |
— |
|
Actual return on plan assets |
|
|
805 |
|
|
|
116 |
|
|
|
|
— |
|
|
|
— |
|
Employer contributions |
|
|
40 |
|
|
|
50 |
|
|
|
|
96 |
|
|
|
101 |
|
Plan participants' contributions |
|
|
1 |
|
|
|
2 |
|
|
|
|
16 |
|
|
|
18 |
|
Benefits paid |
|
|
(1,228 |
) |
|
|
(1,241 |
) |
|
|
|
(112 |
) |
|
|
(120 |
) |
Effect of foreign exchange rates |
|
|
27 |
|
|
|
(52 |
) |
|
|
|
— |
|
|
|
1 |
|
Fair value of plan assets at end of the period |
|
$ |
10,275 |
|
|
$ |
10,630 |
|
|
|
$ |
— |
|
|
$ |
— |
|
Funded status |
|
|
|
|
|
|
|
|
|
|
|
|
|
U.S. plan with plan assets |
|
$ |
(1,463 |
) |
|
$ |
(1,268 |
) |
|
|
$ |
— |
|
|
$ |
— |
|
Non-U.S. plans with plan assets |
|
|
(32 |
) |
|
|
(41 |
) |
|
|
— |
|
|
|
— |
|
All other plans 1,2 |
|
|
(287 |
) |
|
|
(283 |
) |
|
|
|
(772 |
) |
|
|
(812 |
) |
Funded status at end of the period |
|
$ |
(1,782 |
) |
|
$ |
(1,592 |
) |
|
|
$ |
(772 |
) |
|
$ |
(812 |
) |
1.As of December 31, 2025 and 2024, $112 million and $131 million, respectively, of the benefit obligations are supported by funding under the Trust agreement, defined in the "Trust Assets" section below.
2.Includes pension plans maintained around the world where funding is not customary.
|
|
|
|
|
|
|
|
|
|
|
|
|
|
|
|
|
|
Defined Benefit Pension Plans |
|
Other Post-Employment Benefits |
|
|
December 31, |
|
December 31, |
|
(In millions) |
2025 |
|
2024 |
|
2025 |
|
2024 |
|
Amounts recognized in the Consolidated Balance Sheets: |
|
|
|
|
|
|
|
|
|
|
|
|
Other assets |
|
$ |
10 |
|
|
$ |
2 |
|
|
$ |
— |
|
|
$ |
— |
|
Accrued and other current liabilities |
|
|
(32 |
) |
|
|
(32 |
) |
|
|
(98 |
) |
|
|
(103 |
) |
Pension and other post-employment benefits |
|
|
(1,760 |
) |
|
|
(1,562 |
) |
|
|
(674 |
) |
|
|
(709 |
) |
Net amount recognized |
|
$ |
(1,782 |
) |
|
$ |
(1,592 |
) |
|
$ |
(772 |
) |
|
$ |
(812 |
) |
|
|
|
|
|
|
|
|
|
|
|
|
|
Pre-tax amounts recognized in accumulated other comprehensive income (loss): |
|
|
|
|
|
|
|
|
|
|
|
|
Net gain (loss) |
|
$ |
(518 |
) |
|
$ |
(320 |
) |
|
$ |
244 |
|
|
$ |
276 |
|
Prior service benefit (cost) |
|
|
14 |
|
|
|
17 |
|
|
|
13 |
|
|
|
14 |
|
Pre-tax balance in accumulated other comprehensive income (loss) at end of year |
|
$ |
(504 |
) |
|
$ |
(303 |
) |
|
$ |
257 |
|
|
$ |
290 |
|
The loss related to the change in pension benefit obligations for the period ended December 31, 2025 is primarily due to the decrease in discount rates, net of asset returns above the expected long-term rate.
The accumulated benefit obligation for all pension plans was $12.0 billion and $12.2 billion at December 31, 2025 and 2024, respectively.
|
|
|
|
|
|
|
|
|
Pension Plans with Projected Benefit Obligations in Excess of Plan Assets |
December 31, 2025 |
|
December 31, 2024 |
|
(In millions) |
|
|
|
|
Projected benefit obligations |
|
$ |
11,821 |
|
|
$ |
12,094 |
|
Fair value of plan assets |
|
$ |
10,028 |
|
|
$ |
10,500 |
|
|
|
|
|
|
|
|
Pension Plans with Accumulated Benefit Obligations in Excess of Plan Assets |
December 31, 2025 |
|
December 31, 2024 |
|
(In millions) |
|
|
|
|
Accumulated benefit obligations |
|
$ |
11,806 |
|
|
$ |
11,995 |
|
Fair value of plan assets |
|
$ |
10,027 |
|
|
$ |
10,414 |
|
|
|
|
|
|
|
|
|
|
|
|
|
|
|
|
|
|
|
|
|
|
|
|
|
|
|
(In millions) |
Defined Benefit Pension Plans |
|
|
Other Post-Employment Benefits |
|
|
For the Year Ended December 31, |
|
|
For the Year Ended December 31, |
|
Components of net periodic benefit (credit) cost and amounts recognized in other comprehensive income (loss) |
2025 |
|
2024 |
|
2023 |
|
|
2025 |
|
2024 |
|
2023 |
|
Net Periodic Benefit (Credit) Cost: |
|
|
|
|
|
|
|
|
|
|
|
|
|
|
|
|
|
|
|
Service cost |
|
$ |
13 |
|
|
$ |
16 |
|
|
$ |
18 |
|
|
|
$ |
— |
|
|
$ |
— |
|
|
$ |
1 |
|
Interest cost |
|
|
627 |
|
|
|
648 |
|
|
|
690 |
|
|
|
|
40 |
|
|
|
42 |
|
|
|
49 |
|
Expected return on plan assets |
|
|
(622 |
) |
|
|
(531 |
) |
|
|
(605 |
) |
|
|
|
— |
|
|
|
— |
|
|
|
— |
|
Amortization of unrecognized loss (gain) |
|
|
— |
|
|
|
1 |
|
|
|
— |
|
|
|
|
(17 |
) |
|
|
(13 |
) |
|
|
(10 |
) |
Amortization of prior service (benefit) cost |
|
|
(4 |
) |
|
|
(4 |
) |
|
|
(3 |
) |
|
|
|
(1 |
) |
|
|
(1 |
) |
|
|
(2 |
) |
Settlement loss |
|
|
— |
|
|
|
2 |
|
|
|
— |
|
|
|
|
— |
|
|
|
— |
|
|
|
— |
|
Net periodic benefit (credit) cost - Total |
|
$ |
14 |
|
|
$ |
132 |
|
|
$ |
100 |
|
|
|
$ |
22 |
|
|
$ |
28 |
|
|
$ |
38 |
|
Changes in plan assets and benefit obligations recognized in other comprehensive income (loss): |
|
|
|
|
|
|
|
|
|
|
|
|
|
|
|
|
|
|
|
Net gain (loss) |
|
$ |
(199 |
) |
|
$ |
164 |
|
|
$ |
(255 |
) |
|
|
$ |
(15 |
) |
|
$ |
51 |
|
|
$ |
49 |
|
Amortization of unrecognized (gain) loss |
|
|
— |
|
|
|
1 |
|
|
|
— |
|
|
|
|
(17 |
) |
|
|
(13 |
) |
|
|
(10 |
) |
Prior service benefit (cost) |
|
|
(1 |
) |
|
|
— |
|
|
|
— |
|
|
|
|
— |
|
|
|
1 |
|
|
|
— |
|
Amortization of prior service (benefit) cost |
|
|
(4 |
) |
|
|
(4 |
) |
|
|
(3 |
) |
|
|
|
(1 |
) |
|
|
(1 |
) |
|
|
(2 |
) |
Settlement loss |
|
|
— |
|
|
|
2 |
|
|
|
— |
|
|
|
|
— |
|
|
|
— |
|
|
|
— |
|
Effect of foreign exchange rates |
|
|
1 |
|
|
|
(1 |
) |
|
|
8 |
|
|
|
|
— |
|
|
|
— |
|
|
|
1 |
|
Total benefit (loss) recognized in other comprehensive income (loss), attributable to Corteva |
|
$ |
(203 |
) |
|
$ |
162 |
|
|
$ |
(250 |
) |
|
|
$ |
(33 |
) |
|
$ |
38 |
|
|
$ |
38 |
|
Total recognized in net periodic benefit (credit) cost and other comprehensive income (loss) |
|
$ |
(217 |
) |
|
$ |
30 |
|
|
$ |
(350 |
) |
|
|
$ |
(55 |
) |
|
$ |
10 |
|
|
$ |
— |
|
Estimated Future Benefit Payments
The estimated future benefit payments, reflecting expected future service, as appropriate, are presented in the following table:
|
|
|
|
|
|
|
|
|
Estimated Future Benefit Payments at December 31, 2025 |
|
|
|
|
|
|
(In millions) |
Defined Benefit Pension Plans |
|
Other Post-Employment Benefits |
|
2026 |
|
$ |
1,199 |
|
|
$ |
98 |
|
2027 |
|
|
1,162 |
|
|
|
91 |
|
2028 |
|
|
1,126 |
|
|
|
85 |
|
2029 |
|
|
1,088 |
|
|
|
79 |
|
2030 |
|
|
1,048 |
|
|
|
73 |
|
Years 2031 - 2035 |
|
|
4,644 |
|
|
|
293 |
|
Total |
|
$ |
10,267 |
|
|
$ |
719 |
|
Plan Assets
All pension plan assets in the U.S. are invested through a single master trust fund. The general principles guiding U.S. pension asset investment policies are those embodied in the Employee Retirement Income Security Act of 1974 ("ERISA"). These principles include discharging Corteva's investment responsibilities for the exclusive benefit of plan participants and in accordance with the "prudent expert" standard and other ERISA rules and regulations. Corteva establishes strategic asset allocation percentage targets and appropriate benchmarks for significant asset classes with the aim of achieving a prudent balance between return and risk. The strategic asset allocation for this trust fund is approved by the Pension Investment Committee. Strategic asset allocations in other countries are selected in accordance with the laws and practices of those countries. Where appropriate, asset-liability studies are utilized in this process.
U.S. plan assets are managed by investment professionals employed by Corteva, and plan assets for non-U.S. plans are managed by professional investment firms unrelated to the company. Corteva's pension investment professionals have discretion to manage the assets within established asset allocation ranges approved by the Pension Investment Committee. Additionally, pension trust funds are
permitted to enter into certain contractual arrangements generally described as "derivatives." Derivatives are primarily used to reduce specific market risks, hedge currency and adjust portfolio duration and asset allocation in a cost-effective manner.
The weighted-average allocation for plan assets of the company's pension plans is summarized as follows:
|
|
|
|
|
|
|
|
|
Allocation for Plan Assets |
December 31, 2025 |
|
December 31, 2024 |
|
Asset Category |
|
|
|
|
U.S. equity securities |
|
|
8 |
% |
|
|
9 |
% |
Non-U.S. equity securities |
|
5 |
|
|
5 |
|
Fixed income securities |
|
67 |
|
|
67 |
|
Hedge funds |
|
|
— |
|
|
|
— |
|
Private market securities |
|
13 |
|
|
12 |
|
Real estate |
|
7 |
|
|
7 |
|
Cash and cash equivalents |
|
|
— |
|
|
|
— |
|
Total |
|
|
100 |
% |
|
|
100 |
% |
U.S. equity investments are primarily large-cap companies. Non-U.S. equity securities include varying market capitalization levels. Fixed income securities include corporate-issued, government-issued and asset-backed securities of both U.S. and non-U.S. issuers. Corporate debt investments include a range of credit risk and industry diversification. U.S. fixed income investments are weighted heavier than non-U.S. fixed income securities. Other investments include cash and cash equivalents, hedge funds, real estate and private market securities such as interests in private equity and venture capital partnerships.
Fair value calculations may not be indicative of net realizable value or reflective of future fair values. Furthermore, although the company believes its valuation methods are appropriate and consistent with other market participants, the use of different methodologies or assumptions to determine the fair value of certain financial instruments could result in a different fair value measurement at the reporting date.
For pension plan assets classified as Level 1 measurements (measured using quoted prices in active markets), total fair value is either the price of the most recent trade at the time of the market close or the official close price, as defined by the exchange on which the asset is most actively traded on the last trading day of the period, multiplied by the number of units held without consideration of transaction costs.
For pension plan assets classified as Level 2 measurements, where the security is frequently traded in less active markets, fair value is based on the closing price at the end of the period; where the security is less frequently traded, fair value is based on the price a dealer would pay for the security or similar securities, adjusted for any terms specific to that asset or liability. Market inputs are obtained from well-established and recognized vendors of market data and subjected to tolerance and quality checks. For derivative assets and liabilities, standard industry models are used to calculate the fair value of the various financial instruments based on significant observable market inputs, such as foreign exchange rates, commodity prices, swap rates, interest rates and implied volatilities obtained from various market sources.
For pension plan assets classified as Level 3 measurements, total fair value is based on significant unobservable inputs including assumptions where there is little, if any, market activity for the investment. Investment managers, fund managers, or investment contract issuers provide valuations of the investment on a monthly or quarterly basis. These valuations are reviewed for reasonableness based on applicable sector, benchmark and company performance. Adjustments to valuations are made where appropriate. Where available, audited financial statements are obtained and reviewed for the investments as support for the manager’s investment valuation.
The tables below present the fair values of the company's pension assets by level within the fair value hierarchy, as described in Note 2 - Summary of Significant Accounting Policies, in the Consolidated Financial Statements:
|
|
|
|
|
|
|
|
|
|
|
|
|
|
|
|
|
Basis of Fair Value Measurements |
Total |
|
Level 1 |
|
Level 2 |
|
Level 3 |
|
For the year ended December 31, 2025 |
|
|
|
|
|
|
|
|
(In millions) |
|
|
|
|
|
|
|
|
Cash and cash equivalents |
|
$ |
876 |
|
|
$ |
876 |
|
|
$ |
— |
|
|
$ |
— |
|
U.S. equity securities 1 |
|
|
837 |
|
|
|
836 |
|
|
|
1 |
|
|
|
— |
|
Non-U.S. equity securities |
|
|
417 |
|
|
|
417 |
|
|
|
— |
|
|
|
— |
|
Debt – government-issued |
|
|
1,540 |
|
|
|
— |
|
|
|
1,540 |
|
|
|
— |
|
Debt – corporate-issued |
|
|
3,728 |
|
|
|
— |
|
|
|
3,728 |
|
|
|
— |
|
Debt – asset-backed |
|
|
440 |
|
|
|
— |
|
|
|
440 |
|
|
|
— |
|
Hedge funds |
|
|
5 |
|
|
|
— |
|
|
|
2 |
|
|
|
3 |
|
Private market securities |
|
|
5 |
|
|
|
— |
|
|
|
— |
|
|
|
5 |
|
Real estate funds |
|
|
4 |
|
|
|
— |
|
|
|
— |
|
|
|
4 |
|
Other |
|
|
62 |
|
|
|
— |
|
|
|
— |
|
|
|
62 |
|
Subtotal |
|
$ |
7,914 |
|
|
$ |
2,129 |
|
|
$ |
5,711 |
|
|
$ |
74 |
|
Investments measured at net asset value |
|
|
|
|
|
|
|
|
|
|
|
|
Debt - government issued |
|
$ |
42 |
|
|
|
|
|
|
|
|
|
|
Debt - corporate-issued |
|
|
3 |
|
|
|
|
|
|
|
|
|
|
U.S. equity securities |
|
|
23 |
|
|
|
|
|
|
|
|
|
|
Non-U.S. equity securities |
|
|
22 |
|
|
|
|
|
|
|
|
|
|
Hedge funds |
|
|
3 |
|
|
|
|
|
|
|
|
|
|
Private market securities |
|
|
1,750 |
|
|
|
|
|
|
|
|
|
|
Real estate funds |
|
|
647 |
|
|
|
|
|
|
|
|
|
|
Total investments measured at net asset value |
|
$ |
2,490 |
|
|
|
|
|
|
|
|
|
|
Other items to reconcile to fair value of plan assets |
|
|
|
|
|
|
|
|
|
|
|
|
Pension trust receivables 2 |
|
|
79 |
|
|
|
|
|
|
|
|
|
|
Pension trust payables 3 |
|
|
(208 |
) |
|
|
|
|
|
|
|
|
|
Total |
|
$ |
10,275 |
|
|
|
|
|
|
|
|
|
|
1.The Corteva pension plans directly held no Corteva, Inc. common stock at December 31, 2025.
2.Primarily receivables for investment securities sold.
3.Primarily payables for investment securities purchased.
|
|
|
|
|
|
|
|
|
|
|
|
|
|
|
|
|
Basis of Fair Value Measurements |
Total |
|
Level 1 |
|
Level 2 |
|
Level 3 |
|
For the year ended December 31, 2024 |
|
|
|
|
|
|
|
|
(In millions) |
|
|
|
|
|
|
|
|
Cash and cash equivalents |
|
$ |
1,030 |
|
|
$ |
1,030 |
|
|
$ |
— |
|
|
$ |
— |
|
U.S. equity securities 1 |
|
|
1,030 |
|
|
|
1,026 |
|
|
|
1 |
|
|
|
3 |
|
Non-U.S. equity securities |
|
|
389 |
|
|
388 |
|
|
|
— |
|
|
|
1 |
|
Debt – government-issued |
|
|
1,628 |
|
|
|
— |
|
|
|
1,628 |
|
|
|
— |
|
Debt – corporate-issued |
|
|
3,540 |
|
|
|
— |
|
|
|
3,540 |
|
|
|
— |
|
Debt – asset-backed |
|
|
590 |
|
|
|
— |
|
|
|
590 |
|
|
|
— |
|
Hedge funds |
|
|
5 |
|
|
|
— |
|
|
|
2 |
|
|
|
3 |
|
Private market securities |
|
|
3 |
|
|
|
— |
|
|
|
— |
|
|
|
3 |
|
Real estate funds |
|
|
101 |
|
|
|
— |
|
|
|
— |
|
|
|
101 |
|
Other |
|
|
51 |
|
|
|
— |
|
|
|
— |
|
|
|
51 |
|
Subtotal |
|
$ |
8,367 |
|
|
$ |
2,444 |
|
|
$ |
5,761 |
|
|
$ |
162 |
|
Investments measured at net asset value |
|
|
|
|
|
|
|
|
|
|
|
|
Debt - government issued |
|
$ |
39 |
|
|
|
|
|
|
|
|
|
|
Debt - corporate-issued |
|
|
3 |
|
|
|
|
|
|
|
|
|
|
U.S. equity securities |
|
|
21 |
|
|
|
|
|
|
|
|
|
|
Non-U.S. equity securities |
|
|
20 |
|
|
|
|
|
|
|
|
|
|
Hedge funds |
|
|
11 |
|
|
|
|
|
|
|
|
|
|
Private market securities |
|
|
1,810 |
|
|
|
|
|
|
|
|
|
|
Real estate funds |
|
|
642 |
|
|
|
|
|
|
|
|
|
|
Total investments measured at net asset value |
|
$ |
2,546 |
|
|
|
|
|
|
|
|
|
|
Other items to reconcile to fair value of plan assets |
|
|
|
|
|
|
|
|
|
|
|
|
Pension trust receivables 2 |
|
|
79 |
|
|
|
|
|
|
|
|
|
|
Pension trust payables 3 |
|
|
(362 |
) |
|
|
|
|
|
|
|
|
|
Total |
|
$ |
10,630 |
|
|
|
|
|
|
|
|
|
|
1.The Corteva pension plans directly held $132 million (approximately 1 percent of total plan assets) of Corteva, Inc. common stock at December 31, 2024.
2.Primarily receivables for investments securities sold.
3.Primarily payables for investment securities purchased.
The following table summarizes the changes in fair value of Level 3 pension plan assets for the years ended December 31, 2025 and 2024:
|
|
|
|
|
|
|
|
|
|
|
|
|
|
|
|
|
|
|
|
|
|
|
|
|
|
|
|
|
|
|
|
|
Fair Value Measurement of |
U.S. equity securities |
|
Non-U.S. equity securities |
|
Debt – corporate-issued |
|
Hedge funds |
|
Private market securities |
|
Real estate funds |
|
Other |
|
Total |
|
Level 3 Pension Plan Assets |
|
|
|
|
|
|
|
|
|
|
|
|
|
|
|
|
(In millions) |
|
|
|
|
|
|
|
|
|
|
|
|
|
|
|
|
Balance at January 1, 2024 |
|
$ |
1 |
|
|
$ |
2 |
|
|
$ |
2 |
|
|
$ |
3 |
|
|
$ |
6 |
|
|
$ |
52 |
|
|
$ |
55 |
|
|
$ |
121 |
|
Actual return on assets: |
|
|
|
|
|
|
|
|
|
|
|
|
|
|
|
|
|
|
|
|
|
|
|
|
Relating to assets sold during the year ended December 31, 2024 |
|
|
— |
|
|
|
3 |
|
|
|
(14 |
) |
|
|
— |
|
|
|
— |
|
|
|
— |
|
|
|
— |
|
|
|
(11 |
) |
Relating to assets held at December 31, 2024 |
|
|
2 |
|
|
|
— |
|
|
|
14 |
|
|
|
— |
|
|
|
(3 |
) |
|
|
(68 |
) |
|
|
(2 |
) |
|
|
(57 |
) |
Purchases, sales and settlements, net |
|
|
— |
|
|
|
(4 |
) |
|
|
— |
|
|
|
— |
|
|
|
— |
|
|
|
1 |
|
|
|
(2 |
) |
|
|
(5 |
) |
Transfers in or out of Level 3, net |
|
|
— |
|
|
|
— |
|
|
|
(2 |
) |
|
|
— |
|
|
|
— |
|
|
|
116 |
|
|
|
— |
|
|
|
114 |
|
Balance at December 31, 2024 |
|
$ |
3 |
|
|
$ |
1 |
|
|
$ |
0 |
|
|
$ |
3 |
|
|
$ |
3 |
|
|
$ |
101 |
|
|
$ |
51 |
|
|
$ |
162 |
|
Actual return on assets: |
|
|
|
|
|
|
|
|
|
|
|
|
|
|
|
|
|
|
|
|
|
|
|
|
Relating to assets sold during the year ended December 31, 2025 |
|
|
(1 |
) |
|
|
(1 |
) |
|
|
— |
|
|
|
— |
|
|
|
— |
|
|
|
— |
|
|
|
— |
|
|
|
(2 |
) |
Relating to assets held at December 31, 2025 |
|
|
1 |
|
|
|
— |
|
|
|
— |
|
|
|
— |
|
|
|
2 |
|
|
|
(3 |
) |
|
|
9 |
|
|
|
9 |
|
Purchases, sales and settlements, net |
|
|
(3 |
) |
|
|
— |
|
|
|
— |
|
|
|
— |
|
|
|
— |
|
|
|
— |
|
|
|
2 |
|
|
|
(1 |
) |
Transfers in or out of Level 3, net |
|
|
— |
|
|
|
— |
|
|
|
— |
|
|
|
— |
|
|
|
— |
|
|
|
(94 |
) |
|
|
— |
|
|
|
(94 |
) |
Balance at December 31, 2025 |
|
$ |
— |
|
|
$ |
— |
|
|
$ |
— |
|
|
$ |
3 |
|
|
$ |
5 |
|
|
$ |
4 |
|
|
$ |
62 |
|
|
$ |
74 |
|
Trust Assets
EIDP entered into a trust agreement in 2013 (as amended and restated in 2017, "the Trust") that established and requires EIDP to fund the Trust for cash obligations under certain non-qualified benefit and deferred compensation plans upon a change in control event as defined in the Trust agreement. Under the Trust agreement, the consummation of the Merger was a change in control event and resulted in a contribution to the Trust by EIDP. Additionally, the Corteva Separation resulted in Corteva transferring a portion of the balance of the Trust to DuPont at the Corteva Separation date. During the years ended December 31, 2025 and 2024, $37 million and $48 million, respectively, was distributed by EIDP according to the Trust agreement, and at December 31, 2025 and 2024, the balance in the Trust was $147 million and $176 million, respectively. The Trust Assets are classified as current restricted cash equivalents and included within other current assets in the Consolidated Balance Sheets. See Note 6 - Supplementary Information, to the Consolidated Financial Statements, for further information.
Defined Contribution Plans
Corteva provides defined contribution benefits to its employees. The most significant is the U.S. Retirement Savings Plan ("the Plan"), which covers almost all of the U.S. full-service employees. This Plan includes a non-leveraged Employee Stock Ownership Plan ("ESOP"). Employees are not required to participate in the ESOP and those who do are free to diversify out of the ESOP. The purpose of the Plan is to provide retirement savings benefits for employees and to provide employees an opportunity to become stockholders of the company. The Plan is a tax qualified contributory profit sharing plan, with cash or deferred arrangement and any eligible employee of Corteva may participate. Currently, Corteva contributes 100 percent of the first six percent of the employee's contribution election and also contributes three percent of each eligible employee's eligible compensation regardless of the employee's contribution.
Corteva's contributions to the Plan were $99 million, $100 million and $101 million for the years ended December 31, 2025, 2024 and 2023, respectively. Corteva's matching contributions vest immediately upon contribution. The three percent nonmatching company contribution vests after employees complete three years of service. In addition, Corteva made contributions to other defined contribution plans of $51 million, $46 million and $45 million for the years ended December 31, 2025, 2024 and 2023, respectively.
NOTE 18 - STOCK-BASED COMPENSATION
Prior to the Corteva Separation, Corteva employees held equity awards, including stock options, share appreciation rights (“SARs”), restricted stock units (“RSUs”) and performance-based restricted stock units (“PSUs”), which were denominated in DowDuPont common stock and, in some cases, in Dow Inc. common stock, and which had originally been issued under the DuPont Equity and Incentive Plan ("EIP"), the Dow Chemical Company 2012 Stock Incentive Plan or the Dow Chemical Company 1988 Award and Option Plan.
As discussed in Note 15 - Commitments and Contingent Liabilities, to the Consolidated Financial Statements, on April 1, 2019 the company entered into an Employee Matters Agreement (the "EMA") with DuPont and Dow that identifies employees and employee-related liabilities (and attributable assets) to be allocated (either retained, transferred and accepted, or assigned and assumed, as applicable) to the Parties as part of the Distributions and describes when and how the relevant transfers and assignments were to occur. With some exceptions, the EMA provides for the equitable adjustment of existing equity incentive compensation awards denominated in the common stock of DowDuPont to reflect the occurrence of the Distributions.
In connection with the Corteva Separation on June 1, 2019, outstanding DowDuPont-denominated stock options, SARs, RSU and PSU awards were converted into Corteva-denominated awards under the “Employer Method,” or into both DuPont-denominated awards and Corteva-denominated awards under the “Shareholder Method,” using a formula designed to preserve the intrinsic value of the awards immediately prior to and subsequent to the Corteva Separation. The awards have the same terms and conditions under the applicable plans and award agreements prior to the Corteva Separation transactions. The conversions of equity awards did not have a material impact on the company's Consolidated Financial Statements.
On June 1, 2019 (“Adoption Date”), in connection with the Corteva Separation, the Omnibus Incentive Plan (the "OIP") became effective. Under the OIP, the company may grant incentive awards, including stock options (both “incentive stock options” and nonqualified stock options), share appreciation rights, restricted shares, restricted stock units, other share-based awards and cash awards, to its and its subsidiaries’ eligible employees, non-employee directors, independent contractors and consultants following the Corteva Separation until the tenth anniversary of the Adoption Date, subject to an aggregate limit and annual individual limits. Under the OIP, the maximum number of shares reserved for the grant or settlement of awards is 20 million shares, excluding shares underlying certain exempt awards, such as the awards converted to Corteva-denominated awards pursuant to the Corteva Separation. At December 31, 2025, approximately 8 million shares were authorized for future grants under the OIP. The company generally satisfies stock option exercises and the vesting of RSUs and PSUs with newly issued shares of Corteva common stock, although RSU awards granted under Historical Dow plans in certain countries are settled in cash.
The Board of Directors' Compensation Committee determines the long-term incentive mix, including stock options, RSUs and PSUs and may authorize new grants annually. The company estimates expected forfeitures.
The total stock-based compensation cost included in income (loss) from continuing operations before income taxes within the Consolidated Statement of Operations was $78 million, $64 million and $54 million for the years ended December 31, 2025, 2024 and 2023, respectively. The income tax benefits related to stock-based compensation arrangements were $(15) million, $(12) million and $(10) million for the years ended December 31, 2025, 2024 and 2023, respectively.
Stock Options
The exercise price of shares subject to option is equal to the market price of the company's common stock on the date of grant. All options vest serially over a period of three years. Stock option awards granted under the EIP (previous plan) between 2016 and May 2019 and the OIP between June 2019 and December 31, 2025 expire 10 years after the grant date.
To measure the fair value of the awards on the date of grant, the company uses the Black-Scholes option pricing model and the assumptions set forth in the table below. The weighted-average grant-date fair value of options granted for the years ended December 31, 2025, 2024 and 2023 was $23.83, $18.80 and $21.42, respectively.
|
|
|
|
|
|
|
|
|
|
|
|
|
|
For the Year ended December 31, |
|
Weighted-Average Assumptions |
2025 |
|
2024 |
|
2023 |
|
Dividend yield |
|
|
1.05 |
% |
|
|
1.18 |
% |
|
|
0.96 |
% |
Expected volatility |
|
|
34.09 |
% |
|
|
32.17 |
% |
|
|
31.07 |
% |
Risk-free interest rate |
|
|
4.40 |
% |
|
|
4.20 |
% |
|
|
4.10 |
% |
Expected life of stock options granted during period (years) |
|
|
6.0 |
|
|
|
6.0 |
|
|
|
6.0 |
|
The company determined the dividend yield by dividing the annualized dividend on Corteva’s common stock by the option exercise price. A historical daily measurement of volatility is determined based on the expected life of the option granted. For the year ended December 31, 2025, the measurement of volatility is based on the historical volatility of Corteva. For the years ended December 31, 2024, and 2023, the measurement of volatility is based on the average volatility of eight of Corteva's peer companies. Corteva's peer volatility is based on the historical volatility of each business respectively. The risk-free interest rate is determined by reference to the yield on an outstanding U.S. Treasury note with a term equal to the expected life of the option granted. Expected life is determined by utilizing the simplified method for estimating expected term.
The following table summarizes stock option activity for the year ended December 31, 2025:
|
|
|
|
|
|
|
|
|
|
|
|
|
|
|
|
|
Stock Options |
For the Year Ended December 31, 2025 |
|
|
Number of Shares
(in thousands) |
|
Weighted Average Exercise Price (per share) |
|
Weighted Average Remaining Contractual Term (in years) |
|
Aggregate Intrinsic Value
(in thousands) |
|
Outstanding at January 1, 2025 |
|
|
3,257 |
|
|
$ |
43.97 |
|
|
|
4.46 |
|
|
$ |
43,761 |
|
Granted |
|
|
288 |
|
|
|
64.70 |
|
|
|
|
|
|
|
Exercised |
|
|
(1,606 |
) |
|
|
40.40 |
|
|
|
|
|
|
|
Forfeited/Expired |
|
|
(58 |
) |
|
|
58.31 |
|
|
|
|
|
|
|
Outstanding at December 31, 2025 |
|
|
1,881 |
|
|
$ |
49.74 |
|
|
|
5.08 |
|
|
$ |
32,565 |
|
Exercisable at December 31, 2025 |
|
|
1,299 |
|
|
$ |
44.95 |
|
|
|
3.70 |
|
|
$ |
28,689 |
|
The aggregate intrinsic values in the table above represent the total pre-tax intrinsic value (the difference between the closing stock price on the last trading day of the period ended December 31, 2025 and the exercise price, multiplied by the number of in-the-money options) that would have been received by the option holders had all option holders exercised their in-the-money options at period end. The total intrinsic value of options exercised for the years ended December 31, 2025, 2024 and 2023 were $42 million, $20 million, and $14 million, respectively. The company recognized tax benefits from options exercised for the years ended December 31, 2025, 2024 and 2023 of $(8) million, $(4) million and $(3) million, respectively.
As of December 31, 2025, $7 million of total unrecognized pre-tax compensation expense related to nonvested stock options is expected to be recognized over a weighted-average period of about 1.14 years.
Restricted Stock Units and Performance Share Units
RSUs granted serially vest over three years. Upon vesting, these RSUs convert one-for-one to Corteva Common Stock. A retirement-eligible employee retains any granted awards upon retirement for one year provided the employee has rendered at least six months of service following the grant date. Additional RSUs are also granted periodically to key senior management employees. These RSUs generally vest over periods ranging from three years to five years. The fair value of all stock-settled RSUs is based upon the market price of the underlying common stock as of the grant date.
The company grants PSUs to senior leadership. In 2025, there were 292,890 PSUs granted. Vesting for PSUs granted in 2025, 2024 and 2023 is partially based on the realization of the company’s improvement of its Return on Net Assets (“RONA”) and Operating Earnings Per Share ("EPS") during the Performance Period. Performance and payouts are determined independently for each metric. The actual award, delivered in Corteva common stock, can range from zero percent to 200 percent of the original grant. The weighted-average grant date fair value of the PSUs granted in 2025 of $64.71 was based upon the market price of the underlying common stock as of the grant date.
Nonvested awards of RSUs and PSUs are shown below.
|
|
|
|
|
|
|
|
|
RSUs and PSUs |
For the Year Ended December 31, 2025 |
|
|
Number of Shares
(in thousands) |
|
Weighted Average Grant Date Fair Value (per share) |
|
Nonvested at January 1, 2025 |
|
|
3,643 |
|
|
$ |
55.12 |
|
Granted |
|
|
1,344 |
|
|
|
64.49 |
|
Vested |
|
|
(1,352 |
) |
|
|
53.99 |
|
Forfeited |
|
|
(272 |
) |
|
|
58.04 |
|
Nonvested at December 31, 2025 |
|
|
3,363 |
|
|
$ |
59.10 |
|
The total fair value of stock units vested for the years ended December 31, 2025, 2024 and 2023 was $73 million, $63 million and $58 million, respectively. The weighted-average grant-date fair value of stock units granted for the years ended December 31, 2025, 2024 and 2023 was $64.49, $54.56 and $62.22, respectively.
As of December 31, 2025, $65 million of total unrecognized pre-tax compensation expense related to RSUs and PSUs is expected to be recognized over a weighted average period of 1.07 years.
NOTE 19 - FINANCIAL INSTRUMENTS
Time Deposits and Money Market Funds
At December 31, 2025 and 2024, the company held investments in held-to-maturity securities at amortized cost, which approximates fair value. At these periods, the company held additional held-to-maturity securities, as well as available-for-sale securities, consisting of investments in foreign government bonds which are discussed further in the "Debt Securities" section. Reclassifications of prior year held-to-maturity balances have been made in the current year to disaggregate between those that are time deposits and foreign government bonds.
The following table summarizes investments in time deposits and money market funds classified as held-to-maturity securities at December 31, 2025 and 2024:
|
|
|
|
|
|
|
|
|
|
Held-to-Maturity Securities |
Amortized Cost |
|
(in millions) |
Balance Sheet Location |
December 31, 2025 |
|
December 31, 2024 |
|
Time deposits and money market funds |
Cash equivalents 1 |
|
$ |
3,431 |
|
|
$ |
2,179 |
|
Time deposits |
Marketable securities 2 |
|
$ |
1 |
|
|
$ |
8 |
|
1.Maturity at time of purchase was three months or less.
2.Maturity at time of purchase was more than three months to less than one year.
Derivative Instruments
Objectives and Strategies for Holding Derivative Instruments
In the ordinary course of business, the company enters into contractual arrangements (derivatives) to reduce its exposure to foreign currency and commodity price risks. The company has established a variety of derivative programs to be utilized for financial risk management. These programs reflect varying levels of exposure coverage and time horizons based on an assessment of risk.
Derivative programs have procedures and controls and are approved by the Corporate Financial Risk Management Committee, consistent with the company's financial risk management policies and guidelines. Derivative instruments used are forwards, options, futures and swaps. The company has not designated any non-derivatives as hedging instruments.
The company's financial risk management procedures also address counterparty credit approval, limits and routine exposure monitoring and reporting. The counterparties to these contractual arrangements are major financial institutions and major commodity exchanges, and multinational grain exporters. The company is exposed to credit losses in the event of nonperformance by these counterparties. The company utilizes collateral support annex agreements with certain counterparties to limit its exposure to credit losses. The company anticipates performance by counterparties to these contracts and therefore no material loss is expected. Market and counterparty credit risks associated with these instruments are regularly reported to management.
The aggregate notional amounts for the company's derivative instruments that are designated and not designated as hedging instruments was a net buy (sell) position of $1,280 million and $(1,056) million at December 31, 2025 and 2024, respectively.
Foreign Currency Risk
The company's objective in managing exposure to foreign currency fluctuations is to reduce earnings and cash flow volatility associated with foreign currency rate changes and to mitigate the exposure of certain investments in foreign subsidiaries against
changes in the Euro/USD exchange rate. Accordingly, the company enters into various contracts that change in value as foreign
exchange rates change to protect the value of its existing foreign currency-denominated assets, liabilities, commitments, investments and cash flows.
The company uses foreign currency exchange contracts to offset its net exposures, by currency, related to the foreign currency denominated monetary assets and liabilities of its operations. The primary business objective of this hedging program is to maintain an approximately balanced position in foreign currencies so that exchange gains and losses resulting from exchange rate changes, after related tax effects, are minimized. The company also uses foreign currency exchange contracts to offset a portion of the company's exposure to certain forecasted transactions as well as the translation of foreign currency-denominated earnings. The company also uses commodity contracts to offset risks associated with foreign currency devaluation in certain countries.
Commodity Price Risk
Commodity price risk management programs serve to reduce exposure to price fluctuations on purchases of inventory such as corn and soybeans. The company enters into over-the-counter and exchange-traded derivative commodity instruments to hedge the commodity price risk associated with agricultural commodity exposures.
Derivatives Designated as Cash Flow Hedges
Commodity Contracts
The company enters into over-the-counter and exchange-traded derivative commodity instruments, including options, futures and swaps, to hedge the commodity price risk associated with agriculture commodity exposures.
While each risk management program has a different time maturity period, most programs currently do not extend beyond the next two years. Cash flow hedge results are reclassified into earnings during the same period in which the related exposure impacts earnings. Reclassifications are made sooner if it appears that a forecasted transaction is not probable of occurring.
The following table summarizes the after-tax effect of commodity contract cash flow hedges on accumulated other comprehensive income (loss):
|
|
|
|
|
|
|
|
|
|
|
|
|
|
For the Year Ended December 31, |
|
(In millions) |
2025 |
|
2024 |
|
2023 |
|
Beginning balance |
|
$ |
(49 |
) |
|
$ |
(71 |
) |
|
$ |
55 |
|
Additions and revaluations of derivatives designated as cash flow hedges |
|
|
3 |
|
|
|
(29 |
) |
|
|
(87 |
) |
Clearance of hedge results to earnings |
|
|
55 |
|
|
|
51 |
|
|
|
(39 |
) |
Ending balance |
|
$ |
9 |
|
|
$ |
(49 |
) |
|
$ |
(71 |
) |
At December 31, 2025, an after-tax net gain of $19 million is expected to be reclassified from accumulated other comprehensive income (loss) into earnings over the next twelve months.
Foreign Currency Contracts
The company enters into forward contracts to hedge the foreign currency risk associated with forecasted transactions within certain foreign subsidiaries.
While each risk management program has a different time maturity period, most programs currently do not extend beyond the next two years. Cash flow hedge results are reclassified into earnings during the same period in which the related exposure impacts earnings. Reclassifications are made sooner if it appears that a forecasted transaction is not probable of occurring.
The following table summarizes the after-tax effect of foreign currency cash flow hedges on accumulated other comprehensive
income (loss):
|
|
|
|
|
|
|
|
|
|
|
|
|
|
For the Year Ended December 31, |
|
(In millions) |
2025 |
|
2024 |
|
2023 |
|
Beginning balance |
|
$ |
13 |
|
|
$ |
1 |
|
|
$ |
10 |
|
Additions and revaluations of derivatives designated as cash flow hedges |
|
|
5 |
|
|
|
19 |
|
|
|
(36 |
) |
Clearance of hedges results to earnings |
|
|
(13 |
) |
|
|
(7 |
) |
|
|
27 |
|
Ending balance |
|
$ |
5 |
|
|
$ |
13 |
|
|
$ |
1 |
|
At December 31, 2025, an after-tax net gain of $5 million is expected to be reclassified from accumulated other comprehensive income (loss) into earnings over the next twelve months.
Derivatives Designated as Net Investment Hedges
Foreign Currency Contracts
In March 2025, the company designated €1.7 billion of forward contracts to exchange Euro as net investment hedges. Of these hedges, €1.2 billion expired and were settled in May 2025, while the remaining €500 million expired and were settled in December 2025. The purpose of these forward contracts was to mitigate foreign exchange exposure related to a portion of the company’s Euro net investments in certain foreign subsidiaries against changes in EUR/USD exchange rates.
In May 2024, the company designated €500 million of forward contracts to exchange Euro as net investment hedges. An additional tranche of €500 million of forward contracts to exchange Euro were executed in July 2024 and also designated as net investment hedges. These hedges expired and were settled in December 2024. The company had previously designated €1.2 billion and €450 million of forward contracts to exchange Euro as net investment hedges, which expired and were settled in May 2024 and March 2023, respectively.
Prior to maturity, the company had elected to apply the spot method in testing for effectiveness of the hedging relationship.
Derivatives not Designated in Hedging Relationships
Foreign Currency Contracts
The company uses foreign exchange contracts to reduce its net exposure, by currency, related to foreign currency-denominated monetary assets and liabilities of its operations so that exchange gains and losses resulting from exchange rate changes are minimized. The netting of such exposures precludes the use of hedge accounting; however, the required revaluation of the forward contracts and the associated foreign currency-denominated monetary assets and liabilities intends to achieve a minimal earnings impact, after taxes. The company also uses foreign currency exchange contracts to offset a portion of the company’s exposure to the translation of certain foreign currency-denominated earnings so that gains and losses on the contracts offset changes in the USD value of the related foreign currency-denominated earnings over the relevant aggregate period.
Commodity Contracts
The company utilizes options, futures and swaps that are not designated as hedging instruments to reduce exposure to commodity price fluctuations on purchases of inventory such as corn and soybeans. The company uses commodity contracts to offset a portion of the company’s exposure to commodity price fluctuations so that gains and losses on the contracts offset changes in the commodity price over the relevant aggregate period. The company uses forward agreements, with durations less than one year, to buy and sell USD priced commodities in order to reduce its exposure to currency devaluation for a portion of its local currency cash balances. Counterparties to the forward sales agreements are multinational grain exporters and subject to the company’s financial risk management procedures.
Fair Value of Derivative Instruments
Asset and liability derivatives subject to an enforceable master netting arrangement with the same counterparty are presented on a net basis in the Consolidated Balance Sheets.
The presentation of the company's derivative assets and liabilities is as follows:
|
|
|
|
|
|
|
|
|
|
|
|
|
|
|
|
December 31, 2025 |
|
(In millions) |
Balance Sheet Location |
Gross |
|
Counterparty and Cash Collateral Netting 1 |
|
Net Amounts Included in the Consolidated Balance Sheet |
|
Asset derivatives: |
|
|
|
|
|
|
|
|
|
|
Derivatives designated as hedging instruments: |
|
|
|
|
|
|
|
|
|
|
Foreign currency contracts |
Other current assets |
|
$ |
5 |
|
|
$ |
— |
|
|
$ |
5 |
|
Commodity contracts |
Other current assets |
|
|
1 |
|
|
|
— |
|
|
|
1 |
|
Derivatives not designated as hedging instruments: |
|
|
|
|
|
|
|
|
|
|
Foreign currency contracts |
Other current assets |
|
|
23 |
|
|
|
(21 |
) |
|
|
2 |
|
Commodity contracts |
Other current assets |
|
|
3 |
|
|
|
— |
|
|
|
3 |
|
Total asset derivatives |
|
|
$ |
32 |
|
|
$ |
(21 |
) |
|
$ |
11 |
|
|
|
|
|
|
|
|
|
|
|
|
Liability derivatives: |
|
|
|
|
|
|
|
|
|
|
Derivatives designated as hedging instruments: |
|
|
|
|
|
|
|
|
|
|
Foreign currency contracts |
Accrued and other current liabilities |
|
$ |
1 |
|
|
$ |
— |
|
|
$ |
1 |
|
Commodity contracts |
Accrued and other current liabilities |
|
|
3 |
|
|
|
— |
|
|
|
3 |
|
Derivatives not designated as hedging instruments: |
|
|
|
|
|
|
|
|
|
|
Foreign currency contracts |
Accrued and other current liabilities |
|
|
40 |
|
|
|
(21 |
) |
|
|
19 |
|
Commodity contracts |
Accrued and other current liabilities |
|
|
6 |
|
|
|
— |
|
|
|
6 |
|
Total liability derivatives |
|
|
$ |
50 |
|
|
$ |
(21 |
) |
|
$ |
29 |
|
|
|
|
|
|
|
|
|
|
|
|
|
|
|
|
|
December 31, 2024 |
|
(In millions) |
Balance Sheet Location |
Gross |
|
Counterparty and Cash Collateral Netting1 |
|
Net Amounts Included in the Consolidated Balance Sheet |
|
Asset derivatives: |
|
|
|
|
|
|
|
|
|
|
Derivatives designated as hedging instruments: |
|
|
|
|
|
|
|
|
|
|
Foreign currency contracts |
Other current assets |
|
$ |
— |
|
|
$ |
— |
|
|
$ |
— |
|
Commodity contracts |
Other current assets |
|
|
8 |
|
|
|
— |
|
|
|
8 |
|
Derivatives not designated as hedging instruments: |
|
|
|
|
|
|
|
|
|
|
Foreign currency contracts |
Other current assets |
|
|
71 |
|
|
|
(45 |
) |
|
|
26 |
|
Commodity contracts |
Other current assets |
|
|
12 |
|
|
|
— |
|
|
|
12 |
|
Total asset derivatives |
|
|
$ |
91 |
|
|
$ |
(45 |
) |
|
$ |
46 |
|
|
|
|
|
|
|
|
|
|
|
|
Liability derivatives: |
|
|
|
|
|
|
|
|
|
|
Derivatives designated as hedging instruments: |
|
|
|
|
|
|
|
|
|
|
Foreign currency contracts |
Accrued and other current liabilities |
|
$ |
— |
|
|
$ |
— |
|
|
$ |
— |
|
Commodity contracts |
Accrued and other current liabilities |
|
|
2 |
|
|
|
— |
|
|
|
2 |
|
Derivatives not designated as hedging instruments: |
|
|
|
|
|
|
|
|
|
|
Foreign currency contracts |
Accrued and other current liabilities |
|
|
104 |
|
|
|
(45 |
) |
|
|
59 |
|
Commodity contracts |
Accrued and other current liabilities |
|
|
5 |
|
|
|
— |
|
|
|
5 |
|
Total liability derivatives |
|
|
$ |
111 |
|
|
$ |
(45 |
) |
|
$ |
66 |
|
1.Counterparty and cash collateral amounts represent the estimated net settlement amount when applying netting and set-off rights included in master netting arrangements between the company and its counterparties and the payable or receivable for cash collateral held or placed with the same counterparty.
Effect of Derivative Instruments
|
|
|
|
|
|
|
|
|
|
|
|
|
|
Amount of Gain (Loss) Recognized in OCI 1 - Pre-Tax |
|
|
For the Year Ended December 31, |
|
(In millions) |
2025 |
|
2024 |
|
2023 |
|
Derivatives designated as hedging instruments: |
|
|
|
|
|
|
|
|
|
Net investment hedges: |
|
|
|
|
|
|
|
|
|
Foreign currency contracts |
|
$ |
(94 |
) |
|
$ |
48 |
|
|
$ |
— |
|
Cash flow hedges: |
|
|
|
|
|
|
|
|
|
Foreign currency contracts |
|
|
5 |
|
|
|
29 |
|
|
|
(54 |
) |
Commodity contracts |
|
|
5 |
|
|
|
(59 |
) |
|
|
(123 |
) |
Total derivatives designated as hedging instruments |
|
$ |
(84 |
) |
|
$ |
18 |
|
|
$ |
(177 |
) |
1.OCI is defined as other comprehensive income (loss).
|
|
|
|
|
|
|
|
|
|
|
|
|
|
Amount of Gain (Loss) Recognized in Income - Pre-Tax 1 |
|
(In millions) |
For the Year Ended December 31, |
|
|
2025 |
|
2024 |
|
2023 |
|
Derivatives designated as hedging instruments: |
|
|
|
|
|
|
|
|
|
Cash flow hedges: |
|
|
|
|
|
|
|
|
|
Foreign currency contracts 2 |
|
$ |
6 |
|
|
$ |
9 |
|
|
$ |
(41 |
) |
Commodity contracts 2 |
|
|
(72 |
) |
|
|
(74 |
) |
|
|
49 |
|
Total derivatives designated as hedging instruments |
|
|
(66 |
) |
|
|
(65 |
) |
|
|
8 |
|
Derivatives not designated as hedging instruments: |
|
|
|
|
|
|
|
|
|
Foreign currency contracts 3 |
|
|
73 |
|
|
|
(130 |
) |
|
|
(28 |
) |
Foreign currency contracts 2 |
|
|
(103 |
) |
|
|
23 |
|
|
|
(77 |
) |
Commodity contracts 2,4 |
|
— |
|
|
|
(34 |
) |
|
|
(20 |
) |
Commodity contracts 3 |
|
— |
|
|
|
(2 |
) |
|
|
2 |
|
Total derivatives not designated as hedging instruments |
|
|
(30 |
) |
|
|
(143 |
) |
|
|
(123 |
) |
Total derivatives |
|
$ |
(96 |
) |
|
$ |
(208 |
) |
|
$ |
(115 |
) |
1.For cash flow hedges, this represents the portion of the gain (loss) reclassified from accumulated OCI into income during the period.
2.Recorded in cost of goods sold, in the Consolidated Statement of Operations.
3.Recognized in other income (expense) - net, in the Consolidated Statement of Operations. Note that the net loss from foreign currency contracts was partially offset by the related gain on the foreign currency-denominated monetary assets and liabilities of the company's operations. See Note 6 - Supplementary Information, to the Consolidated Financial Statements for additional information.
4.The net gain (loss) relating to commodity contracts that are not designated as hedging instruments that were recorded in cost of goods sold, in the Consolidated Statement of Operations, are mostly offset by the related net gain (loss) on third-party grower contracts denominated as liabilities.
Debt Securities
At December 31, 2025 and 2024, the company held investments in held-to-maturity debt securities consisting of foreign government bonds. The company's investments in held-to-maturity securities are held at amortized cost, which approximates fair value. These foreign government bonds are held by certain foreign subsidiaries in which the USD is the functional currency.
|
|
|
|
|
|
|
|
|
|
Held-to-Maturity Securities |
Amortized Cost |
|
(in millions) |
Balance Sheet Location |
December 31, 2025 |
|
December 31, 2024 |
|
Foreign government bonds |
Marketable securities 1 |
|
$ |
— |
|
|
$ |
55 |
|
1.Maturity at time of purchase was more than three months to less than one year.
The company also held debt securities, which consisted of foreign government bonds classified as available-for-sale securities, at December 31, 2025 and 2024. The company's investments in available-for-sale securities are recorded at fair value with unrealized gains and losses recorded in accumulated other comprehensive income (loss), within the Consolidated Statements of Equity, or current period earnings if an allowance for credit losses has been established, within the Consolidated Statements of Operations.
|
|
|
|
|
|
|
|
|
|
Available-for-Sale Securities |
Fair Value |
|
(in millions) |
Balance Sheet Location |
December 31, 2025 |
|
December 31, 2024 |
|
Foreign government bonds |
Marketable securities 1 |
|
$ |
8 |
|
|
$ |
— |
|
Foreign government bonds |
Other assets 2 |
|
$ |
22 |
|
|
$ |
97 |
|
1.Maturity at time of purchase was more than three months to less than one year.
2.Maturity at time of purchase was more than one year.
At December 31, 2025, available for sale debt securities with a contractual maturities of less than one year and of one to five years included gross unrealized gains (losses) of $— million and $— million, respectively.
The estimated fair value of the available-for-sale securities as of December 31, 2025 and 2024 was determined using Level 2 inputs within the fair value hierarchy. Level 2 measurements were based on the closing price at the end of the period quoted market prices in active markets for identical assets and liabilities.
NOTE 20 - FAIR VALUE MEASUREMENTS
The table below summarizes the basis used to measure certain assets and liabilities relating to marketable securities and derivative assets and liabilities at fair value on a recurring basis.
|
|
|
|
|
|
|
|
|
Significant Other Observable Inputs |
December 31, 2025 |
|
December 31, 2024 |
|
(In millions) |
Level 2 1 |
|
Level 2 1 |
|
Assets at fair value: |
|
|
|
|
|
|
Marketable securities |
|
$ |
1 |
|
|
$ |
63 |
|
Debt securities: |
|
|
|
|
|
|
Foreign government bonds 2 |
|
|
30 |
|
|
|
97 |
|
Derivatives relating to:3 |
|
|
|
|
|
|
Foreign currency |
|
|
28 |
|
|
|
71 |
|
Commodity contracts |
|
|
4 |
|
|
|
20 |
|
Total assets at fair value |
|
$ |
63 |
|
|
$ |
251 |
|
Liabilities at fair value: |
|
|
|
|
|
|
Derivatives relating to:3 |
|
|
|
|
|
|
Foreign currency |
|
$ |
41 |
|
|
$ |
104 |
|
Commodity contracts |
|
|
9 |
|
|
|
7 |
|
Total liabilities at fair value |
|
$ |
50 |
|
|
$ |
111 |
|
1.Reflects significant other observable inputs.
2.Represents the company's investments in debt securities that are classified as available-for-sale, which are included in the Consolidated Balance Sheets.
3.See Note 19 - Financial Instruments, to the Consolidated Financial Statements, for the classification of derivatives in the Consolidated Balance Sheets.
For assets and liabilities classified as Level 1 measurements (measured using quoted prices in active markets), total fair value is either the price of the most recent trade at the time of the market close or the official close price, as defined by the exchange on which the asset is most actively traded on the last trading day of the period, multiplied by the number of units held without consideration of transaction costs.
For assets and liabilities classified as Level 2 measurements, where the security is frequently traded in less active markets, fair value is based on the closing price at the end of the period; where the security is less frequently traded, fair value is based on the price a dealer would pay for the security or similar securities, adjusted for any terms specific to that asset or liability, or by using observable market data points of similar, more liquid securities to imply the price. For time deposits classified as held-to-maturity investments and reported at amortized cost, fair value is based on an observable interest rate for similar securities. Market inputs are obtained from well-established and recognized vendors of market data and subjected to tolerance and quality checks.
For derivative assets and liabilities, standard industry models are used to calculate the fair value of the various financial instruments based on significant observable market inputs, such as foreign exchange rates, commodity prices, swap rates and implied volatilities obtained from various market sources. Market inputs are obtained from well-established and recognized vendors of market data and subjected to tolerance/quality checks.
For all other assets and liabilities for which observable inputs are used, fair value is derived through the use of fair value models, such as a discounted cash flow model or other standard pricing models. See Note 19 - Financial Instruments, to the Consolidated Financial Statements, for further information on the types of instruments used by the company for risk management.
There were no transfers between Levels 1 and 2 during the years ended December 31, 2025 and 2024.
For assets classified as Level 3 measurements, the fair value is based on significant unobservable inputs including assumptions where there is little, if any, market activity. The fair value of the company’s interests held in trade receivable conduits is determined by calculating the expected amount of cash to be received using the key input of anticipated credit losses in the portfolio of receivables sold that have not yet been collected. Given the short-term nature of the underlying receivables, discount rate and prepayments are not factors in determining the fair value of the interests.
Fair Value Measurements on a Nonrecurring Basis
As part of the Crop Protection Operations Strategy Restructuring Program, the company plans to exit its production activities at its site in Pittsburg, California, as well as cease operations in select manufacturing lines at other locations. During the year ended December 31, 2023, the company recognized a pre-tax non-cash impairment charge of $152 million to restructuring and asset related charges –
net, in the Consolidated Statement of Operations, consisting of a charge of $92 million and $60 million relating to operating lease assets and property, plant and equipment, respectively, which were classified as Level 3 measurements using unobservable inputs.
See Note 5 - Restructuring and Asset Related Charges - Net, to the Consolidated Financial Statements, for additional information.
NOTE 21 - GEOGRAPHIC INFORMATION
Sales are attributed to geographic areas based on customer location; long-lived assets are attributed to geographic areas based on asset location.
|
|
|
|
|
|
|
|
|
|
|
|
|
|
Net Sales |
|
|
For the Year Ended December 31, |
|
(In millions) |
2025 |
|
2024 |
|
2023 |
|
United States |
|
$ |
8,269 |
|
|
$ |
7,866 |
|
|
$ |
7,783 |
|
Canada |
|
|
755 |
|
|
|
794 |
|
|
|
807 |
|
EMEA |
|
|
3,110 |
|
|
|
3,124 |
|
|
|
3,367 |
|
Latin America 1 |
|
|
3,928 |
|
|
|
3,776 |
|
|
|
3,906 |
|
Asia Pacific |
|
|
1,339 |
|
|
|
1,348 |
|
|
|
1,363 |
|
Total |
|
$ |
17,401 |
|
|
$ |
16,908 |
|
|
$ |
17,226 |
|
1.Net sales for Brazil for the years ended December 31, 2025, 2024 and 2023 were $2,900 million, $2,618 million and $2,523 million, respectively.
|
|
|
|
|
|
|
|
|
|
|
|
|
|
Net Property |
|
|
As of December 31, |
|
(In millions) |
2025 |
|
2024 |
|
2023 |
|
United States |
|
$ |
2,879 |
|
|
$ |
2,878 |
|
|
$ |
2,922 |
|
Canada |
|
|
100 |
|
|
|
101 |
|
|
|
119 |
|
EMEA |
|
|
573 |
|
|
|
522 |
|
|
|
548 |
|
Latin America |
|
|
586 |
|
|
|
514 |
|
|
|
608 |
|
Asia Pacific |
|
|
82 |
|
|
|
84 |
|
|
|
90 |
|
Total |
|
$ |
4,220 |
|
|
$ |
4,099 |
|
|
$ |
4,287 |
|
NOTE 22 - SEGMENT INFORMATION
Corteva’s reportable segments reflect the manner in which its chief operating decision maker ("CODM") allocates resources and assesses performance, which is at the operating segment level (Seed and Crop Protection). The company's CODM is the Chief Executive Officer. The primary measure used by Corteva's CODM for purposes of allocating resources to the segments and assessing segment performance is segment operating EBITDA.
Segment operating EBITDA is primarily utilized in the annual planning and monthly forecasting processes. On a monthly basis, the CODM considers variances between comparable prior year actual results and current year actual or forecasted results when evaluating the company's success in delivering its innovative proprietary technology to farmers and monitoring of expected savings from cost and productivity actions. The CODM also utilizes segment operating EBITDA when evaluating the impacts of market-driven trends on segment performance, such as input costs and inflationary and currency impacts.
The company defines segment operating EBITDA as earnings (loss) (i.e., income (loss) from continuing operations before income taxes) before interest, depreciation, amortization, corporate expenses, non-operating (benefits) costs, foreign exchange gains (losses), and net unrealized gain or loss from mark-to-market activity for certain foreign currency derivative instruments that do not qualify for hedge accounting, excluding the impact of significant items and separation costs. Non-operating (benefits) costs consists of non-operating pension and other post-employment benefit (OPEB) credits (costs), tax indemnification adjustments and environmental remediation and legal costs associated with legacy businesses and sites. Tax indemnification adjustments relate to changes in indemnification balances, as a result of the application of the terms of the Tax Matters Agreement, between Corteva and Dow and/or DuPont that are recorded by the company as pre-tax income or expense. Net unrealized gain or loss from mark-to-market activity for certain foreign currency derivative instruments that do not qualify for hedge accounting represents the non-cash net gain (loss) from changes in fair value of certain undesignated foreign currency derivative contracts. Upon settlement, which is within the same calendar year of execution of the contract, the realized gain (loss) from the changes in fair value of the non-qualified foreign currency derivative contracts will be reported
in the respective segment results to reflect the economic effects of the foreign currency derivative contracts without the resulting unrealized mark to fair value volatility.
Corporate Profile
The company conducts its global operations through the following reportable segments:
Seed
The company's Seed segment is a global leader in developing and supplying commercial seed combining advanced germplasm and traits that offer maximum yield potential for farmers around the world. The segment is a leader in many key seed markets, including North America corn and soybeans, Europe corn and sunflower, as well as Brazil, India, South Africa and Argentina corn. The company offers seed and trait technologies that boost resilience to weather, pests, diseases, and herbicides used to manage weeds. Its digital solutions provide data-driven insights to help farmers optimize yield and profitability.
Crop Protection
The Crop Protection segment serves the global agricultural input industry with products that protect against weeds, insects and other pests, and disease, and that support overall crop health both above and below ground via nitrogen management and seed-applied technologies. The segment offers crop protection solutions and digital solutions that provide farmers tools to improve productivity and profitability, and help keep fields free of weeds, insects and diseases. The segment is a leader in global herbicides, insecticides, nitrogen stabilizers, pasture and range management herbicides and biologicals and other nature-based products.
|
|
|
|
|
|
|
|
|
|
|
|
|
(In millions) |
Seed |
|
Crop Protection |
|
Total |
|
As of and for the Year Ended December 31, 2025 |
|
|
|
|
|
|
|
|
|
Net sales |
|
$ |
9,898 |
|
|
$ |
7,503 |
|
|
$ |
17,401 |
|
Segment operating EBITDA |
|
|
2,636 |
|
|
|
1,350 |
|
|
|
3,986 |
|
Depreciation and amortization |
|
|
780 |
|
|
|
423 |
|
|
|
1,203 |
|
Purchases of property, plant and equipment |
|
|
377 |
|
|
|
214 |
|
|
|
591 |
|
As of and for the Year Ended December 31, 2024 |
|
|
|
|
|
|
|
|
|
Net sales |
|
$ |
9,545 |
|
|
$ |
7,363 |
|
|
$ |
16,908 |
|
Segment operating EBITDA |
|
|
2,219 |
|
|
|
1,272 |
|
|
|
3,491 |
|
Depreciation and amortization |
|
|
805 |
|
|
|
422 |
|
|
|
1,227 |
|
Purchases of property, plant and equipment |
|
|
365 |
|
|
|
232 |
|
|
|
597 |
|
As of and for the Year Ended December 31, 2023 |
|
|
|
|
|
|
|
|
|
Net sales |
|
$ |
9,472 |
|
|
$ |
7,754 |
|
|
$ |
17,226 |
|
Segment operating EBITDA |
|
|
2,117 |
|
|
|
1,374 |
|
|
|
3,491 |
|
Depreciation and amortization |
|
|
814 |
|
|
|
397 |
|
|
|
1,211 |
|
Purchases of property, plant and equipment |
|
|
332 |
|
|
|
263 |
|
|
|
595 |
|
|
|
|
|
|
|
|
|
|
|
|
|
|
Reconciliation of Segment Profitability |
|
|
|
|
|
|
|
|
|
(In millions) |
Seed |
|
Crop Protection |
|
Total |
|
For the Year Ended December 31, 2025 |
|
|
|
|
|
|
|
|
|
Net sales |
|
$ |
9,898 |
|
|
$ |
7,503 |
|
|
$ |
17,401 |
|
Cost of goods sold |
|
|
4,533 |
|
|
|
4,585 |
|
|
|
9,118 |
|
Other expenses 1 |
|
|
2,729 |
|
|
|
1,568 |
|
|
|
4,297 |
|
Segment operating EBITDA |
|
$ |
2,636 |
|
|
$ |
1,350 |
|
|
$ |
3,986 |
|
|
|
|
|
|
|
|
|
|
|
(In millions) |
Seed |
|
Crop Protection |
|
Total |
|
For the Year Ended December 31, 2024 |
|
|
|
|
|
|
|
|
|
Net sales |
|
$ |
9,545 |
|
|
$ |
7,363 |
|
|
$ |
16,908 |
|
Cost of goods sold |
|
|
4,876 |
|
|
|
4,636 |
|
|
|
9,512 |
|
Other expenses 1 |
|
|
2,450 |
|
|
|
1,455 |
|
|
|
3,905 |
|
Segment operating EBITDA |
|
$ |
2,219 |
|
|
$ |
1,272 |
|
|
$ |
3,491 |
|
|
|
|
|
|
|
|
|
|
|
(In millions) |
Seed |
|
Crop Protection |
|
Total |
|
For the Year Ended December 31, 2023 |
|
|
|
|
|
|
|
|
|
Net sales |
|
$ |
9,472 |
|
|
$ |
7,754 |
|
|
$ |
17,226 |
|
Cost of goods sold |
|
|
4,982 |
|
|
|
4,913 |
|
|
|
9,895 |
|
Other expenses 1 |
|
|
2,373 |
|
|
|
1,467 |
|
|
|
3,840 |
|
Segment operating EBITDA |
|
$ |
2,117 |
|
|
$ |
1,374 |
|
|
$ |
3,491 |
|
1.Other expenses consist primarily of selling, general and administrative expenses and research and development expense, net of depreciation add-back.
Reconciliation to Consolidated Financial Statements
|
|
|
|
|
|
|
|
|
|
|
|
|
Income (loss) from continuing operations after income taxes to segment operating EBITDA |
For the Year Ended December 31, |
|
(In millions) |
2025 |
|
2024 |
|
2023 |
|
Income (loss) from continuing operations after income taxes |
|
$ |
1,204 |
|
|
$ |
863 |
|
|
$ |
941 |
|
Provision for (benefit from) income taxes on continuing operations |
|
|
484 |
|
|
|
412 |
|
|
|
152 |
|
Income (loss) from continuing operations before income taxes |
|
$ |
1,688 |
|
|
$ |
1,275 |
|
|
$ |
1,093 |
|
Depreciation and amortization |
|
|
1,203 |
|
|
|
1,227 |
|
|
|
1,211 |
|
Interest income |
|
|
(136 |
) |
|
|
(132 |
) |
|
|
(283 |
) |
Interest expense |
|
|
180 |
|
|
|
233 |
|
|
|
233 |
|
Exchange (gains) losses - net |
|
|
181 |
|
|
|
284 |
|
|
|
397 |
|
Non-operating (benefits) costs - net |
|
|
39 |
|
|
|
174 |
|
|
|
151 |
|
Mark-to-market (gains) losses on certain foreign currency contracts not designated as hedges |
|
— |
|
|
|
— |
|
|
|
— |
|
Significant items |
|
|
658 |
|
|
|
315 |
|
|
|
579 |
|
Separation costs |
|
|
35 |
|
|
|
— |
|
|
|
— |
|
Corporate expenses |
|
|
138 |
|
|
|
115 |
|
|
|
110 |
|
Segment operating EBITDA |
|
$ |
3,986 |
|
|
$ |
3,491 |
|
|
$ |
3,491 |
|
Significant Pre-tax (Charges) Benefits Not Included in Segment Operating EBITDA
The years ended December 31, 2025, 2024 and 2023, respectively, included the following significant pre-tax (charges) benefits which are excluded from segment operating EBITDA:
|
|
|
|
|
|
|
|
|
|
|
|
|
|
|
|
|
(In millions) |
Seed |
|
Crop Protection |
|
Corporate |
|
Total |
|
For the Year Ended December 31, 2025 |
|
|
|
|
|
|
|
|
|
|
|
|
Restructuring and asset related charges - net 1 |
|
$ |
(4 |
) |
|
$ |
(135 |
) |
|
$ |
(7 |
) |
|
$ |
(146 |
) |
Bayer resolution 2 |
|
|
(610 |
) |
|
|
— |
|
|
|
— |
|
|
|
(610 |
) |
Gain (loss) on sale of business, assets and equity investments 3,4 |
|
|
— |
|
|
|
37 |
|
|
|
— |
|
|
|
37 |
|
AltEn facility remediation charges 5 |
|
|
(37 |
) |
|
|
— |
|
|
|
— |
|
|
|
(37 |
) |
Insurance proceeds 6 |
|
|
— |
|
|
|
98 |
|
|
|
— |
|
|
|
98 |
|
Total |
|
$ |
(651 |
) |
|
$ |
— |
|
|
$ |
(7 |
) |
|
$ |
(658 |
) |
|
|
|
|
|
|
|
|
|
|
|
|
|
(In millions) |
Seed |
|
Crop Protection |
|
Corporate |
|
Total |
|
For the Year Ended December 31, 2024 |
|
|
|
|
|
|
|
|
|
|
|
|
Restructuring and asset related charges - net 1 |
|
$ |
(55 |
) |
|
$ |
(142 |
) |
|
$ |
(91 |
) |
|
$ |
(288 |
) |
Gain (loss) on sale of business, assets and equity investments 4 |
|
|
4 |
|
|
|
3 |
|
|
|
— |
|
|
|
7 |
|
Inventory write-offs 4 |
|
|
2 |
|
|
|
— |
|
|
|
— |
|
|
|
2 |
|
Insurance proceeds 6 |
|
|
— |
|
|
|
71 |
|
|
|
— |
|
|
|
71 |
|
Estimated settlement expense 7 |
|
|
— |
|
|
|
(101 |
) |
|
|
— |
|
|
|
(101 |
) |
Acquisition-related costs 8 |
|
|
— |
|
|
|
(6 |
) |
|
|
— |
|
|
|
(6 |
) |
Total |
|
$ |
(49 |
) |
|
$ |
(175 |
) |
|
$ |
(91 |
) |
|
$ |
(315 |
) |
|
|
|
|
|
|
|
|
|
|
|
|
|
(In millions) |
Seed |
|
Crop Protection |
|
Corporate |
|
Total |
|
For the Year Ended December 31, 2023 |
|
|
|
|
|
|
|
|
|
|
|
|
Restructuring and asset related charges - net 1 |
|
$ |
(86 |
) |
|
$ |
(228 |
) |
|
$ |
(22 |
) |
|
$ |
(336 |
) |
Gain (loss) on sale of business, assets and equity investments 4 |
|
|
4 |
|
|
|
10 |
|
|
|
— |
|
|
|
14 |
|
Inventory write-offs 4 |
|
|
(7 |
) |
|
|
— |
|
|
|
— |
|
|
|
(7 |
) |
Spare parts write-off 3 |
|
|
— |
|
|
|
(12 |
) |
|
|
— |
|
|
|
(12 |
) |
Estimated settlement expense 7 |
|
|
— |
|
|
|
(204 |
) |
|
|
— |
|
|
|
(204 |
) |
Acquisition-related costs 8 |
|
|
— |
|
|
|
(45 |
) |
|
|
— |
|
|
|
(45 |
) |
AltEn facility remediation charges 5 |
|
|
(10 |
) |
|
|
— |
|
|
|
— |
|
|
|
(10 |
) |
Employee Retention Credit |
|
|
— |
|
|
|
3 |
|
|
|
— |
|
|
|
3 |
|
Seed sale associated with Russia Exit 4,9 |
|
|
18 |
|
|
|
— |
|
|
|
— |
|
|
|
18 |
|
Total |
|
$ |
(81 |
) |
|
$ |
(476 |
) |
|
$ |
(22 |
) |
|
$ |
(579 |
) |
1.Includes restructuring plans and asset related charges as well as accelerated prepaid amortization expense. See Note 5 - Restructuring and Asset Related Charges - Net, to the Consolidated Financial Statements, for additional information.
2.Consists of a charge relating to the resolution of litigation with Bayer. See Note 15 - Commitments and Contingent Liabilities, to the Consolidated Financial Statements, for additional information.
3.Incremental gains (losses) associated with activities related to the Crop Protection Operations Strategy Restructuring Program. Within gain (loss) on sale of business, assets and equity investments, a $23 million benefit was recorded for the year ended December 31, 2025.
4.Incremental gains (losses) associated with activities related to the 2022 Restructuring Actions. Within gain (loss) on sale of business, assets and equity investments, such benefits are $14 million, $7 million and $14 million for the years ended December 31, 2025, 2024 and 2023, respectively.
5.Relates to a charge to increase the remediation accrual at the AltEn facility relating to Corteva's estimated voluntary contribution to the solid waste and wastewater remedial action plans. See Note 15 - Commitments and Contingent Liabilities, to the Consolidated Financial Statements, for additional information.
6.Includes proceeds received related to prior significant items.
7.Consists of estimated Lorsban® related charges.
8.Relates to acquisition-related costs, including transaction and third-party integration costs associated with the completed acquisitions of Stoller and Symborg as well as the recognition of the inventory fair value step-up.
9.Includes a benefit of $18 million for the year ended December 31, 2023, relating to the sale of seeds already under production in Russia when the decision to exit the country was made and that the company was contractually required to purchase. It consists of $71 million of net sales and $53 million of cost of goods sold for the year ended December 31, 2023.
Schedule II—Valuation and Qualifying Accounts
|
|
|
|
|
|
|
|
|
|
|
|
|
(In millions) |
For the Year Ended December 31, |
|
|
2025 |
|
2024 |
|
2023 |
|
Accounts Receivable—Allowance for Doubtful Receivables |
|
|
|
|
|
|
|
|
|
Balance at beginning of period |
|
$ |
179 |
|
|
$ |
205 |
|
|
$ |
194 |
|
Additions charged to expenses |
|
|
132 |
|
|
|
55 |
|
|
|
24 |
|
Deductions from reserves 1 |
|
|
(70 |
) |
|
(81) |
|
|
|
(13 |
) |
Balance at end of period |
|
$ |
241 |
|
|
$ |
179 |
|
|
$ |
205 |
|
Deferred Tax Assets—Valuation Allowance |
|
|
|
|
|
|
|
|
|
Balance at beginning of period |
|
$ |
666 |
|
|
$ |
510 |
|
|
$ |
342 |
|
Additions to reserves 2 |
|
|
283 |
|
|
|
301 |
|
|
|
225 |
|
Purchase accounting adjustments |
|
|
— |
|
|
|
— |
|
|
|
8 |
|
Deductions from reserves 3 |
|
|
(62 |
) |
|
|
(145 |
) |
|
|
(65 |
) |
Balance at end of period |
|
$ |
887 |
|
|
$ |
666 |
|
|
$ |
510 |
|
1.Deductions include write-offs, recoveries collected and currency translation adjustments.
2.Additions include currency translation adjustments.
3.Deductions include amounts recorded to other comprehensive income and currency translation adjustments.
The Seed Business
Interim Combined Statements of Operations (Unaudited)
|
|
|
|
|
|
|
|
|
|
Three Months Ended March 31, |
|
(In millions) |
2026 |
|
2025 |
|
Net sales |
|
$ |
3,023 |
|
|
$ |
2,707 |
|
Cost of goods sold |
|
|
1,377 |
|
|
|
1,365 |
|
Research and development expense |
|
|
243 |
|
|
|
234 |
|
Selling, general and administrative expenses |
|
|
534 |
|
|
|
456 |
|
Amortization of intangibles |
|
|
121 |
|
|
|
123 |
|
Restructuring and asset related charges - net |
|
|
30 |
|
|
|
2 |
|
Separation costs |
|
|
51 |
|
|
|
— |
|
Other income (expense) - net |
|
|
(12 |
) |
|
|
7 |
|
Interest expense |
|
|
2 |
|
|
|
— |
|
Income (loss) before income taxes |
|
|
653 |
|
|
|
534 |
|
Provision for (benefit from) income taxes |
|
|
150 |
|
|
|
136 |
|
Net income (loss) |
|
|
503 |
|
|
|
398 |
|
Net income (loss) attributable to noncontrolling interests |
|
|
1 |
|
|
|
1 |
|
Net income (loss) attributable to the Seed Business |
|
$ |
502 |
|
|
$ |
397 |
|
See Notes to the Interim Combined Financial Statements
The Seed Business
Interim Combined Statements of Comprehensive Income (Unaudited)
|
|
|
|
|
|
|
|
|
|
Three Months Ended March 31, |
|
(In millions) |
2026 |
|
2025 |
|
Net income (loss) |
|
$ |
503 |
|
|
$ |
398 |
|
Other comprehensive income (loss) - net of tax: |
|
|
|
|
|
|
Cumulative translation adjustments |
|
|
(37 |
) |
|
|
(31 |
) |
Adjustments to pension benefit plans |
|
|
(3 |
) |
|
|
1 |
|
Adjustments to other benefit plans |
|
|
— |
|
|
|
— |
|
Unrealized gain (loss) on investments |
|
|
— |
|
|
|
— |
|
Derivative instruments |
|
|
24 |
|
|
|
17 |
|
Total other comprehensive income (loss) |
|
|
(16 |
) |
|
|
(13 |
) |
Comprehensive income (loss) |
|
|
487 |
|
|
|
385 |
|
Comprehensive income (loss) attributable to noncontrolling interests - net of tax |
|
|
1 |
|
|
|
1 |
|
Comprehensive income (loss) attributable to the Seed Business |
|
$ |
486 |
|
|
$ |
384 |
|
See Notes to the Interim Combined Financial Statements
The Seed Business
Interim Combined Balance Sheets (Unaudited)
|
|
|
|
|
|
|
|
|
|
|
|
|
(In millions) |
March 31, 2026 |
|
December 31, 2025 |
|
March 31, 2025 |
|
Assets |
|
|
|
|
|
|
|
|
|
Current assets |
|
|
|
|
|
|
|
|
|
Cash and cash equivalents |
|
$ |
436 |
|
|
$ |
835 |
|
|
$ |
422 |
|
Marketable securities |
|
|
1 |
|
|
|
1 |
|
|
|
— |
|
Accounts and notes receivable - net |
|
|
3,446 |
|
|
|
1,854 |
|
|
|
3,326 |
|
Inventories |
|
|
2,749 |
|
|
|
3,338 |
|
|
|
2,676 |
|
Other current assets |
|
|
551 |
|
|
|
186 |
|
|
|
538 |
|
Total current assets |
|
$ |
7,183 |
|
|
$ |
6,214 |
|
|
$ |
6,962 |
|
Investment in nonconsolidated affiliates |
|
|
78 |
|
|
|
75 |
|
|
|
60 |
|
Property, plant and equipment |
|
|
4,506 |
|
|
|
4,463 |
|
|
|
4,149 |
|
Less: Accumulated depreciation |
|
|
(2,060 |
) |
|
|
(2,002 |
) |
|
|
(1,793 |
) |
Net property, plant and equipment |
|
|
2,446 |
|
|
|
2,461 |
|
|
|
2,356 |
|
Goodwill |
|
|
5,274 |
|
|
|
5,312 |
|
|
|
5,226 |
|
Other intangible assets |
|
|
7,142 |
|
|
|
7,265 |
|
|
|
7,583 |
|
Deferred income taxes |
|
|
115 |
|
|
|
72 |
|
|
|
66 |
|
Other assets |
|
|
653 |
|
|
|
620 |
|
|
|
634 |
|
Total Assets |
|
$ |
22,891 |
|
|
$ |
22,019 |
|
|
$ |
22,887 |
|
Liabilities and Equity |
|
|
|
|
|
|
|
|
|
Current liabilities |
|
|
|
|
|
|
|
|
|
Short-term borrowings |
|
$ |
127 |
|
|
$ |
112 |
|
|
$ |
12 |
|
Accounts payable |
|
|
1,619 |
|
|
|
2,140 |
|
|
|
1,521 |
|
Income taxes payable |
|
|
97 |
|
|
|
74 |
|
|
|
89 |
|
Deferred revenue |
|
|
2,627 |
|
|
|
3,232 |
|
|
|
2,533 |
|
Accrued and other current liabilities |
|
|
1,343 |
|
|
|
1,691 |
|
|
|
1,176 |
|
Total current liabilities |
|
$ |
5,813 |
|
|
$ |
7,249 |
|
|
$ |
5,331 |
|
Long-term debt |
|
|
— |
|
|
|
— |
|
|
|
— |
|
Other noncurrent liabilities |
|
|
|
|
|
|
|
|
|
Deferred income tax liabilities |
|
|
942 |
|
|
|
826 |
|
|
|
1,002 |
|
Pension and other post-employment benefits |
|
|
222 |
|
|
|
226 |
|
|
|
224 |
|
Other noncurrent obligations |
|
|
479 |
|
|
|
480 |
|
|
|
509 |
|
Total noncurrent liabilities |
|
$ |
1,643 |
|
|
$ |
1,532 |
|
|
$ |
1,735 |
|
Commitments and contingent liabilities |
|
|
|
|
|
|
|
|
|
Equity |
|
|
|
|
|
|
|
|
|
Net Parent investment |
|
|
16,711 |
|
|
|
14,499 |
|
|
|
17,375 |
|
Accumulated other comprehensive income (loss) |
|
|
(1,281 |
) |
|
|
(1,265 |
) |
|
|
(1,558 |
) |
Total Seed Business equity |
|
$ |
15,430 |
|
|
$ |
13,234 |
|
|
$ |
15,817 |
|
Noncontrolling interests |
|
|
5 |
|
|
|
4 |
|
|
|
4 |
|
Total equity |
|
$ |
15,435 |
|
|
$ |
13,238 |
|
|
$ |
15,821 |
|
Total Liabilities and Equity |
|
$ |
22,891 |
|
|
$ |
22,019 |
|
|
$ |
22,887 |
|
See Notes to the Interim Combined Financial Statements
The Seed Business
Interim Combined Statements of Cash Flows (Unaudited)
|
|
|
|
|
|
|
|
|
|
Three Months Ended March 31, |
|
(In millions) |
2026 |
|
2025 |
|
Operating activities |
|
|
|
|
|
|
Net income (loss) |
|
$ |
503 |
|
|
$ |
398 |
|
Adjustments to reconcile net income (loss) to net cash provided by (used for)
operating activities: |
|
|
|
|
|
|
Depreciation and amortization |
|
|
199 |
|
|
|
198 |
|
Provision for (benefit from) deferred income tax |
|
|
61 |
|
|
|
(9 |
) |
Net periodic pension and OPEB (benefit) cost, net |
|
|
2 |
|
|
|
4 |
|
Pension and OPEB contributions |
|
|
(7 |
) |
|
|
(7 |
) |
Net (gain) loss on sales of property, businesses, consolidated companies and investments |
|
|
2 |
|
|
|
(3 |
) |
Restructuring and asset related charges - net |
|
|
30 |
|
|
|
2 |
|
Other net loss |
|
|
77 |
|
|
|
7 |
|
Changes in assets and liabilities, net |
|
|
|
|
|
|
Accounts and notes receivable |
|
|
(1,629 |
) |
|
|
(1,456 |
) |
Inventories |
|
|
594 |
|
|
|
557 |
|
Accounts payable |
|
|
(533 |
) |
|
|
(503 |
) |
Deferred revenue |
|
|
(599 |
) |
|
|
(374 |
) |
Other assets and liabilities |
|
|
(707 |
) |
|
|
(62 |
) |
Cash provided by (used for) operating activities |
|
|
(2,007 |
) |
|
|
(1,248 |
) |
Investing activities |
|
|
|
|
|
|
Capital expenditures |
|
|
(48 |
) |
|
|
(46 |
) |
Proceeds from sales of property, businesses and consolidated companies - net of cash divested |
|
|
— |
|
|
|
8 |
|
Proceeds from sales and maturities of investments |
|
|
1 |
|
|
|
7 |
|
Other investing activities, net |
|
|
(7 |
) |
|
|
— |
|
Cash provided by (used for) investing activities |
|
|
(54 |
) |
|
|
(31 |
) |
Financing activities |
|
|
|
|
|
|
Net change in borrowings (less than 90 days) |
|
|
2 |
|
|
12 |
|
Proceeds from debt |
|
|
30 |
|
|
|
— |
|
Payments on debt |
|
|
(17 |
) |
|
|
(14 |
) |
Net transfers from (to) Parent |
|
|
1,649 |
|
|
|
1,104 |
|
Cash provided by (used for) financing activities |
|
|
1,664 |
|
|
|
1,102 |
|
Effect of exchange rate changes on cash and cash equivalents |
|
|
(2 |
) |
|
|
7 |
|
Increase (decrease) in cash and cash equivalents |
|
|
(399 |
) |
|
|
(170 |
) |
Cash and cash equivalents at beginning of period |
|
|
835 |
|
|
|
592 |
|
Cash and cash equivalents at end of period |
|
$ |
436 |
|
|
$ |
422 |
|
See Notes to the Interim Combined Financial Statements
The Seed Business
Interim Combined Statements of Equity (Unaudited)
|
|
|
|
|
|
|
|
|
|
|
|
|
|
|
|
|
|
|
|
|
(In millions) |
Net Parent Investment |
|
Accumulated Other Comprehensive Income (Loss) |
|
Total Corteva
Net Investment |
|
Non-Controlling Interests |
|
Total Equity |
|
2026 |
|
|
|
|
|
|
|
|
|
|
|
|
|
|
|
Balance at January 1, 2026 |
|
$ |
14,499 |
|
|
$ |
(1,265 |
) |
|
$ |
13,234 |
|
|
$ |
4 |
|
|
$ |
13,238 |
|
Net income (loss) |
|
|
502 |
|
|
|
|
|
|
502 |
|
|
|
1 |
|
|
|
503 |
|
Other comprehensive income (loss) |
|
|
|
|
|
(16 |
) |
|
|
(16 |
) |
|
|
|
|
|
(16 |
) |
Share-based compensation |
|
|
11 |
|
|
|
|
|
|
11 |
|
|
|
|
|
|
11 |
|
Net transfers from (to) Parent |
|
|
1,699 |
|
|
|
|
|
|
1,699 |
|
|
|
|
|
|
1,699 |
|
Balance at March 31, 2026 |
|
$ |
16,711 |
|
|
$ |
(1,281 |
) |
|
$ |
15,430 |
|
|
$ |
5 |
|
|
$ |
15,435 |
|
|
|
|
|
|
|
|
|
|
|
|
|
|
|
|
|
|
|
|
|
|
(In millions) |
Net Parent Investment |
|
Accumulated Other Comprehensive Income (Loss) |
|
Total Corteva
Net Investment |
|
Non-Controlling Interests |
|
Total Equity |
|
2025 |
|
|
|
|
|
|
|
|
|
|
|
|
|
|
|
Balance at January 1, 2025 |
|
$ |
15,869 |
|
|
$ |
(1,545 |
) |
|
$ |
14,324 |
|
|
$ |
3 |
|
|
$ |
14,327 |
|
Net income (loss) |
|
|
397 |
|
|
|
|
|
|
397 |
|
|
|
1 |
|
|
|
398 |
|
Other comprehensive income (loss) |
|
|
|
|
|
(13 |
) |
|
|
(13 |
) |
|
|
|
|
|
(13 |
) |
Share-based compensation |
|
|
9 |
|
|
|
|
|
|
9 |
|
|
|
|
|
|
9 |
|
Net transfers from (to) Parent |
|
|
1,100 |
|
|
|
|
|
|
1,100 |
|
|
|
|
|
|
1,100 |
|
Balance at March 31, 2025 |
|
$ |
17,375 |
|
|
$ |
(1,558 |
) |
|
$ |
15,817 |
|
|
$ |
4 |
|
|
$ |
15,821 |
|
See Notes to the Interim Combined Financial Statements
NOTE 1 — SUMMARY OF SIGNIFICANT ACCOUNTING POLICIES
The accompanying interim Combined Financial Statements present the combined results of operations, financial position and cash flows of the Seed business (the “Seed Business” or the "Company") of Corteva, Inc. (“Corteva” or “Parent”). The Seed Business is a global leader in developing and supplying commercial seed combining advanced germplasm and traits that offer maximum yield potential for farmers around the world. It is a leader in many key seed markets, including North America corn and soybeans, Europe corn and sunflower, as well as Brazil, India, South Africa and Argentina corn. The Company offers trait technologies that improve resistance to weather, disease, insects, herbicides used to control weeds and enhance food and nutritional characteristics, and digital solutions that assist decision-making to help maximize farmer yield and profitability. As a separate company, the Seed Business plans to grow through opportunities in gene editing, biofuels, hybrid wheat, expanded crop offerings, and mergers and acquisitions.
On October 1, 2025, Corteva announced its intention to pursue, subject to the approval of the Corteva Board of Directors and any required regulatory approvals, its separation into two independent publicly traded companies - one comprising its current Crop Protection business ("New Corteva") and the other comprising its current Seed business (“Vylor Inc.,” "Vylor" or "the Seed Business") - by distributing all outstanding shares of Vylor common stock to Corteva shareholders in a transaction that is intended to be a tax-free spin-off for U.S. federal income tax purposes.
Basis of Presentation
The accompanying interim Combined Financial Statements and notes present the results of operations, financial position, and cash flows of the Seed Business and have been derived from the consolidated financial statements and accounting records of Corteva using the historical results of operations and historical basis of assets and liabilities of the Seed Business. As the Seed Business has historically operated as an operating segment of Corteva, separate financial statements for the Seed Business have not historically been prepared. These interim Combined Financial Statements may not reflect the financial statements had the Seed Business been a stand-alone company. The interim Combined Financial Statements have been prepared in accordance with generally accepted accounting principles in the United States of America ("GAAP") for interim financial information. In the opinion of management, all adjustments (consisting of normal recurring adjustments) considered necessary for a fair statement of the results for interim periods have been included. Results for interim periods should not be considered indicative of results for a full year. These interim Combined Financial Statements should be read in conjunction with the audited Combined Financial Statements and Notes thereto for the year ended December 31, 2025. The interim Combined Financial Statements include the accounts of the company and all of its subsidiaries in which a controlling interest is maintained.
The interim Combined Statements of Operations include all income and expenses directly attributable to the Seed Business, along with allocations of certain expenses for services from Corteva including, but not limited to, general corporate expenses related to finance, legal, information technology, human resources, ethics and compliance, shared services, employee benefits and incentives, insurance and stock-based compensation. These expenses have been allocated on a pro rata basis using net sales as a measure. The Seed Business and Corteva consider the basis on which the expenses have been allocated to be a reasonable reflection of the utilization of services provided. Management does not believe that it is practicable to estimate the expense the Seed Business would have incurred as a stand-alone company. The amount of actual costs that may have been incurred if the Seed Business were a stand-alone company would depend on a number of factors, including the Seed Business’ chosen organizational structure, which functions were outsourced or performed by Seed Business employees, contract terms negotiated with third party providers, and strategic decisions made in areas such as information technology and infrastructure.
The interim Combined Balance Sheets include all assets and liabilities specifically attributable to the Seed Business and certain assets and liabilities held by Corteva that are specifically identifiable or otherwise attributable to the Seed Business. Corteva uses a centralized approach to cash management and financing of its operations, including funding of required operating and investing activities of the Seed Business. Transfers of cash between Corteva and the Seed Business are reflected within Net transfers from (to) Parent in the interim Combined Statements of Cash Flows and the interim Combined Statements of Equity. Any cash maintained in accounts for which the Seed Business subsidiary owns and retains the right to control the cash has been recorded as cash and cash equivalents on the interim Combined Balance Sheets. All debt and debt-related interest cost incurred by the Seed Business as the legal obligor has been recorded in the interim Combined Financial Statements. Additionally, the interim Combined Balance Sheets include a Net Parent investment comprised of financial support received from Corteva for which repayment was not required and the net effect of cost allocations from transactions with Corteva, net of the Seed Business' accumulated earnings and any dividends paid to Corteva.
The Seed Business' operations are included in the consolidated U.S. federal, and certain state, local and foreign income tax returns filed by Corteva, where applicable. The Seed Business also files certain separate state, local and foreign income tax returns. Income tax expense and other income tax related information contained in these Combined Financial Statements are presented on a separate return basis as if the Seed Business filed its own tax returns. The Seed Business' tax results as presented in the interim Combined Financial
Statements may not be reflective of the results that the Seed Business would generate in the future. In jurisdictions where the Seed Business has been included in the tax returns filed by Corteva, any income taxes payable resulting from the related income tax provision have been reflected in the Combined Balance Sheets within Net Parent investment
All intercompany transactions and accounts within the Seed Business have been eliminated in the interim Combined Financial Statements. Transactions between the Seed Business and Corteva are deemed to have been settled in the period incurred through Net Parent investment, the net effect of which is reflected within financing activities in the interim Combined Statements of Cash Flows as Net transfers from (to) Parent and in the interim Combined Balance Sheets as Net Parent investment.
Since 2018, Argentina has been considered a highly-inflationary economy under U.S. GAAP and therefore the U.S. Dollar (“USD”) is the functional currency for the Seed Business' related subsidiaries. Argentina contributes approximately 3 percent to annual Americas segment net sales and approximately 2 percent to annual Americas segment operating EBITDA. The Seed Business remeasures net monetary assets and translates the financial statements utilizing the official Argentine Peso (“Peso”) to USD exchange rate. The ability to draw down Peso cash balances is limited at this time due to government restrictions and market availability of U.S. Dollars. The devaluation of the Peso relative to the USD over the last several years has resulted in the recognition of exchange losses (refer to Note 5 – Supplementary Information, to the interim Combined Financial Statements, and Note 6 - Supplementary Information, to the Combined Financial Statements). As of March 31, 2026, a further 10 percent deterioration in the official Peso to USD exchange rate would not have a significant impact on the USD value of the Seed Business' net monetary assets or pre-tax earnings. The Seed Business will continue to assess the implications to its operations and financial reporting.
NOTE 2 — RECENT ACCOUNTING GUIDANCE
Accounting Guidance Issued But Not Adopted as of March 31, 2026
In November 2024, the Financial Accounting Standards Board ("FASB") issued Accounting Standards Update ("ASU") 2024-03, Income Statement—Reporting Comprehensive Income—Expense Disaggregation Disclosures (Subtopic 220-40): Disaggregation of Income Statement Expenses. This ASU includes amendments that require entities to bifurcate specified expense line items on the income statement into underlying components, including purchases of inventory, employee compensation, depreciation, intangible asset amortization and depletion, as applicable. Qualitative descriptions of the remaining components are required. These enhanced disclosures are required for both interim and annual periods. Selling expenses must also be separately disclosed for both interim and annual periods, along with an annual qualitative description of the composition of selling expenses. In January 2025, the FASB subsequently issued ASU 2025-01, Income Statement—Reporting Comprehensive Income—Expense Disaggregation Disclosures (Subtopic 220-40): Clarifying the Effective Date, to provide clarification on the ASU's effective date. The new standard is effective for fiscal years beginning after December 15, 2026 on a prospective basis with the option to apply it retrospectively, and for interim periods within fiscal years beginning after December 15, 2027. Early adoption is permitted. The adoption of this guidance will result in the Company being required to include enhanced disclosures around income statement expenses.
NOTE 3 — REVENUE
Contract Balances
Contract liabilities primarily reflect deferred revenue from prepayments under contracts with customers where the company receives advance payments for products to be delivered in future periods. The Seed Business classifies deferred revenue as current or noncurrent based on the timing of when the company expects to recognize revenue. Deferred revenue - current was $2,627 million, $3,232 million and $2,533 million at March 31, 2026, December 31, 2025 and March 31, 2025, respectively. Revenue recognized during the three months ended March 31, 2026 and 2025 from amounts included in deferred revenue at the beginning of the period was $1,038 million and $932 million, respectively.
Disaggregation of Revenue
The Seed Business’ operations are classified into two operating segments: Americas and Rest of World. The Seed Business disaggregates its revenue by major product line and geographic region, as the Company believes it best depicts the nature, amount and timing of its revenue and cash flows. Net sales by major product line are included below:
|
|
|
|
|
|
|
|
|
|
Three Months Ended March 31, |
|
(In millions) |
2026 |
|
2025 |
|
Corn |
|
$ |
2,373 |
|
|
$ |
2,069 |
|
Soybean |
|
|
306 |
|
|
|
305 |
|
Other oilseeds |
|
|
245 |
|
|
|
223 |
|
Other |
|
|
99 |
|
|
|
110 |
|
Total |
|
$ |
3,023 |
|
|
$ |
2,707 |
|
Sales are attributed to geographic regions based on customer location. Net sales by geographic region and segment are included below:
|
|
|
|
|
|
|
|
|
|
Three Months Ended March 31, |
|
(In millions) |
2026 |
|
2025 |
|
North America 1 |
|
$ |
1,770 |
|
|
$ |
1,597 |
|
EMEA 2 |
|
|
928 |
|
|
|
826 |
|
Latin America |
|
|
224 |
|
|
|
185 |
|
Asia Pacific |
|
|
101 |
|
|
|
99 |
|
Total |
|
$ |
3,023 |
|
|
$ |
2,707 |
|
1.Represents U.S. and Canada
2.Europe, Middle East and Africa ("EMEA")
NOTE 4 — RESTRUCTURING AND ASSET RELATED CHARGES - NET
Corteva periodically assesses its business priorities and operational structure to maximize the customer experience and deliver on growth and earnings potential. The Seed Business records charges attributable to it in association with these committed restructuring actions. The restructuring actions associated with these programs are expected to be substantially complete by December 2026. At March 31, 2026 and 2025, the liability associated with these programs was $32 million and $19 million, respectively. The remaining cash payments related to these charges, which primarily consist of severance and related benefits payments, are expected to be paid over the course of the next year, with substantially all payments anticipated to occur during 2026.
The following table is a summary of charges incurred related to the restructuring actions for the three months ended March 31, 2026 and 2025:
|
|
|
|
|
|
|
|
|
|
Three Months Ended March 31, |
|
(In millions) |
2026 |
|
2025 |
|
Severance and related benefit costs 1 |
|
$ |
30 |
|
|
$ |
(1 |
) |
Asset related charges 2 |
|
|
— |
|
|
|
3 |
|
Total restructuring and asset related charges - net |
|
$ |
30 |
|
|
$ |
2 |
|
1.Represents corporate-related charges
2.Reflects charges which are substantially all associated with the Americas segment.
NOTE 5 — SUPPLEMENTARY INFORMATION
|
|
|
|
|
|
|
|
|
Other Income (Expense) - Net |
Three Months Ended March 31, |
|
(In millions) |
2026 |
|
2025 |
|
Interest income |
|
$ |
12 |
|
|
$ |
11 |
|
Equity in earnings (losses) of affiliates - net |
|
|
16 |
|
|
|
11 |
|
Net gain (loss) on sales of businesses and other assets |
|
|
(2 |
) |
|
|
3 |
|
Net exchange gains (losses) 1 |
|
|
(25 |
) |
|
|
(12 |
) |
Non-operating pension and other post employment benefit credits (costs) 2 |
|
|
(1 |
) |
|
|
(3 |
) |
Miscellaneous income (expenses) - net 3 |
|
|
(12 |
) |
|
|
(3 |
) |
Other income (expense) - net |
|
$ |
(12 |
) |
|
$ |
7 |
|
1.Includes net pre-tax exchange gains (losses) of $3 million and $4 million associated with impacts from the devaluation of the Argentine peso for the three months ended March 31, 2026 and 2025, respectively.
2.Includes non-service related components of net periodic benefit credits (costs) (interest cost, expected return on plan assets, amortization of unrecognized gain (loss), amortization of prior service benefit and settlement gain (loss)).
3.Includes losses from sale of receivables and other items. There were no income or expense amounts that were individually significant for the three months ended March 31, 2026 or 2025.
The following table summarizes the impacts of the Company's foreign currency hedging program on the Company's results of operations. The Company routinely uses foreign currency exchange contracts to offset its net exposures, by currency, related to the foreign currency-denominated monetary assets and liabilities. The objective of this program is to maintain an approximately balanced position in foreign currencies in order to minimize, on an after-tax basis, the effects of exchange rate changes on net monetary asset positions. The hedging
program gains (losses) are largely taxable (tax deductible) in the U.S., whereas the offsetting exchange gains (losses) on the remeasurement of the net monetary asset positions are often not taxable (tax deductible) in their local jurisdictions. The net pre-tax exchange gains (losses) are recorded in other income (expense) - net and the related tax impact is recorded in provision for (benefit from) income taxes in the interim Combined Statements of Operations.
|
|
|
|
|
|
|
|
|
|
Three Months Ended March 31, |
|
(In millions) |
2026 |
|
2025 |
|
Subsidiary Monetary Position Gain (Loss) |
|
|
|
|
|
|
Pre-tax exchange gain (loss) |
|
$ |
18 |
|
|
$ |
(27 |
) |
Local tax (expenses) benefits |
|
|
(4 |
) |
|
|
5 |
|
Net after-tax impact from subsidiary exchange gain (loss) |
|
$ |
14 |
|
|
$ |
(22 |
) |
|
|
|
|
|
|
|
Hedging Program Gain (Loss) |
|
|
|
|
|
|
Pre-tax exchange gain (loss) |
|
$ |
(43 |
) |
|
$ |
15 |
|
Tax (expenses) benefits |
|
|
11 |
|
|
|
(4 |
) |
Net after-tax impact from hedging program exchange gain (loss) |
|
$ |
(32 |
) |
|
$ |
11 |
|
|
|
|
|
|
|
|
Total Exchange Gain (Loss) |
|
|
|
|
|
|
Pre-tax exchange gain (loss) |
|
$ |
(25 |
) |
|
$ |
(12 |
) |
Tax (expenses) benefits |
|
|
7 |
|
|
|
1 |
|
Net after-tax exchange gain (loss) attributable to the Seed Business |
|
$ |
(18 |
) |
|
$ |
(11 |
) |
Accounts payable
At March 31, 2026, December 31, 2025 and March 31, 2025, accounts payable was $1,619 million, $2,140 million and $1,521 million, respectively, which includes accounts payable - trade of $966 million, $1,806 million, and $951 million, respectively. Included in accounts payable – trade was seed grower compensation of approximately $120 million, $420 million, and $145 million at March 31, 2026, December 31, 2025 and March 31, 2025, respectively, which is measured at fair value using Level 2 inputs for each period presented.
NOTE 6 — INCOME TAXES
The effective tax rate for the three months ended March 31, 2026, and 2025 was 23.0 percent and 25.5 percent, respectively.
During the three months ended March 31, 2026 and 2025, the company recognized $34 million and $7 million, respectively, of net tax benefits for income taxes associated with changes in deferred taxes and accruals for certain prior year tax positions in various jurisdictions.
The Company routinely uses foreign currency exchange contracts to offset its net exposures, by currency, related to the foreign currency-denominated monetary assets and liabilities. The objective of the program, which resides in the U.S., is to maintain an approximately balanced position in foreign currencies in order to minimize, on an after-tax basis, the effects of exchange rate changes on net monetary asset positions, which can drive material impacts on the Company's effective tax rate. For further discussion of pre-tax and after-tax impacts of the Company's foreign currency hedging program and net monetary asset programs, see Note 5 - Supplementary Information, to the interim Combined Financial Statements.
NOTE 7 — ACCOUNTS AND NOTES RECEIVABLE - NET
|
|
|
|
|
|
|
|
|
|
|
|
|
(In millions) |
March 31, 2026 |
|
December 31, 2025 |
|
March 31, 2025 |
|
Accounts receivable – trade 1 |
|
$ |
2,651 |
|
|
$ |
1,263 |
|
|
$ |
2,549 |
|
Notes receivable – trade 1,2 |
|
|
310 |
|
|
|
104 |
|
|
|
306 |
|
Other 3 |
|
|
485 |
|
|
|
487 |
|
|
|
471 |
|
Total accounts and notes receivable - net |
|
$ |
3,446 |
|
|
$ |
1,854 |
|
|
$ |
3,326 |
|
1.Accounts and notes receivable – trade are net of allowances of $165 million, $144 million and $120 million at March 31, 2026, December 31, 2025 and March 31, 2025, respectively.
2.Notes receivable – trade primarily consists of receivables for deferred payment loan programs for the sale of Seed products to customers. These loans have terms of one year or less and are primarily concentrated in the United States. The Company maintains a rigid pre-approval process for extending credit to customers in order to manage overall risk and exposure associated with credit losses. As of March 31, 2026, December 31, 2025 and March 31, 2025, there were no significant impairments related to current loan agreements.
3.Other includes receivables in relation to royalties, value added tax, general sales tax and other taxes. No individual group represents more than 5 percent of total current assets. In addition, Other includes amounts due from nonconsolidated affiliates of $56 million, $63 million and $77 million as of March 31, 2026, December 31, 2025 and March 31, 2025, respectively.
Accounts and notes receivable are carried at the expected amount to be collected, which approximates fair value. The Seed Business establishes the allowance for doubtful receivables using a loss-rate method where the loss rate is developed using past events, historical experience, current conditions and forecasts that affect the collectability of the financial assets.
The following table summarizes changes in the allowance for doubtful receivables for the three months ended March 31, 2026 and 2025:
|
|
|
|
|
(In millions) |
|
|
|
2025 |
|
|
|
Balance at December 31, 2024 |
|
$ |
110 |
|
Net provision for credit losses |
|
|
11 |
|
Other - net of write-offs charged against allowance |
|
|
(1 |
) |
Balance at March 31, 2025 |
|
$ |
120 |
|
2026 |
|
|
|
Balance at December 31, 2025 |
|
$ |
144 |
|
Net provision for credit losses |
|
|
25 |
|
Other - net of write-offs charged against allowance |
|
|
(4 |
) |
Balance at March 31, 2026 |
|
$ |
165 |
|
The Seed Business enters into various factoring agreements with third-party financial institutions to sell its trade receivables under both recourse and non-recourse agreements in exchange for cash proceeds. These financing arrangements result in a transfer of the Seed Business’ receivables and risks to the third party. As these transfers qualify as true sales under the applicable accounting guidance, the receivables are derecognized from the interim Combined Balance Sheets upon transfer, and the Company receives a payment for the receivables from the third party within a mutually agreed upon time period. For arrangements involving an element of recourse, which is typically provided through a guarantee of accounts in the event of customer default, the guarantee obligation is measured using market data from similar transactions and reported as a current liability in the interim Combined Balance Sheets.
Trade receivables sold under these agreements were $12 million and $10 million for the three months ended March 31, 2026 and 2025, respectively. The trade receivables sold that remained outstanding under these agreements which include an element of recourse as of March 31, 2026, December 31, 2025 and March 31, 2025 were $3 million, $4 million and $11 million, respectively. The net proceeds received are included in cash provided by (used for) operating activities in the interim Combined Statements of Cash Flows. The difference between the carrying amount of the trade receivables sold and the sum of the cash received is recorded as a loss on sale of receivables in other income (expense) - net, in the interim Combined Statements of Operations. The loss on sale of receivables for the three months ended March 31, 2026 and 2025, was not material. See Note 11 - Commitments and Contingent Liabilities, to the interim Combined Financial Statements, for additional information on the Company’s guarantees.
NOTE 8 — INVENTORIES
|
|
|
|
|
|
|
|
|
|
|
|
|
(In millions) |
March 31, 2026 |
|
December 31, 2025 |
|
March 31, 2025 |
|
Finished products |
|
$ |
2,043 |
|
|
$ |
1,946 |
|
|
$ |
1,938 |
|
Semi-finished products |
|
|
545 |
|
|
|
1,144 |
|
|
|
571 |
|
Raw materials and supplies |
|
|
161 |
|
|
|
248 |
|
|
|
167 |
|
Total inventories |
|
$ |
2,749 |
|
|
$ |
3,338 |
|
|
$ |
2,676 |
|
NOTE 9 — OTHER INTANGIBLE ASSETS
The gross carrying amounts and accumulated amortization of other intangible assets by major class are as follows:
|
|
|
|
|
|
|
|
|
|
|
|
|
|
|
|
|
|
|
|
|
|
|
|
|
|
|
|
|
|
|
|
|
|
|
|
|
|
March 31, 2026 |
|
December 31, 2025 |
|
March 31, 2025 |
|
(In millions) |
Gross |
|
Accumulated
Amortization |
|
Net |
|
Gross |
|
Accumulated
Amortization |
|
Net |
|
Gross |
|
Accumulated
Amortization |
|
Net |
|
Intangible assets subject to amortization (finite-lived): |
|
|
|
|
|
|
|
|
|
|
|
|
|
|
|
|
|
|
|
|
|
|
|
|
|
|
|
Germplasm |
|
$ |
6,291 |
|
|
$ |
(1,649 |
) |
|
$ |
4,642 |
|
|
$ |
6,291 |
|
|
$ |
(1,587 |
) |
|
$ |
4,704 |
|
|
$ |
6,291 |
|
|
$ |
(1,399 |
) |
|
$ |
4,892 |
|
Customer-related |
|
|
1,655 |
|
|
|
(747 |
) |
|
|
908 |
|
|
|
1,659 |
|
|
|
(726 |
) |
|
|
933 |
|
|
|
1,644 |
|
|
|
(655 |
) |
|
|
989 |
|
Developed technology |
|
|
1,001 |
|
|
|
(866 |
) |
|
|
135 |
|
|
|
1,007 |
|
|
|
(854 |
) |
|
|
153 |
|
|
|
981 |
|
|
|
(815 |
) |
|
|
166 |
|
Trademarks/trade names |
|
|
1,868 |
|
|
|
(411 |
) |
|
|
1,457 |
|
|
|
1,868 |
|
|
|
(393 |
) |
|
|
1,475 |
|
|
|
1,868 |
|
|
|
(337 |
) |
|
|
1,531 |
|
Other 1 |
|
|
143 |
|
|
|
(143 |
) |
|
|
— |
|
|
|
143 |
|
|
|
(143 |
) |
|
|
— |
|
|
|
152 |
|
|
|
(147 |
) |
|
|
5 |
|
Total other intangible assets |
|
$ |
10,958 |
|
|
$ |
(3,816 |
) |
|
$ |
7,142 |
|
|
$ |
10,968 |
|
|
$ |
(3,703 |
) |
|
$ |
7,265 |
|
|
$ |
10,936 |
|
|
$ |
(3,353 |
) |
|
$ |
7,583 |
|
1.Primarily consists of sales and farmer networks, marketing and manufacturing alliances and noncompetition agreements.
The aggregate pre-tax amortization expense from continuing operations for definite-lived intangible assets was $121 million and $123 million for the three months ended March 31, 2026 and 2025, respectively. The current estimated aggregate pre-tax amortization expense for the remainder of 2026, and each of the next five years, is approximately $360 million, $427 million, $427 million, $427 million, $427 million, and $427 million, respectively.
NOTE 10 — SHORT-TERM BORROWINGS AND AVAILABLE CREDIT FACILITIES
The following tables summarize Seed Business’ short-term borrowings:
|
|
|
|
|
|
|
|
|
|
|
|
|
Short-term borrowings |
|
|
|
|
|
|
|
|
|
(In millions) |
March 31, 2026 |
|
December 31, 2025 |
|
March 31, 2025 |
|
Foreign loans |
|
$ |
125 |
|
|
$ |
112 |
|
|
$ |
— |
|
Domestic loans |
|
|
2 |
|
|
|
— |
|
|
|
12 |
|
Total short-term borrowings |
|
$ |
127 |
|
|
$ |
112 |
|
|
$ |
12 |
|
Short-term borrowings consist of loans originated locally to finance subsidiary working capital needs and capital expenditures. The weighted average interest rate related to these loans was 5.98%, 6.02%, and 6.07% at March 31, 2026, December 31, 2025 and March 31, 2025, respectively.
Uncommitted Credit Facilities and Outstanding Letters of Credit
Unused bank credit lines on uncommitted credit facilities were $371 million at March 31, 2026. These lines are available to support short-term liquidity needs and general corporate purposes, including letters of credit.
NOTE 11 — COMMITMENTS AND CONTINGENT LIABILITIES
Guarantees
Obligations for Supplier Finance Programs
The Seed Business enters into supplier finance programs with various finance providers in which the Seed Business agrees to pay these finance providers the stated amount of confirmed invoices from participating suppliers by the original maturity date. The Seed Business or the finance provider may terminate the agreement upon providing, in most cases, at least thirty days’ written notice. The payment terms that the company has with its finance providers under supplier finance programs are less than one year. At March 31, 2026, December 31, 2025 and March 31, 2025, the outstanding obligations under supplier finance programs was $38 million, $53 million and $42 million, respectively, and included within accounts payable in the interim Combined Balance Sheets.
The rollforward of the Company’s outstanding obligations confirmed as valid under its supplier finance programs for the period ended March 31, 2026 is as follows:
|
|
|
|
|
(In millions) |
|
|
|
Confirmed obligations outstanding at December 31, 2025 |
|
$ |
53 |
|
Invoices confirmed during the period |
|
|
43 |
|
Confirmed invoices paid during the period |
|
|
(58 |
) |
Confirmed obligations outstanding at March 31, 2026 |
|
$ |
38 |
|
Obligations for Customers and Other Third Parties
The Seed Business has directly guaranteed various debt obligations under agreements with third parties related to customers and other third parties. At March 31, 2026, December 31, 2025 and March 31, 2025, the Company had directly guaranteed $12 million, $10 million and $4 million, respectively, of such obligations. These amounts represent the maximum potential amount of future (undiscounted) payments that the Seed Business could be required to make under the guarantees in the event of default by the guaranteed party. The maximum future payments include $2 million, $1 million and $4 million at March 31, 2026, December 31, 2025 and March 31, 2025, respectively, of guarantees related to the various factoring agreements into which the Company enters with third-party financial institutions to sell its trade receivables. See Note 7 - Accounts and Notes Receivable - Net, to the interim Combined Financial Statements, for additional information.
The Seed Business assesses the payment/performance risk by assigning default rates based on the duration of the guarantees. These default rates are assigned based on the external credit rating of the counterparty or through internal credit analysis and historical default history for counterparties that do not have published credit ratings. For counterparties without an external rating or available credit history, a cumulative average default rate is used.
Litigation
The Seed Business is subject to various legal proceedings, including, but not limited to, product liability, intellectual property, antitrust, commercial, property damage, personal injury, environmental and regulatory matters arising out of the normal course of its current businesses. It is not possible to predict the outcome of these various proceedings, as considerable uncertainty exists. The Seed Business records accruals for legal matters when the information available indicates that it is probable that a liability has been incurred and the amount of the loss can be reasonably estimated. Accruals may reflect the impact and status of negotiations, settlements, rulings, advice from counsel and other information and events that may pertain to a particular matter. For the litigation matters discussed below, management believes that it is reasonably possible that the Seed Business could incur liabilities in excess of amounts accrued, for which the ultimate liability could be material to the results of operations and the cash flows in the period recognized. However, the Seed Business is unable to estimate the possible loss beyond amounts accrued due to various reasons, including, among others, that the underlying matters are either in early stages and/or have significant factual issues to be resolved. In addition, even when the Seed Business believes it has substantial defenses, the company may consider settlement of matters if it believes it is in the best interest of the Company. At March 31, 2026, December 31, 2025 and March 31, 2025, current accrued litigation was $77 million, $598 million and $9 million, respectively, within accrued and other current liabilities. The balance at March 31, 2026 and December 31, 2025 was comprised primarily of the Bayer resolution payment discussed in the section entitled "Bayer Dispute."
Bayer Dispute
In August 2022, Bayer filed a breach of contract/declaratory judgment lawsuit in Delaware state court against Corteva relating to an agrobacterium cross-license agreement and Enlist E3® soybeans. Bayer alleged that Corteva practiced two Bayer patents in developing Enlist E3® soybeans, and therefore, is entitled pursuant to the terms of the cross-license agreement to royalties for sales between 2019 through 2029, along with interest. In January 2025, the court issued several rulings precluding Corteva's invalidity and inequitable conduct defenses, while also aligning on key aspects of Corteva's patent claim construction. In May 2025, the Delaware state court granted Corteva’s motion for partial summary judgment agreeing that U.S. Supreme Court precedent precludes the collection of royalties after patent expiration. Bayer’s motion for reconsideration was denied in June 2025. In July 2025, a stipulated order allowed Bayer to appeal the summary judgment finding, while also allowing Corteva’s cross-appeal of the dismissal of its invalidity and inequitable conduct defenses.
In August 2022, Corteva filed a lawsuit against Bayer CropScience LLP and Monsanto Company (collectively “Bayer”) in federal court in Delaware for alleged infringement of Corteva’s patented AAD-1 herbicide resistance technology used in Enlist® corn. The complaint for this lawsuit was amended to include additional patents that are closely related to this patented technology for soybeans. Corteva seeks to enjoin Bayer from continuing to infringe, as well as appropriate monetary damages. Bayer has filed an answer to the complaint and has asserted various affirmative defenses including invalidity. In August 2023, the court issued a decision adopting Corteva’s claim construction for all five disputed patent terms subject to this litigation.
In December 2023, the Patent Trial and Appeal Board (“PTAB”) authorized an Inter Partes Review (“IPR”) proceeding initiated by Bayer to review the patentability of three patents subject to the AAD-1 litigation. Inari joined the IPR proceeding. In December 2024, the PTAB issued a decision invalidating these patents on the basis they were unpatentable. Corteva appealed this decision and Corteva's AAD-1 lawsuit remains stayed during pendency of the IPR appeal. Corteva holds numerous additional patents covering its Enlist® traits or Enlist® weed control system. Therefore, the IPR process is not expected to impact its ability to license and protect Enlist E3® traits.
In October 2022, Corteva filed a lawsuit against Bayer in Delaware state court seeking a declaration that, under the terms of Corteva’s licensing agreement and the law, Bayer is not entitled to collect patent royalties on the Roundup Ready® Corn 2 trait after Bayer’s U.S. patent protection expires, and therefore is no longer required to pay royalties under the licensing agreement and entitled to recover relevant royalties paid. In September 2024, the court granted Bayer’s motion for summary judgment. Corteva’s appeal was heard by the Delaware Supreme Court, en banc, in May 2025. Additionally, Corteva initiated arbitration of two additional agreements with Bayer seeking similar relief. The Delaware Supreme Court stayed the appeal proceedings pending resolution discussions between Corteva and Bayer.
As of January 2026, the parties agreed to settle the agrobacterium cross-license agreement dispute. In addition, Corteva and Bayer resolved several other disputes regarding post-patent royalties and other matters, including post-patent regulatory support, resulting in the termination or amendment of the related licenses, as applicable. As part of the resolution of these matters, the cross-license agreement has been terminated and Corteva agreed to drop its AAD-1 patent claims against Bayer, as well as a payment of $610 million of which approximately $546 million was paid through the first quarter of 2026 and the remainder due by September 15, 2026. Also as a result of the resolution of this litigation and the related license terminations and amendments, potential royalty obligations for Corteva's Enlist E3® soybeans, as well as future royalty payments due to Bayer under other licensing agreements in dispute were terminated. The settlement agreements support Corteva's product out-licensing growth in competitive corn, cotton and canola markets, including for the out-licensing of above and below ground triple-stack corn technology. In conjunction with resolution of these matters, the companies also agreed to new cotton licensing arrangements at terms reflective of market rates. There is no remaining litigation between the parties.
Environmental
Accruals for environmental matters are recorded when it is probable that a liability has been incurred and the amount of the liability can be reasonably estimated based on current law and existing technologies. These obligations are included in accrued and other current liabilities and other noncurrent obligations in the interim Combined Balance Sheets. It is reasonably possible that environmental remediation and restoration costs in excess of amounts accrued could have a material impact on the Company’s results of operations, financial condition and cash flows. Inherent uncertainties exist in these estimates primarily due to unknown conditions, changing governmental regulations and legal standards regarding liability, and emerging remediation technologies for handling site remediation and restoration. At March 31, 2026, December 31, 2025 and March 31, 2025, the Seed Business’ accruals for environmental remediation obligations were $39 million, $42 million and $51 million, respectively, substantially all of which relates to the AltEn Facility matter.
Nebraska Department of Environment and Energy, AltEn Facility
The EPA and the Nebraska Department of Environment and Energy (“NDEE”) are pursuing investigations, response and removal actions, litigation and enforcement action related to an ethanol plant located near Mead, Nebraska that is owned and operated by AltEn LLC (“AltEn”). The agencies have alleged violations under the Resource Conservation and Recovery Act (“RCRA”) and other federal and state laws stemming from AltEn’s lack of compliance with the terms and conditions of its operating permits and other regulatory requirements. Corteva’s Seed Business is one of six seed companies, who were customers of AltEn (collectively, the "Facility Response Group"), participating in the NDEE’s Voluntary Cleanup Program to address certain interim remediation needs at the site. In March 2025, the Facility Response Group reached an agreement to settle its lawsuit against AltEn and certain of its affiliates to preserve certain contractual and common law indemnification claims. The settlement agreement, among other things, limits AltEn’s ability to dispose of the property or take any adverse action with respect to its property or assets. As of March 31, 2026, an accrual was established for Corteva’s estimated voluntary contribution to the solid waste and wastewater remedial action plans for the AltEn location.
NOTE 12 — ACCUMULATED OTHER COMPREHENSIVE INCOME (LOSS)
Other Comprehensive Income (Loss)
The changes and after-tax balances of components comprising accumulated other comprehensive income (loss) are summarized below:
|
|
|
|
|
|
|
|
|
|
|
|
|
|
|
|
|
|
|
|
|
|
|
|
|
(In millions) |
Cumulative Translation Adjustment |
|
Derivative Instruments |
|
Pension Benefit Plans |
|
Other Benefit Plans |
|
Unrealized Gain (Loss) on Investments |
|
Total |
|
2025 |
|
|
|
|
|
|
|
|
|
|
|
|
|
|
|
|
|
|
Balance at January 1, 2025 |
|
$ |
(1,532 |
) |
|
$ |
(49 |
) |
|
$ |
15 |
|
|
$ |
21 |
|
|
$ |
— |
|
|
$ |
(1,545 |
) |
Other comprehensive income (loss) before reclassifications |
|
|
(31 |
) |
|
|
2 |
|
|
|
1 |
|
|
|
— |
|
|
|
— |
|
|
|
(28 |
) |
Amounts reclassified from accumulated other comprehensive income (loss) |
|
|
— |
|
|
|
15 |
|
|
|
— |
|
|
|
— |
|
|
|
— |
|
|
|
15 |
|
Net other comprehensive income (loss) |
|
|
(31 |
) |
|
|
17 |
|
|
|
1 |
|
|
|
— |
|
|
|
— |
|
|
|
(13 |
) |
Balance at March 31, 2025 |
|
$ |
(1,563 |
) |
|
$ |
(32 |
) |
|
$ |
16 |
|
|
$ |
21 |
|
|
$ |
— |
|
|
$ |
(1,558 |
) |
2026 |
|
|
|
|
|
|
|
|
|
|
|
|
|
|
|
|
|
|
Balance at January 1, 2026 |
|
$ |
(1,314 |
) |
|
$ |
9 |
|
|
$ |
23 |
|
|
$ |
17 |
|
|
$ |
— |
|
|
$ |
(1,265 |
) |
Other comprehensive income (loss) before reclassifications |
|
|
(37 |
) |
|
|
21 |
|
|
|
(2 |
) |
|
|
— |
|
|
|
— |
|
|
|
(18 |
) |
Amounts reclassified from accumulated other comprehensive income (loss) |
|
|
— |
|
|
|
3 |
|
|
|
(1 |
) |
|
|
— |
|
|
|
— |
|
|
|
2 |
|
Net other comprehensive income (loss) |
|
|
(37 |
) |
|
|
24 |
|
|
|
(3 |
) |
|
|
— |
|
|
|
— |
|
|
|
(16 |
) |
Balance at March 31, 2026 |
|
$ |
(1,351 |
) |
|
$ |
33 |
|
|
$ |
20 |
|
|
$ |
17 |
|
|
$ |
— |
|
|
$ |
(1,281 |
) |
The tax (expense) benefit on the net activity related to each component of other comprehensive income (loss) was as follows:
|
|
|
|
|
|
|
|
|
|
Three Months Ended March 31, |
|
(In millions) |
2026 |
|
2025 |
|
Derivative instruments |
|
$ |
(6 |
) |
|
$ |
(4 |
) |
Pension benefit plans - net |
|
|
(1 |
) |
|
|
1 |
|
Other benefit plans - net |
|
|
— |
|
|
|
— |
|
Unrealized gains (losses) on investments |
|
|
— |
|
|
|
— |
|
(Provision for) benefit from income taxes related to other comprehensive income (loss) items |
|
$ |
(7 |
) |
|
$ |
(3 |
) |
A summary of the reclassifications out of accumulated other comprehensive income (loss) is provided as follows:
|
|
|
|
|
|
|
|
|
|
Three Months Ended March 31, |
|
(In millions) |
2026 |
|
2025 |
|
Derivative instruments 1: |
|
$ |
3 |
|
|
$ |
19 |
|
Tax (benefit) expense 2 |
|
|
— |
|
|
|
(4 |
) |
After-tax |
|
|
3 |
|
|
|
15 |
|
Amortization of pension benefit plans: |
|
|
|
|
|
|
Prior service (benefit) cost 3,4 |
|
|
— |
|
|
|
— |
|
Actuarial (gains) losses 3,4 |
|
|
(1 |
) |
|
|
(1 |
) |
Settlement (gain) loss 3,4 |
|
|
— |
|
|
|
— |
|
Total before tax |
|
|
(1 |
) |
|
|
(1 |
) |
Tax (benefit) expense 2 |
|
|
— |
|
|
|
1 |
|
After-tax |
|
$ |
(1 |
) |
|
$ |
— |
|
Amortization of other benefit plans: |
|
|
|
|
|
|
Prior service (benefit) cost 3,4 |
|
|
— |
|
|
|
— |
|
Actuarial (gains) losses 3,4 |
|
|
— |
|
|
|
— |
|
Settlement (gain) loss 3,4 |
|
|
— |
|
|
|
— |
|
Total before tax |
|
|
— |
|
|
|
— |
|
Tax (benefit) expense 2 |
|
|
— |
|
|
|
— |
|
After-tax |
|
|
— |
|
|
|
— |
|
Total reclassifications for the period, after-tax |
|
$ |
2 |
|
|
$ |
15 |
|
1.Reflected in cost of goods sold in the interim Combined Statements of Operations.
2.Reflected in provision for (benefit from) income taxes in the interim Combined Statements of Operations.
3.These accumulated other comprehensive income (loss) components are included in the computation of net periodic benefit (credit) cost of the Company's pension and other benefit plans. See Note 13 - Pension Plans and Other Post Employment Benefits, to the interim Combined Financial Statements, for additional information.
4.Reflected in other income (expense) - net in the interim Combined Statements of Operations.
NOTE 13 — PENSION PLANS AND OTHER POST EMPLOYMENT BENEFITS
The following sets forth the components of the Company's net periodic benefit (credit) cost for defined benefit pension plans and other post employment benefits ("OPEB"):
|
|
|
|
|
|
|
|
|
|
Three Months Ended March 31, |
|
(In millions) |
2026 |
|
2025 |
|
Defined Benefit Pension Plans: |
|
|
|
|
|
|
Service cost |
|
$ |
1 |
|
|
$ |
1 |
|
Interest cost |
|
|
7 |
|
|
|
7 |
|
Expected return on plan assets |
|
|
(6 |
) |
|
|
(4 |
) |
Amortization of unrecognized (gain) loss |
|
|
(1 |
) |
|
|
(1 |
) |
Net periodic benefit (credit) cost |
|
$ |
1 |
|
|
$ |
3 |
|
Other Post Employment Benefits: |
|
|
|
|
|
|
Interest cost |
|
|
1 |
|
|
|
1 |
|
Amortization of unrecognized (gain) loss |
|
|
— |
|
|
|
— |
|
Net periodic benefit (credit) cost |
|
$ |
1 |
|
|
$ |
1 |
|
NOTE 14 — FINANCIAL INSTRUMENTS
Time Deposits and Money Market Funds
At March 31, 2026, December 31, 2025 and March 31, 2025, the Company held investments in held-to-maturity securities at amortized cost, which approximates fair value.
The following table summarizes investments in time deposits and money market funds classified as held-to-maturity securities at March 31, 2026, December 31, 2025 and March 31, 2025:
|
|
|
|
|
|
|
|
|
|
|
|
|
|
|
Held-to-Maturity Securities |
Amortized Cost |
|
(in millions) |
Balance Sheet Location |
March 31, 2026 |
|
December 31, 2025 |
|
March 31, 2025 |
|
Time deposits and money market funds |
|
Cash equivalents 1 |
|
$ |
196 |
|
|
$ |
358 |
|
|
$ |
165 |
|
Time deposits |
|
Marketable securities 2 |
|
$ |
— |
|
|
$ |
— |
|
|
$ |
— |
|
1.Maturity at time of purchase was three months or less.
2.Maturity at time of purchase was more than three months to less than one year.
Derivative Instruments
Objectives and Strategies for Holding Derivative Instruments
In the ordinary course of business, the Seed Business enters into contractual arrangements (derivatives) to reduce its exposure to foreign currency and commodity price risks. The Seed Business has established a variety of derivative programs to be utilized for financial risk management. These programs reflect varying levels of exposure coverage and time horizons based on an assessment of risk.
Derivative programs have procedures and controls and are approved by Corteva’s Corporate Financial Risk Management Committee, consistent with its financial risk management policies and guidelines. Derivative instruments used are forwards, options, futures and swaps. The Seed Business has not designated any non-derivatives as hedging instruments.
The Seed Business’ financial risk management procedures also address counterparty credit approval, limits and routine exposure monitoring and reporting. The counterparties to these contractual arrangements are major financial institutions and major commodity exchanges, and multinational grain exporters. The Seed Business is exposed to credit loss in the event of nonperformance by these counterparties. The Seed Business utilizes collateral support annex agreements with certain counterparties to limit its exposure to credit losses. The Seed Business anticipates performance by counterparties to these contracts and therefore no material loss is expected. Market and counterparty credit risks associated with these instruments are regularly reported to management.
The aggregate notional amounts for the Seed Business’ derivative instruments (both designated and not designated) was a net buy (sell) position of $439 million, $904 million and $434 million at March 31, 2026, December 31, 2025 and March 31, 2025, respectively.
Foreign Currency Risk
Corteva’s objective in managing exposure to foreign currency fluctuations is to reduce earnings and cash flow volatility associated with foreign currency rate changes. Accordingly, Corteva enters into various contracts that change in value as foreign exchange rates change to protect the value of its existing foreign currency-denominated assets, liabilities, commitments and cash flows, including those of the Seed Business.
Through its participation in Corteva's hedging program, the Seed Business uses foreign currency exchange contracts to offset its net exposures, by currency, related to the foreign currency denominated monetary assets and liabilities of its operations. The primary business objective of this hedging program is to maintain an approximately balanced position in foreign currencies so that exchange gains and losses resulting from exchange rate changes, after related tax effects, are minimized. The Seed Business also uses foreign currency exchange contracts to offset a portion of the Seed Business’ exposure to certain forecasted transactions as well as the translation of foreign currency-denominated earnings. In addition, the Seed Business uses commodity contracts to offset risks associated with foreign currency devaluation in certain countries.
Since the hedging instruments mitigate combined Corteva exposures as opposed to assets, liabilities and cash flows attributed only to the Seed Business, the Seed Business has been allocated a pro rata share of the income statement activity related to these hedges.
Commodity Price Risk
Commodity price risk management programs serve to reduce exposure to price fluctuations on purchases of inventory such as corn and soybeans. The Seed Business enters into over-the-counter and exchange-traded derivative commodity instruments to hedge the commodity price risk associated with agricultural commodity exposures.
Derivatives Designated as Cash Flow Hedges
Commodity Contracts
The Seed Business enters into over-the-counter and exchange-traded derivative commodity instruments, including options, futures and swaps, to hedge the commodity price risk associated with agricultural commodity exposures.
While each risk management program has a different time maturity period, most programs currently do not extend beyond the next two years. Cash flow hedge results are reclassified into earnings during the same period in which the related exposure impacts earnings. Reclassifications are made sooner if it appears that a forecasted transaction is not probable of occurring.
The following table summarizes the after-tax effect of commodity contract cash flow hedges on accumulated other comprehensive income (loss):
|
|
|
|
|
|
|
|
|
|
Three Months Ended March 31, |
|
(In millions) |
2026 |
|
2025 |
|
Beginning balance |
|
$ |
9 |
|
|
$ |
(49 |
) |
Additions and revaluations of derivatives designated as cash flow hedges |
|
|
21 |
|
|
|
2 |
|
Clearance of hedge results to earnings |
|
|
3 |
|
|
|
15 |
|
Ending balance |
|
$ |
33 |
|
|
$ |
(32 |
) |
At March 31, 2026, an after-tax net gain of $8 million is expected to be reclassified from accumulated other comprehensive income (loss) into earnings over the next twelve months.
Derivatives not Designated in Hedging Relationships
Foreign Currency Contracts
Through its participation in Corteva’s hedging programs, the Seed Business uses foreign exchange contracts to reduce its net exposure, by currency, related to foreign currency-denominated monetary assets and liabilities of its operations so that exchange gains and losses resulting from exchange rate changes are minimized. The netting of such exposures precludes the use of hedge accounting; however, the required revaluation of the forward contracts and the associated foreign currency-denominated monetary assets and liabilities intends to achieve a minimal earnings impact, after taxes. The Seed Business also frequently uses foreign currency exchange contracts to offset a portion of the Seed Business’ exposure to the translation of certain foreign currency-denominated earnings so that gains and losses on the contracts offset changes in the USD value of the related foreign currency-denominated earnings over the relevant aggregate period. Since the hedging instruments mitigate combined Corteva exposures as opposed to assets, liabilities and cash flows attributed only to the Seed Business, the Seed Business has been allocated a pro rata share of the income statement activity related to these hedges.
Commodity Contracts
The Seed Business utilizes options, futures and swaps that are not designated as hedging instruments to reduce exposure to commodity price fluctuations on purchases of inventory such as corn and soybeans. The Company uses commodity contracts to offset a portion of the Company’s exposure to commodity price fluctuations so that gains and losses on the contracts offset changes in the commodity price over the relevant aggregate period. The Seed Business uses forward agreements, with durations of less than one year, to buy and sell USD-priced commodities in order to reduce its exposure to currency devaluation for a portion of its local currency cash balances. Counterparties to the forward sales agreements are multinational grain exporters and subject to the Seed Business’ financial risk management procedures.
Fair Value of Derivative Instruments
Asset and liability derivatives subject to an enforceable master netting arrangement with the same counterparty are presented on a net basis in the interim Combined Balance Sheets. The presentation of the Company's derivative assets and liabilities is as follows:
|
|
|
|
|
|
|
|
|
|
|
|
|
|
|
|
|
|
March 31, 2026 |
|
(In millions) |
Balance Sheet Location |
Gross |
|
Counterparty and Cash Collateral Netting 1 |
|
Net Amounts Included in the Interim Combined Balance Sheets |
|
Asset derivatives: |
|
|
|
|
|
|
|
|
|
|
|
Derivatives designated as hedging instruments: |
|
|
|
|
|
|
|
|
|
|
|
Commodity contracts |
|
Other current assets |
|
$ |
5 |
|
|
$ |
— |
|
|
$ |
5 |
|
Derivatives not designated as hedging instruments: |
|
|
|
|
|
|
|
|
|
|
|
Commodity contracts |
|
Other current assets |
|
|
1 |
|
|
|
— |
|
|
|
1 |
|
Total asset derivatives |
|
|
|
$ |
6 |
|
|
$ |
— |
|
|
$ |
6 |
|
|
|
|
|
|
|
|
|
|
|
|
|
Liability derivatives: |
|
|
|
|
|
|
|
|
|
|
|
Derivatives designated as hedging instruments: |
|
|
|
|
|
|
|
|
|
|
|
Commodity contracts |
|
Accrued and other current liabilities |
|
$ |
1 |
|
|
$ |
— |
|
|
$ |
1 |
|
Derivatives not designated as hedging instruments: |
|
|
|
|
|
|
|
|
|
|
|
Commodity contracts |
|
Accrued and other current liabilities |
|
|
1 |
|
|
|
— |
|
|
|
1 |
|
Total liability derivatives |
|
|
|
$ |
2 |
|
|
$ |
— |
|
|
$ |
2 |
|
|
|
|
|
|
|
|
|
|
|
|
|
|
|
|
|
|
|
December 31, 2025 |
|
(In millions) |
Balance Sheet Location |
Gross |
|
Counterparty and Cash Collateral Netting 1 |
|
Net Amounts Included in the Combined Balance Sheets |
|
Asset derivatives: |
|
|
|
|
|
|
|
|
|
|
|
Derivatives designated as hedging instruments: |
|
|
|
|
|
|
|
|
|
|
|
Commodity contracts |
|
Other current assets |
|
$ |
1 |
|
|
$ |
— |
|
|
$ |
1 |
|
Derivatives not designated as hedging instruments: |
|
|
|
|
|
|
|
|
|
|
|
Commodity contracts |
|
Other current assets |
|
|
1 |
|
|
|
— |
|
|
|
1 |
|
Total asset derivatives |
|
|
|
$ |
2 |
|
|
$ |
— |
|
|
$ |
2 |
|
|
|
|
|
|
|
|
|
|
|
|
|
Liability derivatives: |
|
|
|
|
|
|
|
|
|
|
|
Derivatives designated as hedging instruments: |
|
|
|
|
|
|
|
|
|
|
|
Commodity contracts |
|
Accrued and other current liabilities |
|
$ |
3 |
|
|
$ |
— |
|
|
$ |
3 |
|
Derivatives not designated as hedging instruments: |
|
|
|
|
|
|
|
|
|
|
|
Commodity contracts |
|
Accrued and other current liabilities |
|
|
4 |
|
|
|
— |
|
|
|
4 |
|
Total liability derivatives |
|
|
|
$ |
7 |
|
|
$ |
— |
|
|
$ |
7 |
|
|
|
|
|
|
|
|
|
|
|
|
|
|
|
|
|
|
|
March 31, 2025 |
|
(In millions) |
Balance Sheet Location |
Gross |
|
Counterparty and Cash Collateral Netting 1 |
|
Net Amounts Included in the Interim Combined Balance Sheets |
|
Asset derivatives: |
|
|
|
|
|
|
|
|
|
|
|
Derivatives designated as hedging instruments: |
|
|
|
|
|
|
|
|
|
|
|
Commodity contracts |
|
Other current assets |
|
$ |
2 |
|
|
$ |
— |
|
|
$ |
2 |
|
Derivatives not designated as hedging instruments: |
|
|
|
|
|
|
|
|
|
|
|
Commodity contracts |
|
Other current assets |
|
|
4 |
|
|
|
— |
|
|
|
4 |
|
Total asset derivatives |
|
|
|
$ |
6 |
|
|
$ |
— |
|
|
$ |
6 |
|
|
|
|
|
|
|
|
|
|
|
|
|
Liability derivatives: |
|
|
|
|
|
|
|
|
|
|
|
Derivatives designated as hedging instruments: |
|
|
|
|
|
|
|
|
|
|
|
Commodity contracts |
|
Accrued and other current liabilities |
|
$ |
2 |
|
|
$ |
— |
|
|
$ |
2 |
|
Derivatives not designated as hedging instruments: |
|
|
|
|
|
|
|
|
|
|
|
Commodity contracts |
|
Accrued and other current liabilities |
|
|
4 |
|
|
|
— |
|
|
|
4 |
|
Total liability derivatives |
|
|
|
$ |
6 |
|
|
$ |
— |
|
|
$ |
6 |
|
1.Counterparty and cash collateral amounts represent the estimated net settlement amount when applying netting and set-off rights included in master netting arrangements between the Company and its counterparties and the payable or receivable for cash collateral held or placed with the same counterparty.
Effect of Derivative Instruments
|
|
|
|
|
|
|
|
|
|
Amount of Gain (Loss) Recognized in OCI - Pre-Tax1 |
|
|
Three Months Ended March 31, |
|
(In millions) |
2026 |
|
2025 |
|
Derivatives designated as hedging instruments: |
|
|
|
|
|
|
Cash flow hedges: |
|
|
|
|
|
|
Commodity contracts |
|
$ |
27 |
|
|
$ |
2 |
|
Total derivatives designated as hedging instruments |
|
$ |
27 |
|
|
$ |
2 |
|
1. OCI is defined as other comprehensive income (loss).
|
|
|
|
|
|
|
|
|
|
Amount of Gain (Loss) Recognized in Income - Pre-Tax 1 |
|
|
Three Months Ended March 31, |
|
(In millions) |
2026 |
|
2025 |
|
Derivatives designated as hedging instruments: |
|
|
|
|
|
|
Cash flow hedges: |
|
|
|
|
|
|
Commodity contracts 2 |
|
$ |
(3 |
) |
|
$ |
(19 |
) |
Total derivatives designated as hedging instruments |
|
$ |
(3 |
) |
|
$ |
(19 |
) |
Derivatives not designated as hedging instruments: |
|
|
|
|
|
|
Foreign currency contracts 3 |
|
$ |
(43 |
) |
|
$ |
15 |
|
Foreign currency contracts 2 |
|
|
3 |
|
|
|
— |
|
Commodity contracts 2,4 |
|
|
8 |
|
|
|
7 |
|
Total derivatives not designated as hedging instruments |
|
$ |
(32 |
) |
|
$ |
22 |
|
Total derivatives |
|
$ |
(35 |
) |
|
$ |
3 |
|
1.For cash flow hedges, this represents the portion of the gain (loss) reclassified from accumulated OCI into income during the period.
2.Recorded in cost of goods sold in the interim Combined Statements of Operations.
3.Recognized in other income (expense) - net in the interim Combined Statements of Operations. Note that net gain (loss) from foreign currency contracts was partially offset by the related gain (loss) on the foreign currency-denominated monetary assets and liabilities of the Company's operations. See Note 5 - Supplementary Information, to the interim Combined Financial Statements, for additional information.
4.The net gain (loss) relating to commodity contracts that are not designated as hedging instruments that were recorded in cost of goods sold, in the interim Combined Statements of Operations, are mostly offset by the related net gain (loss) on third-party grower contracts denominated as liabilities.
NOTE 15 — FAIR VALUE MEASUREMENTS
The table below summarizes the basis used to measure certain assets and liabilities relating to marketable securities and derivative assets and liabilities at fair value on a recurring basis:
|
|
|
|
|
|
|
|
|
|
|
|
|
|
March 31, 2026 |
|
December 31, 2025 |
|
March 31, 2025 |
|
(In millions) |
Level 2 1 |
|
Level 2 1 |
|
Level 2 1 |
|
Assets at fair value: |
|
|
|
|
|
|
|
|
|
Debt securities: |
|
|
|
|
|
|
|
|
|
Foreign government bonds 2 |
|
$ |
1 |
|
|
$ |
1 |
|
|
$ |
2 |
|
Derivatives relating to: 3 |
|
|
|
|
|
|
|
|
|
Commodity contracts |
|
|
6 |
|
|
|
2 |
|
|
|
6 |
|
Total assets at fair value |
|
$ |
7 |
|
|
$ |
3 |
|
|
$ |
8 |
|
Liabilities at fair value: |
|
|
|
|
|
|
|
|
|
Derivatives relating to: 3 |
|
|
|
|
|
|
|
|
|
Commodity contracts |
|
|
2 |
|
|
|
7 |
|
|
|
6 |
|
Total liabilities at fair value |
|
$ |
2 |
|
|
$ |
7 |
|
|
$ |
6 |
|
1.Reflects significant other observable inputs.
2.Represents the Company's investments in debt securities that are classified as available-for-sale, which are included in marketable securities and other assets in the interim Combined Balance Sheets.
3.See Note 14 - Financial Instruments, to the interim Combined Financial Statements, for the classification of derivatives in the interim Combined Balance Sheets.
NOTE 16 — RELATED PATRIES
The Seed Business has historically operated as an operating segment of Corteva. Allocations of certain expenses for services from Corteva including, but not limited to, general corporate expenses related to finance, legal, information technology, human resources, ethics and compliance, shared services, employee benefits and incentives, insurance and stock-based compensation, are included in the interim Combined Financial Statements. These expenses have been allocated on a pro rata basis using net sales as a measure. The Seed Business and Corteva consider the basis on which the expenses have been allocated to be a reasonable reflection of the utilization of services provided. Management does not believe that it is practicable to estimate the expense the Seed Business would have incurred as
a stand-alone company. The amount of actual costs that may have been incurred if the Seed Business were a stand-alone company would depend on a number of factors, including the Seed Business’ chosen organizational structure, which functions were outsourced or performed by Seed Business employees, contract terms negotiated with third party providers, and strategic decisions made in areas such as information technology and infrastructure.
Corporate Expense Allocations
The Seed Business' interim Combined Financial Statements include an allocation of expenses incurred by Corteva for specified functions, primarily general corporate activities, delivered centrally. Such costs specifically identifiable to the Seed Business were first quantified, after which the allocation methodology was used.
The following corporate expense allocations are included in the interim Combined Statements of Operations:
|
|
|
|
|
|
|
|
|
|
Three Months Ended March 31, |
|
(In millions) |
2026 |
|
2025 |
|
Research and development expense |
|
$ |
— |
|
|
$ |
— |
|
Selling, general and administrative expenses |
|
|
17 |
|
|
|
16 |
|
Restructuring and asset related charges - net |
|
|
4 |
|
|
|
— |
|
Total |
|
$ |
21 |
|
|
$ |
16 |
|
Related Party Purchases
During the three months ended March 31, 2026 and 2025, the Seed Business purchased seed treatment products used in production from Corteva's Crop Protection operating segment in the amount of $71 million and $68 million, respectively. The Seed Business recognized the cost of such products in Cost of goods sold upon the sale of the treated seed to the customer. In preparing the Seed Business' interim Combined Financial Statements, it was determined that the steps necessary to bifurcate between intercompany payable balances that are settled routinely and those settled on an ad hoc basis, or not at all, were extensive in nature and would not result in a material impact to the accounts payable balances reported on the Seed Business' interim Combined Financial Statements. Therefore, all related party purchases were treated as those which are not settled in cash, which are recorded as equity transactions and included within the Net Parent investment amount in the interim Combined Balance Sheets.
Net Parent Investment
Net transfers between Corteva and the Seed Business are reflected within Net transfers to Parent in the interim Combined Statements of Cash Flows and the interim Combined Statements of Equity.
Transactions with Nonconsolidated Affiliates
The Seed Business holds investments in entities under the equity method ("nonconsolidated affiliates"). Such investments in nonconsolidated affiliates aggregated to $78 million, $75 million and $60 million at March 31, 2026, December 31, 2025 and March 31, 2025, respectively. Transactions during the periods consisted primarily of capital contributions to or distributions from the entities. The Seed Business held receivables from these nonconsolidated affiliates of $56 million, $63 million and $77 million at March 31, 2026, December 31, 2025 and March 31, 2025, respectively, and payables to these nonconsolidated affiliates of $1 million, $4 million and $— million at March 31, 2026, December 31, 2025 and March 31, 2025, respectively. See to Note 5 - Supplementary Information, to the interim Combined Financial Statements, for further details on equity earnings from these affiliates.
NOTE 17 — SEGMENT INFORMATION
The Seed Business’ operating segments reflect the manner in which its chief operating decision maker ("CODM") allocates resources and assesses performance, which is at the operating segment level (Americas and Rest of World). In April 2026, in anticipation of the proposed separation, the Seed Business is realigning its segment structure. As a result, the Seed Business consists of two operating segments: Americas and Rest of World. All periods presented have been adjusted to conform to the new segment reporting structure. The Seed Business’ CODM is the Executive Vice President, Seed Business Unit. The primary measure used by the Seed Business’ CODM for purposes of allocating resources to the segments and assessing segment performance is segment operating EBITDA.
Segment operating EBITDA is primarily utilized in the annual planning and monthly forecasting processes. On a monthly basis, the CODM considers variances between comparable prior year actual results and current year actual or forecasted results when evaluating the Seed Business’ success in delivering its innovative proprietary technology to farmers and monitoring of expected savings from cost
and productivity actions. The CODM also utilizes segment operating EBITDA when evaluating the impacts of market-driven trends on segment performance, such as input costs and inflationary and currency impacts.
The Seed Business defines segment operating EBITDA as earnings (loss) (i.e., income (loss) before income taxes) before interest, depreciation, amortization, research and development expense, corporate expenses, non-operating benefits (costs), foreign exchange gains (losses), and net unrealized gain or loss from mark-to-market activity for certain foreign currency derivative instruments that do not qualify for hedge accounting, excluding the impact of significant items and separation costs. Non-operating (benefits) costs consists of non-operating pension and other post-employment benefit (OPEB) credits (costs). Net unrealized gain or loss from mark-to-market activity for certain foreign currency derivative instruments that do not qualify for hedge accounting represents the non-cash net gain (loss) from changes in fair value of certain undesignated foreign currency derivative contracts. Upon settlement, which is within the same calendar year of execution of the contract, the realized gain (loss) from the changes in fair value of the non-qualified foreign currency derivative contracts will be reported in the respective segment results to reflect the economic effects of the foreign currency derivative contracts without the resulting unrealized mark to fair value volatility.
Corporate Profile
The Seed Business conducts its global operations through the following operating segments: Americas and Rest of World. The Company is a leader in many key seed markets, including North America corn and soybeans, Europe corn and sunflower, as well as Brazil, India, South Africa and Argentina corn
|
|
|
|
|
|
|
|
|
|
|
|
|
As of and for the Three Months Ended March 31,
(In millions) |
Americas |
|
Rest of World |
|
Total |
|
2026 |
|
|
|
|
|
|
|
|
|
Net sales |
|
$ |
1,994 |
|
|
$ |
1,029 |
|
|
$ |
3,023 |
|
Segment operating EBITDA |
|
|
832 |
|
|
|
355 |
|
|
|
1,187 |
|
Depreciation and amortization 1 |
|
|
141 |
|
|
|
37 |
|
|
|
178 |
|
Purchases of property, plant and equipment 2 |
|
|
25 |
|
|
|
6 |
|
|
|
31 |
|
|
|
|
|
|
|
|
|
|
|
2025 |
|
|
|
|
|
|
|
|
|
Net sales |
|
$ |
1,782 |
|
|
$ |
925 |
|
|
$ |
2,707 |
|
Segment operating EBITDA |
|
|
685 |
|
|
|
326 |
|
|
|
1,011 |
|
Depreciation and amortization 1 |
|
|
141 |
|
|
|
38 |
|
|
|
179 |
|
Purchases of property, plant and equipment 2 |
|
|
31 |
|
|
|
3 |
|
|
|
34 |
|
1.Depreciation and amortization excludes depreciation expense incurred by the research and development function, which amounted to $21 million and $19 million for the three months ended March 31, 2026 and 2025, respectively.
2.Purchases of property, plant and equipment excludes purchases made by the research and development function, which amounted to $17 million and $12 million for the three months ended March 31, 2026 and 2025, respectively.
Reconciliation of Segment Profitability
|
|
|
|
|
|
|
|
|
|
|
|
|
(In millions) |
Americas |
|
Rest of World |
|
Total |
|
For the Three Months Ended March 31, 2026 |
|
|
|
|
|
|
|
|
|
Net sales |
|
$ |
1,994 |
|
|
$ |
1,029 |
|
|
$ |
3,023 |
|
Cost of goods sold |
|
|
812 |
|
|
|
565 |
|
|
|
1,377 |
|
Other expenses 1 |
|
|
350 |
|
|
|
109 |
|
|
|
459 |
|
Segment operating EBITDA |
|
$ |
832 |
|
|
$ |
355 |
|
|
$ |
1,187 |
|
|
|
|
|
|
|
|
|
|
|
(In millions) |
Americas |
|
Rest of World |
|
Total |
|
For the Three Months Ended March 31, 2025 |
|
|
|
|
|
|
|
|
|
Net sales |
|
$ |
1,782 |
|
|
$ |
925 |
|
|
$ |
2,707 |
|
Cost of goods sold |
|
|
859 |
|
|
|
506 |
|
|
|
1,365 |
|
Other expenses 1 |
|
|
238 |
|
|
|
93 |
|
|
|
331 |
|
Segment operating EBITDA |
|
$ |
685 |
|
|
$ |
326 |
|
|
$ |
1,011 |
|
1. Other expenses consisted primarily of selling, general and administrative expenses, net of depreciation add-back.
Reconciliation to Interim Combined Financial Statements
|
|
|
|
|
|
|
|
|
Income (loss) after income taxes to segment operating EBITDA |
Three Months Ended March 31, |
|
(In millions) |
2026 |
|
2025 |
|
Net income (loss) |
|
$ |
503 |
|
|
$ |
398 |
|
Provision for (benefit from) income taxes |
|
|
150 |
|
|
|
136 |
|
Income (loss) before income taxes |
|
$ |
653 |
|
|
$ |
534 |
|
Depreciation and amortization |
|
|
199 |
|
|
|
198 |
|
Interest income |
|
|
(12 |
) |
|
|
(11 |
) |
Interest expense |
|
|
2 |
|
|
|
— |
|
Research and development expense, net of depreciation |
|
|
222 |
|
|
|
215 |
|
Exchange (gains) losses - net |
|
|
25 |
|
|
|
12 |
|
Non-operating (benefits) costs - net |
|
|
1 |
|
|
|
3 |
|
Mark-to-market (gains) losses on certain foreign currency contracts not designated as hedges |
|
|
(1 |
) |
|
|
5 |
|
Significant items |
|
|
30 |
|
|
|
39 |
|
Separation costs |
|
|
51 |
|
|
|
— |
|
Corporate expenses |
|
|
17 |
|
|
|
16 |
|
Segment operating EBITDA |
|
$ |
1,187 |
|
|
$ |
1,011 |
|
Significant Pre-tax (Charges) Benefits Not Included in Segment Operating EBITDA
The three months ended March 31, 2026 and 2025, respectively, included the following significant pre-tax (charges) benefits which are excluded from segment operating EBITDA:
|
|
|
|
|
|
|
|
|
|
|
|
|
|
|
|
|
(In millions) |
Americas |
|
Rest of World |
|
Corporate |
|
Total |
|
For the Three Months Ended March 31, 2026 |
|
|
|
|
|
|
|
|
|
|
|
|
Restructuring and asset related charges - net 1 |
|
$ |
— |
|
|
$ |
— |
|
|
$ |
(30 |
) |
|
$ |
(30 |
) |
Total |
|
$ |
— |
|
|
$ |
— |
|
|
$ |
(30 |
) |
|
$ |
(30 |
) |
|
|
|
|
|
|
|
|
|
|
|
|
|
(In millions) |
Americas |
|
Rest of World |
|
Corporate |
|
Total |
|
For the Three Months Ended March 31, 2025 |
|
|
|
|
|
|
|
|
|
|
|
|
Restructuring and asset related charges - net 1 |
|
$ |
(3 |
) |
|
$ |
— |
|
|
$ |
1 |
|
|
$ |
(2 |
) |
AltEn facility remediation charges 2 |
|
|
(37 |
) |
|
|
— |
|
|
|
— |
|
|
|
(37 |
) |
Total |
|
$ |
(40 |
) |
|
$ |
— |
|
|
$ |
1 |
|
|
$ |
(39 |
) |
1.Includes restructuring plans and asset related charges. See Note 4 - Restructuring and Asset Related Charges - Net, to the interim Combined Financial Statements, for additional information.
2.Relates to a charge to increase the remediation accrual at the AltEn facility relating to Corteva's estimated voluntary contribution to the solid waste and wastewater remedial action plans. See Note 12 - Commitments and Contingent Liabilities, to the interim Combined Financial Statements, for additional information.
NOTE 18 — SUBSEQUENT EVENTS
No recognizable subsequent events have occurred after March 31, 2026, but before May 6, 2026, which is the date the interim Consolidated Financial Statements of Corteva for the quarter ended March 31, 2026, from which these interim Combined Financial Statements are derived, were issued. In addition, no non-recognizable subsequent events were identified through June 29, 2026, the date these interim Combined Financial Statements were available for issuance.
Report of Independent Registered Public Accounting Firm
The change in operating segments of the Seed Business of Corteva, Inc. that occurred in April 2026, as described in Note 22 to the combined financial statements, has not been included in a set of financial statements prepared in accordance with accounting principles generally accepted in the United States of America (“U.S. GAAP”) covering a period in which the change occurred. Once a set of U.S. GAAP financial statements that reflect the new segments for the period in which the change occurred are issued, we will be in a position to furnish the following report.
/s/ PricewaterhouseCoopers LLP
Philadelphia, Pennsylvania
April 16, 2026
“Report of Independent Registered Public Accounting Firm
To the Board of Directors and Stockholders of Corteva, Inc.
Opinion on the Financial Statements
We have audited the accompanying combined balance sheets of the Seed Business of Corteva, Inc. (the “Company”) as of December 31, 2025 and 2024, and the related combined statements of operations, comprehensive income, equity and cash flows for each of the three years in the period ended December 31, 2025, including the related notes and schedule of valuation and qualifying accounts for each of the three years in the period ended December 31, 2025 listed in the index to the financial statements (collectively referred to as the “combined financial statements”). In our opinion, the combined financial statements present fairly, in all material respects, the financial position of the Company as of December 31, 2025 and 2024, and the results of its operations and its cash flows for each of the three years in the period ended December 31, 2025 in conformity with accounting principles generally accepted in the United States of America.
Basis for Opinion
These combined financial statements are the responsibility of the Company’s management. Our responsibility is to express an opinion on the Company’s combined financial statements based on our audits. We are a public accounting firm registered with the Public Company Accounting Oversight Board (United States) (PCAOB) and are required to be independent with respect to the Company in accordance with the U.S. federal securities laws and the applicable rules and regulations of the Securities and Exchange Commission and the PCAOB.
We conducted our audits of these combined financial statements in accordance with the standards of the PCAOB and in accordance with auditing standards generally accepted in the United States of America. Those standards require that we plan and perform the audits to obtain reasonable assurance about whether the combined financial statements are free of material misstatement, whether due to error or fraud.
Our audits included performing procedures to assess the risks of material misstatement of the combined financial statements, whether due to error or fraud, and performing procedures that respond to those risks. Such procedures included examining, on a test basis, evidence regarding the amounts and disclosures in the combined financial statements. Our audits also included evaluating the accounting principles used and significant estimates made by management, as well as evaluating the overall presentation of the combined financial statements. We believe that our audits provide a reasonable basis for our opinion.
Critical Audit Matters
The critical audit matter communicated below is a matter arising from the current period audit of the combined financial statements that was communicated or required to be communicated to the audit committee and that (i) relates to accounts or disclosures that are material to the combined financial statements and (ii) involved our especially challenging, subjective, or complex judgments. The communication of critical audit matters does not alter in any way our opinion on the combined financial statements, taken as a whole, and we are not, by communicating the critical audit matter below, providing a separate opinion on the critical audit matter or on the accounts or disclosures to which it relates.
Revenue Recognition - Product Sales
As described in Notes 2 and 4 to the combined financial statements, net sales were $9.898 billion for the year ended December 31, 2025. Substantially all of the Company’s revenue is derived from product sales. Revenue from product sales is recognized when the customer obtains control of the product, which occurs at a point in time according to shipping terms. The transaction price includes estimates of variable consideration, such as rights of return, rebates, and discounts, that are reductions in revenue. All estimates are based on the Company's historical experience, anticipated performance, and management’s best judgment at the time the estimate is made. Estimates of variable consideration included in the transaction price primarily utilize the expected value method based on historical experience. These estimates are reassessed each reporting period and are included in the transaction price to the extent it is probable that a significant reversal of cumulative revenue recognized will not occur upon resolution of uncertainty associated with the variable consideration. Nearly all contracts have a single performance obligation satisfied at a point in time and the transaction price is stated in the contract, usually as quantity times price per unit.
The principal consideration for our determination that performing procedures relating to revenue recognition for product sales is a critical audit matter is a high degree of auditor effort in performing procedures related to the Company’s revenue recognition.
Addressing the matter involved performing procedures and evaluating audit evidence in connection with forming our overall opinion on the combined financial statements. These procedures included, among others (i) testing revenue recognized for a sample of revenue transactions by obtaining and inspecting source documents, such as purchase orders, invoices, proof of shipment or delivery documents, and cash receipts, as applicable; (ii) testing, on a sample basis, the recognition of variable consideration for rebates issued and discounts granted during the year by obtaining and inspecting source documents, such as support for the nature of the variable consideration, amount, and agreement with the customer; and (iii) confirming a sample of outstanding customer invoice balances as of year-end, and, for confirmations not returned, obtaining and inspecting source documents, such as invoices, proof of shipment or delivery documents, and subsequent cash receipts, as applicable.
Philadelphia, Pennsylvania
April 16, 2026, except for the change in composition of reportable segments described in Note 22 to the combined financial statements, as to which the date is ______
We have served as the Company's auditor since 2025.”
The Seed Business
Combined Statements of Operations
|
|
|
|
|
|
|
|
|
|
|
|
|
|
For the Year Ended December 31, |
|
(In millions) |
2025 |
|
2024 |
|
2023 |
|
Net sales |
|
$ |
9,898 |
|
|
$ |
9,545 |
|
|
$ |
9,472 |
|
Cost of goods sold |
|
|
4,711 |
|
|
|
4,944 |
|
|
|
5,153 |
|
Research and development expense |
|
|
995 |
|
|
|
915 |
|
|
|
842 |
|
Selling, general and administrative expenses |
|
|
2,102 |
|
|
|
1,909 |
|
|
|
1,877 |
|
Amortization of intangibles |
|
|
489 |
|
|
|
525 |
|
|
|
538 |
|
Restructuring and asset related charges - net |
|
|
4 |
|
|
|
70 |
|
|
|
98 |
|
Separation costs |
|
|
35 |
|
|
|
— |
|
|
|
— |
|
Other income (expense) - net |
|
|
(712 |
) |
|
|
(64 |
) |
|
|
(12 |
) |
Interest expense |
|
|
5 |
|
|
|
2 |
|
|
|
1 |
|
Income (loss) before income taxes |
|
$ |
845 |
|
|
$ |
1,116 |
|
|
$ |
951 |
|
Provision for (benefit from) income taxes |
|
|
270 |
|
|
|
342 |
|
|
|
297 |
|
Net income (loss) |
|
$ |
575 |
|
|
$ |
774 |
|
|
$ |
654 |
|
Net income (loss) attributable to noncontrolling interests |
|
|
1 |
|
|
|
2 |
|
|
|
2 |
|
Net income (loss) attributable to the Seed Business |
|
$ |
574 |
|
|
$ |
772 |
|
|
$ |
652 |
|
See Notes to the Combined Financial Statements
The Seed Business
Combined Statements of Comprehensive Income
|
|
|
|
|
|
|
|
|
|
|
|
|
|
For the Year Ended December 31, |
|
(In millions) |
2025 |
|
2024 |
|
2023 |
|
Net income (loss) |
|
$ |
575 |
|
|
$ |
774 |
|
|
$ |
654 |
|
Other comprehensive income (loss) - net of tax: |
|
|
|
|
|
|
|
|
|
Cumulative translation adjustments |
|
|
218 |
|
|
|
(433 |
) |
|
|
195 |
|
Adjustments to pension benefit plans |
|
|
8 |
|
|
|
4 |
|
|
|
(12 |
) |
Adjustments to other benefit plans |
|
|
(4 |
) |
|
|
6 |
|
|
|
2 |
|
Unrealized gain (loss) on investments |
|
|
— |
|
|
|
— |
|
|
|
— |
|
Derivative instruments |
|
|
58 |
|
|
|
22 |
|
|
|
(126 |
) |
Total other comprehensive income (loss) |
|
|
280 |
|
|
|
(401 |
) |
|
|
59 |
|
Comprehensive income (loss) |
|
|
855 |
|
|
|
373 |
|
|
|
713 |
|
Comprehensive income (loss) attributable to noncontrolling interests - net of tax |
|
|
1 |
|
|
|
2 |
|
|
|
2 |
|
Comprehensive income (loss) attributable to the Seed Business |
|
$ |
854 |
|
|
$ |
371 |
|
|
$ |
711 |
|
See Notes to the Combined Financial Statements
The Seed Business
Combined Balance Sheets
|
|
|
|
|
|
|
|
|
(In millions) |
December 31, 2025 |
|
December 31, 2024 |
|
Assets |
|
|
|
|
|
|
Current assets |
|
|
|
|
|
|
Cash and cash equivalents |
|
$ |
835 |
|
|
$ |
592 |
|
Marketable securities |
|
|
1 |
|
|
|
7 |
|
Accounts and notes receivable - net |
|
|
1,854 |
|
|
|
1,804 |
|
Inventories |
|
|
3,338 |
|
|
|
3,204 |
|
Other current assets |
|
|
186 |
|
|
|
225 |
|
Total current assets |
|
$ |
6,214 |
|
|
$ |
5,832 |
|
Investment in nonconsolidated affiliates |
|
|
75 |
|
|
|
59 |
|
Property, plant and equipment |
|
|
4,463 |
|
|
|
4,059 |
|
Less: Accumulated depreciation |
|
|
(2,002 |
) |
|
|
(1,715 |
) |
Net property, plant and equipment |
|
|
2,461 |
|
|
|
2,344 |
|
Goodwill |
|
|
5,312 |
|
|
|
5,326 |
|
Other intangible assets |
|
|
7,265 |
|
|
|
7,719 |
|
Deferred income taxes |
|
|
72 |
|
|
|
58 |
|
Other assets |
|
|
620 |
|
|
|
631 |
|
Total Assets |
|
$ |
22,019 |
|
|
$ |
21,969 |
|
Liabilities and Equity |
|
|
|
|
|
|
Current liabilities |
|
|
|
|
|
|
Short-term borrowings and finance lease obligations |
|
$ |
112 |
|
|
$ |
15 |
|
Accounts payable |
|
|
2,140 |
|
|
|
1,992 |
|
Income taxes payable |
|
|
74 |
|
|
|
82 |
|
Deferred revenue |
|
|
3,232 |
|
|
|
2,902 |
|
Accrued and other current liabilities |
|
|
1,691 |
|
|
|
933 |
|
Total current liabilities |
|
$ |
7,249 |
|
|
$ |
5,924 |
|
Long-term debt |
|
|
— |
|
|
|
— |
|
Other noncurrent liabilities |
|
|
|
|
|
|
Deferred income tax liabilities |
|
|
826 |
|
|
|
996 |
|
Pension and other post-employment benefits |
|
|
226 |
|
|
|
224 |
|
Other noncurrent obligations |
|
|
480 |
|
|
|
498 |
|
Total noncurrent liabilities |
|
$ |
1,532 |
|
|
$ |
1,718 |
|
Commitments and contingent liabilities |
|
|
|
|
|
|
Equity |
|
|
|
|
|
|
Net Parent investment |
|
|
14,499 |
|
|
|
15,869 |
|
Accumulated other comprehensive income (loss) |
|
|
(1,265 |
) |
|
|
(1,545 |
) |
Total Seed Business equity |
|
$ |
13,234 |
|
|
$ |
14,324 |
|
Noncontrolling interests |
|
|
4 |
|
|
|
3 |
|
Total equity |
|
$ |
13,238 |
|
|
$ |
14,327 |
|
Total Liabilities and Equity |
|
$ |
22,019 |
|
|
$ |
21,969 |
|
See Notes to the Combined Financial Statements
The Seed Business
Combined Statements of Cash Flows
|
|
|
|
|
|
|
|
|
|
|
|
|
|
For the Year Ended December 31, |
|
(In millions) |
2025 |
|
2024 |
|
2023 |
|
Operating activities |
|
|
|
|
|
|
|
|
|
Net income (loss) |
|
$ |
575 |
|
|
$ |
774 |
|
|
$ |
654 |
|
Adjustments to reconcile net income (loss) to net cash provided by (used for) operating activities: |
|
|
|
|
|
|
|
|
|
Depreciation and amortization |
|
|
806 |
|
|
|
829 |
|
|
|
832 |
|
Provision for (benefit from) deferred income tax |
|
|
(211 |
) |
|
|
(213 |
) |
|
|
(239 |
) |
Net periodic pension and OPEB (benefit) cost, net |
|
|
15 |
|
|
|
13 |
|
|
|
17 |
|
Pension and OPEB contributions |
|
|
(26 |
) |
|
|
(27 |
) |
|
|
(29 |
) |
Net (gain) loss on sales of property, businesses, consolidated companies and investments |
|
|
(2 |
) |
|
|
(6 |
) |
|
|
(7 |
) |
Restructuring and asset related charges – net |
|
|
4 |
|
|
|
70 |
|
|
|
98 |
|
Other net loss |
|
|
210 |
|
|
|
202 |
|
|
|
(4 |
) |
Changes in assets and liabilities, net |
|
|
|
|
|
|
|
|
|
Accounts and notes receivable |
|
|
30 |
|
|
|
(235 |
) |
|
|
11 |
|
Inventories |
|
|
(28 |
) |
|
|
690 |
|
|
|
(85 |
) |
Accounts payable |
|
|
104 |
|
|
|
(152 |
) |
|
|
(324 |
) |
Deferred revenue |
|
|
314 |
|
|
|
(11 |
) |
|
|
(80 |
) |
Other assets and liabilities |
|
|
715 |
|
|
|
(157 |
) |
|
|
(112 |
) |
Cash provided by (used for) operating activities |
|
|
2,506 |
|
|
|
1,777 |
|
|
|
732 |
|
Investing activities |
|
|
|
|
|
|
|
|
|
Capital expenditures |
|
|
(346 |
) |
|
|
(338 |
) |
|
|
(303 |
) |
Proceeds from sales of property, businesses and consolidated companies - net of cash divested |
|
|
13 |
|
|
|
8 |
|
|
|
18 |
|
Investments in and loans to nonconsolidated affiliates |
|
|
(11 |
) |
|
|
(7 |
) |
|
|
— |
|
Purchases of investments |
|
|
— |
|
|
|
(21 |
) |
|
|
(34 |
) |
Proceeds from sales and maturities of investments |
|
|
8 |
|
|
|
24 |
|
|
|
64 |
|
Other investing activities, net |
|
|
(16 |
) |
|
|
(28 |
) |
|
|
(4 |
) |
Cash provided by (used for) investing activities |
|
|
(352 |
) |
|
|
(362 |
) |
|
|
(259 |
) |
Financing activities |
|
|
|
|
|
|
|
|
|
Proceeds from debt |
|
|
112 |
|
|
|
— |
|
|
|
— |
|
Payments on debt |
|
|
(14 |
) |
|
|
— |
|
|
|
— |
|
Net transfers to Parent |
|
|
(2,042 |
) |
|
|
(1,382 |
) |
|
|
(569 |
) |
Other financing activities, net |
|
|
(1 |
) |
|
|
(1 |
) |
|
|
(1 |
) |
Cash provided by (used for) financing activities |
|
|
(1,945 |
) |
|
|
(1,383 |
) |
|
|
(570 |
) |
Effect of exchange rate changes on cash and cash equivalents |
|
|
34 |
|
|
|
(70 |
) |
|
|
(43 |
) |
Increase (decrease) in cash and cash equivalents |
|
|
243 |
|
|
|
(38 |
) |
|
|
(140 |
) |
Cash and cash equivalents at beginning of period |
|
|
592 |
|
|
|
630 |
|
|
|
770 |
|
Cash and cash equivalents at end of period |
|
$ |
835 |
|
|
$ |
592 |
|
|
$ |
630 |
|
Supplemental cash flow information |
|
|
|
|
|
|
|
|
|
Cash paid during the period for: |
|
|
|
|
|
|
|
|
|
Interest, net of amounts capitalized |
|
$ |
2 |
|
|
$ |
— |
|
|
$ |
— |
|
Income taxes |
|
$ |
235 |
|
|
$ |
155 |
|
|
$ |
118 |
|
See Notes to the Combined Financial Statements
The Seed Business
Combined Statements of Equity
|
|
|
|
|
|
|
|
|
|
|
|
|
|
|
|
|
|
|
|
|
(In millions) |
|
Net Parent
Investment |
|
|
Accumulated
Other
Comprehensive
Income (Loss) |
|
|
Total Corteva Net Investment |
|
|
Non-controlling
Interests |
|
|
Total
Equity |
|
Balance at January 1, 2023 |
|
$ |
16,284 |
|
|
$ |
(1,203 |
) |
|
$ |
15,081 |
|
|
$ |
1 |
|
|
$ |
15,082 |
|
Net income (loss) |
|
|
652 |
|
|
|
|
|
|
652 |
|
|
|
2 |
|
|
|
654 |
|
Other comprehensive income (loss) |
|
|
|
|
|
59 |
|
|
|
59 |
|
|
|
|
|
|
59 |
|
Share-based compensation |
|
|
30 |
|
|
|
|
|
|
30 |
|
|
|
|
|
|
30 |
|
Net transfers to Parent |
|
|
(590 |
) |
|
|
|
|
|
(590 |
) |
|
|
|
|
|
(590 |
) |
Other - net |
|
|
|
|
|
|
|
|
— |
|
|
|
|
|
|
— |
|
Balance at December 31, 2023 |
|
$ |
16,376 |
|
|
$ |
(1,144 |
) |
|
$ |
15,232 |
|
|
$ |
3 |
|
|
$ |
15,235 |
|
Net income (loss) |
|
|
772 |
|
|
|
|
|
|
772 |
|
|
|
2 |
|
|
|
774 |
|
Other comprehensive income (loss) |
|
|
|
|
|
(401 |
) |
|
|
(401 |
) |
|
|
|
|
|
(401 |
) |
Share-based compensation |
|
|
34 |
|
|
|
|
|
|
34 |
|
|
|
|
|
|
34 |
|
Net transfers to Parent |
|
|
(1,313 |
) |
|
|
|
|
|
(1,313 |
) |
|
|
|
|
|
(1,313 |
) |
Other - net |
|
|
|
|
|
|
|
|
|
|
|
(2 |
) |
|
|
(2 |
) |
Balance at December 31, 2024 |
|
$ |
15,869 |
|
|
$ |
(1,545 |
) |
|
$ |
14,324 |
|
|
$ |
3 |
|
|
$ |
14,327 |
|
Net income (loss) |
|
|
574 |
|
|
|
|
|
|
574 |
|
|
|
1 |
|
|
|
575 |
|
Other comprehensive income (loss) |
|
|
|
|
|
280 |
|
|
|
280 |
|
|
|
|
|
|
280 |
|
Share-based compensation |
|
|
42 |
|
|
|
|
|
|
42 |
|
|
|
|
|
|
42 |
|
Net transfers to Parent |
|
|
(1,986 |
) |
|
|
|
|
|
(1,986 |
) |
|
|
|
|
|
(1,986 |
) |
Other - net |
|
|
|
|
|
|
|
|
— |
|
|
|
|
|
|
— |
|
Balance at December 31, 2025 |
|
$ |
14,499 |
|
|
$ |
(1,265 |
) |
|
$ |
13,234 |
|
|
$ |
4 |
|
|
$ |
13,238 |
|
See Notes to the Combined Financial Statements
NOTE 1 — DESCRIPTION OF THE BUSINESS AND BASIS OF PRESENTATION
The accompanying Combined Financial Statements present the combined results of operations, financial position and cash flows of the Seed business (the “Seed Business” or the "Company") of Corteva, Inc. (“Corteva” or “Parent”). The Seed Business is a global leader in developing and supplying commercial seed combining advanced germplasm and traits that offer maximum yield potential for farmers around the world. It is a leader in many key seed markets, including North America corn and soybeans, Europe corn and sunflower, as well as Brazil, India, South Africa and Argentina corn. The Company offers trait technologies that improve resistance to weather, disease, insects, herbicides used to control weeds and enhance food and nutritional characteristics, and digital solutions that assist decision-making to help maximize farmer yield and profitability. As a separate company, the Seed Business plans to grow through opportunities in gene editing, biofuels, hybrid wheat, expanded crop offerings, and mergers and acquisitions.
On October 1, 2025, Corteva announced its intention to pursue, subject to the approval of the Corteva Board of Directors and any required regulatory approvals, its separation into two independent publicly traded companies - one comprising its current Crop Protection business ("New Corteva") and the other comprising its current Seed business (“SpinCo” or "the Seed Business") - by distributing all outstanding shares of SpinCo common stock to Corteva shareholders in a transaction that is intended to be a tax-free spin-off for U.S. federal income tax purposes.
Basis of Presentation
The accompanying Combined Financial Statements and notes present the results of operations, financial position, and cash flows of the Seed Business and have been derived from the consolidated financial statements and accounting records of Corteva using the historical results of operations and historical basis of assets and liabilities of the Seed Business. As the Seed Business has historically operated as an operating segment of Corteva, separate financial statements for the Seed Business have not historically been prepared. These Combined Financial Statements may not reflect the financial statements had the Seed Business been a stand-alone company. The Combined Financial Statements of the Seed Business have been prepared in accordance with accounting principles generally accepted in the United States of America (“U.S. GAAP”).
The Combined Statements of Operations include all income and expenses directly attributable to the Seed Business, along with allocations of certain expenses for services from Corteva including, but not limited to, general corporate expenses related to finance, legal, information technology, human resources, ethics and compliance, shared services, employee benefits and incentives, insurance and stock-based compensation. These expenses have been allocated on a pro rata basis using net sales as a measure. The Seed Business and Corteva consider the basis on which the expenses have been allocated to be a reasonable reflection of the utilization of services provided. Management does not believe that it is practicable to estimate the expense the Seed Business would have incurred as a stand-alone company. The amount of actual costs that may have been incurred if the Seed Business were a stand-alone company would depend on a number of factors, including the Seed Business’ chosen organizational structure, which functions were outsourced or performed by Seed Business employees, contract terms negotiated with third party providers, and strategic decisions made in areas such as information technology and infrastructure.
The Combined Balance Sheets include all assets and liabilities specifically attributable to the Seed Business and certain assets and liabilities held by Corteva that are specifically identifiable or otherwise attributable to the Seed Business. Corteva uses a centralized approach to cash management and financing of its operations, including funding of required operating and investing activities of the Seed Business. Transfers of cash between Corteva and the Seed Business are reflected within Net transfers to Parent in the Combined Statements of Cash Flows and the Combined Statements of Equity. Any cash maintained in accounts for which the Seed Business subsidiary owns and retains the right to control the cash has been recorded as cash and cash equivalents on the Combined Balance Sheets. All debt and debt-related interest cost incurred by the Seed Business as the legal obligor has been recorded in the Combined Financial Statements. Additionally, the Combined Balance Sheets include a Net Parent investment comprised of financial support received from Corteva for which repayment was not required and the net effect of cost allocations from transactions with Corteva, net of the Seed Business' accumulated earnings and any dividends paid to Corteva.
The Seed Business' operations are included in the consolidated U.S. federal, and certain state, local and foreign income tax returns filed by Corteva, where applicable. The Seed Business also files certain separate state, local and foreign income tax returns. Income tax expense and other income tax related information contained in these Combined Financial Statements are presented on a separate return basis as if the Seed Business filed its own tax returns. The Seed Business' tax results as presented in the Combined Financial Statements may not be reflective of the results that the Seed Business would generate in the future. In jurisdictions where the Seed Business has been included in the tax returns filed by Corteva, any income taxes payable resulting from the related income tax provision have been reflected in the Combined Balance Sheets within Net Parent investment.
All intercompany transactions and accounts within the Seed Business have been eliminated in the Combined Financial Statements. Transactions between the Seed Business and Corteva are deemed to have been settled in the period incurred through Net Parent
investment, the net effect of which is reflected within financing activities in the Combined Statements of Cash Flows as Net transfers to Parent and in the Combined Balance Sheets as Net Parent investment.
NOTE 2 — SUMMARY OF SIGNIFICANT ACCOUNTING POLICIES
The Combined Financial Statements include the accounts of the Seed Business in which a controlling interest is maintained. For those combined subsidiaries in which the Company's ownership is less than 100 percent, the outside stockholders' interests are shown as noncontrolling interests. Investments in affiliates over which the Seed Business has the ability to exercise significant influence but does not have a controlling interest are accounted for under the equity method.
The Seed Business is also involved with certain joint ventures accounted for under the equity method of accounting that are variable interest entities ("VIEs"). The Seed Business is not the primary beneficiary, as the nature of the Seed Business' involvement with each VIE does not provide it the power to direct the VIE's significant activities. Future events may require these VIEs to be consolidated if the Seed Business becomes the primary beneficiary. At December 31, 2025 and 2024, the maximum exposure to loss related to the nonconsolidated VIEs is not considered material to the Combined Financial Statements.
Since 2018, Argentina has been considered a highly-inflationary economy under U.S. GAAP and therefore the U.S. Dollar (“USD”) is the functional currency for the Seed Business' related subsidiaries. Argentina contributes approximately 3 percent to annual Americas segment net sales and approximately 2 percent to annual Americas segment operating EBITDA. The Seed Business remeasures net monetary assets and translates the financial statements utilizing the official Argentine Peso (“Peso”) to USD exchange rate. The ability to draw down Peso cash balances is limited at this time due to government restrictions and market availability of U.S. Dollars. The devaluation of the Peso relative to the USD over the last several years has resulted in the recognition of exchange losses (refer to Note 6 – Supplementary Information, to the Combined Financial Statements). As of December 31, 2025, a further 10 percent deterioration in the official Peso to USD exchange rate would not have a significant impact on the USD value of the Seed Business' net monetary assets or pre-tax earnings. The Seed Business will continue to assess the implications to its operations and financial reporting.
Use of Estimates in Financial Statement Preparation
The preparation of financial statements in accordance with U.S. GAAP requires the use of estimates and assumptions that affect the reported amounts of assets and liabilities, the disclosure of contingent assets and liabilities at the date of the financial statements, and the reported amounts of revenues and expenses during the reporting period. The Seed Business' Combined Financial Statements include amounts that are based on management’s best estimates and judgments. Actual results could differ from those estimates.
Cash and Cash Equivalents
Cash equivalents represent highly liquid investments with maturities of three months or less from time of purchase. They are carried at cost plus accrued interest.
Marketable Securities
Marketable securities represent investments in fixed and floating rate financial instruments with maturities greater than three months and up to twelve months at time of purchase. Investments classified as held-to-maturity are recorded at amortized cost. The carrying value approximates fair value due to the short-term nature of the investments. Investments classified as debt securities that are available-for-sale are carried at estimated fair value with unrealized gains and losses recorded as a component of accumulated other comprehensive income (loss) or current period earnings if an allowance for credit losses has been established. The cost of investments sold is determined by specific identification.
Fair Value Measurements
Under the accounting guidance for fair value measurements and disclosures, a fair value hierarchy was established that prioritizes the inputs to valuation techniques used to measure fair value. A financial instrument's level within the fair value hierarchy is based on the lowest level of any input that is significant to the fair value measurement.
The Seed Business uses the following hierarchy to classify assets and liabilities measured at fair value:
|
|
|
Level 1 |
– |
Quoted market prices in active markets for identical assets or liabilities. |
|
|
|
Level 2 |
– |
Significant other observable inputs (e.g., quoted prices for similar items in active markets, quoted prices for identical or similar items in markets that are not active, inputs other than quoted prices that are observable such as interest rate and yield curves, and market-corroborated inputs). |
|
|
|
Level 3 |
– |
Unobservable inputs for the asset or liability, which are valued based on management's estimates of assumptions that market participants would use in pricing the asset or liability. |
Foreign Currency Translation
The Seed Business' worldwide operations utilize the U.S. Dollar or a related foreign currency as the functional currency, where applicable. The Seed Business identifies its separate and distinct foreign entities and groups the foreign entities into two categories: (i) extension of the parent or foreign subsidiaries operating in a highly-inflationary environment (U.S. Dollar functional currency) and (ii) self-contained (related foreign functional currency). If a foreign entity does not align with either category, factors are evaluated and a judgment is made to determine the functional currency.
For foreign entities where the U.S. Dollar is the functional currency, all foreign currency-denominated asset and liability amounts are re-measured into U.S. Dollars at end-of-period exchange rates, except for inventories, prepaid expenses, property, plant and equipment, goodwill and other intangible assets, which are re-measured at historical rates. Foreign currency income and expenses are re-measured at average exchange rates in effect during each month, except for expenses related to balance sheet amounts re-measured at historical exchange rates. Exchange gains and losses arising from re-measurement of foreign currency-denominated monetary assets and liabilities are included in income in the period in which they occur.
For foreign entities where a related foreign currency is the functional currency, assets and liabilities denominated in the related foreign currencies are translated into U.S. Dollars at end-of-period exchange rates and the resultant translation adjustments are reported, net of their related tax effects, as a component of Accumulated other comprehensive income (loss) in equity. Assets and liabilities denominated in other than the functional currency are re-measured into the functional currency prior to translation into U.S. Dollars, and the resultant exchange gains or losses are included in income in the period in which they occur. Income and expenses are translated into U.S. Dollars at average exchange rates in effect during each month.
The Seed Business changes the functional currency of its separate and distinct foreign entities only when significant changes in economic facts and circumstances indicate clearly that the functional currency has changed.
Inventories
The Seed Business' inventories are valued at the lower of cost or net realizable value. Elements of cost in inventories include raw materials, supplies, direct labor and manufacturing overhead. Inventories are accounted for under the first-in, first-out ("FIFO") method. Refer to Note 9 - Inventories, to the Combined Financial Statements, for further information.
The Seed Business establishes an obsolescence reserve for inventory based upon quality considerations and assumptions about future demand and market conditions.
Goodwill and Other Intangible Assets
The Seed Business records goodwill when the purchase price of a business acquisition exceeds the estimated fair value of net identified tangible and intangible assets acquired. Goodwill is tested for impairment at the reporting unit level at least annually, or more frequently when events or changes in circumstances indicate that the fair value of a reporting unit has more likely than not declined below its carrying value. The Seed Business performs an annual goodwill impairment test in the fourth quarter at the reporting unit level, which is defined as the operating segment or one level below the operating segment. One level below the operating segment, or component, is a business in which discrete financial information is available and regularly reviewed by segment management. The Seed Business aggregates certain components into reporting units based on economic similarities. The Seed Business' reporting units are Americas and Rest of World.
When testing goodwill for impairment, the Seed Business has the option to first perform qualitative testing to determine whether it is more likely than not that the fair value of a reporting unit is less than its carrying value. If the Seed Business chooses not to complete a qualitative assessment for a given reporting unit or if the initial assessment indicates that it is more likely than not that the carrying value of a reporting unit exceeds its estimated fair value, additional quantitative testing is required. If additional quantitative testing is required,
the reporting unit's fair value is compared with its carrying amount, and an impairment charge, if any, is recognized for the amount by which the carrying amount exceeds the reporting unit's fair value, limited to the amount of goodwill associated with the reporting unit. The Seed Business determines fair values for each of the reporting units using a combination of a discounted cash flow model (a form of the income approach) and the market approach. Under the income approach, fair value is determined based on the present value of estimated future cash flows, discounted at an appropriate risk-adjusted rate. The Seed Business' significant assumptions in this analysis include future cash flow projections, weighted average cost of capital, the terminal growth rate, and the tax rate. Under the market approach, the Seed Business uses metrics of publicly traded companies or historically completed transactions for comparable companies. Refer to Note 11 - Goodwill and Other Intangible Assets, to the Combined Financial Statements, for further information on goodwill.
Definite-lived intangible assets are amortized over their estimated useful lives, generally on a straight-line basis for periods ranging primarily from 2 to 25 years. The Seed Business continually evaluates the reasonableness of the useful lives of these assets. Once these assets are no longer considered held and used, they are removed from the Combined Balance Sheets.
Leases
The Seed Business determines whether an arrangement is a lease at the inception of the arrangement based on the terms and conditions in the contract. A contract contains a lease if there is an identified asset and the Seed Business has the right to control the asset. Operating lease right-of-use ("ROU") assets are included in other assets on the Company’s Combined Balance Sheets. Operating lease liabilities are included in accrued and other current liabilities and other noncurrent obligations on the Seed Business' Combined Balance Sheets. Finance lease assets are included in property, plant and equipment on the Seed Business' Combined Balance Sheets. Finance lease liabilities are included in short-term borrowings and finance lease obligations and long-term debt on the Seed Business' Combined Balance Sheets.
Operating lease ROU assets represent the Seed Business' right to use an underlying asset for the lease term and lease liabilities represent the Seed Business' obligation to make lease payments arising from the lease. Operating lease ROU assets and liabilities are recognized at the commencement date based on the present value of lease payments over the lease term. As most of the Seed Business' leases do not provide the lessor's implicit rate, the Seed Business uses Corteva's incremental borrowing rate at the commencement date in determining the present value of lease payments. Lease terms include options to extend the lease when it is reasonably certain those options will be exercised. Leases with an initial term of 12 months or less are not recorded on the balance sheet. The Seed Business recognizes lease expense for these leases on a straight-line basis over the lease term.
The Seed Business has lease agreements with lease and non-lease components, which are accounted for as a single lease component for all asset classes. In the Combined Statements of Operations, lease expense for operating leases is recognized on a straight-line basis over the lease term. For finance leases, interest expense is recognized on the lease liability and the ROU asset is amortized over the lease term. Refer to Note 12 - Leases, to the Combined Financial Statements, for further information.
Impairment of Long-Lived Assets
The Seed Business evaluates the carrying value of long-lived assets to be held and used when events or changes in circumstances indicate the carrying value may not be recoverable. The carrying value of a long-lived asset group is considered impaired when the total projected undiscounted cash flows from the assets are separately identifiable and are less than its carrying value. In that event, a loss is recognized based on the amount by which the carrying value exceeds the fair value of the long-lived asset group. The Seed Business' fair value methodology is an estimate of fair market value which is made based on prices of similar assets or other valuation methodologies including present value techniques. Long-lived assets to be disposed of by sale, if material, are classified as held for sale and reported at the lower of carrying amount or fair value less cost to sell, and depreciation is ceased. Long-lived assets to be disposed of other than by sale are classified as held and used until they are disposed of and reported at the lower of carrying amount or fair value. Depreciation is recognized over the remaining useful life of the assets.
Derivative Instruments
Derivative instruments are reported in the Combined Balance Sheets at their fair values. The Seed Business utilizes derivatives to manage exposures to foreign currency exchange rates and commodity prices. Changes in the fair values of derivative instruments that are not designated as hedges are recorded in current period earnings. For derivative instruments designated as cash flow hedges, the gain (loss) is reported in Accumulated other comprehensive income (loss) until it is cleared to earnings during the same period in which the hedged item affects earnings.
In the event that a derivative designated as a hedge of a firm commitment or an anticipated transaction is terminated prior to the maturation of the hedged transaction, the net gain or loss in Accumulated other comprehensive income (loss) generally remains in Accumulated other comprehensive income (loss) until the item that was hedged affects earnings. If a hedged transaction matures, or is sold, extinguished, or terminated prior to the maturity of a derivative designated as a hedge of such transaction, gains or losses associated with the derivative through the date the transaction matured are included in the measurement of the hedged transaction and the derivative
is reclassified as for trading purposes. Derivatives designated as hedges of anticipated transactions are reclassified as for trading purposes if the anticipated transaction is no longer probable.
The Seed Business included foreign currency exchange contract settlements within cash flows from operating activities, regardless of hedge accounting qualification. See Note 17 - Financial Instruments, to the Combined Financial Statements, for additional discussion regarding the Seed Business' objectives and strategies for derivative instruments.
Environmental Matters
Accruals for environmental matters related to the Seed Business are recorded when it is probable that a liability has been incurred and the amount of the liability can be reasonably estimated. These accruals are adjusted periodically as assessment and remediation efforts progress or as additional technical or legal information becomes available. Accruals for environmental liabilities are included in the Combined Balance Sheets in accrued and other current liabilities and other noncurrent obligations at undiscounted amounts. Accruals for related insurance or other third-party recoveries for environmental liabilities are recorded when it is probable that a recovery will be realized and are included in the Combined Balance Sheets as Accounts and notes receivable - net.
Environmental costs are capitalized if the costs extend the life of the property, increase its capacity, and/or mitigate or prevent contamination from future operations. Environmental costs are also capitalized in recognition of legal asset retirement obligations resulting from the acquisition, construction and/or normal operation of a long-lived asset. Costs related to environmental contamination treatment and cleanup are charged to expense. Estimated future incremental operations, maintenance and management costs directly related to remediation are accrued when such costs are probable and reasonably estimable.
Revenue Recognition
The Seed Business recognizes revenue when its customer obtains control of promised goods or services, in an amount that reflects the consideration which the Seed Business expects to receive in exchange for those goods or services. To determine the revenue recognition for an arrangement considered to be a contract with a customer, the Seed Business performs the following five steps: (1) identifies the contract(s) with a customer, (2) identifies the performance obligations in the contract, (3) determines the transaction price, (4) allocates the transaction price to the performance obligations in the contract and (5) recognizes revenue when (or as) the entity satisfies a performance obligation. Refer to Note 4 - Revenue, to the Combined Financial Statements, for additional information on revenue recognition.
Prepaid Royalties
The Seed Business currently has certain third-party biotechnology trait license agreements, which require up-front and variable payments subject to the licensor meeting certain conditions. These payments are reflected as other current assets and other assets and are amortized to cost of goods sold as seeds containing the respective trait technology are utilized over the term of the license. The rate of royalty amortization expense recognized is based on the Seed Business' strategic plans which include various assumptions and estimates including product portfolio, market dynamics, farmer preferences, growth rates and projected planted acres. Changes in factors and assumptions included in the strategic plans, including potential changes to the product portfolio in favor of internally developed biotechnology, could impact the rate of recognition of the relevant prepaid royalty.
The Seed Business holds a non-exclusive license in the United States and Canada for the Monsanto Company's Genuity® Roundup Ready 2 Yield® glyphosate tolerance trait and Roundup Ready 2 Xtend® glyphosate and dicamba tolerance trait for soybeans, which was obtained by the Seed Business' wholly owned subsidiary, Pioneer Hi-Bred International, Inc. (“Pioneer”) (“Roundup Ready 2 License Agreement”). Each of these licensed technologies are now trademarks of the Bayer Group, which acquired the Monsanto Company in 2018. The prepaid royalty asset relates to a series of up-front, fixed and variable royalty payments to utilize the traits in Pioneer’s soybean product mix. The Seed Business' historical expectation was that the technology licensed under the Roundup Ready 2 License Agreement would be used as the primary herbicide tolerance trait platform in the Pioneer® brand soybean through the term of the agreement. Dow Agrosciences LLC and MS Technologies, L.L.C. jointly developed and own the Enlist E3TM herbicide tolerance trait for soybeans which provides tolerance to 2,4-D choline in Enlist Duo® and Enlist One® herbicides, as well as glyphosate and glufosinate herbicides. In connection with the validation of breeding plans and large-scale product development timelines, during 2019 the Seed Business committed to accelerate the ramp up of the Enlist E3TM trait platform in its soybean portfolio mix across all brands, including Pioneer® brands. Due to the five-year ramp-up of Enlist E3TM, the Seed Business significantly reduced the volume of products with the Roundup Ready 2 Yield® and Roundup Ready 2 Xtend® herbicide tolerance traits, with expected minimal use of the trait platform thereafter for the remainder of the Roundup Ready 2 License Agreement (the “Transition Plan”). The rate of royalty expense had therefore increased significantly through higher amortization of the prepaid royalty as fewer seeds containing the respective trait were expected to be utilized.
In connection with the departure from these traits in the Seed Business' product portfolio in favor of the Enlist E3TM trait platform, beginning January 1, 2020 the Seed Business presents and discloses accelerated prepaid royalty amortization expense associated with these prepaid royalties as a component of restructuring and asset related charges - net in the Combined Statement of Operations. The
accelerated prepaid royalty amortization expense represents the difference between the rate of amortization based on the revised number of units expected to contain the Roundup Ready 2 Yield® and Roundup Ready 2 Xtend® trait technology and the per unit cash rate per the Roundup Ready 2 License Agreement. Charges relating to non-cash accelerated prepaid royalty amortization expense were complete as of the end of the second quarter of 2024.
Cost of Goods Sold
Cost of goods sold primarily includes the cost of production and delivery, materials, direct salaries, wages and benefits and overhead, non-capitalizable costs associated with capital projects, royalties and other operational expenses. No amortization of intangible assets is included within cost of goods sold.
Research and Development
Research and development costs are expensed as incurred. Research and development expense includes costs (primarily consisting of employee costs, materials, contract services, research agreements, and other external spend) relating to the discovery and development of new products.
Selling, General and Administrative Expenses
Selling, general and administrative expenses primarily include selling and marketing expenses, commissions, functional costs, and business management expenses.
Litigation and Other Contingencies
Accruals for legal matters and other contingencies are recorded when it is probable that a liability has been incurred and the amount of the liability can be reasonably estimated. Legal costs, such as outside counsel fees and expenses, are charged to expense in the period incurred.
Severance Costs
Severance benefits are provided to employees under the Company's ongoing benefit arrangements. Severance costs are accrued when management commits to a plan of termination and it becomes probable that employees will be entitled to benefits at amounts that can be reasonably estimated.
Insurance/Self-Insurance
The Seed Business self-insures certain risks where permitted by law or regulation, including workers' compensation, vehicle liability and employee related benefits. Liabilities associated with these risks are estimated in part by considering historical claims experience, demographic factors and other actuarial assumptions. For other risks, the Seed Business uses a combination of insurance and self-insurance, reflecting comprehensive reviews of relevant risks. A receivable for an insurance recovery is generally recognized when the loss has occurred and collection is considered probable.
Income Taxes
Income taxes as presented herein attribute current and deferred income taxes of Corteva to the Seed Business' standalone financial statements in a manner that is systematic, rational and consistent with the asset and liability method prescribed by Accounting Standards Codification ("ASC") 740, Income Taxes, issued by the Financial Accounting Standards Board. Accordingly, the Seed Business' income tax provision was prepared following the separate return method. The separate return method applies ASC 740 to the standalone financial statements of each member of the consolidated group as if the group member were a separate taxpayer and a standalone enterprise. As a result, actual tax transactions included in the consolidated financial statements of Corteva may not be included in the Seed Business' Combined Financial Statements. Similarly, the tax treatment of certain items reflected in the Seed Business' Combined Financial Statements may not be reflected in the consolidated financial statements and tax returns of Corteva. Additionally, certain current income tax liabilities related to the Seed Business' activities included in Corteva's income tax returns were assumed to be immediately settled with Corteva through the Net parent investment account. Following the Separation, the Seed Business' operating footprint as well as tax return elections and assertions may be different and, therefore, the Seed Business' hypothetical income taxes, as presented in the Seed Business' Combined Financial Statements, may not be indicative of the Seed Business' future income taxes.
Under the asset and liability method, deferred tax assets and liabilities are recognized for the future tax consequences of temporary differences between the carrying amounts and tax bases of assets and liabilities using enacted tax rates. The effect of a change in tax rates on deferred tax assets or liabilities is recognized in income in the period that includes the enactment date.
The Seed Business recognizes the financial statement effects of an uncertain income tax position when it is more likely than not, based on the technical merits, that the position will be sustained upon examination. The current portion of uncertain income tax positions is included in Income taxes payable or Accounts and notes receivable - net, and the long-term portion is included in Other noncurrent obligations or Other assets in the Combined Balance Sheets.
Income tax-related penalties are included in the Provision for (benefit from) income taxes in the Combined Statements of Operations. Interest accrued related to unrecognized tax benefits is included within the Provision for (benefit from) income taxes in the Combined Statements of Operations.
NOTE 3 — RECENT ACCOUNTING GUIDANCE
Recently Adopted Accounting Guidance
In December 2023, the Financial Accounting Standards Board (“FASB”) issued Accounting Standards Update ("ASU") 2023-09, Income Taxes (Topic 740): Improvements to Income Tax Disclosures. The ASU requires that an entity disclose specific categories in the effective tax rate reconciliation as well as reconciling items that meet a quantitative threshold. Further, the ASU requires additional disclosures on income tax expense and taxes paid, net of refunds received, by jurisdiction. The new standard is effective for annual periods beginning after December 15, 2024 on a prospective basis with the option to apply it retrospectively. Early adoption is permitted. The Company adopted this guidance on a prospective basis and has included enhanced income tax related disclosures in Note 7 - Income Taxes, to the Combined Financial Statements.
In November 2023, the FASB issued ASU 2023-07, Segment Reporting (Topic 280): Improvements to Reportable Segment Disclosures. This ASU includes amendments that expand the existing reportable segment disclosure requirements and requires disclosure of (i) significant expense categories and amounts by reportable segment as well as the segment’s profit or loss measure(s) that are regularly provided to the chief operating decision maker (the “CODM”) to allocate resources and assess performance; (ii) how the CODM uses each reported segment profit or loss measure to allocate resources and assess performance; (iii) the nature of other segment balances contributing to reported segment profit or loss that are not captured within segment revenues or expenses; and (iv) the title and position of the individual or name of the group or committee identified as the CODM. This guidance requires retrospective application to all prior periods presented in the financial statements and is effective for fiscal years beginning after December 15, 2023 and interim periods within fiscal years beginning after December 15, 2024. Early adoption is permitted. The Company adopted this guidance and has included enhanced disclosures relating to its reportable segments. See Note 22 - Segment Information, to the Combined Financial Statements, for the Company's updated disclosure.
Accounting Guidance Issued But Not Adopted as of December 31, 2025
In November 2024, the FASB issued ASU 2024-03, Income Statement—Reporting Comprehensive Income—Expense Disaggregation Disclosures (Subtopic 220-40): Disaggregation of Income Statement Expenses. This ASU includes amendments that require entities to bifurcate specified expense line items on the income statement into underlying components, including purchases of inventory, employee compensation, depreciation, intangible asset amortization and depletion, as applicable. Qualitative descriptions of the remaining components are required. These enhanced disclosures are required for both interim and annual periods. Selling expenses must also be separately disclosed for both interim and annual periods, along with an annual qualitative description of the composition of selling expenses. In January 2025, the FASB subsequently issued ASU 2025-01, Income Statement—Reporting Comprehensive Income—Expense Disaggregation Disclosures (Subtopic 220-40): Clarifying the Effective Date, to provide clarification on the ASU's effective date. The new standard is effective for fiscal years beginning after December 15, 2026 on a prospective basis with the option to apply it retrospectively, and for interim periods within fiscal years beginning after December 15, 2027. Early adoption is permitted. The adoption of this guidance will result in the Company being required to include enhanced disclosures around income statement expenses.
NOTE 4 — REVENUE
Revenue Recognition
Products
Substantially all of the Seed Business' revenue is derived from product sales, which consist of sales of the Seed Business' products to farmers and distributors. The Seed Business considers purchase orders to be a contract with a customer. Contracts with customers are considered to be short-term when the time between order confirmation and satisfaction of the performance obligations is equal to or less than one year. The Seed Business applies the practical expedient to disclose the transaction price allocated to unsatisfied or partially unsatisfied performance obligations for only those contracts with an original duration of more than one year, of which there were none as of December 31, 2025 and 2024, respectively.
Revenue from product sales is recognized when the customer obtains control of the Seed Business' product, which occurs at a point in time according to shipping terms. Payment terms are generally less than one year from invoicing. The Seed Business elected the practical expedient and does not adjust the promised amount of consideration for the effects of a significant financing component when the Seed Business expects it will be one year or less between when a customer obtains control of the Seed Business' product and when payment is due. When the Seed Business performs shipping and handling activities after the transfer of control to the customer (e.g., when control transfers prior to or at shipment), these are considered fulfillment activities, and accordingly, the costs are accrued when the related revenue is recognized. Taxes collected from customers relating to product sales and remitted to governmental authorities are excluded from revenues. In addition, the Seed Business elected the practical expedient to expense any costs to obtain contracts as incurred, as the amortization period for these costs would have been one year or less.
The transaction price includes estimates of variable consideration, such as rights of return, rebates, and discounts, that are reductions in revenue. All estimates are based on the Seed Business' historical experience, anticipated performance, and the Seed Business' best judgment at the time the estimate is made. Estimates of variable consideration included in the transaction price primarily utilize the expected value method based on historical experience. These estimates are reassessed each reporting period and are included in the transaction price to the extent it is probable that a significant reversal of cumulative revenue recognized will not occur upon resolution of uncertainty associated with the variable consideration. Nearly all contracts have a single performance obligation satisfied at a point in time and the transaction price is stated in the contract, usually as quantity times price per unit.
Licenses of Intellectual Property
The Seed Business enters into licensing arrangements with customers to license its intellectual property. Revenue from the majority of intellectual property licenses is derived from sales-based royalties. Revenue for licensing agreements that contain sales-based royalties is recognized at the later of (i) when the subsequent sale occurs or (ii) when the performance obligation to which some or all of the royalty has been allocated is satisfied.
Contract Balances
Contract assets include amounts related to conditional rights to consideration for completed performance not yet invoiced, of which there were none at December 31, 2025 and 2024. Accounts receivable are recorded when the right to consideration becomes unconditional.
Contract liabilities primarily reflect deferred revenue from prepayments under contracts with customers where the Company receives advance payments for products to be delivered in future periods. The Seed Business classifies deferred revenue as current or noncurrent based on the timing of when the Seed Business expects to recognize revenue. Deferred revenue - current was $3,232 million and $2,902 million at December 31, 2025 and 2024, respectively. Revenue recognized during the years ended December 31, 2025, 2024, and 2023 from amounts included in deferred revenue at the beginning of the period was $2,865 million, $2,903 million and $2,960 million, respectively.
Disaggregation of Revenue
The Seed Business' operations are classified into two operating segments: Americas and Rest of World. The Seed Business disaggregates its revenue by major product line and geographic region, as the Company believes it best depicts the nature, amount and timing of its revenue and cash flows. Net sales by major product line are included below:
|
|
|
|
|
|
|
|
|
|
|
|
|
|
For the Year Ended December 31, |
|
(In millions) |
2025 |
|
2024 |
|
2023 |
|
Corn |
|
$ |
7,002 |
|
|
$ |
6,496 |
|
|
$ |
6,447 |
|
Soybean |
|
|
1,878 |
|
|
|
1,927 |
|
|
|
1,858 |
|
Other oilseeds |
|
|
644 |
|
|
|
653 |
|
|
|
708 |
|
Other |
|
|
374 |
|
|
|
469 |
|
|
|
459 |
|
Total |
|
$ |
9,898 |
|
|
$ |
9,545 |
|
|
$ |
9,472 |
|
Sales are attributed to geographic regions based on customer location. Net sales by geographic region and segment are included below:
|
|
|
|
|
|
|
|
|
|
|
|
|
|
For the Year Ended December 31, |
|
(In millions) |
2025 |
|
2024 |
|
2023 |
|
North America 1 |
|
$ |
6,271 |
|
|
$ |
6,033 |
|
|
$ |
5,768 |
|
EMEA 2 |
|
|
1,560 |
|
|
|
1,581 |
|
|
|
1,622 |
|
Latin America |
|
|
1,614 |
|
|
|
1,523 |
|
|
|
1,637 |
|
Asia Pacific |
|
|
453 |
|
|
|
408 |
|
|
|
445 |
|
Total |
|
$ |
9,898 |
|
|
$ |
9,545 |
|
|
$ |
9,472 |
|
1.Represents U.S. & Canada.
2.Europe, Middle East and Africa ("EMEA").
Refer to Note 21 - Geographic Information, to the Combined Financial Statements, for the breakout of Seed Business net sales by geographic area.
NOTE 5 — RESTRUCTURING AND ASSET RELATED CHARGES – NET
Corteva periodically assesses its business priorities and operational structure to maximize the customer experience and deliver on growth and earnings potential. The Seed Business records charges attributable to it in association with these committed restructuring actions. The restructuring actions associated with these programs are substantially complete. At December 31, 2025 and 2024, the liability associated with these programs was $3 million and $25 million, respectively. The remaining cash payments related to these charges will be paid out over the course of 2026, and primarily relate to the payment of severance and related benefits.
The following table is a summary of charges incurred related to the restructuring actions for the years ended December 31, 2025, 2024 and 2023:
|
|
|
|
|
|
|
|
|
|
|
|
|
(In millions) |
For the Year Ended December 31, 2025 |
|
For the Year Ended December 31, 2024 |
|
For the Year Ended December 31, 2023 |
|
Severance and related benefit costs 1 |
|
$ |
— |
|
|
$ |
15 |
|
|
$ |
11 |
|
Asset related charges 2 |
|
|
4 |
|
|
|
(2 |
) |
|
|
— |
|
Contract termination charges 2 |
|
|
— |
|
|
|
2 |
|
|
|
15 |
|
Total restructuring and asset related charges - net |
|
$ |
4 |
|
|
$ |
15 |
|
|
$ |
26 |
|
1.Reflects corporate related charges.
2.Reflects charges which are substantially all associated with the Americas segment.
Other Asset Related Charges
For the years ended December 31, 2024 and 2023, the Seed Business recognized $55 million and $72 million, respectively, in Restructuring and asset related charges - net in the Combined Statements of Operations, from non-cash accelerated prepaid royalty amortization expense related to Roundup Ready 2 Yield® and Roundup Ready 2 Xtend® herbicide tolerance traits, which as of the end of the second quarter of 2024 was complete.
NOTE 6 — SUPPLEMENTARY INFORMATION
|
|
|
|
|
|
|
|
|
|
|
|
|
Other Income (Expense) - Net |
For the Year Ended December 31, |
|
(In millions) |
2025 |
|
2024 |
|
2023 |
|
Interest income |
|
$ |
50 |
|
|
$ |
42 |
|
|
$ |
87 |
|
Equity in earnings (losses) of affiliates - net |
|
|
13 |
|
|
|
14 |
|
|
|
12 |
|
Net gain (loss) on sales of businesses and other assets |
|
|
2 |
|
|
|
6 |
|
|
|
7 |
|
Net exchange gains (losses) 1 |
|
|
(120 |
) |
|
|
(114 |
) |
|
|
(97 |
) |
Non-operating pension and other post-employment benefit credits (costs) 2 |
|
|
(11 |
) |
|
|
(7 |
) |
|
|
(7 |
) |
Miscellaneous income (expenses) - net 3 |
|
|
(646 |
) |
|
|
(5 |
) |
|
|
(14 |
) |
Other income (expense) - net |
|
$ |
(712 |
) |
|
$ |
(64 |
) |
|
$ |
(12 |
) |
1.Includes net pre-tax exchange gains (losses) of $(10) million, $(26) million and $(119) million, associated with impacts from the devaluation of the Argentine peso for the years ended December 31, 2025, 2024 and 2023, respectively.
2.Includes non-service related components of net periodic benefit credits (costs) (interest cost, expected return on plan assets, amortization of unrecognized gain (loss), amortization of prior service benefit and settlement gain (loss)).
3.Includes losses from sale of receivables and other items. The year ended December 31, 2025 includes a $610 million charge related to the Bayer resolution. There were no income or expense amounts that were individually significant for the years ended December 31, 2024 or 2023. Refer to Note 22 - Segment Information, to the Combined Financial Statements, for additional information on significant items.
The following table summarizes the impacts of the Company's foreign currency hedging program on the Company's results of operations. The Company routinely uses foreign currency exchange contracts to offset its net exposures, by currency, related to the foreign currency-denominated monetary assets and liabilities. The objective of this program is to maintain an approximately balanced position in foreign currencies in order to minimize, on an after-tax basis, the effects of exchange rate changes on net monetary asset positions. The hedging program gains (losses) are largely taxable (tax deductible) in the United States (U.S.), whereas the offsetting exchange gains (losses) on the remeasurement of the net monetary asset positions are often not taxable (tax deductible) in their local jurisdictions. The net pre-tax exchange gains (losses) are recorded in other income (expense) – net and the related tax impact is recorded in provision for (benefit from) income taxes on continuing operations in the Combined Statements of Operations.
|
|
|
|
|
|
|
|
|
|
|
|
|
|
For the Year Ended December 31, |
|
(In millions) |
2025 |
|
2024 |
|
2023 |
|
Subsidiary Monetary Position Gain (Loss) |
|
|
|
|
|
|
|
|
|
Pre-tax exchange gain (loss) |
|
$ |
(116 |
) |
|
$ |
(70 |
) |
|
$ |
(159 |
) |
Local tax (expenses) benefits |
|
|
16 |
|
|
|
16 |
|
|
|
(4 |
) |
Net after-tax impact from subsidiary exchange gain (loss) |
|
$ |
(100 |
) |
|
$ |
(54 |
) |
|
$ |
(163 |
) |
|
|
|
|
|
|
|
|
|
|
Hedging Program Gain (Loss) |
|
|
|
|
|
|
|
|
|
Pre-tax exchange gain (loss) |
|
$ |
(4 |
) |
|
$ |
(44 |
) |
|
$ |
62 |
|
Tax (expenses) benefits |
|
|
1 |
|
|
|
11 |
|
|
|
(15 |
) |
Net after-tax impact from hedging program exchange gain (loss) |
|
$ |
(3 |
) |
|
$ |
(33 |
) |
|
$ |
47 |
|
|
|
|
|
|
|
|
|
|
|
Total Exchange Gain (Loss) |
|
|
|
|
|
|
|
|
|
Pre-tax exchange gain (loss) |
|
$ |
(120 |
) |
|
$ |
(114 |
) |
|
$ |
(97 |
) |
Tax (expenses) benefits |
|
|
17 |
|
|
|
27 |
|
|
|
(19 |
) |
Net after-tax exchange gain (loss) |
|
$ |
(103 |
) |
|
$ |
(87 |
) |
|
$ |
(116 |
) |
|
|
|
|
|
|
|
|
|
|
Noncontrolling interest adjustment |
|
|
— |
|
|
|
1 |
|
|
|
— |
|
|
|
|
|
|
|
|
|
|
|
Net after-tax exchange gain (loss) attributable to the Seed Business |
|
$ |
(103 |
) |
|
$ |
(86 |
) |
|
$ |
(116 |
) |
Accounts Payable
Accounts payable was $2,140 million and $1,992 million at December 31, 2025 and 2024, respectively. Accounts payable - trade, which is a component of accounts payable, was $1,806 million and $1,745 million at December 31, 2025 and 2024, respectively. Included in accounts payable – trade was seed grower compensation of approximately $420 million and $410 million at December 31, 2025 and 2024, respectively, which is measured at fair value using Level 2 inputs. Accrued discounts and rebates, which is a component of
accounts payable, was approximately $288 million and $218 million at December 31, 2025 and 2024, respectively. No other components of accounts payable were more than five percent of total current liabilities.
NOTE 7 — INCOME TAXES
During the periods presented in the Combined Financial Statements, the Seed Business’ operations are included in the consolidated U.S. federal, certain state and local and foreign income tax returns filed by Corteva, where applicable. The Seed Business also files certain separate state and local and foreign income tax returns. The income tax provision (benefit) included in these Combined Financial Statements has been calculated using the separate return basis, as if the Seed Business entities filed separate tax returns. It is possible that the Seed Business will make different tax accounting elections and assertions subsequent to separation; therefore, the Seed Business’ income taxes, as presented in the Combined Financial Statements, may not be indicative of the income taxes that the Seed Business will generate in the future.
Domestic and foreign components of Income (loss) before income taxes and Provision for (benefit from) current and deferred tax expense (benefit) are shown below:
|
|
|
|
|
|
|
|
|
|
|
|
|
Geographic Allocation of Income (Loss) and Provision for (Benefit from) Income Taxes |
For the Year Ended December 31, |
|
(In millions) |
2025 |
|
2024 |
|
2023 |
|
Income (loss) before income taxes |
|
|
|
|
|
|
|
|
|
Domestic |
|
$ |
333 |
|
|
$ |
738 |
|
|
$ |
561 |
|
Foreign |
|
|
512 |
|
|
|
378 |
|
|
|
390 |
|
Income (loss) before income taxes |
|
$ |
845 |
|
|
$ |
1,116 |
|
|
$ |
951 |
|
Current tax expense (benefit) |
|
|
|
|
|
|
|
|
|
Federal |
|
$ |
182 |
|
|
$ |
301 |
|
|
$ |
288 |
|
State and local |
|
|
74 |
|
|
|
86 |
|
|
|
84 |
|
Foreign |
|
|
225 |
|
|
|
168 |
|
|
|
164 |
|
Total current tax expense (benefit) |
|
$ |
481 |
|
|
$ |
555 |
|
|
$ |
536 |
|
Deferred tax expense (benefit) |
|
|
|
|
|
|
|
|
|
Federal |
|
$ |
(165 |
) |
|
$ |
(204 |
) |
|
$ |
(209 |
) |
State and local |
|
|
(36 |
) |
|
|
(56 |
) |
|
|
(48 |
) |
Foreign |
|
|
(10 |
) |
|
|
47 |
|
|
|
18 |
|
Total deferred tax expense (benefit) |
|
$ |
(211 |
) |
|
$ |
(213 |
) |
|
$ |
(239 |
) |
Provision for (benefit from) income taxes |
|
|
270 |
|
|
|
342 |
|
|
|
297 |
|
Net income (loss) |
|
$ |
575 |
|
|
$ |
774 |
|
|
$ |
654 |
|
The table below provides the updated disclosure requirements of ASU 2023-09, which was adopted on a prospective basis for the year ended December 31, 2025. See Note 3 - Recent Accounting Guidance, to the Combined Financial Statements, for a description of the relevant disclosure requirements.
The effective income tax rate applicable to Income (loss) before income taxes was different from the statutory U.S. federal income tax rate due to the factors listed in the following table:
|
|
|
|
|
|
|
|
|
Reconciliation to U.S. Statutory Rate |
For the Year Ended December 31, |
|
|
2025 |
|
($ In millions) |
$ |
|
% |
|
U.S. Federal statutory tax rate |
|
$ |
177 |
|
|
|
21.0 |
% |
State and local income tax, net of federal (national) income tax effect 1 |
|
|
29 |
|
|
|
3.5 |
% |
Foreign tax effects |
|
|
|
|
|
|
Argentina |
|
|
|
|
|
|
Statutory tax rate differential |
|
|
(6 |
) |
|
|
(0.7 |
)% |
Withholding tax |
|
|
17 |
|
|
|
2.0 |
% |
Exchange gains/losses |
|
|
(24 |
) |
|
|
(2.9 |
)% |
Changes in valuation allowances |
|
|
42 |
|
|
|
5.0 |
% |
Other |
|
|
(4 |
) |
|
|
(0.4 |
)% |
Brazil |
|
|
|
|
|
|
Statutory tax rate differential |
|
|
6 |
|
|
|
0.7 |
% |
Withholding tax |
|
|
37 |
|
|
|
4.4 |
% |
Interest on net equity |
|
|
(12 |
) |
|
|
(1.4 |
)% |
Changes in valuation allowances |
|
|
26 |
|
|
|
3.1 |
% |
Other |
|
|
6 |
|
|
|
0.7 |
% |
India |
|
|
|
|
|
|
Statutory tax rate differential |
|
|
5 |
|
|
|
0.6 |
% |
Agriculture exemption |
|
|
(33 |
) |
|
|
(3.9 |
)% |
Withholding tax |
|
|
23 |
|
|
|
2.7 |
% |
Other |
|
|
2 |
|
|
|
0.2 |
% |
Other foreign jurisdictions |
|
|
24 |
|
|
|
2.8 |
% |
Effect of cross-border tax laws (net of related foreign tax credits) |
|
|
|
|
|
|
Branch Income |
|
|
(11 |
) |
|
|
(1.3 |
)% |
Other |
|
|
12 |
|
|
|
1.4 |
% |
Tax credits |
|
|
|
|
|
|
U.S. research and development credit |
|
|
(27 |
) |
|
|
(3.2 |
)% |
Other foreign tax credits |
|
|
(56 |
) |
|
|
(6.6 |
)% |
Changes in valuation allowances |
|
|
45 |
|
|
|
5.3 |
% |
Nontaxable or nondeductible items |
|
|
6 |
|
|
|
0.7 |
% |
Changes in unrecognized tax benefits |
|
|
(6 |
) |
|
|
(0.7 |
)% |
Other |
|
|
(8 |
) |
|
|
(1.0 |
)% |
Effective tax rate |
|
$ |
270 |
|
|
|
32.0 |
% |
1.State taxes in Iowa, Illinois, Kansas, and Minnesota made up the majority (greater than 50%) of the tax effect in this category.
For the years ended December 31, 2024 and 2023, prior to the adoption of ASU 2023-09, the effective income tax rate differs from the statutory federal income tax rate as follows:
|
|
|
|
|
|
|
|
|
Reconciliation to U.S. Statutory Rate |
|
|
|
2024 |
|
2023 |
|
Statutory U.S. federal income tax rate |
|
|
21.0 |
% |
|
|
21.0 |
% |
Effective tax rates on international operations - net 1 |
|
|
2.1 |
|
|
|
7.0 |
|
U.S. research and development credit |
|
|
(3.3 |
) |
|
|
(4.1 |
) |
Foreign derived intangible income 2 |
|
|
(1.1 |
) |
|
|
0.1 |
|
Exchange gains/losses 3 |
|
|
0.3 |
|
|
|
2.4 |
|
State and local incomes taxes - net |
|
|
2.1 |
|
|
|
2.9 |
|
Excess tax benefits/deficiencies from stock compensation |
|
|
— |
|
|
|
(0.3 |
) |
Tax settlements and expiration of statute of limitations |
|
|
(0.8 |
) |
|
|
— |
|
Impact of Brazil valuation allowance 4 |
|
|
7.9 |
|
|
|
— |
|
Repatriation of foreign earnings 5 |
|
|
1.8 |
|
|
|
2.0 |
|
Other – net |
|
|
0.6 |
|
|
|
0.2 |
|
Effective tax rate |
|
|
30.6 |
% |
|
|
31.2 |
% |
1.Includes the effects of local and U.S. taxes related to earnings of non-U.S. subsidiaries, changes in the amount of unrecognized tax benefits associated with these earnings, losses at non-U.S. subsidiaries without local tax benefits due to valuation allowances, and other permanent differences between tax and U.S. GAAP results.
2.Includes the impact of certain non-deductible royalties for the year ended December 31, 2023.
3.Principally reflects the impact of foreign exchange gains and losses on net monetary assets for which no corresponding tax impact is realized. Further information about the Company's foreign currency hedging program is included in Note 6 - Supplementary Information, and Note 17 - Financial Instruments, to the Combined Financial Statements, under the heading "Foreign Currency Risk."
4.For the year ended December 31, 2024, a charge of $88 million was recorded to establish a valuation allowance against the net deferred tax asset position of a legal entity in Brazil.
5.Includes the effect of withholding tax on distribution of foreign earnings to the U.S., net of U.S. foreign tax credits.
Significant jurisdictions in which income taxes were paid (net of refunds received) are shown below:
|
|
|
|
|
Income Taxes Paid, Net |
For the Year Ended December 31, |
|
(In millions) |
2025 |
|
Argentina |
|
$ |
43 |
|
Brazil |
|
|
35 |
|
Canada |
|
|
26 |
|
India |
|
|
24 |
|
South Africa |
|
|
25 |
|
Turkey |
|
|
13 |
|
Other Foreign |
|
|
69 |
|
Total |
|
$ |
235 |
|
The significant components of the Seed Business' net deferred tax assets (liabilities) were attributable to:
|
|
|
|
|
|
|
|
|
|
|
|
|
Deferred Tax Balances |
December 31, 2025 |
|
December 31, 2024 |
|
(In millions) |
Assets |
|
Liabilities |
|
Assets |
|
Liabilities |
|
Property |
$ |
— |
|
$ |
146 |
|
$ |
— |
|
$ |
87 |
|
Operating loss and tax credit carryforwards 1 |
|
274 |
|
|
— |
|
|
209 |
|
|
— |
|
Accrued employee benefits |
|
87 |
|
|
— |
|
|
103 |
|
|
— |
|
Other accruals and reserves |
|
260 |
|
|
— |
|
|
120 |
|
|
— |
|
Intangibles |
|
— |
|
|
1,693 |
|
|
— |
|
|
1,791 |
|
Inventory |
|
179 |
|
|
— |
|
|
132 |
|
|
— |
|
Research and development capitalization |
|
530 |
|
|
— |
|
|
568 |
|
|
— |
|
Investments |
|
38 |
|
|
— |
|
|
39 |
|
|
— |
|
Unrealized exchange gains/losses |
|
— |
|
|
3 |
|
|
— |
|
|
2 |
|
Other — net |
|
123 |
|
|
— |
|
|
72 |
|
|
— |
|
Subtotal |
$ |
1,491 |
|
$ |
1,842 |
|
$ |
1,243 |
|
$ |
1,880 |
|
Valuation allowances 2 |
|
(403 |
) |
|
— |
|
|
(301 |
) |
|
— |
|
Total |
$ |
1,088 |
|
$ |
1,842 |
|
$ |
942 |
|
$ |
1,880 |
|
Net deferred tax asset (liability) |
$ |
(754 |
) |
|
|
$ |
(938 |
) |
|
|
1.Primarily related to tax loss and credit carryforwards from operations in the United States, Argentina, Brazil, Mexico, and Switzerland.
2.During the year ended December 31, 2024, the Company established a valuation allowance against the net deferred tax asset position of a legal entity in Brazil in the amount of $88 million.
Details of the Seed Business' operating loss and tax credit carryforwards are shown in the following table:
|
|
|
|
|
|
|
|
|
Operating Loss and Tax Credit Carryforwards |
Deferred Tax Asset |
|
(In millions) |
December 31, 2025 |
|
December 31, 2024 |
|
Operating loss carryforwards |
|
|
|
|
|
|
Expire within 5 years |
|
$ |
58 |
|
|
$ |
57 |
|
Expire after 5 years or indefinite expiration |
|
|
111 |
|
|
|
85 |
|
Total operating loss carryforwards |
|
$ |
169 |
|
|
$ |
142 |
|
Tax credit carryforwards |
|
|
|
|
|
|
Expire within 5 years |
|
$ |
— |
|
|
$ |
— |
|
Expire after 5 years or indefinite expiration |
|
|
105 |
|
|
|
67 |
|
Total tax credit carryforwards |
|
$ |
105 |
|
|
$ |
67 |
|
Total operating loss and tax credit carryforwards |
|
$ |
274 |
|
|
$ |
209 |
|
A reconciliation of the beginning and ending amount of gross unrecognized tax benefits is as follows:
|
|
|
|
|
|
|
|
|
|
|
|
|
Total Gross Unrecognized Tax Benefits |
For the Year Ended December 31, |
|
(In millions) |
2025 |
|
2024 |
|
2023 |
|
Total unrecognized tax benefits as of beginning of period |
|
$ |
67 |
|
|
$ |
81 |
|
|
$ |
77 |
|
Decreases related to positions taken on items from prior years |
|
|
- |
|
|
|
(2 |
) |
|
|
— |
|
Increases related to positions taken on items from prior years |
|
|
74 |
|
|
|
1 |
|
|
|
— |
|
Increases related to positions taken in the current year |
|
|
3 |
|
|
|
4 |
|
|
|
6 |
|
Settlement of uncertain tax positions with tax authorities |
|
|
(8 |
) |
|
|
(15 |
) |
|
|
(2 |
) |
Decreases due to expiration of statutes of limitations |
|
|
- |
|
|
|
— |
|
|
|
— |
|
Exchange (gain) loss |
|
|
(1 |
) |
|
|
(2 |
) |
|
|
— |
|
Total unrecognized tax benefits as of end of period |
|
$ |
135 |
|
|
$ |
67 |
|
|
$ |
81 |
|
Total unrecognized tax benefits that, if recognized, would impact the effective tax rate |
|
$ |
135 |
|
|
$ |
67 |
|
|
$ |
81 |
|
Total amount of interest and penalties (benefits) recognized in Provision for (benefit from) income taxes |
|
$ |
(5 |
) |
|
$ |
1 |
|
|
$ |
3 |
|
Total accrual for interest and penalties associated with unrecognized tax benefits at end of period |
|
$ |
20 |
|
|
$ |
25 |
|
|
$ |
23 |
|
Each year the Seed Business files hundreds of tax returns in the various national, state and local income taxing jurisdictions in which it operates. These tax returns are subject to examination and possible challenge by the tax authorities. Positions challenged by the tax authorities may be settled or appealed by the Company. As a result, there is an uncertainty in income taxes recognized in the Seed Business' financial statements in accordance with accounting for income taxes and accounting for uncertainty in income taxes. As of December 31, 2025 and 2024, the Company has an advance deposit balance of $95 million and $100 million, respectively, to a foreign taxing authority, partially as a prerequisite to petition the court related to an open tax examination. These payments are accounted for as a prepaid asset, included in Other assets in the Combined Balance Sheets.
Tax years that remain subject to examination for the Seed Business' major tax jurisdictions are shown below:
|
|
Tax Years Subject to Examination by Major Tax Jurisdiction at December 31, 2025 |
Earliest Open Year |
Jurisdiction |
|
Argentina |
2018 |
Brazil |
2019 |
Canada |
2017 |
France |
2023 |
India |
2023 |
Italy |
2019 |
South Africa |
2022 |
Spain |
2023 |
Switzerland |
2020 |
United States: |
|
Federal income tax |
2012 |
State and local income tax |
2012 |
Distributions of profits from non-U.S. subsidiaries are subject to certain taxes upon repatriation, primarily where foreign withholding taxes apply; these taxes are partially offset by U.S. foreign tax credits. The Seed Business is asserting indefinite reinvestment related to certain investments in foreign subsidiaries. Determination of the amount of unrecognized deferred tax liability related to indefinitely reinvested profits is not feasible primarily due to the Seed Business' legal entity structure and the complexity of U.S. and local tax laws.
On July 4, 2025, the One Big Beautiful Bill Act ("OBBBA") was signed into law, enacting changes in a wide array of policy areas, including federal tax law. The impacts of OBBBA are included in the financial statements for the year ended December 31, 2025, including the reinstatement of expensing of domestic research and development expenditures.
In December 2021, the Organization for Economic Cooperation and Development ("OECD") released the Pillar Two Model rules (also referred to as the global minimum tax or Global Anti-Base Erosion "GloBE" rules), which were designed to ensure multinational enterprises pay a certain level of tax within every jurisdiction they operate. Several jurisdictions in which the Seed Business operates have enacted these rules, with a January 1, 2024 effective date. For the year ended December 31, 2025, there is no material tax charge associated with these rules. The Seed Business will continue to monitor and evaluate legislative developments.
NOTE 8 — ACCOUNTS AND NOTES RECEIVABLE — NET
|
|
|
|
|
|
|
|
|
(In millions) |
December 31, 2025 |
|
December 31, 2024 |
|
Accounts receivable – trade 1 |
|
$ |
1,263 |
|
|
$ |
1,192 |
|
Notes receivable – trade 1,2 |
|
|
104 |
|
|
|
128 |
|
Other 3 |
|
|
487 |
|
|
|
484 |
|
Total accounts and notes receivable - net |
|
$ |
1,854 |
|
|
$ |
1,804 |
|
1.Accounts and notes receivable – trade are net of allowances of $144 million and $110 million at December 31, 2025 and 2024, respectively.
2.Notes receivable – trade primarily consists of receivables for deferred payment loan programs for the sale of Seed products to customers. These loans have terms of one year or less and are primarily concentrated in the United States. The Company maintains a rigid pre-approval process for extending credit to customers in order to manage overall risk and exposure associated with credit losses. As of December 31, 2025 and 2024, there were no significant impairments related to current loan agreements.
3.Other includes receivables in relation to royalties, value added tax, general sales tax and other taxes. No individual group represents more than five percent of total current assets. In addition, Other includes amounts due from nonconsolidated affiliates of $63 million and $85 million as of December 31, 2025 and 2024, respectively.
Accounts and notes receivable are carried at the expected amount to be collected, which approximates fair value. The Seed Business establishes the allowance for doubtful receivables using a loss-rate method where the loss rate is developed using past events, historical experience, current conditions and forecasts that affect the collectability of the financial assets.
The following table summarizes changes in the allowance for doubtful receivables for the years ended December 31, 2025 and 2024 respectively:
|
|
|
|
|
(In millions) |
|
|
Balance at December 31, 2023 |
|
$ |
117 |
|
Net provision for credit losses |
|
|
25 |
|
Other - net of write-offs charged against allowance |
|
|
(32 |
) |
Balance at December 31, 2024 |
|
$ |
110 |
|
Net provision for credit losses |
|
|
64 |
|
Other - net of write-offs charged against allowance |
|
|
(30 |
) |
Balance at December 31, 2025 |
|
$ |
144 |
|
The Seed Business enters into various factoring agreements with third-party financial institutions to sell its trade receivables under both recourse and non-recourse agreements in exchange for cash proceeds. These financing arrangements result in a transfer of the Seed Business' receivables and risks to the third party. As these transfers qualify as true sales under the applicable accounting guidance, the receivables are derecognized from the Combined Balance Sheets upon transfer, and the Seed Business receives a payment for the receivables from the third party within a mutually agreed-upon time period. For arrangements involving an element of recourse, which is typically provided through a guarantee of accounts in the event of customer default, the guarantee obligation is measured using market data from similar transactions and reported as a current liability in the Combined Balance Sheets.
Trade receivables sold under these agreements were $59 million, $61 million and $55 million for the years ended December 31, 2025, 2024 and 2023, respectively. The trade receivables sold that remained outstanding under these agreements which include an element of recourse as of December 31, 2025 and 2024 were $4 million and $13 million, respectively. The net proceeds received were included in cash provided by (used for) operating activities, in the Combined Statements of Cash Flows. The difference between the carrying amount of the trade receivables sold and the sum of the cash received is recorded as a loss on sale of receivables in Other income (expense) - net in the Combined Statements of Operations. The loss on sale of receivables were $1 million, $5 million and $12 million for the years ended December 31, 2025, 2024 and 2023, respectively. See Note 14 - Commitments and Contingent Liabilities, to the Combined Financial Statements, for additional information on the Company’s guarantees.
NOTE 9 — INVENTORIES
|
|
|
|
|
|
|
|
|
(In millions) |
December 31, 2025 |
|
December 31, 2024 |
|
Finished products |
|
$ |
1,946 |
|
|
$ |
1,855 |
|
Semi-finished products |
|
|
1,144 |
|
|
|
1,076 |
|
Raw materials and supplies |
|
|
248 |
|
|
|
273 |
|
Total inventories |
|
$ |
3,338 |
|
|
$ |
3,204 |
|
NOTE 10 — PROPERTY, PLANT AND EQUIPMENT
|
|
|
|
|
|
|
|
|
(In millions) |
December 31, 2025 |
|
December 31, 2024 |
|
Land and land improvements |
|
$ |
288 |
|
|
$ |
273 |
|
Buildings |
|
|
1,060 |
|
|
|
981 |
|
Machinery and equipment |
|
|
2,889 |
|
|
|
2,574 |
|
Construction in progress |
|
|
226 |
|
|
|
231 |
|
Total property, plant, and equipment |
|
$ |
4,463 |
|
|
$ |
4,059 |
|
Accumulated depreciation |
|
|
(2,002 |
) |
|
|
(1,715 |
) |
Total property, plant, and equipment - net |
|
$ |
2,461 |
|
|
$ |
2,344 |
|
Buildings, machinery and equipment and land improvements are depreciated over useful lives on a straight-line basis ranging from 2 to 25 years. Capitalizable costs associated with computer software for internal use are amortized on a straight-line basis over 2 to 7 years.
|
|
|
|
|
|
|
|
|
|
|
|
|
|
For the Year Ended December 31, |
|
(In millions) |
2025 |
|
2024 |
|
2023 |
|
Depreciation expense |
|
$ |
317 |
|
|
$ |
304 |
|
|
$ |
294 |
|
NOTE 11 — GOODWILL AND OTHER INTANGIBLE ASSETS
Goodwill
The following table summarizes changes in the carrying amount of goodwill by segment for the years ended December 31, 2025, 2024 and 2023, respectively:
|
|
|
|
|
|
|
|
|
|
|
|
|
(In millions) |
Americas |
|
Rest of World |
|
Total |
|
Balance at December 31, 2022 |
|
$ |
4,856 |
|
|
$ |
489 |
|
|
$ |
5,345 |
|
Currency translation adjustment |
|
|
70 |
|
|
|
7 |
|
|
|
77 |
|
Balance at December 31, 2023 |
|
$ |
4,926 |
|
|
$ |
496 |
|
|
$ |
5,422 |
|
Currency translation adjustment |
|
|
(94 |
) |
|
|
(2 |
) |
|
$ |
(96 |
) |
Balance at December 31, 2024 |
|
$ |
4,832 |
|
|
$ |
494 |
|
|
$ |
5,326 |
|
Currency translation adjustment |
|
|
(14 |
) |
|
|
— |
|
|
|
(14 |
) |
Balance at December 31, 2025 |
|
$ |
4,818 |
|
|
$ |
494 |
|
|
$ |
5,312 |
|
The Company tests goodwill and other indefinite-lived intangible assets for impairment annually (during the fourth quarter), or more frequently when events or changes in circumstances indicate it is more likely than not that the fair value of a reporting unit has declined below its carrying value. Goodwill is evaluated for impairment using qualitative and / or quantitative testing procedures. The Company performs goodwill impairment testing at the reporting unit level, which is defined as the operating segment or one level below the operating segment. One level below the operating segment, or component, is a business in which discrete financial information is available and regularly reviewed by segment management. The Company aggregates certain components into reporting units based on economic similarities.
The Company performed annual quantitative testing on both of its reporting units for the years ended December 31, 2024 and 2023. The assessment was performed using a combination of the discounted cash flow model (a form of the income approach) and the market approach. No goodwill impairment charges were necessary for the years ended December 31, 2024 or 2023.
Based on the annual qualitative goodwill impairment analyses performed for the year ended December 31, 2025, it was concluded more likely than not that the fair value of each reporting unit exceeded its respective carrying value and, therefore, a quantitative test was not performed. No goodwill impairment charge was necessary for the year ended December 31, 2025.
As of December 31, 2025, accumulated impairment losses on goodwill were $2,500 million.
Other Intangible Assets
The gross carrying amounts and accumulated amortization of other intangible assets by major class are as follows:
|
|
|
|
|
|
|
|
|
|
|
|
|
|
|
|
|
|
|
|
|
|
|
|
|
(In millions) |
December 31, 2025 |
|
December 31, 2024 |
|
|
Gross |
|
Accumulated
Amortization |
|
Net |
|
Gross |
|
Accumulated
Amortization |
|
Net |
|
Intangible assets subject to amortization (finite-lived): |
|
|
|
|
|
|
|
|
|
|
|
|
|
|
|
|
|
|
Germplasm |
|
$ |
6,291 |
|
|
$ |
(1,587 |
) |
|
$ |
4,704 |
|
|
$ |
6,291 |
|
|
$ |
(1,336 |
) |
|
$ |
4,955 |
|
Customer-related |
|
|
1,659 |
|
|
|
(726 |
) |
|
|
933 |
|
|
|
1,666 |
|
|
|
(642 |
) |
|
|
1,024 |
|
Developed technology |
|
|
1,007 |
|
|
|
(854 |
) |
|
|
153 |
|
|
|
981 |
|
|
|
(798 |
) |
|
|
183 |
|
Trademarks/trade names |
|
|
1,868 |
|
|
|
(393 |
) |
|
|
1,475 |
|
|
|
1,868 |
|
|
|
(317 |
) |
|
|
1,551 |
|
Other 1 |
|
|
143 |
|
|
|
(143 |
) |
|
|
— |
|
|
|
152 |
|
|
|
(146 |
) |
|
|
6 |
|
Total other intangible assets |
|
$ |
10,968 |
|
|
$ |
(3,703 |
) |
|
$ |
7,265 |
|
|
$ |
10,958 |
|
|
$ |
(3,239 |
) |
|
$ |
7,719 |
|
1.Primarily consists of sales and farmer networks, marketing and manufacturing alliances and noncompetition agreements.
The aggregate pre-tax amortization expense for finite-lived intangible assets was $489 million, $525 million and $538 million for the years ended December 31, 2025, 2024 and 2023, respectively.
Total estimated amortization expense for the next five fiscal years is as follows:
|
|
|
|
|
(In millions) |
|
|
|
2026 |
|
$ |
481 |
|
2027 |
|
|
427 |
|
2028 |
|
|
427 |
|
2029 |
|
|
427 |
|
2030 |
|
|
427 |
|
NOTE 12 — LEASES
The Seed Business has operating and finance leases for real estate, transportation, certain machinery and equipment, and information technology assets. The Seed Business' leases have remaining lease terms of approximately 1 to 26 years. For purposes of calculating operating lease liabilities, lease terms may be deemed to include options to extend the lease when it is reasonably certain that the Seed Business will exercise that option. Some leasing arrangements require variable payments that are dependent on usage, output, or may vary for other reasons, such as insurance and tax payments. The variable lease payments are not presented as part of the initial right-of-use asset or lease liability.
Certain of the Seed Business' leases include residual value guarantees. These residual value guarantees are based on a percentage of the lessor's asset acquisition price and the amount of such guarantee generally declines over the course of the lease term. The portion of residual value guarantees that are probable of payment are included in the related lease liability. At December 31, 2025, the Seed Business has future maximum payments for residual value guarantees in operating leases of $56 million with final expirations through 2035. The Seed Business' lease agreements do not contain any material restrictive covenants.
The components of lease cost for the years ended December 31, 2025, 2024 and 2023 were as follows:
|
|
|
|
|
|
|
|
|
|
|
|
|
|
For the Year Ended December 31, |
|
(In millions) |
2025 |
|
2024 |
|
2023 |
|
Operating lease cost |
|
$ |
106 |
|
|
$ |
121 |
|
|
$ |
118 |
|
Finance lease cost |
|
|
|
|
|
|
|
|
|
Amortization of right-of-use assets |
|
|
— |
|
|
|
1 |
|
|
|
1 |
|
Total finance lease cost |
|
$ |
— |
|
|
$ |
1 |
|
|
$ |
1 |
|
Short-term lease cost |
|
|
30 |
|
|
|
21 |
|
|
|
18 |
|
Variable lease cost |
|
|
5 |
|
|
|
7 |
|
|
|
9 |
|
Total lease cost |
|
$ |
141 |
|
|
$ |
150 |
|
|
$ |
146 |
|
Supplemental cash flow information related to leases for the years ended December 31, 2025, 2024 and 2023 was as follows:
|
|
|
|
|
|
|
|
|
|
|
|
|
|
For the Year Ended December 31, |
|
(In millions) |
2025 |
|
2024 |
|
2023 |
|
Cash paid for amounts included in the measurement of lease liabilities: |
|
|
|
|
|
|
|
|
|
Operating cash outflows from operating leases |
|
$ |
110 |
|
|
$ |
133 |
|
|
$ |
121 |
|
Financing cash outflows from finance leases |
|
$ |
— |
|
|
$ |
1 |
|
|
$ |
1 |
|
New leases entered into during the years ended December 31, 2025 and 2024 were not material, on an individual basis. Supplemental balance sheet information related to leases is as follows:
|
|
|
|
|
|
|
|
|
(In millions) |
December 31, 2025 |
|
December 31, 2024 |
|
Operating Leases |
|
|
|
|
|
|
Operating lease right-of-use assets 1 |
|
$ |
297 |
|
|
$ |
291 |
|
Current operating lease liabilities 2 |
|
|
85 |
|
|
|
82 |
|
Noncurrent operating lease liabilities 3 |
|
|
212 |
|
|
|
214 |
|
Total operating lease liabilities |
|
$ |
297 |
|
|
$ |
296 |
|
|
|
|
|
|
|
|
Finance Leases |
|
|
|
|
|
|
Property, plant, and equipment, gross |
|
$ |
8 |
|
|
$ |
8 |
|
Accumulated depreciation |
|
|
(8 |
) |
|
|
(7 |
) |
Property, plant, and equipment, net |
|
$ |
— |
|
|
$ |
1 |
|
Short-term borrowings and finance lease obligations |
|
|
— |
|
|
|
— |
|
Long-term debt |
|
|
— |
|
|
|
— |
|
Total finance lease liabilities |
|
$ |
— |
|
|
$ |
— |
|
1.Included in Other assets in the Combined Balance Sheets.
2.Included in Accrued and other current liabilities in the Combined Balance Sheets.
3.Included in Other noncurrent obligations in the Combined Balance Sheets.
The Seed Business utilizes the incremental borrowing rate in determining the present value of lease payments unless the implicit rate is readily determinable.
|
|
|
|
|
|
|
|
|
Lease Term and Discount Rate |
December 31, 2025 |
|
December 31, 2024 |
|
Weighted-average remaining lease term (years) |
|
|
|
|
|
|
Operating leases |
|
|
5.33 |
|
|
|
5.80 |
|
Finance leases |
|
|
— |
|
|
|
0.38 |
|
Weighted average discount rate |
|
|
|
|
|
|
Operating leases |
|
|
3.89 |
% |
|
|
3.24 |
% |
Finance leases |
|
|
— |
% |
|
|
3.29 |
% |
Maturities of lease liabilities are as follows:
|
|
|
|
|
Maturity of Lease Liabilities at December 31, 2025
(In millions) |
Operating Leases |
|
2026 |
|
$ |
91 |
|
2027 |
|
|
64 |
|
2028 |
|
|
52 |
|
2029 |
|
|
41 |
|
2030 |
|
|
27 |
|
2031 and thereafter |
|
|
47 |
|
Total lease payments |
|
$ |
322 |
|
Less: Interest |
|
|
25 |
|
Present value of lease liabilities |
|
$ |
297 |
|
NOTE 13 — SHORT-TERM BORROWINGS AND AVAILABLE CREDIT FACILITIES
The following table summarizes the Seed Business' short-term borrowings:
|
|
|
|
|
|
|
|
|
Short-Term Borrowings |
|
|
|
|
|
|
(In millions) |
December 31, 2025 |
|
December 31, 2024 |
|
Foreign loans |
|
$ |
112 |
|
|
$ |
— |
|
Domestic loans |
|
|
— |
|
|
|
15 |
|
Total short-term borrowings |
|
$ |
112 |
|
|
$ |
15 |
|
Short-term borrowings consist of loans originated locally to finance subsidiary working capital needs and capital expenditures. The weighted average interest rate related to these loans was 6.02% and 5.35% at December 31, 2025 and 2024, respectively.
Uncommitted Credit Facilities and Outstanding Letters of Credit
Unused bank credit lines on uncommitted credit facilities were $413 million at December 31, 2025. These lines are available to support short-term liquidity needs and general corporate purposes, including letters of credit. Outstanding letters of credit were $32 million at December 31, 2025. These letters of credit support commitments that are made in the ordinary course of business.
NOTE 14 — COMMITMENTS AND CONTINGENT LIABILITIES
Guarantees
Obligations for Supplier Finance Programs
The Seed Business enters into supplier finance programs with various finance providers in which the Seed Business agrees to pay these finance providers the stated amount of confirmed invoices from participating suppliers by the original maturity date. The Seed Business or the finance provider may terminate the agreement upon providing at least thirty days’ written notice. The payment terms that the Seed Business has with its finance providers under supplier finance programs are less than one year. At December 31, 2025 and 2024, the outstanding obligations under supplier finance programs were approximately $53 million and $51 million, respectively, and included within Accounts payable in the Combined Balance Sheets.
The rollforward of the Seed Business’outstanding obligations confirmed as valid under its supplier finance programs for the periods ended December 31, 2025 and 2024 is as follows:
|
|
|
|
|
(In millions) |
|
|
Confirmed obligations outstanding at December 31, 2023 |
|
$ |
44 |
|
Invoices confirmed during the year |
|
|
176 |
|
Confirmed invoices paid during the year |
|
|
(169 |
) |
Confirmed obligations outstanding at December 31, 2024 |
|
$ |
51 |
|
Invoices confirmed during the year |
|
|
209 |
|
Confirmed invoices paid during the year |
|
|
(207 |
) |
Confirmed obligations outstanding at December 31, 2025 |
|
$ |
53 |
|
Obligations for Customers and Other Third Parties
The Seed Business has directly guaranteed various debt obligations under agreements with third parties related to customers and other third parties. At December 31, 2025 and 2024, the Seed Business had directly guaranteed $10 million and $5 million, respectively, of such obligations. These amounts represent the maximum potential amount of future (undiscounted) payments that the Seed Business could be required to make under the guarantees in the event of default by the guaranteed party. The maximum future payments include $1 million and $4 million of guarantees related to the various factoring agreements that the Seed Business enters into with third-party financial institutions to sell its trade receivables at December 31, 2025 and 2024, respectively. Refer to Note 8 - Accounts and Notes Receivable - Net, to the Combined Financial Statements, for additional information.
The Seed Business assesses the payment/performance risk by assigning default rates based on the duration of the guarantees. These default rates are assigned based on the external credit rating of the counterparty or through internal credit analysis and historical default history for counterparties that do not have published credit ratings. For counterparties without an external rating or available credit history, a cumulative average default rate is used.
Litigation
The Seed Business is subject to various legal proceedings, including, but not limited to, product liability, intellectual property, antitrust, commercial, property damage, personal injury, environmental and regulatory matters arising out of the normal course of its current businesses. It is not possible to predict the outcome of these various proceedings, as considerable uncertainty exists. The Seed Business records accruals for legal matters when the information available indicates that it is probable that a liability has been incurred and the amount of the loss can be reasonably estimated. Accruals may reflect the impact and status of negotiations, settlements, rulings, advice from counsel and other information and events that may pertain to a particular matter. For the litigation matters discussed below, management believes that it is reasonably possible that the Seed Business could incur liabilities in excess of amounts accrued, for which the ultimate liability could be material to the results of operations and the cash flows in the period recognized. However, the Seed Business is unable to estimate the possible loss beyond amounts accrued due to various reasons, including, among others, that the underlying matters are either in early stages and/or have significant factual issues to be resolved. In addition, even when the Seed Business believes it has substantial defenses, the Seed Business may consider settlement of matters if it believes it is in the best interest of the Company. At December 31, 2025 and 2024, current accrued litigation was $598 million and $9 million, respectively, within accrued and other current liabilities. The balance at December 31, 2025 was comprised primarily of the Bayer resolution payment discussed in the section entitled "Bayer Dispute.".
Bayer Dispute
In August 2022, Bayer CropScience LLP (“Bayer”) filed a breach of contract/declaratory judgment lawsuit in Delaware state court against Corteva relating to an agrobacterium cross-license agreement and Enlist E3® soybeans. Bayer alleged that Corteva practiced two Bayer patents in developing Enlist E3® soybeans, and therefore, is entitled pursuant to the terms of the cross-license agreement to royalties for sales between 2019 through 2029, along with interest. Also in August 2022, Corteva filed a lawsuit against Bayer in federal court in Delaware for alleged infringement of Corteva’s patented AAD-1 herbicide resistance technology used in Enlist® corn and eventually amended its complaints to include allegations related to additional patents that are closely related to this patented technology for soybeans.
In October 2022, Corteva also filed a lawsuit against Bayer in Delaware state court seeking a declaration that, under the terms of Corteva’s licensing agreement and the law, Bayer is not entitled to collect patent royalties on the Roundup Ready® Corn 2 trait after Bayer’s U.S. patent protection expires, and therefore is no longer required to pay royalties under the licensing agreement and entitled to recover relevant royalties paid.
In December 2023, the Patent Trial and Appeal Board ("PTAB") authorized an Inter Partes Review (“IPR”) proceeding initiated by Bayer to review the patentability of three patents subject to the AAD-1 litigation. Inari Agriculture, Inc. joined the IPR proceeding. In December 2024, the PTAB issued a decision invalidating these patents on the basis they were unpatentable. Corteva appealed this decision and Corteva's AAD-1 lawsuit remains stayed during pendency of the IPR appeal. Corteva holds numerous additional patents covering its Enlist® traits or Enlist® weed control system. Therefore, the IPR process is not expected to impact our ability to license and protect Enlist E3® traits.
As of January 2026, the parties agreed to settle the agrobacterium cross-license agreement dispute. In addition, Corteva and Bayer resolved several other disputes regarding post-patent royalties and other matters, including post-patent regulatory support, resulting in the termination or amendment of the related licenses, as applicable. As part of the resolution of these matters, the cross-license agreement has been terminated and Corteva agreed to drop its AAD-1 patent claims against Bayer, as well as a payment of $610 million of which approximately $546 million was paid through the first quarter of 2026 and the remainder due by September 15, 2026. Also as a result of the resolution of this litigation and the related license terminations and amendments, potential royalty obligations for Corteva’s Enlist E3® soybeans, as well as future royalty payments due to Bayer under other licensing agreements in dispute were terminated. The settlement agreements support Corteva’s product out-licensing growth in competitive corn, cotton and canola markets, including for the out-licensing of above and below ground triple-stack corn technology. In conjunction with resolution of these matters, the companies also agreed to new cotton licensing arrangements at terms reflective of market rates. There is no remaining litigation between the parties.
Environmental
Accruals for environmental matters are recorded when it is probable that a liability has been incurred and the amount of the liability can be reasonably estimated based on current law and existing technologies. These obligations are included in Accrued and other current liabilities and Other noncurrent obligations in the Combined Balance Sheets. It is reasonably possible that environmental remediation and restoration costs in excess of amounts accrued could have a material impact on the Company’s results of operations, financial condition and cash flows. Inherent uncertainties exist in these estimates primarily due to unknown conditions, changing governmental regulations and legal standards regarding liability, and emerging remediation technologies for handling site remediation and restoration. At December 31, 2025 and 2024, the Seed Business’ accruals for environmental remediation obligations were $42 million and $16 million, respectively, substantially all of which relates to the AltEn Facility matter.
Nebraska Department of Environment and Energy, AltEn Facility
The EPA and the Nebraska Department of Environment and Energy (“NDEE”) are pursuing investigations, response and removal actions, litigation and enforcement action related to an ethanol plant located near Mead, Nebraska that is owned and operated by AltEn LLC (“AltEn”). The agencies have alleged violations under the Resource Conservation and Recovery Act (“RCRA”) and other federal and state laws stemming from AltEn’s lack of compliance with the terms and conditions of its operating permits and other regulatory requirements. Corteva's Seed Business is one of six seed companies, who were customers of AltEn (collectively, the “Facility Response Group”), participating in the NDEE’s Voluntary Cleanup Program to address certain interim remediation needs at the site. In February 2022, the Facility Response Group filed a lawsuit against AltEn and certain of its affiliates to preserve certain contractual and common law indemnification claims. In March 2025, the Facility Response Group reached an agreement to settle this lawsuit with AltEn. The agreement, among other things, limits AltEn’s ability to dispose of the property or take any adverse action with respect to its property or assets. As of December 31, 2025, an accrual was established for the Seed Business’ estimated voluntary contribution to the solid waste and wastewater remedial action plans for the AltEn location.
NOTE 15 — PENSION PLANS AND OTHER POSTRETIREMENT BENEFITS
The Seed Business offers various long-term benefits to its employees. Where permitted by applicable law, the Seed Business reserves the right to change, modify or discontinue the plans.
Defined Benefit Pension Plans
The Seed Business has both funded and unfunded noncontributory defined benefit pension plans covering employees in the U.S. and non-U.S. countries. The Seed Business’ funding policy is consistent with the funding requirements of federal laws and regulations. Pension coverage for employees of the Seed Business' non-U.S. consolidated subsidiaries is provided, to the extent deemed appropriate, through separate plans. Obligations under such plans are funded by depositing funds with trustees, covered by insurance contracts, or remain unfunded.
The Seed Business' U.S. defined benefit pension plans (the “U.S. pension plans”) are unfunded. Effective January 1, 2007, most new hires were no longer eligible to participate in the U.S. pension plans. On November 30, 2018, the pay and service amounts used to calculate the pension benefits for active employees who participate in the U.S. pension plans were frozen. As a result, no participants are currently accruing additional benefits in the U.S. pension plans.
The Seed Business made total contributions of $15 million, $17 million and $18 million to its pension plans for the years ended December 31, 2025, 2024 and 2023, respectively. The Seed Business expects to contribute approximately $15 million to its pension plans in 2026.
The weighted-average assumptions used to determine pension plan obligations for all pension plans are summarized in the table below:
|
|
|
|
|
|
|
|
|
Weighted-Average Assumptions used to Determine Benefit Obligations |
December 31, 2025 |
|
December 31, 2024 |
|
Discount rate |
|
|
7.09 |
% |
|
|
6.85 |
% |
Rate of increase in future compensation levels 1 |
|
|
2.82 |
% |
|
|
2.83 |
% |
1.The rate of compensation increase excludes U.S. pension plans since the employees who participate in the U.S. pension plans no longer accrue additional benefits for future service and eligible compensation.
The weighted-average assumptions used to determine net periodic benefit costs for all pension plans are summarized in the table below:
|
|
|
|
|
|
|
|
|
|
|
|
|
|
For the Year Ended December 31, |
|
Weighted-Average Assumptions used to Determine Net Periodic Benefit Cost |
2025 |
|
2024 |
|
2023 |
|
Discount rate |
|
|
6.85 |
% |
|
|
6.36 |
% |
|
|
6.81 |
% |
Rate of increase in future compensation levels 1 |
|
|
2.83 |
% |
|
|
2.89 |
% |
|
|
2.88 |
% |
Expected long-term rate of return on plan assets |
|
|
7.96 |
% |
|
|
8.06 |
% |
|
|
7.91 |
% |
1.The rate of compensation increase excludes U.S. pension plans since the employees who participate in the U.S. pension plans no longer accrue additional benefits for future service and eligible compensation.
Other Post-Employment Benefits
The Seed Business has historically provided medical, dental and life insurance benefits to certain pensioners and survivors. The majority of U.S. employees hired on or after January 1, 2007, and eligible employees under the age of 50 as of November 30, 2018, are not eligible to participate in the post-employment medical, dental and life insurance plans. Substantially all of the cost and liabilities for these retiree benefit plans are attributable to the U.S. benefit plans. The non-Medicare eligible retiree medical plan is contributory with costs shared between the Company and pensioners and survivors. For Medicare eligible pensioners and survivors, the Seed Business provides a company-funded Health Reimbursement Arrangement (“HRA”). In December 2020, the Seed Business amended its retiree medical, dental and life insurance plans to no longer provide retiree dental and life insurance benefits effective January 1, 2022 and to cap the Seed Business' portion of the cost of non-Medicare retiree medical coverage to the level in effect as of December 31, 2021.
The Seed Business also provides disability benefits to employees. In most countries, employee disability benefit plans are insured. In the U.S., these plans are generally self-insured. Obligations and expenses for self-insured plans are reflected in the change in projected benefit obligations table within this Note (Note 15).
The Seed Business' OPEB plans are unfunded and the cost of the approved claims is paid from operating cash flows. Pre-tax cash requirements to cover actual net claims costs and related administrative expenses were $11 million, $10 million and $11 million for the years ended December 31, 2025, 2024 and 2023, respectively. Changes in cash requirements reflect the net impact of per capita health care costs, demographic changes, plan amendments and changes in participant premiums, co-payments and deductibles. In 2026, the Seed Business expects to contribute approximately $11 million for its OPEB plans.
The weighted-average assumptions used to determine benefit obligations for OPEB plans are summarized in the table below:
|
|
|
|
|
|
|
|
|
Weighted-Average Assumptions used to Determine Benefit Obligations |
December 31, 2025 |
|
December 31, 2024 |
|
Discount rate |
|
|
5.60 |
% |
|
|
5.70 |
% |
The weighted-average assumptions used to determine net periodic benefit costs for the OPEB plans are summarized in the table below:
|
|
|
|
|
|
|
|
|
|
|
|
|
Weighted-Average Assumptions used to Determine Net Periodic Benefit Cost |
For the Year Ended December 31, |
|
|
2025 |
|
2024 |
|
2023 |
|
Discount rate |
|
|
5.70 |
% |
|
|
5.16 |
% |
|
|
5.36 |
% |
As of December 31, 2025, 2024 and 2023, health care cost trend rates do not impact the benefit obligations for the OPEB plans because of the 2020 OPEB Plan Amendments.
Assumptions
The Seed Business' U.S. plans are unfunded. For non-U.S. plans, assumptions for expected long-term rate of return on plan assets reflect economic assumptions applicable to each country.
In the U.S., the Seed Business calculates service costs and interest costs by applying individual spot rates from a yield curve (based on high-quality corporate bond yields) to the separate expected cash flows components of service cost and interest cost. Service cost and interest cost for all other plans are determined based on the single equivalent discount rates derived in determining those plan obligations.
For U.S. benefit plans, the discount rates utilized to measure the pension and other post-employment benefit obligations are based on the yield of high-quality corporate fixed income investments at the measurement date. Future expected actuarially determined cash flows are individually discounted at the spot rates under the Aon AA_Above Median yield curve (based on high-quality corporate bond yields) to arrive at the plan’s obligations as of the measurement date. For non-U.S. benefit plans, historically the Company utilized prevailing long-term high quality corporate bond indices to determine the discount rate, applicable to each country, at the measurement date.
The Seed Business adopts the most recently published mortality tables and mortality improvement scale released by the Society of Actuaries in measuring its U.S. pension and other post-employment benefit obligations. The effect of these adoptions is amortized into net periodic benefit cost for the years following the adoption.
Summarized information on the Seed Business' pension and other post-employment benefit plans is as follows:
|
|
|
|
|
|
|
|
|
|
|
|
|
|
|
|
|
|
Change in Projected Benefit Obligations, Plan Assets and Funded Status |
|
|
|
|
|
|
|
|
|
|
|
|
|
|
Defined Benefit Pension Plans |
|
|
Other Post-Employment Benefits |
|
|
For the Year Ended December 31, |
|
|
For the Year Ended December 31, |
|
(In millions) |
2025 |
|
2024 |
|
|
2025 |
|
2024 |
|
Change in benefit obligations: |
|
|
|
|
|
|
|
|
|
|
|
|
|
Benefit obligation at beginning of the period |
|
$ |
359 |
|
|
$ |
436 |
|
|
|
$ |
102 |
|
|
$ |
117 |
|
Service cost |
|
|
4 |
|
|
|
6 |
|
|
|
|
— |
|
|
|
— |
|
Interest cost |
|
|
26 |
|
|
|
23 |
|
|
|
|
5 |
|
|
|
6 |
|
Plan participants' contributions |
|
|
1 |
|
|
|
1 |
|
|
|
|
2 |
|
|
|
2 |
|
Actuarial (gain) loss |
|
|
(3 |
) |
|
|
(23 |
) |
|
|
|
3 |
|
|
|
(9 |
) |
Benefits paid |
|
|
(28 |
) |
|
|
(31 |
) |
|
|
|
(13 |
) |
|
|
(12 |
) |
Plan amendments |
|
|
1 |
|
|
|
(1 |
) |
|
|
|
— |
|
|
|
— |
|
New Plans/merger |
|
|
2 |
|
|
|
— |
|
|
|
|
— |
|
|
|
— |
|
Effect of foreign exchange rates |
|
|
29 |
|
|
|
(52 |
) |
|
|
|
1 |
|
|
|
(2 |
) |
Benefit obligation at end of the period |
|
$ |
391 |
|
|
$ |
359 |
|
|
|
$ |
100 |
|
|
$ |
102 |
|
|
|
|
|
|
|
|
|
|
|
|
|
|
|
Change in plan assets: |
|
|
|
|
|
|
|
|
|
|
|
|
|
Fair value of plan assets at beginning of the period |
|
$ |
217 |
|
|
$ |
276 |
|
|
|
$ |
— |
|
|
$ |
— |
|
Actual return on plan assets |
|
|
24 |
|
|
|
1 |
|
|
|
|
— |
|
|
|
— |
|
Employer contributions |
|
|
15 |
|
|
|
17 |
|
|
|
|
11 |
|
|
|
10 |
|
Plan participants' contributions |
|
|
1 |
|
|
|
1 |
|
|
|
|
2 |
|
|
|
2 |
|
Benefits paid |
|
|
(28 |
) |
|
|
(31 |
) |
|
|
|
(13 |
) |
|
|
(12 |
) |
Effect of foreign exchange rates |
|
|
21 |
|
|
|
(47 |
) |
|
|
|
— |
|
|
|
— |
|
Fair value of plan assets at end of the period |
|
$ |
250 |
|
|
$ |
217 |
|
|
|
$ |
— |
|
|
$ |
— |
|
Funded status |
|
|
|
|
|
|
|
|
|
|
|
|
|
Non-U.S. plans with plan assets |
|
$ |
3 |
|
|
$ |
(6 |
) |
|
|
$ |
— |
|
|
$ |
— |
|
All other plans 2,3 |
|
|
(144 |
) |
|
|
(136 |
) |
|
|
|
(100 |
) |
|
|
(102 |
) |
Funded status at end of the period |
|
$ |
(141 |
) |
|
$ |
(142 |
) |
|
|
$ |
(100 |
) |
|
$ |
(102 |
) |
|
|
|
|
|
|
|
|
|
|
|
|
|
|
|
|
|
|
Defined Benefit Pension Plans |
|
Other Post-Employment Benefits |
|
|
December 31, |
|
December 31, |
|
(In millions) |
2025 |
|
2024 |
|
2025 |
|
2024 |
|
Amounts recognized in the Combined Balance Sheets: |
|
|
|
|
|
|
|
|
|
|
|
|
Other assets |
|
$ |
8 |
|
|
$ |
1 |
|
|
$ |
— |
|
|
$ |
— |
|
Accrued and other current liabilities |
|
|
(12 |
) |
|
|
(9 |
) |
|
|
(11 |
) |
|
|
(12 |
) |
Pension and other post-employment benefits |
|
|
(137 |
) |
|
|
(134 |
) |
|
|
(89 |
) |
|
|
(90 |
) |
Net amount recognized |
|
$ |
(141 |
) |
|
$ |
(142 |
) |
|
$ |
(100 |
) |
|
$ |
(102 |
) |
|
|
|
|
|
|
|
|
|
|
|
|
|
Pretax amounts recognized in accumulated other comprehensive income (loss): |
|
|
|
|
|
|
|
|
|
|
|
|
Net gain (loss) |
|
$ |
27 |
|
|
$ |
17 |
|
|
$ |
24 |
|
|
$ |
28 |
|
Prior service benefit (cost) |
|
|
3 |
|
|
|
4 |
|
|
|
5 |
|
|
|
5 |
|
Pretax balance in accumulated other comprehensive income (loss) at end of year |
|
$ |
30 |
|
|
$ |
21 |
|
|
$ |
29 |
|
|
$ |
33 |
|
The gain related to the change in the pension benefit obligation for the period ended December 31, 2025 is primarily due to asset returns above the expected long-term rate and the increase in the discount rates
The accumulated benefit obligation for all pension plans was $381 million and $359 million at December 31, 2025 and 2024, respectively.
|
|
|
|
|
|
|
|
|
Pension Plans with Projected Benefit Obligations in Excess of Plan Assets |
December 31, 2025 |
|
December 31, 2024 |
|
(In millions) |
|
|
|
|
Projected benefit obligations |
|
$ |
164 |
|
|
$ |
241 |
|
Fair value of plan assets |
|
$ |
15 |
|
|
$ |
98 |
|
|
|
|
|
|
|
|
Pension Plans with Accumulated Benefit Obligations in Excess of Plan Assets |
December 31, 2025 |
|
December 31, 2024 |
|
(In millions) |
|
|
|
|
Accumulated benefit obligations |
|
$ |
160 |
|
|
$ |
151 |
|
Fair value of plan assets |
|
$ |
15 |
|
|
$ |
12 |
|
|
|
|
|
|
|
|
|
|
|
|
|
|
|
|
|
|
|
|
|
|
|
|
|
|
|
(In millions) |
Defined Benefit Pension Plans |
|
|
Other Post-Employment Benefits |
|
|
For the Year Ended December 31, |
|
|
For the Year Ended December 31, |
|
Components of net periodic benefit (credit) cost and amounts recognized in other comprehensive income (loss) |
2025 |
|
2024 |
|
2023 |
|
|
2025 |
|
2024 |
|
2023 |
|
Net Periodic Benefit (Credit) Cost: |
|
|
|
|
|
|
|
|
|
|
|
|
|
|
|
|
|
|
|
Service cost |
|
$ |
4 |
|
|
$ |
6 |
|
|
$ |
10 |
|
|
|
$ |
— |
|
|
$ |
— |
|
|
$ |
— |
|
Interest cost |
|
|
26 |
|
|
|
23 |
|
|
|
23 |
|
|
|
|
5 |
|
|
|
6 |
|
|
|
7 |
|
Expected return on plan assets |
|
|
(18 |
) |
|
|
(20 |
) |
|
|
(19 |
) |
|
|
|
— |
|
|
|
— |
|
|
|
— |
|
Amortization of unrecognized loss (gain) |
|
|
— |
|
|
|
— |
|
|
|
(1 |
) |
|
|
|
(1 |
) |
|
|
(1 |
) |
|
|
(1 |
) |
Amortization of prior service (benefit) cost |
|
|
(1 |
) |
|
|
(1 |
) |
|
|
(1 |
) |
|
|
|
— |
|
|
|
— |
|
|
|
— |
|
Settlement loss |
|
|
— |
|
|
|
— |
|
|
|
(1 |
) |
|
|
|
— |
|
|
|
— |
|
|
|
— |
|
Net periodic benefit (credit) cost - Total |
|
$ |
11 |
|
|
$ |
8 |
|
|
$ |
11 |
|
|
|
$ |
4 |
|
|
$ |
5 |
|
|
$ |
6 |
|
Changes in plan assets and benefit obligations recognized in other comprehensive income (loss): |
|
|
|
|
|
|
|
|
|
|
|
|
|
|
|
|
|
|
|
Net gain (loss) |
|
$ |
9 |
|
|
$ |
4 |
|
|
$ |
(14 |
) |
|
|
$ |
(3 |
) |
|
$ |
9 |
|
|
$ |
4 |
|
Amortization of unrecognized (gain) loss |
|
|
— |
|
|
|
— |
|
|
|
(1 |
) |
|
|
|
(1 |
) |
|
|
(1 |
) |
|
|
(1 |
) |
Prior service benefit (cost) |
|
|
(1 |
) |
|
|
1 |
|
|
|
— |
|
|
|
|
— |
|
|
|
— |
|
|
|
— |
|
Amortization of prior service (benefit) cost |
|
|
(1 |
) |
|
|
(1 |
) |
|
|
(1 |
) |
|
|
|
— |
|
|
|
— |
|
|
|
— |
|
Settlement loss |
|
|
— |
|
|
|
— |
|
|
|
(1 |
) |
|
|
|
— |
|
|
|
— |
|
|
|
— |
|
Effect of foreign exchange rates |
|
|
2 |
|
|
|
— |
|
|
|
3 |
|
|
|
|
— |
|
|
|
— |
|
|
|
— |
|
Total benefit (loss) recognized in other comprehensive income (loss), attributable to Seed Business |
|
$ |
9 |
|
|
$ |
4 |
|
|
$ |
(14 |
) |
|
|
$ |
(4 |
) |
|
$ |
8 |
|
|
$ |
3 |
|
Total recognized in net periodic benefit (credit) cost and other comprehensive income (loss) |
|
$ |
2 |
|
|
$ |
4 |
|
|
$ |
25 |
|
|
|
$ |
8 |
|
|
$ |
(3 |
) |
|
$ |
3 |
|
Estimated Future Benefit Payments
The estimated future benefit payments, reflecting expected future service, as appropriate, are presented in the following table:
|
|
|
|
|
|
|
|
|
Estimated Future Benefit Payments at December 31, 2025 |
|
|
|
|
|
|
(In millions) |
Defined Benefit Pension Plans |
|
Other Post-Employment Benefits |
|
2026 |
|
$ |
31 |
|
|
$ |
11 |
|
2027 |
|
|
31 |
|
|
|
11 |
|
2028 |
|
|
31 |
|
|
|
11 |
|
2029 |
|
|
32 |
|
|
|
10 |
|
2030 |
|
|
32 |
|
|
|
9 |
|
Years 2031 - 2035 |
|
|
167 |
|
|
|
38 |
|
Total |
|
$ |
324 |
|
|
$ |
90 |
|
Plan Assets
The U.S. pension plans are unfunded. Plan assets for non-U.S. plans are managed by professional investment firms unrelated to the Company. Pension trust funds are permitted to enter into certain contractual arrangements generally described as "derivatives." Derivatives are primarily used to reduce specific market risks, hedge currency and adjust portfolio duration and asset allocation in a cost-effective manner.
The weighted-average allocation for plan assets of the Company's pension plans is summarized as follows:
|
|
|
|
|
|
|
|
|
Allocation for Plan Assets |
December 31, 2025 |
|
December 31, 2024 |
|
Asset Category |
|
|
|
|
U.S. equity securities |
|
|
9 |
% |
|
|
7 |
% |
Non-U.S. equity securities |
|
9 |
|
|
7 |
|
Fixed income securities |
|
80 |
|
|
83 |
|
Hedge funds |
|
|
— |
|
|
1 |
|
Private market securities |
|
2 |
|
|
2 |
|
Total |
|
|
100 |
% |
|
|
100 |
% |
U.S. equity investments are primarily large-cap companies. Non-U.S. equity securities include varying market capitalization levels. Fixed income securities include corporate-issued, government-issued and asset-backed securities of both U.S. and non-U.S. issuers. Corporate debt investments include a range of credit risk and industry diversification. As the plan assets fund non-U.S. plans, non-U.S. fixed income securities are weighted heavier than U.S. fixed income securities. Other investments include hedge funds and private market securities such as interests in private equity and venture capital partnerships.
Fair value calculations may not be indicative of net realizable value or reflective of future fair values. Furthermore, although the Seed Business believes its valuation methods are appropriate and consistent with other market participants, the use of different methodologies or assumptions to determine the fair value of certain financial instruments could result in a different fair value measurement at the reporting date.
For pension plan assets classified as Level 1 measurements (measured using quoted prices in active markets), total fair value is either the price of the most recent trade at the time of the market close or the official close price, as defined by the exchange on which the asset is most actively traded on the last trading day of the period, multiplied by the number of units held without consideration of transaction costs.
For pension plan assets classified as Level 2 measurements, where the security is frequently traded in less active markets, fair value is based on the closing price at the end of the period; where the security is less frequently traded, fair value is based on the price a dealer would pay for the security or similar securities, adjusted for any terms specific to that asset or liability. Market inputs are obtained from well-established and recognized vendors of market data and subjected to tolerance and quality checks. For derivative assets and liabilities, standard industry models are used to calculate the fair value of the various financial instruments based on significant observable market inputs, such as foreign exchange rates, commodity prices, swap rates, interest rates and implied volatilities obtained from various market sources.
For pension plan assets classified as Level 3 measurements, total fair value is based on significant unobservable inputs including assumptions where there is little, if any, market activity for the investment. Investment managers, fund managers, or investment contract issuers provide valuations of the investment on a monthly or quarterly basis. These valuations are reviewed for reasonableness based on applicable sector, benchmark and company performance. Adjustments to valuations are made where appropriate. Where available, audited financial statements are obtained and reviewed for the investments as support for the manager’s investment valuation.
The tables below present the fair values of the Seed Business' pension assets by level within the fair value hierarchy, as described in Note 2 - Summary of Significant Accounting Policies, to the Combined Financial Statements:
|
|
|
|
|
|
|
|
|
|
|
|
|
|
|
|
|
Basis of Fair Value Measurements |
Total |
|
Level 1 |
|
Level 2 |
|
Level 3 |
|
For the year ended December 31, 2025 |
|
|
|
|
|
|
|
|
(In millions) |
|
|
|
|
|
|
|
|
Debt – government-issued |
|
|
141 |
|
|
|
— |
|
|
|
141 |
|
|
|
— |
|
Other |
|
|
14 |
|
|
|
— |
|
|
|
— |
|
|
|
14 |
|
Subtotal |
|
$ |
155 |
|
|
$ |
— |
|
|
$ |
141 |
|
|
$ |
14 |
|
Investments measured at net asset value |
|
|
|
|
|
|
|
|
|
|
|
|
Debt - government issued |
|
$ |
42 |
|
|
|
|
|
|
|
|
|
|
Debt - corporate-issued |
|
|
4 |
|
|
|
|
|
|
|
|
|
|
U.S. equity securities |
|
|
23 |
|
|
|
|
|
|
|
|
|
|
Non-U.S. equity securities |
|
|
22 |
|
|
|
|
|
|
|
|
|
|
Private market securities |
|
|
4 |
|
|
|
|
|
|
|
|
|
|
Total investments measured at net asset value |
|
$ |
95 |
|
|
|
|
|
|
|
|
|
|
Total |
|
$ |
250 |
|
|
|
|
|
|
|
|
|
|
|
|
|
|
|
|
|
|
|
|
|
|
|
|
|
|
|
Basis of Fair Value Measurements |
Total |
|
Level 1 |
|
Level 2 |
|
Level 3 |
|
For the year ended December 31, 2024 |
|
|
|
|
|
|
|
|
(In millions) |
|
|
|
|
|
|
|
|
U.S. equity securities 1 |
|
$ |
1 |
|
|
$ |
1 |
|
|
$ |
— |
|
|
$ |
— |
|
Non-U.S. equity securities |
|
|
2 |
|
|
|
2 |
|
|
|
— |
|
|
|
— |
|
Debt – government-issued |
|
|
117 |
|
|
|
— |
|
|
|
117 |
|
|
|
— |
|
Other |
|
|
11 |
|
|
|
— |
|
|
|
— |
|
|
|
11 |
|
Subtotal |
|
$ |
131 |
|
|
$ |
3 |
|
|
$ |
117 |
|
|
$ |
11 |
|
Investments measured at net asset value |
|
|
|
|
|
|
|
|
|
|
|
|
Debt - government issued |
|
$ |
39 |
|
|
|
|
|
|
|
|
|
|
Debt - corporate-issued |
|
|
3 |
|
|
|
|
|
|
|
|
|
|
U.S. equity securities |
|
|
20 |
|
|
|
|
|
|
|
|
|
|
Non-U.S. equity securities |
|
|
20 |
|
|
|
|
|
|
|
|
|
|
Hedge funds |
|
|
2 |
|
|
|
|
|
|
|
|
|
|
Private market securities |
|
|
2 |
|
|
|
|
|
|
|
|
|
|
Total investments measured at net asset value |
|
$ |
86 |
|
|
|
|
|
|
|
|
|
|
Total |
|
$ |
217 |
|
|
|
|
|
|
|
|
|
|
The following table summarizes the changes in fair value of Level 3 pension plan assets for the years ended December 31, 2025 and 2024:
|
|
|
|
|
|
|
|
|
Fair Value Measurement of |
Other |
|
Total |
|
Level 3 Pension Plan Assets |
|
|
|
|
(In millions) |
|
|
|
|
Balance at January 1, 2024 |
|
$ |
11 |
|
|
$ |
11 |
|
Actual return on assets: |
|
|
|
|
|
|
Relating to assets sold during the year ended December 31, 2024 |
|
|
— |
|
|
|
— |
|
Relating to assets held at December 31, 2024 |
|
|
— |
|
|
|
— |
|
Purchases, sales and settlements, net |
|
|
— |
|
|
|
— |
|
Transfers in or out of Level 3, net |
|
|
— |
|
|
|
— |
|
Balance at December 31, 2024 |
|
$ |
11 |
|
|
$ |
11 |
|
Actual return on assets: |
|
|
|
|
|
|
Relating to assets sold during the year ended December 31, 2025 |
|
|
— |
|
|
|
— |
|
Relating to assets held at December 31, 2025 |
|
|
2 |
|
|
|
2 |
|
Purchases, sales and settlements, net |
|
|
1 |
|
|
|
1 |
|
Transfers in or out of Level 3, net |
|
|
— |
|
|
|
— |
|
Balance at December 31, 2025 |
|
$ |
14 |
|
|
$ |
14 |
|
Defined Contribution Plans
The Seed Business provides defined contribution benefits to its employees, through its participation in Corteva's sponsored defined contribution plans. The most significant is the U.S. Retirement Savings Plan ("the Plan"), which covers almost all of the U.S. full-service employees. This Plan includes a non-leveraged Employee Stock Ownership Plan ("ESOP"). Employees are not required to participate in the ESOP and those who do are free to diversify out of the ESOP. The purpose of the Plan is to provide retirement savings benefits for employees and to provide employees an opportunity to become stockholders of the Company. The Plan is a tax qualified contributory profit sharing plan, with cash or deferred arrangement and any eligible employee of Corteva may participate. Currently, Corteva contributes 100 percent of the first six percent of the employee's contribution election and also contributes three percent of each eligible employee's eligible compensation regardless of the employee's contribution.
Corteva's contributions to the Plan on behalf of the Seed Business were $52 million, $52 million and $50 million for the years ended December 31, 2025, 2024 and 2023, respectively. Corteva's matching contributions vest immediately upon contribution. The three percent nonmatching Company contribution vests after employees complete three years of service. In addition, Corteva made contributions to other defined contribution plans on behalf of the Seed Business of $23 million, $20 million, and $17 million for the years ended December 31, 2025, 2024 and 2023, respectively.
NOTE 16 — STOCK-BASED COMPENSATION
Corteva grants to its employees stock-based compensation awards in the form of stock options, restricted stock units (“RSUs”) and performance share units (“PSUs”). The stock options and RSUs vest over a specified period, while vesting for the PSUs, which are granted to Corteva’s senior leadership, is partially based on the realization of Corteva’s improvement against identified financial metrics during a specified performance period. A retirement-eligible employee retains any granted awards upon retirement for one year provided the employee has rendered at least six months of service following the grant date. The fair value of stock options granted is measured using the Black-Scholes option pricing model. The fair value of RSUs and PSUs granted is based upon the market price of the underlying common stock as of the grant date. Corteva estimates expected forfeitures.
The total stock-based compensation cost included in Income (loss) before income taxes within the Combined Statement of Operations was $43 million, $35 million and $31 million for the years ended December 31, 2025, 2024 and 2023, respectively. The income tax benefits related to stock-based compensation arrangements were $(8) million, $(7) million and $(6) million for the years ended December 31, 2025, 2024 and 2023, respectively.
NOTE 17 — FINANCIAL INSTRUMENTS
Time Deposits and Money Market Funds
At December 31, 2025 and 2024, the Company held investments in held-to-maturity securities at amortized cost, which approximates fair value. At these periods, the Company held additional held-to-maturity securities consisting of investments in foreign government bonds which are discussed further in the "Debt Securities" section.
The following table summarizes investments in time deposits and money market funds classified as held-to-maturity securities at December 31, 2025 and 2024:
|
|
|
|
|
|
|
|
|
|
Held-to-Maturity Securities |
Amortized Cost |
|
(In millions) |
Balance Sheet Location |
December 31, 2025 |
|
December 31, 2024 |
|
Time deposits and money market funds |
Cash equivalents 1 |
|
$ |
358 |
|
|
$ |
210 |
|
Time deposits |
Marketable securities 2 |
|
$ |
— |
|
|
$ |
7 |
|
1.Maturity at time of purchase was three months or less.
2.Maturity at time of purchase was more than three months to less than one year.
Derivative Instruments
Objectives and Strategies for Holding Derivative Instruments
In the ordinary course of business, the Seed Business enters into contractual arrangements (derivatives) to reduce its exposure to foreign currency and commodity price risks. The Seed Business has established a variety of derivative programs to be utilized for financial risk management. These programs reflect varying levels of exposure coverage and time horizons based on an assessment of risk.
Derivative programs have procedures and controls and are approved by Corteva's Corporate Financial Risk Management Committee, consistent with its financial risk management policies and guidelines. Derivative instruments used are forwards, options, futures and swaps. The Seed Business has not designated any non-derivatives as hedging instruments.
The Seed Business' financial risk management procedures also address counterparty credit approval, limits and routine exposure monitoring and reporting. The counterparties to these contractual arrangements are major financial institutions and major commodity exchanges, and multinational grain exporters. The Seed Business is exposed to credit losses in the event of nonperformance by these counterparties. The Seed Business utilizes collateral support annex agreements with certain counterparties to limit its exposure to credit losses. The Seed Business anticipates performance by counterparties to these contracts and therefore no material loss is expected. Market and counterparty credit risks associated with these instruments are regularly reported to management.
The aggregate notional amounts for the Seed Business' derivative instruments that are designated and not designated as hedging instruments was a net buy (sell) position of $904 million and $810 million at December 31, 2025 and 2024, respectively.
Foreign Currency Risk
Corteva's objective in managing exposure to foreign currency fluctuations is to reduce earnings and cash flow volatility associated with foreign currency rate changes. Accordingly, Corteva enters into various contracts that change in value as foreign exchange rates change to protect the value of its existing foreign currency-denominated assets, liabilities, commitments and cash flows, including those of the Seed Business.
Through its participation in Corteva's hedging program, the Seed Business uses foreign currency exchange contracts to offset its net exposures, by currency, related to the foreign currency denominated monetary assets and liabilities of its operations. The primary business objective of this hedging program is to maintain an approximately balanced position in foreign currencies so that exchange gains and losses resulting from exchange rate changes, after related tax effects, are minimized. The Seed Business also uses foreign currency exchange contracts to offset a portion of the Seed Business' exposure to certain forecasted transactions as well as the translation of foreign currency-denominated earnings. In addition, the Seed Business uses commodity contracts to offset risks associated with foreign currency devaluation in certain countries.
Since the hedging instruments mitigate combined Corteva exposures as opposed to assets, liabilities and cash flows attributed only to the Seed Business, the Seed Business has been allocated a pro rata share of the income statement activity related to these hedges.
Commodity Price Risk
Commodity price risk management programs serve to reduce exposure to price fluctuations on purchases of inventory such as corn and soybeans. The Seed Business enters into over-the-counter and exchange-traded derivative commodity instruments to hedge the commodity price risk associated with agricultural commodity exposures.
Derivatives Designated as Cash Flow Hedges
Commodity Contracts
The Seed Business enters into over-the-counter and exchange-traded derivative commodity instruments, including options, futures and swaps, to hedge the commodity price risk associated with agriculture commodity exposures.
While each risk management program has a different time maturity period, most programs currently do not extend beyond the next two years. Cash flow hedge results are reclassified into earnings during the same period in which the related exposure impacts earnings. Reclassifications are made sooner if it appears that a forecasted transaction is not probable of occurring.
The following table summarizes the after-tax effect of commodity contract cash flow hedges on accumulated other comprehensive income (loss):
|
|
|
|
|
|
|
|
|
|
|
|
|
|
For the Year Ended December 31, |
|
(In millions) |
2025 |
|
2024 |
|
2023 |
|
Beginning balance |
|
$ |
(49 |
) |
|
$ |
(71 |
) |
|
$ |
55 |
|
Additions and revaluations of derivatives designated as cash flow hedges |
|
|
3 |
|
|
|
(29 |
) |
|
|
(87 |
) |
Clearance of hedge results to earnings |
|
|
55 |
|
|
|
51 |
|
|
|
(39 |
) |
Ending balance |
|
$ |
9 |
|
|
$ |
(49 |
) |
|
$ |
(71 |
) |
At December 31, 2025, an after-tax net gain of $19 million is expected to be reclassified from accumulated other comprehensive income (loss) into earnings over the next twelve months.
Derivatives not Designated in Hedging Relationships
Foreign Currency Contracts
Through its participation in Corteva's hedging programs, the Seed Business uses foreign exchange contracts to reduce its net exposure, by currency, related to foreign currency-denominated monetary assets and liabilities of its operations so that exchange gains and losses resulting from exchange rate changes are minimized. The netting of such exposures precludes the use of hedge accounting; however, the required revaluation of the forward contracts and the associated foreign currency-denominated monetary assets and liabilities intends to achieve a minimal earnings impact, after taxes. The Seed Business also uses foreign currency exchange contracts to offset a portion of the Seed Business' exposure to the translation of certain foreign currency-denominated earnings so that gains and losses on the contracts offset changes in the USD value of the related foreign currency-denominated earnings over the relevant aggregate period. Since the hedging instruments mitigate combined Corteva exposures as opposed to assets, liabilities and cash flows attributed only to the Seed Business, the Seed Business has been allocated a pro rata share of the income statement activity related to these hedges.
Commodity Contracts
The Seed Business utilizes options, futures and swaps that are not designated as hedging instruments to reduce exposure to commodity price fluctuations on purchases of inventory such as corn and soybeans. The Seed Business uses commodity contracts to offset a portion of the Seed Business' exposure to commodity price fluctuations so that gains and losses on the contracts offset changes in the commodity price over the relevant aggregate period. The Seed Business uses forward agreements, with durations less than one year, to buy and sell USD priced commodities in order to reduce its exposure to currency devaluation for a portion of its local currency cash balances. Counterparties to the forward sales agreements are multinational grain exporters and subject to the Seed Business' financial risk management procedures.
Fair Value of Derivative Instruments
Asset and liability derivatives subject to an enforceable master netting arrangement with the same counterparty are presented on a net basis in the Combined Balance Sheets.
The presentation of the Seed Business' derivative assets and liabilities is as follows:
|
|
|
|
|
|
|
|
|
|
|
|
|
|
|
|
December 31, 2025 |
|
(In millions) |
Balance Sheet Location |
Gross |
|
Counterparty and Cash Collateral Netting1 |
|
Net Amounts Included in the Combined Balance Sheet |
|
Asset derivatives: |
|
|
|
|
|
|
|
|
|
|
Derivatives designated as hedging instruments: |
|
|
|
|
|
|
|
|
|
|
Commodity contracts |
Other current assets |
|
$ |
1 |
|
|
$ |
— |
|
|
$ |
1 |
|
Derivatives not designated as hedging instruments: |
|
|
|
|
|
|
|
|
|
|
Commodity contracts |
Other current assets |
|
|
1 |
|
|
|
— |
|
|
|
1 |
|
Total asset derivatives |
|
|
$ |
2 |
|
|
$ |
— |
|
|
$ |
2 |
|
|
|
|
|
|
|
|
|
|
|
|
Liability derivatives: |
|
|
|
|
|
|
|
|
|
|
Derivatives designated as hedging instruments: |
|
|
|
|
|
|
|
|
|
|
Commodity contracts |
Accrued and other current liabilities |
|
$ |
3 |
|
|
$ |
— |
|
|
$ |
3 |
|
Derivatives not designated as hedging instruments: |
|
|
|
|
|
|
|
|
|
|
Commodity contracts |
Accrued and other current liabilities |
|
|
4 |
|
|
|
— |
|
|
|
4 |
|
Total liability derivatives |
|
|
$ |
7 |
|
|
$ |
— |
|
|
$ |
7 |
|
|
|
|
|
|
|
|
|
|
|
|
|
|
|
|
|
December 31, 2024 |
|
(In millions) |
Balance Sheet Location |
Gross |
|
Counterparty and Cash Collateral Netting1 |
|
Net Amounts Included in the Combined Balance Sheet |
|
Asset derivatives: |
|
|
|
|
|
|
|
|
|
|
Derivatives designated as hedging instruments: |
|
|
|
|
|
|
|
|
|
|
Commodity contracts |
Other current assets |
|
$ |
8 |
|
|
$ |
— |
|
|
$ |
8 |
|
Derivatives not designated as hedging instruments: |
|
|
|
|
|
|
|
|
|
|
Commodity contracts |
Other current assets |
|
|
10 |
|
|
|
— |
|
|
|
10 |
|
Total asset derivatives |
|
|
$ |
18 |
|
|
$ |
— |
|
|
$ |
18 |
|
|
|
|
|
|
|
|
|
|
|
|
Liability derivatives: |
|
|
|
|
|
|
|
|
|
|
Derivatives designated as hedging instruments: |
|
|
|
|
|
|
|
|
|
|
Commodity contracts |
Accrued and other current liabilities |
|
$ |
2 |
|
|
$ |
— |
|
|
$ |
2 |
|
Derivatives not designated as hedging instruments: |
|
|
|
|
|
|
|
|
|
|
Commodity contracts |
Accrued and other current liabilities |
|
|
3 |
|
|
|
— |
|
|
|
3 |
|
Total liability derivatives |
|
|
$ |
5 |
|
|
$ |
— |
|
|
$ |
5 |
|
1. Counterparty and cash collateral amounts represent the estimated net settlement amount when applying netting and set-off rights included in master netting arrangements between the Company and its counterparties and the payable or receivable for cash collateral held or placed with the same counterparty.
Effect of Derivative Instruments
|
|
|
|
|
|
|
|
|
|
|
|
|
|
Amount of Gain (Loss) Recognized in OCI 1 - Pre-Tax |
|
|
For the Year Ended December 31, |
|
(In millions) |
2025 |
|
2024 |
|
2023 |
|
Derivatives designated as hedging instruments: |
|
|
|
|
|
|
|
|
|
Cash flow hedges: |
|
|
|
|
|
|
|
|
|
Commodity contracts |
|
$ |
5 |
|
|
$ |
(59 |
) |
|
$ |
(123 |
) |
Total derivatives designated as hedging instruments |
|
$ |
5 |
|
|
$ |
(59 |
) |
|
$ |
(123 |
) |
1.OCI is defined as other comprehensive income (loss).
|
|
|
|
|
|
|
|
|
|
|
|
|
|
Amount of Gain (Loss) Recognized in Income - Pre-Tax 1 |
|
|
For the Year Ended December 31, |
|
(In millions) |
2025 |
|
2024 |
|
2023 |
|
Derivatives designated as hedging instruments: |
|
|
|
|
|
|
|
|
|
Cash flow hedges: |
|
|
|
|
|
|
|
|
|
Commodity contracts 2 |
|
$ |
(72 |
) |
|
$ |
(74 |
) |
|
$ |
49 |
|
Total derivatives designated as hedging instruments |
|
$ |
(72 |
) |
|
$ |
(74 |
) |
|
$ |
49 |
|
Derivatives not designated as hedging instruments: |
|
|
|
|
|
|
|
|
|
Foreign currency contracts 3 |
|
$ |
(3 |
) |
|
$ |
(44 |
) |
|
$ |
62 |
|
Foreign currency contracts 2 |
|
|
(30 |
) |
|
|
1 |
|
|
|
(11 |
) |
Commodity contracts 2,4 |
|
|
— |
|
|
|
(34 |
) |
|
|
(20 |
) |
Commodity contracts 3 |
|
|
— |
|
|
|
— |
|
|
|
— |
|
Total derivatives not designated as hedging instruments |
|
$ |
(33 |
) |
|
$ |
(77 |
) |
|
$ |
31 |
|
Total derivatives |
|
$ |
(105 |
) |
|
$ |
(151 |
) |
|
$ |
80 |
|
1.For cash flow hedges, this represents the portion of the gain (loss) reclassified from accumulated OCI into income during the period.
2.Recorded in cost of goods sold, in the Combined Statement of Operations.
3.Recognized in other income (expense) - net, in the Combined Statement of Operations. Note that the net loss from foreign currency contracts was partially offset by the related gain on the foreign currency-denominated monetary assets and liabilities of the Company's operations. See Note 6 - Supplementary Information, to the Combined Financial Statements for additional information.
4.The net gain (loss) relating to commodity contracts that are not designated as hedging instruments that were recorded in cost of goods sold, in the Combined Statement of Operations, are mostly offset by the related net gain (loss) on third-party grower contracts denominated as liabilities.
NOTE 18 — FAIR VALUE MEASUREMENTS
The table below summarizes the basis used to measure certain assets and liabilities relating to marketable securities and derivative assets and liabilities at fair value on a recurring basis:
|
|
|
|
|
|
|
|
|
Significant Other Observable Inputs |
December 31, 2025 |
|
December 31, 2024 |
|
(In millions) |
Level 2 1 |
|
Level 2 1 |
|
Assets at fair value: |
|
|
|
|
|
|
Marketable securities |
|
$ |
— |
|
|
$ |
7 |
|
Debt securities: |
|
|
|
|
|
|
Foreign government bonds 2 |
|
|
1 |
|
|
|
— |
|
Derivatives relating to: 3 |
|
|
|
|
|
|
Commodity contracts |
|
|
2 |
|
|
|
18 |
|
Total assets at fair value |
|
$ |
3 |
|
|
$ |
25 |
|
Liabilities at fair value: |
|
|
|
|
|
|
Derivatives relating to: 3 |
|
|
|
|
|
|
Commodity contracts |
|
|
7 |
|
|
|
5 |
|
Total liabilities at fair value |
|
$ |
7 |
|
|
$ |
5 |
|
1.Reflects significant other observable inputs.
2.Represents the Seed Business' investments in debt securities that are classified as available-for-sale, which are included in the Combined Balance Sheets.
3.Refer to Note 17 - Financial Instruments, to the Combined Financial Statements, for the classification of derivatives in the Combined Balance Sheets.
For assets and liabilities classified as Level 1 measurements (measured using quoted prices in active markets), total fair value is either the price of the most recent trade at the time of the market close or the official close price, as defined by the exchange on which the asset is most actively traded on the last trading day of the period, multiplied by the number of units held without consideration of transaction costs.
For assets and liabilities classified as Level 2 measurements, where the security is frequently traded in less active markets, fair value is based on the closing price at the end of the period; where the security is less frequently traded, fair value is based on the price a dealer would pay for the security or similar securities, adjusted for any terms specific to that asset or liability, or by using observable market data points of similar, more liquid securities to imply the price. For time deposits classified as held-to-maturity investments and reported at amortized cost, fair value is based on an observable interest rate for similar securities. Market inputs are obtained from well-established and recognized vendors of market data and subjected to tolerance and quality checks.
For derivative assets and liabilities, standard industry models are used to calculate the fair value of the various financial instruments based on significant observable market inputs, such as foreign exchange rates, commodity prices, swap rates and implied volatilities obtained from various market sources. Market inputs are obtained from well-established and recognized vendors of market data and subjected to tolerance/quality checks.
For all other assets and liabilities for which observable inputs are used, fair value is derived through the use of fair value models, such as a discounted cash flow model or other standard pricing models. See Note 17 - Financial Instruments, to the Combined Financial Statements, for further information on the types of instruments used by the Seed Business for risk management.
There were no transfers between Levels 1 and 2 during the years ended December 31, 2025 and 2024.
For assets classified as Level 3 measurements, the fair value is based on significant unobservable inputs including assumptions where there is little, if any, market activity. The fair value of the Seed Business' interests held in trade receivable conduits is determined by calculating the expected amount of cash to be received using the key input of anticipated credit losses in the portfolio of receivables sold that have not yet been collected. Given the short-term nature of the underlying receivables, discount rate and prepayments are not factors in determining the fair value of the interests.
NOTE 19 — RELATED PARTY TRANSACTIONS
The Seed Business has historically operated as an operating segment of Corteva. Allocations of certain expenses for services from Corteva including, but not limited to, general corporate expenses related to finance, legal, information technology, human resources, ethics and compliance, shared services, employee benefits and incentives, insurance and stock-based compensation, are included in the Combined Financial Statements. These expenses have been allocated on a pro rata basis using net sales as a measure. The Seed Business and Corteva consider the basis on which the expenses have been allocated to be a reasonable reflection of the utilization of services provided. Management does not believe that it is practicable to estimate the expense the Seed Business would have incurred as a stand-alone company. The amount of actual costs that may have been incurred if the Seed Business were a stand-alone company would depend on a number of factors, including the Seed Business’ chosen organizational structure, which functions were outsourced or performed by Seed Business employees, contract terms negotiated with third party providers, and strategic decisions made in areas such as information technology and infrastructure.
Corporate Expense Allocations
The Seed Business' Combined Financial Statements include an allocation of expenses incurred by Corteva for specified functions, primarily general corporate activities, delivered centrally. Such costs specifically identifiable to the Seed Business were first quantified, after which the allocation methodology was used.
The following corporate expense allocations are included in the Combined Statements of Operations:
|
|
|
|
|
|
|
|
|
|
|
|
|
(In millions) |
2025 |
|
2024 |
|
2023 |
|
Research and development expense |
|
$ |
1 |
|
|
$ |
1 |
|
|
$ |
1 |
|
Selling, general and administrative expenses |
|
|
75 |
|
|
|
62 |
|
|
|
57 |
|
Restructuring and asset related charges - net |
|
|
— |
|
|
|
— |
|
|
|
2 |
|
Total |
|
$ |
76 |
|
|
$ |
63 |
|
|
$ |
60 |
|
Related Party Purchases
During the years ended December 31, 2025, 2024 and 2023, the Seed Business purchased seed treatment products used in production from Corteva's Crop Protection operating segment in the amount of $337 million, $190 million, and $300 million, respectively. The Seed Business recognized the cost of such products in Cost of goods sold upon the sale of the treated seed to the customer. In preparing the Seed Business' Combined Financial Statements, it was determined that the steps necessary to bifurcate between intercompany payable balances that are settled routinely and those settled on an ad hoc basis, or not at all, were extensive in nature and would not result in a material impact to the accounts payable balances reported on the Seed Business' Combined Financial Statements. Therefore, all related party purchases were treated as those which are not settled in cash, which are recorded as equity transactions and included within the Net Parent investment amount in the Combined Balance Sheets.
Net Parent Investment
Net transfers between Corteva and the Seed Business are reflected within Net transfers to Parent in the Combined Statements of Cash Flows and the Combined Statements of Equity.
Transactions with Nonconsolidated Affiliates
The Seed Business holds investments in entities under the equity method ("nonconsolidated affiliates"). Such investments in nonconsolidated affiliates aggregated to $75 million and $59 million at December 31, 2025 and 2024, respectively. Transactions during the periods consisted primarily of capital contributions. The Seed Business held receivables from these nonconsolidated affiliates of $63 million and $85 million at December 31, 2025 and 2024, respectively, and payables to these nonconsolidated affiliates of $4 million and $3 million at December 31, 2025 and 2024, respectively. Refer to Note 6 - Supplementary Information, to the Combined Financial Statements, for further details on equity earnings from these affiliates.
NOTE 20 — ACCUMULATED OTHER COMPREHENSIVE INCOME (LOSS)
The following table summarizes the changes and after-tax balances of each component of accumulated other comprehensive income (loss) for the years ended December 31, 2025, 2024, and 2023:
|
|
|
|
|
|
|
|
|
|
|
|
|
|
|
|
|
|
|
|
|
|
|
|
|
(In millions) |
Cumulative Translation Adjustment |
|
Derivative Instruments |
|
Pension Benefit Plans |
|
Other Benefit Plans |
|
Unrealized Gain (Loss) on Investments |
|
Total |
|
2023 |
|
|
|
|
|
|
|
|
|
|
|
|
|
|
|
|
|
|
Balance at January 1, 2023 |
|
$ |
(1,294 |
) |
|
$ |
55 |
|
|
$ |
23 |
|
|
$ |
13 |
|
|
|
— |
|
|
$ |
(1,203 |
) |
Other comprehensive income (loss) before reclassifications |
|
|
195 |
|
|
|
(87 |
) |
|
|
(9 |
) |
|
|
3 |
|
|
|
— |
|
|
|
102 |
|
Amounts reclassified from accumulated other comprehensive income (loss) |
|
|
— |
|
|
|
(39 |
) |
|
|
(3 |
) |
|
|
(1 |
) |
|
|
— |
|
|
|
(43 |
) |
Net other comprehensive income (loss) |
|
|
195 |
|
|
|
(126 |
) |
|
|
(12 |
) |
|
|
2 |
|
|
|
— |
|
|
|
59 |
|
Balance at December 31, 2023 |
|
$ |
(1,099 |
) |
|
$ |
(71 |
) |
|
$ |
11 |
|
|
$ |
15 |
|
|
$ |
— |
|
|
$ |
(1,144 |
) |
2024 |
|
|
|
|
|
|
|
|
|
|
|
|
|
|
|
|
|
|
Other comprehensive income (loss) before reclassifications |
|
|
(433 |
) |
|
|
(29 |
) |
|
|
5 |
|
|
|
7 |
|
|
|
— |
|
|
|
(450 |
) |
Amounts reclassified from accumulated other comprehensive income (loss) |
|
|
— |
|
|
|
51 |
|
|
|
(1 |
) |
|
|
(1 |
) |
|
|
— |
|
|
|
49 |
|
Net other comprehensive income (loss) |
|
|
(433 |
) |
|
|
22 |
|
|
|
4 |
|
|
|
6 |
|
|
|
— |
|
|
|
(401 |
) |
Balance at December 31, 2024 |
|
$ |
(1,532 |
) |
|
$ |
(49 |
) |
|
$ |
15 |
|
|
$ |
21 |
|
|
$ |
— |
|
|
$ |
(1,545 |
) |
2025 |
|
|
|
|
|
|
|
|
|
|
|
|
|
|
|
|
|
|
Other comprehensive income (loss) before reclassifications |
|
|
218 |
|
|
|
3 |
|
|
|
9 |
|
|
|
(3 |
) |
|
|
— |
|
|
|
227 |
|
Amounts reclassified from accumulated other comprehensive income (loss) |
|
|
— |
|
|
|
55 |
|
|
|
(1 |
) |
|
|
(1 |
) |
|
|
— |
|
|
|
53 |
|
Net other comprehensive income (loss) |
|
|
218 |
|
|
|
58 |
|
|
|
8 |
|
|
|
(4 |
) |
|
|
— |
|
|
|
280 |
|
Balance at December 31, 2025 |
|
$ |
(1,314 |
) |
|
$ |
9 |
|
|
$ |
23 |
|
|
$ |
17 |
|
|
$ |
— |
|
|
$ |
(1,265 |
) |
The tax (expense) benefit on the net activity related to each component of other comprehensive income (loss) was as follows:
|
|
|
|
|
|
|
|
|
|
|
|
|
|
For the Year Ended December 31, |
|
(In millions) |
2025 |
|
2024 |
|
2023 |
|
Derivative instruments |
|
$ |
(19 |
) |
|
$ |
7 |
|
|
$ |
46 |
|
Pension benefit plans - net |
|
|
(1 |
) |
|
|
— |
|
|
|
2 |
|
Other benefit plans - net |
|
|
— |
|
|
|
(2 |
) |
|
|
(1 |
) |
Unrealized gains (losses) on investments |
|
|
— |
|
|
|
— |
|
|
|
— |
|
(Provision for) benefit from income taxes related to other comprehensive income (loss) items |
|
$ |
(20 |
) |
|
$ |
5 |
|
|
$ |
47 |
|
A summary of the reclassifications out of accumulated other comprehensive income (loss) is provided as follows:
|
|
|
|
|
|
|
|
|
|
|
|
|
(In millions) |
For the Year Ended December 31, |
|
|
2025 |
|
2024 |
|
2023 |
|
Derivative Instruments 1: |
|
$ |
72 |
|
|
$ |
74 |
|
|
$ |
(49 |
) |
Tax (benefit) expense 2 |
|
|
(17 |
) |
|
|
(23 |
) |
|
|
10 |
|
After-tax |
|
|
55 |
|
|
|
51 |
|
|
|
(39 |
) |
Amortization of pension benefit plans: |
|
|
|
|
|
|
|
|
|
Prior service (benefit) cost 3,4 |
|
|
(1 |
) |
|
|
(1 |
) |
|
|
(1 |
) |
Actuarial (gains) losses 3,4 |
|
|
— |
|
|
|
— |
|
|
|
(1 |
) |
Settlement (gain) loss 3,4 |
|
|
— |
|
|
|
— |
|
|
|
(1 |
) |
Total before tax |
|
|
(1 |
) |
|
|
(1 |
) |
|
|
(3 |
) |
Tax (benefit) expense 2 |
|
|
— |
|
|
|
— |
|
|
|
— |
|
After-tax |
|
|
(1 |
) |
|
|
(1 |
) |
|
|
(3 |
) |
Amortization of other benefit plans: |
|
|
|
|
|
|
|
|
|
Prior service (benefit) cost 3,4 |
|
|
— |
|
|
|
— |
|
|
|
— |
|
Actuarial (gains) losses 3,4 |
|
|
(1 |
) |
|
|
(1 |
) |
|
|
(1 |
) |
Curtailment (gain) loss |
|
|
— |
|
|
|
— |
|
|
|
— |
|
Total before tax |
|
|
(1 |
) |
|
|
(1 |
) |
|
|
(1 |
) |
Tax (benefit) expense 2 |
|
|
— |
|
|
|
— |
|
|
|
— |
|
After-tax |
|
|
(1 |
) |
|
|
(1 |
) |
|
|
(1 |
) |
Unrealized (gain) loss on investments 4: |
|
|
|
|
|
|
|
|
|
Tax (benefit) expense 2 |
|
|
— |
|
|
|
— |
|
|
|
— |
|
After-tax |
|
|
— |
|
|
|
— |
|
|
|
— |
|
Total reclassifications for the period, after-tax |
|
$ |
53 |
|
|
$ |
49 |
|
|
$ |
(43 |
) |
1.Reflected in cost of goods sold in the Combined Statements of Operations.
2.Reflected in Provision for (benefit from) income taxes in the Combined Statements of Operations.
3.These Accumulated other comprehensive income (loss) components are included in the computation of net periodic benefit (credit) cost of the Seed Business' pension and other benefit plans. Refer to Note 15 - Pension Plans and Other Post-Employment Benefits, to the Combined Financial Statements, for additional information.
4.Reflected in other income (expense) - net in the Combined Statements of Operations.
NOTE 21 — GEOGRAPHIC INFORMATION
Sales are attributed to geographic areas based on customer location; long-lived assets are attributed to geographic areas based on asset location.
|
|
|
|
|
|
|
|
|
|
|
|
|
|
Net Sales |
|
|
For the Year Ended December 31, |
|
(In millions) |
2025 |
|
2024 |
|
2023 |
|
United States |
|
$ |
5,776 |
|
|
$ |
5,504 |
|
|
$ |
5,264 |
|
Canada |
|
|
495 |
|
|
|
529 |
|
|
|
504 |
|
EMEA |
|
|
1,560 |
|
|
|
1,581 |
|
|
|
1,622 |
|
Latin America 1 |
|
|
1,614 |
|
|
|
1,523 |
|
|
|
1,637 |
|
Asia Pacific |
|
|
453 |
|
|
|
408 |
|
|
|
445 |
|
Total |
|
$ |
9,898 |
|
|
$ |
9,545 |
|
|
$ |
9,472 |
|
1.Net sales for Brazil for the years ended December 31, 2025, 2024 and 2023 were $1,160 million, $1,017 million and $1,002 million, respectively.
|
|
|
|
|
|
|
|
|
|
|
|
|
|
Net Property |
|
|
As of December 31, |
|
(In millions) |
2025 |
|
2024 |
|
2023 |
|
United States |
|
$ |
1,591 |
|
|
$ |
1,547 |
|
|
$ |
1,494 |
|
Canada |
|
|
99 |
|
|
|
99 |
|
|
|
117 |
|
EMEA |
|
|
337 |
|
|
|
308 |
|
|
|
320 |
|
Latin America |
|
|
385 |
|
|
|
340 |
|
|
|
391 |
|
Asia Pacific |
|
|
49 |
|
|
|
50 |
|
|
|
54 |
|
Total |
|
$ |
2,461 |
|
|
$ |
2,344 |
|
|
$ |
2,376 |
|
NOTE 22 — SEGMENT INFORMATION
The Seed Business' operating segments reflect the manner in which its chief operating decision maker ("CODM") allocates resources and assesses performance, which is at the operating segment level (Americas and Rest of World). In April 2026, in anticipation of the proposed separation, the Seed Business is realigning its segment structure. As a result, the Seed Business consists of two operating segments: Americas and Rest of World. All periods presented have been adjusted to conform to the new segment reporting structure. The Seed Business' CODM is the Executive Vice President, Seed Business Unit. The primary measure used by the Seed Business' CODM for purposes of allocating resources to the segments and assessing segment performance is segment operating EBITDA.
Segment operating EBITDA is primarily utilized in the annual planning and monthly forecasting processes. On a monthly basis, the CODM considers variances between comparable prior year actual results and current year actual or forecasted results when evaluating the Seed Business' success in delivering its innovative proprietary technology to farmers and monitoring of expected savings from cost and productivity actions. The CODM also utilizes segment operating EBITDA when evaluating the impacts of market-driven trends on segment performance, such as input costs and inflationary and currency impacts.
The Seed Business defines segment operating EBITDA as earnings (loss) (i.e., income (loss) before income taxes) before interest, depreciation, amortization, research and development expense, corporate expenses, non-operating (benefits) costs, foreign exchange gains (losses), and net unrealized gain or loss from mark-to-market activity for certain foreign currency derivative instruments that do not qualify for hedge accounting, excluding the impact of significant items and separation costs. Non-operating (benefits) costs consists of non-operating pension and other post-employment benefit (OPEB) credits (costs). Net unrealized gain or loss from mark-to-market activity for certain foreign currency derivative instruments that do not qualify for hedge accounting represents the non-cash net gain (loss) from changes in fair value of certain undesignated foreign currency derivative contracts. Upon settlement, which is within the same calendar year of execution of the contract, the realized gain (loss) from the changes in fair value of the non-qualified foreign currency derivative contracts will be reported in the respective segment results to reflect the economic effects of the foreign currency derivative contracts without the resulting unrealized mark to fair value volatility.
Corporate Profile
The Seed Business conducts its global operations through the following operating segments: Americas and Rest of World. The Company is a leader in many key seed markets, including North America corn and soybeans, Europe corn and sunflower, as well as Brazil, India, South Africa and Argentina corn.
|
|
|
|
|
|
|
|
|
|
|
|
|
|
Americas |
|
Rest of World |
|
Total |
|
(In millions) |
|
|
|
|
|
|
As of and for the Year Ended December 31, 2025 |
|
|
|
|
|
|
|
|
|
Net sales |
|
$ |
7,885 |
|
|
$ |
2,013 |
|
|
$ |
9,898 |
|
Segment operating EBITDA |
|
|
2,813 |
|
|
|
600 |
|
|
|
3,413 |
|
Depreciation and amortization 1 |
|
|
574 |
|
|
|
152 |
|
|
|
726 |
|
Purchases of property, plant and equipment 2 |
|
|
233 |
|
|
|
21 |
|
|
|
254 |
|
As of and for the Year Ended December 31, 2024 |
|
|
|
|
|
|
|
|
|
Net sales |
|
$ |
7,556 |
|
|
$ |
1,989 |
|
|
$ |
9,545 |
|
Segment operating EBITDA |
|
|
2,422 |
|
|
|
573 |
|
|
|
2,995 |
|
Depreciation and amortization 1 |
|
|
593 |
|
|
|
163 |
|
|
|
756 |
|
Purchases of property, plant and equipment 2 |
|
|
216 |
|
|
|
36 |
|
|
|
252 |
|
As of and for the Year Ended December 31, 2023 |
|
|
|
|
|
|
|
|
|
Net sales |
|
$ |
7,405 |
|
|
$ |
2,067 |
|
|
$ |
9,472 |
|
Segment operating EBITDA |
|
|
2,185 |
|
|
|
552 |
|
|
|
2,737 |
|
Depreciation and amortization 1 |
|
|
605 |
|
|
|
171 |
|
|
|
776 |
|
Purchases of property, plant and equipment 2 |
|
|
176 |
|
|
|
30 |
|
|
|
206 |
|
1.Depreciation and amortization excludes depreciation expense incurred by the research and development function, which amounted to $80 million, $73 million and $56 million for the years ended December 31, 2025, 2024 and 2023, respectively.
2.Purchases of property, plant and equipment excludes purchases made by the research and development function, which amounted to $92 million, $86 million and $97 million for the years ended December 31, 2025, 2024 and 2023, respectively.
|
|
|
|
|
|
|
|
|
|
|
|
|
Reconciliation of Segment Profitability |
|
|
|
|
|
|
|
|
|
(In millions) |
Americas |
|
Rest of World |
|
Total |
|
For the Year Ended December 31, 2025 |
|
|
|
|
|
|
|
|
|
Net sales |
|
$ |
7,885 |
|
|
$ |
2,013 |
|
|
$ |
9,898 |
|
Cost of goods sold |
|
|
3,642 |
|
|
|
1,069 |
|
|
|
4,711 |
|
Other expenses 1 |
|
|
1,430 |
|
|
|
344 |
|
|
|
1,774 |
|
Segment operating EBITDA |
|
$ |
2,813 |
|
|
$ |
600 |
|
|
$ |
3,413 |
|
|
|
|
|
|
|
|
|
|
|
(In millions) |
Americas |
|
Rest of World |
|
Total |
|
For the Year Ended December 31, 2024 |
|
|
|
|
|
|
|
|
|
Net sales |
|
$ |
7,556 |
|
|
$ |
1,989 |
|
|
$ |
9,545 |
|
Cost of goods sold |
|
|
3,832 |
|
|
|
1,112 |
|
|
|
4,944 |
|
Other expenses 1 |
|
|
1,302 |
|
|
|
304 |
|
|
|
1,606 |
|
Segment operating EBITDA |
|
$ |
2,422 |
|
|
$ |
573 |
|
|
$ |
2,995 |
|
|
|
|
|
|
|
|
|
|
|
(In millions) |
Americas |
|
Rest of World |
|
Total |
|
For the Year Ended December 31, 2023 |
|
|
|
|
|
|
|
|
|
Net sales |
|
$ |
7,405 |
|
|
$ |
2,067 |
|
|
$ |
9,472 |
|
Cost of goods sold |
|
|
3,947 |
|
|
|
1,206 |
|
|
|
5,153 |
|
Other expenses 1 |
|
|
1,273 |
|
|
|
309 |
|
|
|
1,582 |
|
Segment operating EBITDA |
|
$ |
2,185 |
|
|
$ |
552 |
|
|
$ |
2,737 |
|
1.Other expenses consist primarily of selling, general and administrative expenses, net of depreciation add-back.
|
|
|
|
|
|
|
|
|
|
|
|
|
Income (loss) after income taxes to segment operating EBITDA |
For the Year Ended December 31, |
|
(In millions) |
2025 |
|
2024 |
|
2023 |
|
Net income (loss) |
|
$ |
575 |
|
|
$ |
774 |
|
|
$ |
654 |
|
Provision for (benefit from) income taxes |
|
|
270 |
|
|
|
342 |
|
|
|
297 |
|
Income (loss) before income taxes |
|
$ |
845 |
|
|
$ |
1,116 |
|
|
$ |
951 |
|
Depreciation and amortization |
|
|
806 |
|
|
|
829 |
|
|
|
832 |
|
Interest income |
|
|
(50 |
) |
|
|
(42 |
) |
|
|
(87 |
) |
Interest expense |
|
|
5 |
|
|
|
2 |
|
|
|
1 |
|
Research and development expense, net of depreciation |
|
|
914 |
|
|
|
842 |
|
|
|
785 |
|
Exchange (gains) losses - net |
|
|
120 |
|
|
|
114 |
|
|
|
97 |
|
Non-operating (benefits) costs - net |
|
|
11 |
|
|
|
7 |
|
|
|
7 |
|
Mark-to-market (gains) losses on certain foreign currency contracts not designated as hedges |
|
|
— |
|
|
|
— |
|
|
|
— |
|
Significant items |
|
|
651 |
|
|
|
64 |
|
|
|
93 |
|
Separation costs |
|
|
35 |
|
|
|
— |
|
|
|
— |
|
Corporate expenses |
|
|
76 |
|
|
|
63 |
|
|
|
58 |
|
Segment operating EBITDA |
|
$ |
3,413 |
|
|
$ |
2,995 |
|
|
$ |
2,737 |
|
Significant Pre-tax (Charges) Benefits Not Included in Segment Operating EBITDA
The years ended December 31, 2025, 2024 and 2023, respectively, included the following significant pre-tax (charges) benefits which are excluded from segment operating EBITDA:
|
|
|
|
|
|
|
|
|
|
|
|
|
|
|
|
|
(In millions) |
Americas |
|
Rest of World |
|
Corporate |
|
Total |
|
As of and for the Year Ended December 31, 2025 |
|
|
|
|
|
|
|
|
|
|
|
|
Restructuring and asset related charges - net 1 |
|
$ |
(3 |
) |
|
$ |
(1 |
) |
|
$ |
— |
|
|
$ |
(4 |
) |
Bayer resolution 2 |
|
|
(610 |
) |
|
|
— |
|
|
|
— |
|
|
|
(610 |
) |
AltEn facility remediation charges 3 |
|
|
(37 |
) |
|
|
— |
|
|
|
— |
|
|
|
(37 |
) |
Total |
|
$ |
(650 |
) |
|
$ |
(1 |
) |
|
$ |
— |
|
|
$ |
(651 |
) |
|
|
|
|
|
|
|
|
|
|
|
|
|
(In millions) |
Americas |
|
Rest of World |
|
Corporate |
|
Total |
|
As of and for the Year Ended December 31, 2024 |
|
|
|
|
|
|
|
|
|
|
|
|
Restructuring and asset related charges - net 1 |
|
$ |
(54 |
) |
|
$ |
(1 |
) |
|
|
(15 |
) |
|
$ |
(70 |
) |
Inventory write-offs 4 |
|
|
— |
|
|
|
2 |
|
|
|
— |
|
|
|
2 |
|
Gain (loss) on sale of business, assets and equity investments 4 |
|
|
4 |
|
|
|
— |
|
|
|
— |
|
|
|
4 |
|
Total |
|
$ |
(50 |
) |
|
$ |
1 |
|
|
$ |
(15 |
) |
|
$ |
(64 |
) |
|
|
|
|
|
|
|
|
|
|
|
|
|
(In millions) |
Americas |
|
Rest of World |
|
Corporate |
|
Total |
|
As of and for the Year Ended December 31, 2023 |
|
|
|
|
|
|
|
|
|
|
|
|
Restructuring and asset related charges - net 1 |
|
$ |
(82 |
) |
|
$ |
(4 |
) |
|
$ |
(12 |
) |
|
$ |
(98 |
) |
Inventory write-offs 4 |
|
|
2 |
|
|
|
(9 |
) |
|
|
— |
|
|
|
(7 |
) |
Gain (loss) on sale of business, assets and equity investments 4 |
|
|
4 |
|
|
|
— |
|
|
|
— |
|
|
|
4 |
|
AltEn facility remediation charges 3 |
|
|
(10 |
) |
|
|
— |
|
|
|
— |
|
|
|
(10 |
) |
Seed sale associated with Russia Exit 4,5 |
|
|
— |
|
|
|
18 |
|
|
|
— |
|
|
|
18 |
|
Total |
|
$ |
(86 |
) |
|
$ |
5 |
|
|
$ |
(12 |
) |
|
$ |
(93 |
) |
1.Includes restructuring plans and asset related charges as well as accelerated prepaid amortization expense. Refer to Note 5 - Restructuring and Asset Related Charges - Net, to the Combined Financial Statements, for additional information.
2.Consists of a charge relating to the resolution of litigation with Bayer. Refer to Note 14 - Commitments and Contingent Liabilities, to the Combined Financial Statements, for additional information.
3.Relates to a charge to increase the remediation accrual at the AltEn facility relating to the Seed Business' estimated voluntary contribution to the solid waste and wastewater remedial action plans. Refer to Note 14 - Commitments and Contingent Liabilities, to the Combined Financial Statements, for additional information.
4.Incremental gains (losses) associated with activities related to restructuring actions.
5.Includes a benefit of $18 million for the year ended December 31, 2023, relating to the sale of seeds already under production in Russia when the decision to exit the country was made and that the Company was contractually required to purchase. It consists of $71 million of net sales and $53 million of cost of goods sold for the year ended December 31, 2023.
NOTE 23 — SUBSEQUENT EVENTS
Other than those described in the notes to the Combined Financial Statements, no recognizable subsequent events have occurred after December 31, 2025, but before February 12, 2026, which is the date the Consolidated Financial Statements of Corteva for the year ended December 31, 2025, from which these Combined Financial Statements are derived, were issued. In addition, no non-recognizable subsequent events were identified through April 16, 2026, the date these Combined Financial Statements were available for issuance.
SCHEDULE II—VALUATION AND QUALIFYING ACCOUNTS (SEED BUSINESS)
|
|
|
|
|
|
|
|
|
|
|
|
|
(In millions) |
For the Year Ended December 31, |
|
|
2025 |
|
2024 |
|
2023 |
|
Accounts Receivable—Allowance for Doubtful Receivables |
|
|
|
|
|
|
|
|
|
Balance at beginning of period |
|
$ |
110 |
|
|
$ |
117 |
|
|
$ |
115 |
|
Additions charged to expenses |
|
|
64 |
|
|
|
25 |
|
|
|
15 |
|
Deductions from reserves 1 |
|
|
(30 |
) |
|
|
(32 |
) |
|
|
(13 |
) |
Balance at end of period |
|
$ |
144 |
|
|
$ |
110 |
|
|
$ |
117 |
|
Deferred Tax Assets—Valuation Allowance |
|
|
|
|
|
|
|
|
|
Balance at beginning of period |
|
$ |
301 |
|
|
$ |
201 |
|
|
$ |
112 |
|
Additions to reserves 2 |
|
|
199 |
|
|
|
158 |
|
|
|
100 |
|
Deductions from reserves 3 |
|
|
(97 |
) |
|
|
(58 |
) |
|
|
(11 |
) |
Balance at end of period |
|
$ |
403 |
|
|
$ |
301 |
|
|
$ |
201 |
|
1.Deductions include write-offs, recoveries collected and currency translation adjustments.
2.Additions include currency translation adjustments.
3.Deductions include amounts recorded to other comprehensive income and currency translation adjustments.