
Exhibit 99.2
June 29, 2026 MARTIN MARIETTA TO COMBINE WITH LHOIST NORTH AMERICA Exhibit 99.2
Statement Regarding Safe Harbor for Forward - Looking Statements This material contains forward - looking statements under the federal securities laws, including the Private Securities Litigation Reform Act of 1995 . These statements include : the expected timing and closing requirements for completing the transaction ; benefits of the transaction including increased profitability, synergies and advancement of SOAR 2030 priorities ; the expected financing of the transaction ; costs and other anticipated financial impacts of the transaction including estimated Combined Net Leverage, Adjusted EBITDA, Combined Adjusted EBITDA, Adjusted EBITDA Margin, Combined Adjusted EBITDA Margin, Free Cash Flow Conversion, and Combined Free Cash Flow Conversion ; and expected governance and stakeholder value impacts as a result of the transaction . These statements involve risks and uncertainties and are based on assumptions that the Company believes are reasonable, but which may differ materially from actual results, including, among others, risks and uncertainties relating to the timing of consummation of the transaction ; the risk that the conditions to closing of the transaction may not be satisfied, or that the closing of the transaction does not occur ; the risk that regulatory approval that may be required to complete the transaction is not obtained, or is obtained subject to conditions that are not anticipated or that the Company is not obligated to accept ; the diversion of management time on transaction - related issues ; global economic conditions ; adverse industry conditions ; and potential business uncertainty, including changes to existing business relationships during the pendency of the transaction that could affect financial performance . These statements, reflect the Company’s current expectations or forecasts of future events . You can identify these statements because they do not relate only to historical or current facts and may use words such as “guidance”, “anticipate”, “may”, “expect”, “should”, “believe”, “will”, and other words of similar meaning in connection with future events or future performance . Any or all of the Company’s forward - looking statements herein and in other publications may prove to be incorrect . A further list and description of risks, uncertainties and other matters that could cause actual future results to differ materially from those expressed or implied herein can be found in our Annual Report on Form 10 - K for the year ended December 31 , 2025 and in our subsequent reports on Form 10 - Q, including the sections thereof captioned "Other Matters" and "Item 1 A . Risk Factors," and in our subsequent reports on Form 8 - K . Except as required by law, we do not undertake any obligation to publicly update any forward - looking statements whether as a result of new information, future events, changed circumstances or otherwise . Important Note about Combined and Non - GAAP Financial Measures The financial information for the combined businesses of Martin Marietta and Lhoist North America (LNA) is based on management's estimates, assumptions and projections and has not been prepared in accordance with the applicable requirements of Regulation S - X relating to pro forma financial information, and the required pro forma adjustments have not been applied and are not reflected therein . This information is provided for illustrative purposes only and should not be considered in isolation from, or as a substitute for, the financial statements of Martin Marietta or Lhoist North America . These measures do not reflect what the combined company's financial condition or results of operations would have been had the proposed transaction occurred on or prior to the dates indicated . Various factors could cause actual future results to differ materially from those currently estimated by management, including, but not limited to, the risks described above . This material contains financial measures that are not prepared in accordance with United States generally accepted accounting principles (GAAP) such as Combined Net Leverage, Adjusted EBITDA, Combined Adjusted EBITDA, Adjusted EBITDA Margin, Combined Adjusted EBITDA Margin, Free Cash Flow Conversion, and Combined Free Cash Flow Conversion . The Appendix contains reconciliations of certain non - GAAP financial measures to the closest GAAP measures . Management believes these non - GAAP measures are commonly used by investors to evaluate the Company’s performance and, when read in conjunction with the Company’s consolidated financial statements, present a useful tool to evaluate the Company’s ongoing business performance from period to period and anticipated performance . Additionally, these are some of the factors the Company uses in internal evaluations of the overall performance of its businesses . Management acknowledges that many factors impact reported results, and the adjustments in these non - GAAP measures do not account for all such factors . Furthermore, these non - GAAP measures may not be comparable to similarly titled measures used by other companies . This material includes forward - looking non - GAAP measures for which a reconciliation is not available without unreasonable effort due to the inherent difficulty in forecasting and quantifying the comparable GAAP measures and the applicable adjustments and other amounts that would be necessary for such a reconciliation . 2
Combination Creates the Clear U.S. Leader Across Aggregates, Lime and Industrial Minerals Highly complementary footprint in key Southeast and Southwest geographies with attractive exposure to high - growth end markets Commercial strategy and core limestone mining competency alignment enables seamless integration Wholly - aligned with SOAR 2030 strategic objective to expand complementary specialty platform Differentiated and irreplicable upstream materials platform positioned for through - cycle, profitable growth 1 Accretive 1 to earnings and margins with multiple levers to drive synergies and value creation 2 4 5 6 Builds national champion of critical infrastructure and reindustrialization 3 1. Excluding one - time transaction costs and purchase accounting impacts.
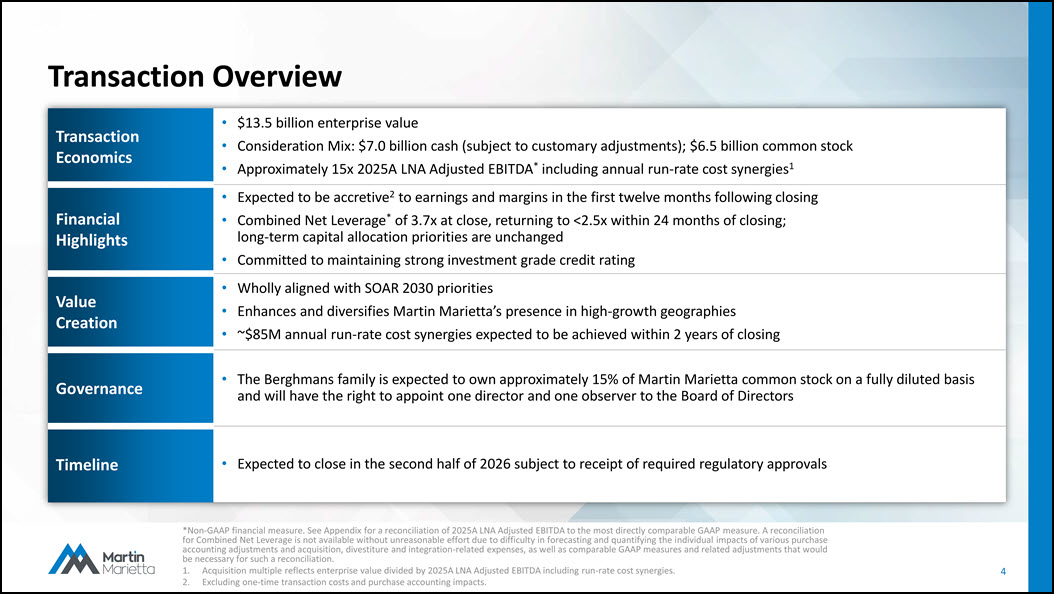
*Non - GAAP financial measure. See Appendix for a reconciliation of 2025A LNA Adjusted EBITDA to the most directly comparable GAAP measure. A reconciliation for Combined Net Leverage is not available without unreasonable effort due to difficulty in forecasting and quantifying the individual impacts of various purchase accounting adjustments and acquisition, divestiture and integration - related expenses, as well as comparable GAAP measures and related adjustments that would be necessary for such a reconciliation. 1. Acquisition multiple reflects enterprise value divided by 2025A LNA Adjusted EBITDA including run - rate cost synergies. 2. Excluding one - time transaction costs and purchase accounting impacts. 4 Transaction Overview • $13.5 billion enterprise value • Consideration Mix: $7.0 billion cash (subject to customary adjustments); $6.5 billion common stock • Approximately 15x 2025A LNA Adjusted EBITDA * including annual run - rate cost synergies 1 Transaction Economics • Expected to be accretive 2 to earnings and margins in the first twelve months following closing • Combined Net Leverage * of 3.7x at close, returning to <2.5x within 24 months of closing; long - term capital allocation priorities are unchanged • Committed to maintaining strong investment grade credit rating Financial Highlights • Wholly aligned with SOAR 2030 priorities • Enhances and diversifies Martin Marietta’s presence in high - growth geographies • ~$85M annual run - rate cost synergies expected to be achieved within 2 years of closing Value Creation • The Berghmans family is expected to own approximately 15% of Martin Marietta common stock on a fully diluted basis and will have the right to appoint one director and one observer to the Board of Directors Governance • Expected to close in the second half of 2026 subject to receipt of required regulatory approvals Timeline
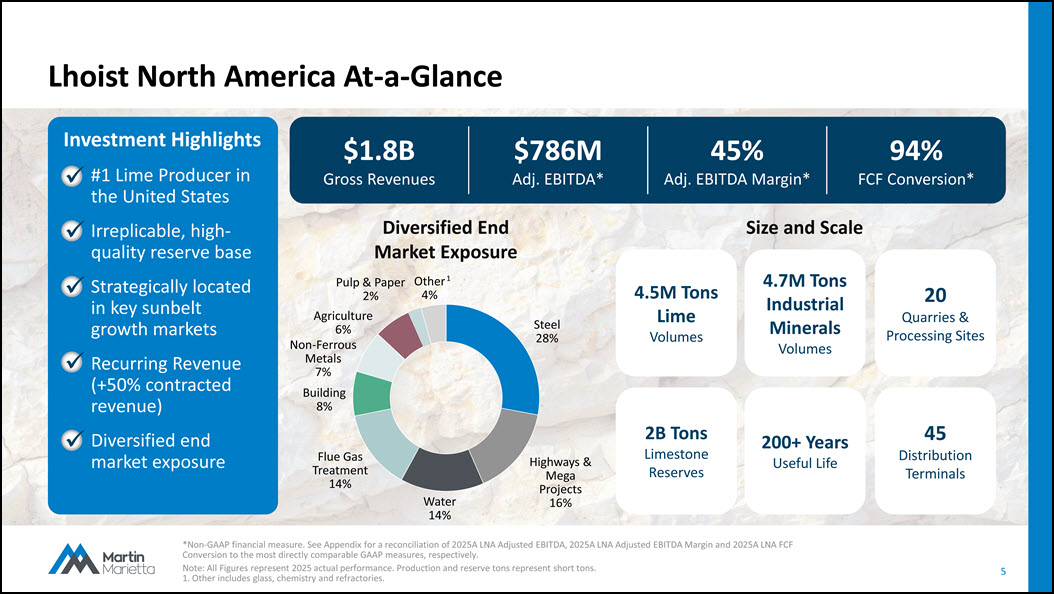
5 *Non - GAAP financial measure. See Appendix for a reconciliation of 2025A LNA Adjusted EBITDA, 2025A LNA Adjusted EBITDA Margin and 2025A LNA FCF Conversion to the most directly comparable GAAP measures, respectively. Note: All Figures represent 2025 actual performance. Production and reserve tons represent short tons. 1. Other includes glass, chemistry and refractories. Lhoist North America At - a - Glance $1.8B Gross Revenues $786M Adj. EBITDA* 45% Adj. EBITDA Margin* 94% FCF Conversion* Steel 28% Highways & Mega Projects 16% Water 14% Flue Gas Treatment 14% Pulp & Paper 2% Agriculture 6% Non - Ferrous Metals 7% Building 8% Diversified End Market Exposure Size and Scale 4.5M Tons Lime Volumes 4 . 7 M Tons Industrial Minerals Volumes 200+ Years Useful Life 2B Tons Limestone Reserves 20 Quarries & Processing Sites 45 Distribution Terminals Investment Highlights x #1 Lime Producer in the United States x Irreplicable, high - quality reserve base x Strategically located in key sunbelt growth markets x Recurring Revenue (+50% contracted revenue) x Diversified end market exposure Other 1 4%
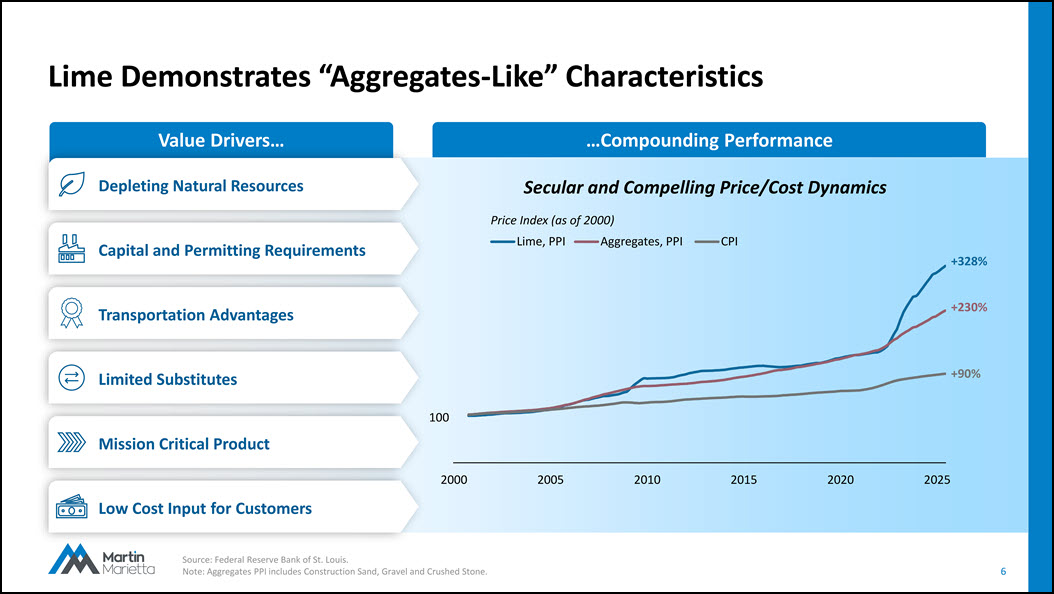
Value Drivers… …Compounding Performance 6 Lime Demonstrates “Aggregates - Like” Characteristics Depleting Natural Resources Capital and Permitting Requirements Low Cost Input for Customers Mission Critical Product 2000 2005 2010 2015 2020 2025 +328% +230% +90% 100 Limited Substitutes Transportation Advantages Secular and Compelling Price/Cost Dynamics Price Index (as of 2000) Lime, PPI Aggregates, PPI CPI Source: Federal Reserve Bank of St. Louis. Note: Aggregates PPI includes Construction Sand, Gravel and Crushed Stone.
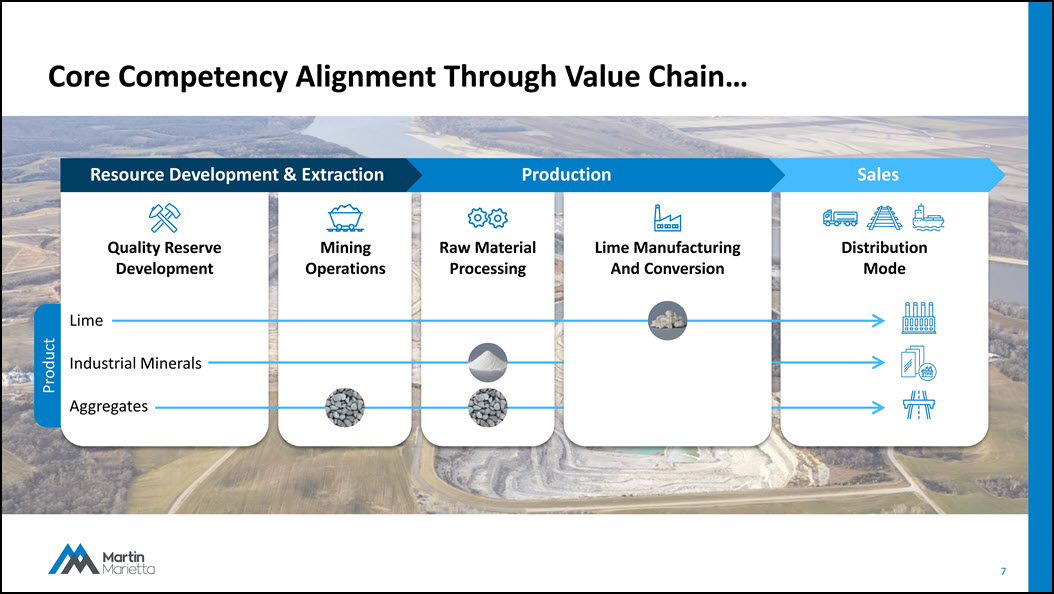
7 Core Competency Alignment Through Value Chain… Sales Production Resource Development & Extraction Quality Reserve Development Mining Operations Raw Material Processing Distribution Mode Lime Industrial Minerals Aggregates Product Lime Manufacturing And Conversion
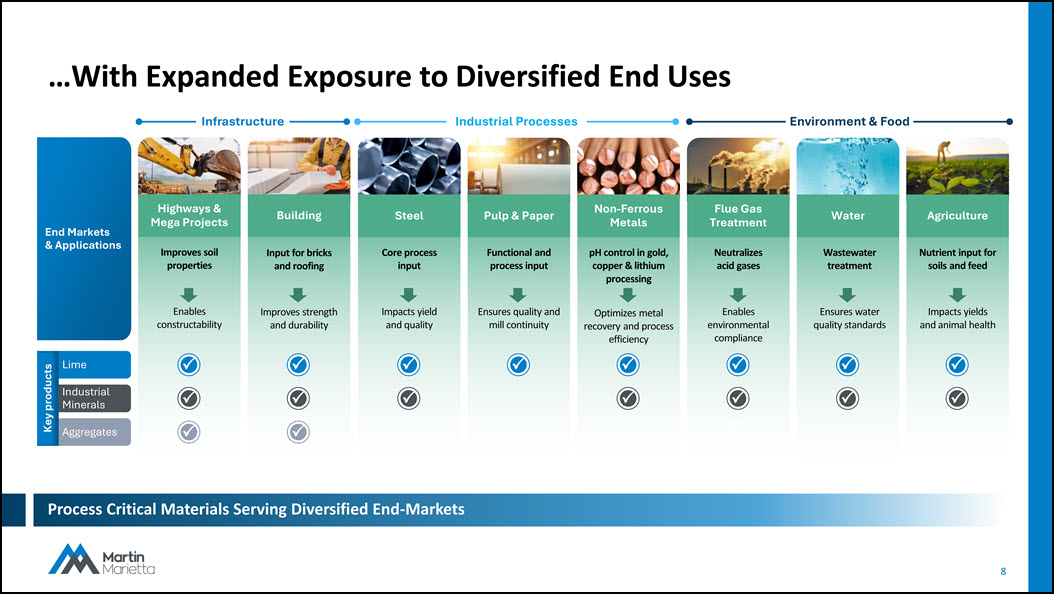
8 …With Expanded Exposure to Diversified End Uses Process Critical Materials Serving Diversified End - Markets End Markets & Applications Lime Industrial Minerals Aggregates Key products Input for bricks and roofing Improves strength and durability Building Improves soil properties Enables constructability Highways & Mega Projects Functional and process input Ensures quality and mill continuity Pulp & Paper Core process input Impacts yield and quality Steel Infrastructure Industrial Processes pH control in gold, copper & lithium processing Optimizes metal recovery and process efficiency Non - Ferrous Metals Wastewater treatment Ensures water quality standards Water Environment & Food Neutralizes acid gases Enables environmental compliance Flue Gas Treatment Nutrient input for soils and feed Impacts yields and animal health Agriculture
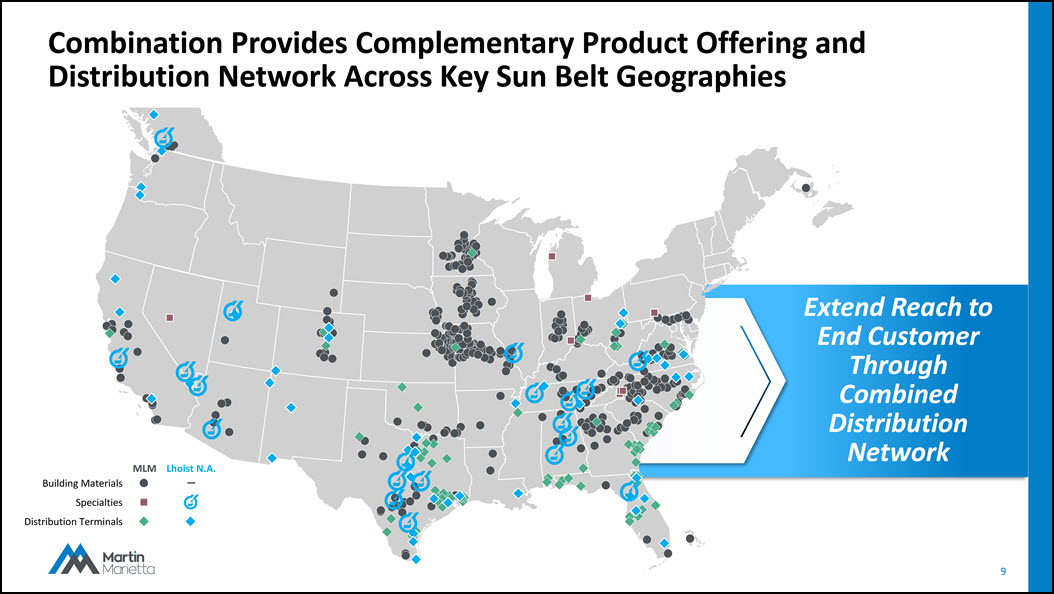
Extend Reach to End Customer Through Combined Distribution Network 9 Combination Provides Complementary Product Offering and Distribution Network Across Key Sun Belt Geographies MLM Lhoist N.A. Building Materials Specialties Distribution Terminals
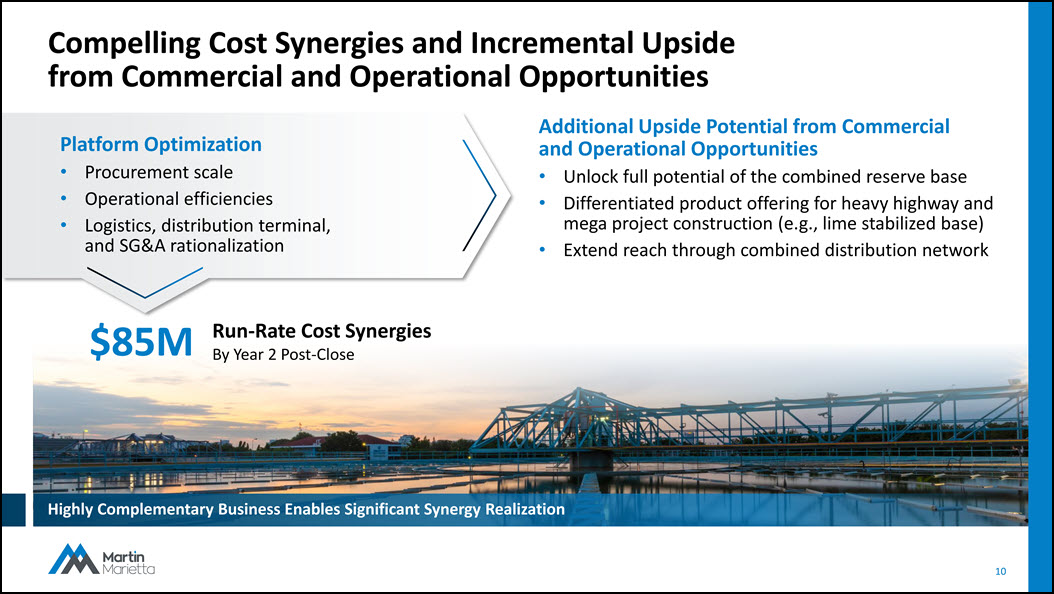
10 Compelling Cost Synergies and Incremental Upside from Commercial and Operational Opportunities Highly Complementary Business Enables Significant Synergy Realization $85M Platform Optimization • Procurement scale • Operational efficiencies • Logistics, distribution terminal, and SG&A rationalization Additional Upside Potential from Commercial and Operational Opportunities • Unlock full potential of the combined reserve base • Differentiated product offering for heavy highway and mega project construction (e.g., lime stabilized base) • Extend reach through combined distribution network Run - Rate Cost Synergies By Year 2 Post - Close
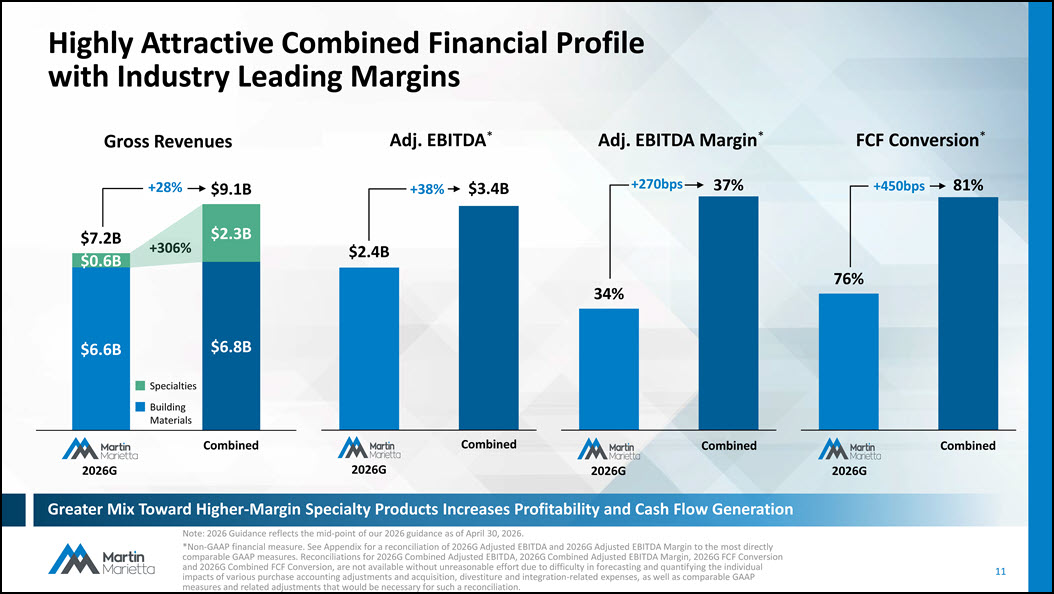
11 Highly Attractive Combined Financial Profile with Industry Leading Margins $6.6B $6.8B $0.6B $2.3B $7.2B $9.1B Combined Gross Revenues +306% Specialties Building Materials +28% $2.4B $3.4B Combined +38% 34% 37% Adj. EBITDA * Adj. EBITDA Margin * Combined +270bps 2026G 2026G 2026G Greater Mix Toward Higher - Margin Specialty Products Increases Profitability and Cash Flow Generation Note: 2026 Guidance reflects the mid - point of our 2026 guidance as of April 30, 2026. *Non - GAAP financial measure. See Appendix for a reconciliation of 2026G Adjusted EBITDA and 2026G Adjusted EBITDA Margin to the most directly comparable GAAP measures. Reconciliations for 2026G Combined Adjusted EBITDA, 2026G Combined Adjusted EBITDA Margin, 2026G FCF Conversion and 2026G Combined FCF Conversion, are not available without unreasonable effort due to difficulty in forecasting and quantifying the individual impacts of various purchase accounting adjustments and acquisition, divestiture and integration - related expenses, as well as comparable GAAP measures and related adjustments that would be necessary for such a reconciliation. 76% 81% FCF Conversion * Combined 2026G +450bps
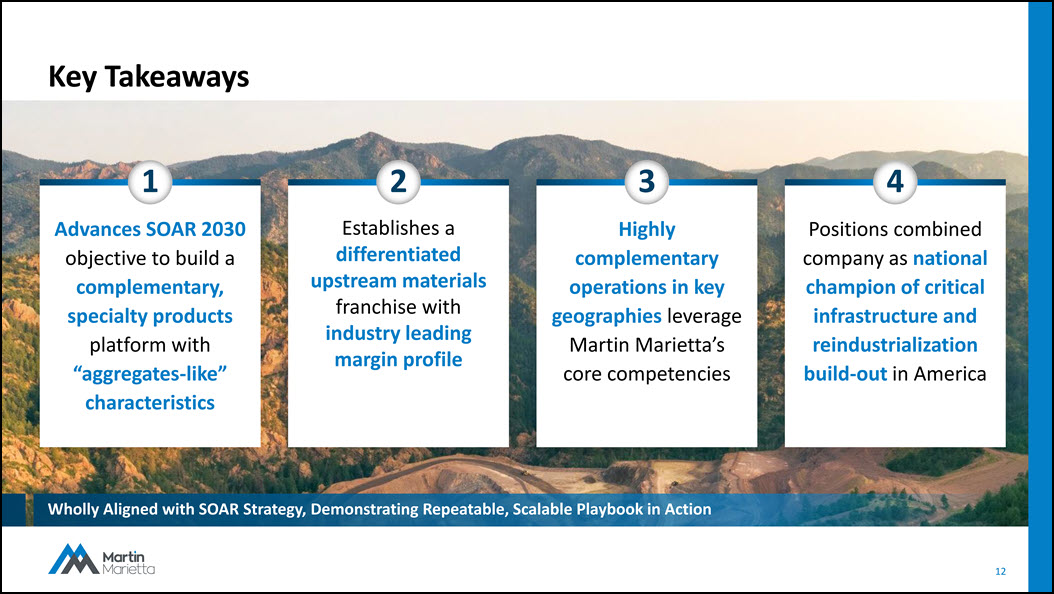
Advances SOAR 2030 objective to build a complementary, specialty products platform with “aggregates - like” characteristics Establishes a differentiated upstream materials franchise with industry leading margin profile 1 Highly complementary operations in key geographies leverage Martin Marietta’s core competencies 3 Positions combined company as national champion of critical infrastructure and reindustrialization build - out in America 4 12 Key Takeaways Wholly Aligned with SOAR Strategy, Demonstrating Repeatable, Scalable Playbook in Action 2

Q&A

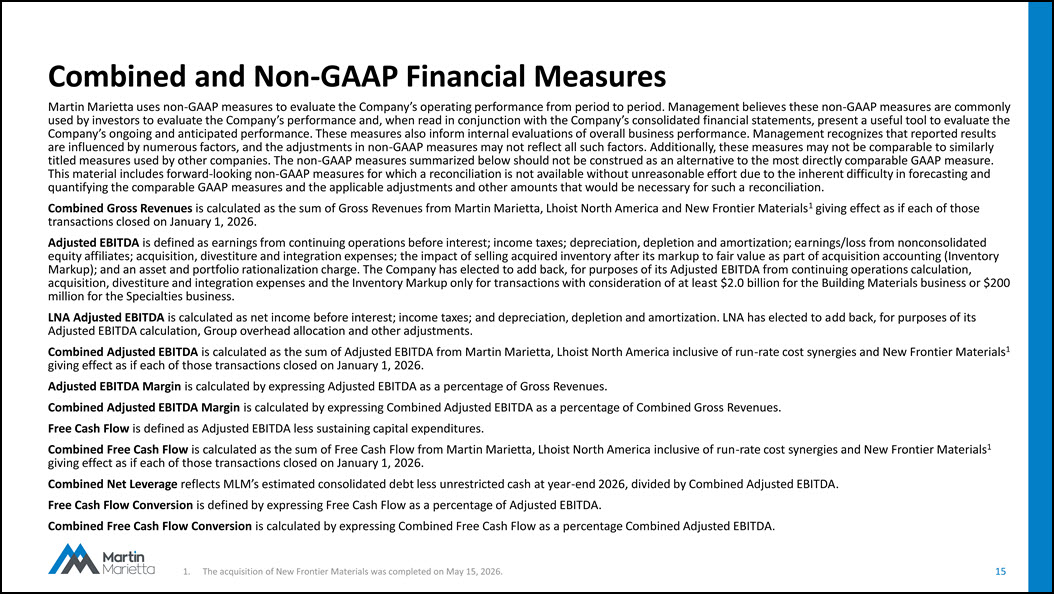
15 1. The acquisition of New Frontier Materials was completed on May 15, 2026. Combined and Non - GAAP Financial Measures Martin Marietta uses non - GAAP measures to evaluate the Company’s operating performance from period to period. Management believes these non - GAAP measures are commonly used by investors to evaluate the Company’s performance and, when read in conjunction with the Company’s consolidated financial statements, present a useful tool to evaluate the Company’s ongoing and anticipated performance. These measures also inform internal evaluations of overall business performance. Management recognizes that reported results are influenced by numerous factors, and the adjustments in non - GAAP measures may not reflect all such factors. Additionally, these measures may not be comparable to similarly titled measures used by other companies. The non - GAAP measures summarized below should not be construed as an alternative to the most directly comparable GAAP measure. This material includes forward - looking non - GAAP measures for which a reconciliation is not available without unreasonable effort due to the inherent difficulty in forecasting and quantifying the comparable GAAP measures and the applicable adjustments and other amounts that would be necessary for such a reconciliation. Combined Gross Revenues is calculated as the sum of Gross Revenues from Martin Marietta, Lhoist North America and New Frontier Materials 1 giving effect as if each of those transactions closed on January 1, 2026. Adjusted EBITDA is defined as earnings from continuing operations before interest; income taxes; depreciation, depletion and amortization; earnings/loss from nonconsolidated equity affiliates; acquisition, divestiture and integration expenses; the impact of selling acquired inventory after its markup to fair value as part of acquisition accounting (Inventory Markup); and an asset and portfolio rationalization charge. The Company has elected to add back, for purposes of its Adjusted EBITDA from continuing operations calculation, acquisition, divestiture and integration expenses and the Inventory Markup only for transactions with consideration of at least $2.0 billion for the Building Materials business or $200 million for the Specialties business. LNA Adjusted EBITDA is calculated as net income before interest; income taxes; and depreciation, depletion and amortization. LNA has elected to add back, for purposes of its Adjusted EBITDA calculation, Group overhead allocation and other adjustments. Combined Adjusted EBITDA is calculated as the sum of Adjusted EBITDA from Martin Marietta, Lhoist North America inclusive of run - rate cost synergies and New Frontier Materials 1 giving effect as if each of those transactions closed on January 1, 2026. Adjusted EBITDA Margin is calculated by expressing Adjusted EBITDA as a percentage of Gross Revenues. Combined Adjusted EBITDA Margin is calculated by expressing Combined Adjusted EBITDA as a percentage of Combined Gross Revenues. Free Cash Flow is defined as Adjusted EBITDA less sustaining capital expenditures. Combined Free Cash Flow is calculated as the sum of Free Cash Flow from Martin Marietta, Lhoist North America inclusive of run - rate cost synergies and New Frontier Materials 1 giving effect as if each of those transactions closed on January 1, 2026. Combined Net Leverage reflects MLM’s estimated consolidated debt less unrestricted cash at year - end 2026, divided by Combined Adjusted EBITDA. Free Cash Flow Conversion is defined by expressing Free Cash Flow as a percentage of Adjusted EBITDA. Combined Free Cash Flow Conversion is calculated by expressing Combined Free Cash Flow as a percentage Combined Adjusted EBITDA.
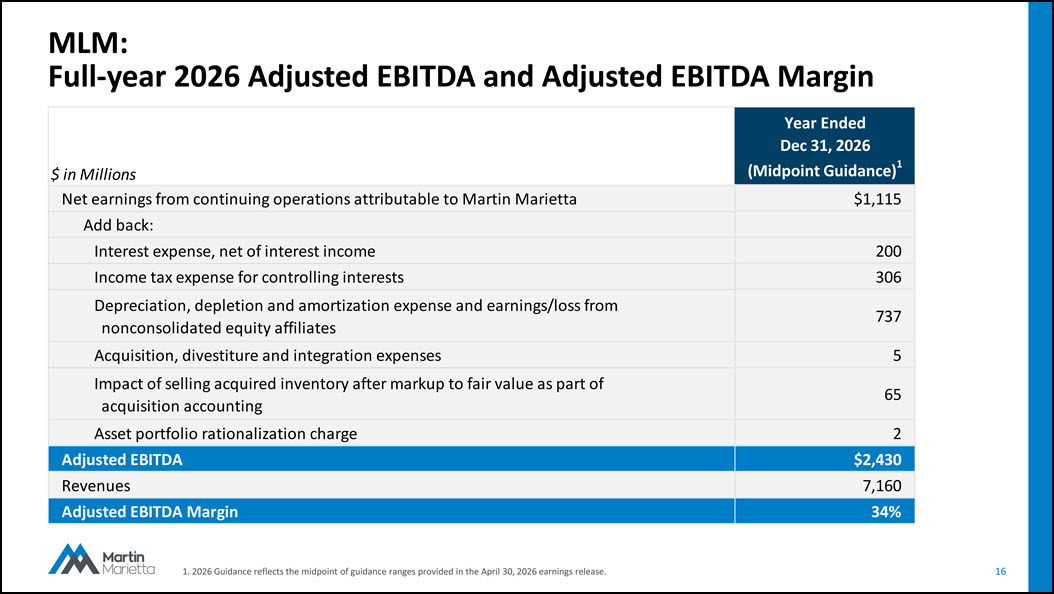
16 MLM: Full - year 2026 Adjusted EBITDA and Adjusted EBITDA Margin 1. 2026 Guidance reflects the midpoint of guidance ranges provided in the April 30, 2026 earnings release. Year Ended Dec 31, 2026 (Midpoint Guidance) 1 $ in Millions $1,115 Net earnings from continuing operations attributable to Martin Marietta Add back: 200 Interest expense, net of interest income 306 Income tax expense for controlling interests 737 Depreciation, depletion and amortization expense and earnings/loss from nonconsolidated equity affiliates 5 Acquisition, divestiture and integration expenses 65 Impact of selling acquired inventory after markup to fair value as part of acquisition accounting 2 Asset portfolio rationalization charge $2,430 Adjusted EBITDA 7,160 Revenues 34% Adjusted EBITDA Margin
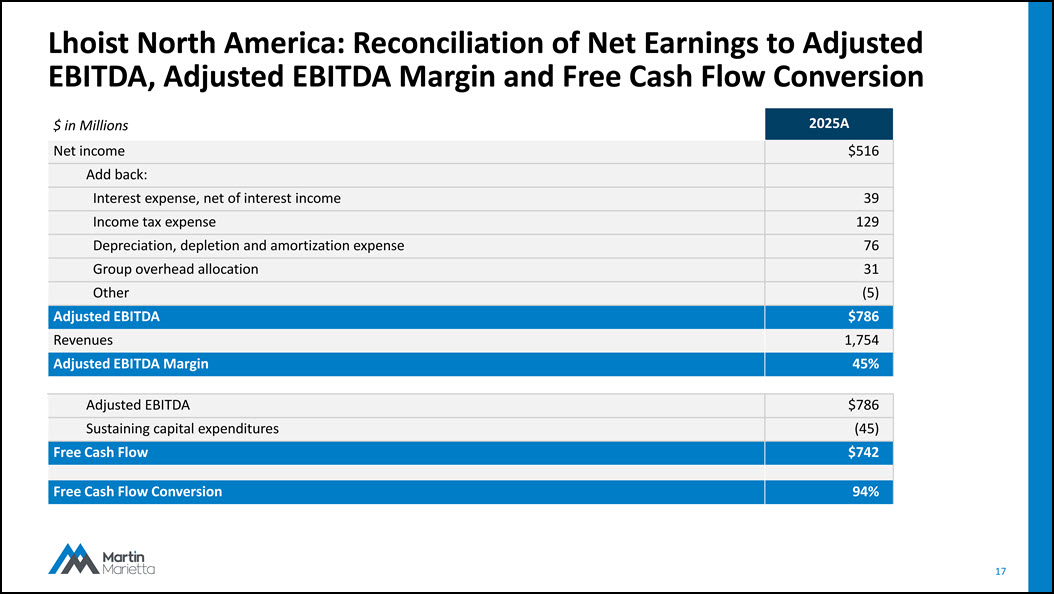
17 Lhoist North America: Reconciliation of Net Earnings to Adjusted EBITDA, Adjusted EBITDA Margin and Free Cash Flow Conversion 2025A $ in Millions $516 Net income Add back: 39 Interest expense, net of interest income 129 Income tax expense 76 Depreciation, depletion and amortization expense 31 Group overhead allocation (5) Other $786 Adjusted EBITDA 1,754 Revenues 45% Adjusted EBITDA Margin $786 Adjusted EBITDA (45) Sustaining capital expenditures $742 Free Cash Flow 94% Free Cash Flow Conversion