Shareholder Report
Apr. 30, 2026
USD ($)
$ / shares
This report describes changes to the Fund that occurred during the reporting period.
WHAT WERE THE FUND COSTS FOR THE LAST YEAR? (based on a hypothetical $10,000 investment)
|
Class Name
|
Costs of a $10,000 investment
|
Costs paid as a percentage of a $10,000 investment
|
|
Class A
|
$105
|
0.99%
|
HOW DID THE FUND PERFORM LAST YEAR AND WHAT AFFECTED ITS PERFORMANCE?
For the twelve months ended April 30, 2026, Class A shares of Putnam Sustainable Future Fund returned 12.66%. The Fund compares its performance to the Russell Midcap Growth Index and the Putnam Sustainable Future Linked Benchmark†, which both returned 12.86% for the same period.
PERFORMANCE HIGHLIGHTS
|
Top contributors to performance:
|
|
|
↑
|
Out-of-benchmark position in Planet Labs, a satellite imagery company.
|
|
↑
|
Out-of-benchmark position in GE Vernova, a global energy technology company.
|
|
↑
|
Overweight position in Vertiv, which specializes in digital infrastructure.
|
|
Top detractors from performance:
|
|
|
↓
|
Not owning Comfort Systems, an HVAC company.
|
|
↓
|
Not owning Monolithic Power Systems, a semiconductor company.
|
|
↓
|
Overweight position in Sprouts Farmers Market, a supermarket chain.
|

AVERAGE ANNUAL TOTAL RETURNS (%) Period Ended April 30, 2026
|
|
1 Year
|
5 Year
|
10 Year
|
|
Class A
|
12.66
|
-0.20
|
8.89
|
|
Class A (with sales charge)
|
6.18
|
-1.38
|
8.25
|
|
Russell 3000 Index
|
31.01
|
11.91
|
14.75
|
|
Russell Midcap Growth Index
|
12.86
|
5.54
|
12.40
|
|
Putnam Sustainable Future Linked Benchmark†
|
12.86
|
5.54
|
11.32
|
For current month-end performance, please call Franklin Templeton at (800) 225-1581 or visit
https://www.franklintempleton.com/investments/options/mutual-funds.
https://www.franklintempleton.com/investments/options/mutual-funds.
Important data provider notices and terms available at www.franklintempletondatasources.com.
KEY FUND STATISTICS (as of April 30, 2026)
|
Total Net Assets
|
$327,366,016
|
|
Total Number of Portfolio Holdings (excludes derivatives, except purchased options, if any)
|
70
|
|
Total Management Fee Paid
|
$1,904,775
|
|
Portfolio Turnover Rate
|
59%
|
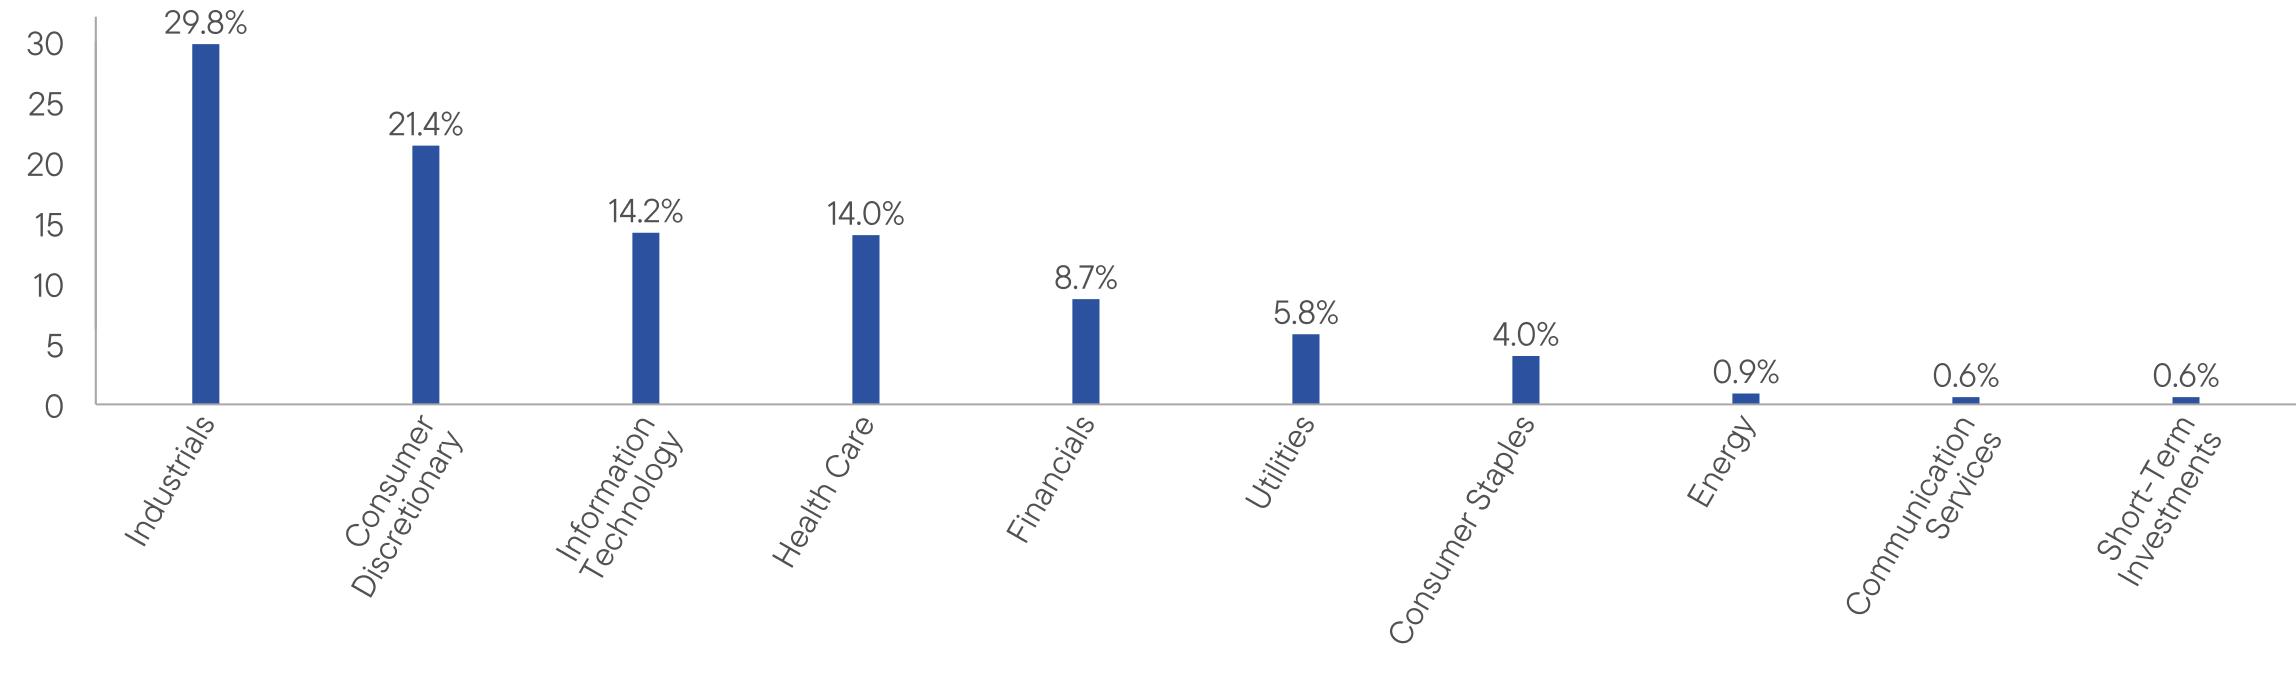
WHAT DID THE FUND INVEST IN? (as of April 30, 2026)
Portfolio Composition* (% of Total Investments)

HOW HAS THE FUND CHANGED?
Effective September 1, 2025, the Fund’s investment goal was revised to read: “The Fund seeks capital appreciation.”
Effective January 1, 2026, the portfolio managers for the Fund are Stephanie Dobson and Rob Forker.
Putnam Investment Management, LLC, the investment manager of the Fund, has recommended, and the Fund’s Board of Trustees has approved, the merger of the Fund with and into Putnam U.S. Research Fund. The merger is expected to be completed in the third quarter of 2026.
This is a summary of certain changes to the Fund since May 1, 2025. For more complete information, you may review the Fund’s current prospectus and any applicable supplements and the Fund’s next prospectus, which we expect to be available by September 1, 2026, at https://www.franklintempleton.com/regulatory-fund-documents or upon request at (800) 225-1581 or
funddocuments@putnam.com.
funddocuments@putnam.com.
This report describes changes to the Fund that occurred during the reporting period.
WHAT WERE THE FUND COSTS FOR THE LAST YEAR? (based on a hypothetical $10,000 investment)
|
Class Name
|
Costs of a $10,000 investment
|
Costs paid as a percentage of a $10,000 investment
|
|
Class C
|
$184
|
1.74%
|
HOW DID THE FUND PERFORM LAST YEAR AND WHAT AFFECTED ITS PERFORMANCE?
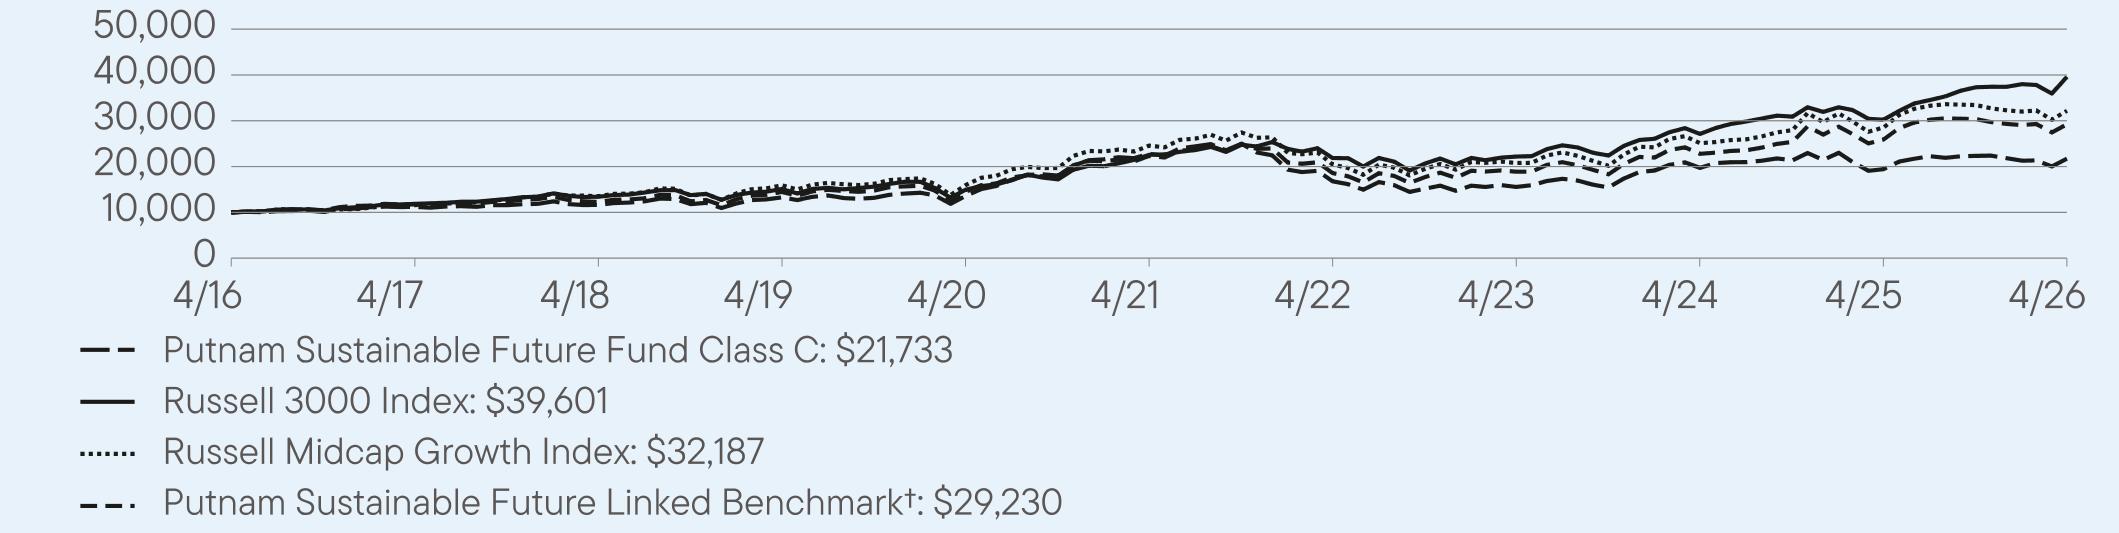
For the twelve months ended April 30, 2026, Class C shares of Putnam Sustainable Future Fund returned 11.83%. The Fund compares its performance to the Russell Midcap Growth Index and the Putnam Sustainable Future Linked Benchmark†, which both returned 12.86% for the same period.
PERFORMANCE HIGHLIGHTS
|
Top contributors to performance:
|
|
|
↑
|
Out-of-benchmark position in Planet Labs, a satellite imagery company.
|
|
↑
|
Out-of-benchmark position in GE Vernova, a global energy technology company.
|
|
↑
|
Overweight position in Vertiv, which specializes in digital infrastructure.
|
|
Top detractors from performance:
|
|
|
↓
|
Not owning Comfort Systems, an HVAC company.
|
|
↓
|
Not owning Monolithic Power Systems, a semiconductor company.
|
|
↓
|
Overweight position in Sprouts Farmers Market, a supermarket chain.
|
AVERAGE ANNUAL TOTAL RETURNS (%) Period Ended April 30, 2026
|
|
1 Year
|
5 Year
|
10 Year
|
|
Class C
|
11.83
|
-0.95
|
8.23
|
|
Class C (with sales charge)
|
10.88
|
-0.95
|
8.23
|
|
Russell 3000 Index
|
31.01
|
11.91
|
14.75
|
|
Russell Midcap Growth Index
|
12.86
|
5.54
|
12.40
|
|
Putnam Sustainable Future Linked Benchmark†
|
12.86
|
5.54
|
11.32
|
For current month-end performance, please call Franklin Templeton at (800) 225-1581 or visit
https://www.franklintempleton.com/investments/options/mutual-funds.
https://www.franklintempleton.com/investments/options/mutual-funds.
Important data provider notices and terms available at www.franklintempletondatasources.com.
KEY FUND STATISTICS (as of April 30, 2026)
|
Total Net Assets
|
$327,366,016
|
|
Total Number of Portfolio Holdings (excludes derivatives, except purchased options, if any)
|
70
|
|
Total Management Fee Paid
|
$1,904,775
|
|
Portfolio Turnover Rate
|
59%
|
WHAT DID THE FUND INVEST IN? (as of April 30, 2026)
Portfolio Composition* (% of Total Investments)
HOW HAS THE FUND CHANGED?
Effective September 1, 2025, the Fund’s investment goal was revised to read: “The Fund seeks capital appreciation.”
Effective January 1, 2026, the portfolio managers for the Fund are Stephanie Dobson and Rob Forker.
Putnam Investment Management, LLC, the investment manager of the Fund, has recommended, and the Fund’s Board of Trustees has approved, the merger of the Fund with and into Putnam U.S. Research Fund. The merger is expected to be completed in the third quarter of 2026.
This is a summary of certain changes to the Fund since May 1, 2025. For more complete information, you may review the Fund’s current prospectus and any applicable supplements and the Fund’s next prospectus, which we expect to be available by September 1, 2026, at https://www.franklintempleton.com/regulatory-fund-documents or upon request at (800) 225-1581 or
funddocuments@putnam.com.
funddocuments@putnam.com.
This report describes changes to the Fund that occurred during the reporting period.
WHAT WERE THE FUND COSTS FOR THE LAST YEAR? (based on a hypothetical $10,000 investment)
|
Class Name
|
Costs of a $10,000 investment
|
Costs paid as a percentage of a $10,000 investment
|
|
Class R
|
$132
|
1.24%
|
HOW DID THE FUND PERFORM LAST YEAR AND WHAT AFFECTED ITS PERFORMANCE?
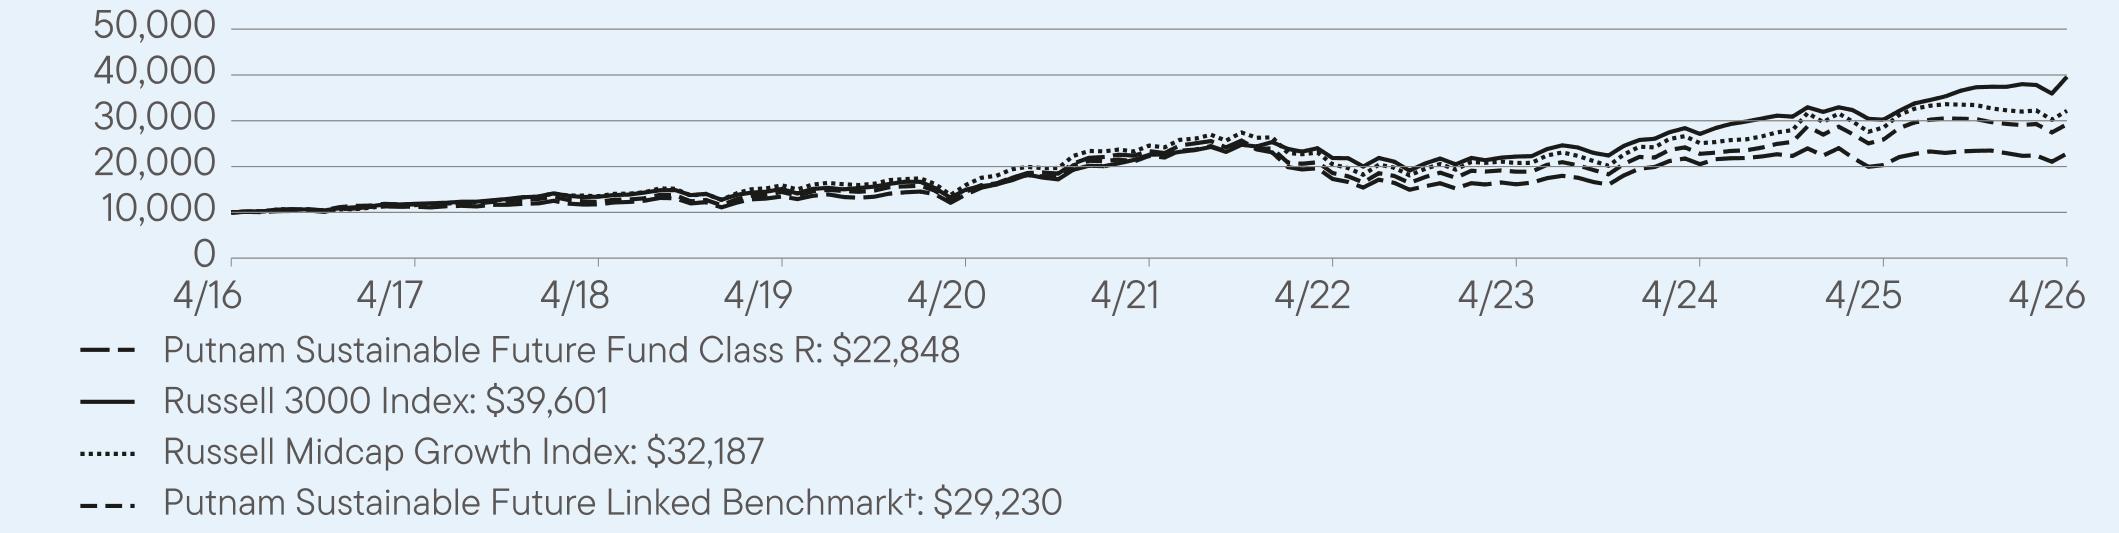
For the twelve months ended April 30, 2026, Class R shares of Putnam Sustainable Future Fund returned 12.35%. The Fund compares its performance to the Russell Midcap Growth Index and the Putnam Sustainable Future Linked Benchmark†, which both returned 12.86% for the same period.
PERFORMANCE HIGHLIGHTS
|
Top contributors to performance:
|
|
|
↑
|
Out-of-benchmark position in Planet Labs, a satellite imagery company.
|
|
↑
|
Out-of-benchmark position in GE Vernova, a global energy technology company.
|
|
↑
|
Overweight position in Vertiv, which specializes in digital infrastructure.
|
|
Top detractors from performance:
|
|
|
↓
|
Not owning Comfort Systems, an HVAC company.
|
|
↓
|
Not owning Monolithic Power Systems, a semiconductor company.
|
|
↓
|
Overweight position in Sprouts Farmers Market, a supermarket chain.
|
AVERAGE ANNUAL TOTAL RETURNS (%) Period Ended April 30, 2026
|
|
1 Year
|
5 Year
|
10 Year
|
|
Class R
|
12.35
|
-0.46
|
8.61
|
|
Russell 3000 Index
|
31.01
|
11.91
|
14.75
|
|
Russell Midcap Growth Index
|
12.86
|
5.54
|
12.40
|
|
Putnam Sustainable Future Linked Benchmark†
|
12.86
|
5.54
|
11.32
|
For current month-end performance, please call Franklin Templeton at (800) 225-1581 or visit
https://www.franklintempleton.com/investments/options/mutual-funds.
https://www.franklintempleton.com/investments/options/mutual-funds.
Important data provider notices and terms available at www.franklintempletondatasources.com.
KEY FUND STATISTICS (as of April 30, 2026)
|
Total Net Assets
|
$327,366,016
|
|
Total Number of Portfolio Holdings (excludes derivatives, except purchased options, if any)
|
70
|
|
Total Management Fee Paid
|
$1,904,775
|
|
Portfolio Turnover Rate
|
59%
|
WHAT DID THE FUND INVEST IN? (as of April 30, 2026)
Portfolio Composition* (% of Total Investments)

HOW HAS THE FUND CHANGED?
Effective September 1, 2025, the Fund’s investment goal was revised to read: “The Fund seeks capital appreciation.”
Effective January 1, 2026, the portfolio managers for the Fund are Stephanie Dobson and Rob Forker.
Putnam Investment Management, LLC, the investment manager of the Fund, has recommended, and the Fund’s Board of Trustees has approved, the merger of the Fund with and into Putnam U.S. Research Fund. The merger is expected to be completed in the third quarter of 2026.
This is a summary of certain changes to the Fund since May 1, 2025. For more complete information, you may review the Fund’s current prospectus and any applicable supplements and the Fund’s next prospectus, which we expect to be available by September 1, 2026, at https://www.franklintempleton.com/regulatory-fund-documents or upon request at (800) 225-1581 or
funddocuments@putnam.com.
funddocuments@putnam.com.
This report describes changes to the Fund that occurred during the reporting period.
WHAT WERE THE FUND COSTS FOR THE LAST YEAR? (based on a hypothetical $10,000 investment)
|
Class Name
|
Costs of a $10,000 investment
|
Costs paid as a percentage of a $10,000 investment
|
|
Class R6
|
$68
|
0.64%
|
HOW DID THE FUND PERFORM LAST YEAR AND WHAT AFFECTED ITS PERFORMANCE?
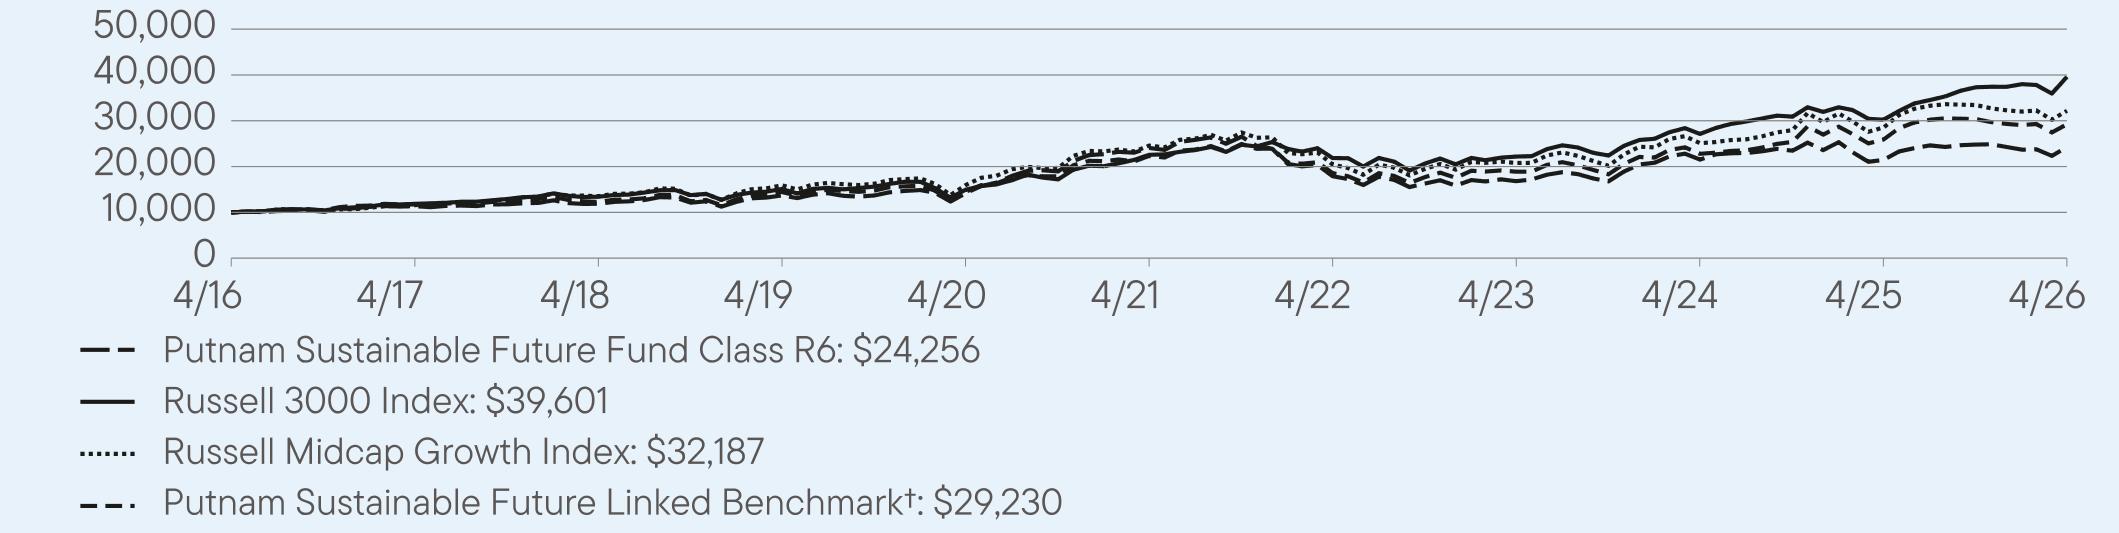
For the twelve months ended April 30, 2026, Class R6 shares of Putnam Sustainable Future Fund returned 13.02%. The Fund compares its performance to the Russell Midcap Growth Index and the Putnam Sustainable Future Linked Benchmark†, which both returned 12.86% for the same period.
PERFORMANCE HIGHLIGHTS
|
Top contributors to performance:
|
|
|
↑
|
Out-of-benchmark position in Planet Labs, a satellite imagery company.
|
|
↑
|
Out-of-benchmark position in GE Vernova, a global energy technology company.
|
|
↑
|
Overweight position in Vertiv, which specializes in digital infrastructure.
|
|
Top detractors from performance:
|
|
|
↓
|
Not owning Comfort Systems, an HVAC company.
|
|
↓
|
Not owning Monolithic Power Systems, a semiconductor company.
|
|
↓
|
Overweight position in Sprouts Farmers Market, a supermarket chain.
|
AVERAGE ANNUAL TOTAL RETURNS (%) Period Ended April 30, 2026
|
|
1 Year
|
5 Year
|
10 Year
|
|
Class R6
|
13.02
|
0.16
|
9.27
|
|
Russell 3000 Index
|
31.01
|
11.91
|
14.75
|
|
Russell Midcap Growth Index
|
12.86
|
5.54
|
12.40
|
|
Putnam Sustainable Future Linked Benchmark†
|
12.86
|
5.54
|
11.32
|
For current month-end performance, please call Franklin Templeton at (800) 225-1581 or visit
https://www.franklintempleton.com/investments/options/mutual-funds.
https://www.franklintempleton.com/investments/options/mutual-funds.
Important data provider notices and terms available at www.franklintempletondatasources.com.
KEY FUND STATISTICS (as of April 30, 2026)
|
Total Net Assets
|
$327,366,016
|
|
Total Number of Portfolio Holdings (excludes derivatives, except purchased options, if any)
|
70
|
|
Total Management Fee Paid
|
$1,904,775
|
|
Portfolio Turnover Rate
|
59%
|
WHAT DID THE FUND INVEST IN? (as of April 30, 2026)
Portfolio Composition* (% of Total Investments)

HOW HAS THE FUND CHANGED?
Effective September 1, 2025, the Fund’s investment goal was revised to read: “The Fund seeks capital appreciation.”
Effective January 1, 2026, the portfolio managers for the Fund are Stephanie Dobson and Rob Forker.
Putnam Investment Management, LLC, the investment manager of the Fund, has recommended, and the Fund’s Board of Trustees has approved, the merger of the Fund with and into Putnam U.S. Research Fund. The merger is expected to be completed in the third quarter of 2026.
This is a summary of certain changes to the Fund since May 1, 2025. For more complete information, you may review the Fund’s current prospectus and any applicable supplements and the Fund’s next prospectus, which we expect to be available by September 1, 2026, at https://www.franklintempleton.com/regulatory-fund-documents or upon request at (800) 225-1581 or
funddocuments@putnam.com.
funddocuments@putnam.com.
This report describes changes to the Fund that occurred during the reporting period.
WHAT WERE THE FUND COSTS FOR THE LAST YEAR? (based on a hypothetical $10,000 investment)
|
Class Name
|
Costs of a $10,000 investment
|
Costs paid as a percentage of a $10,000 investment
|
|
Class Y
|
$79
|
0.74%
|
HOW DID THE FUND PERFORM LAST YEAR AND WHAT AFFECTED ITS PERFORMANCE?
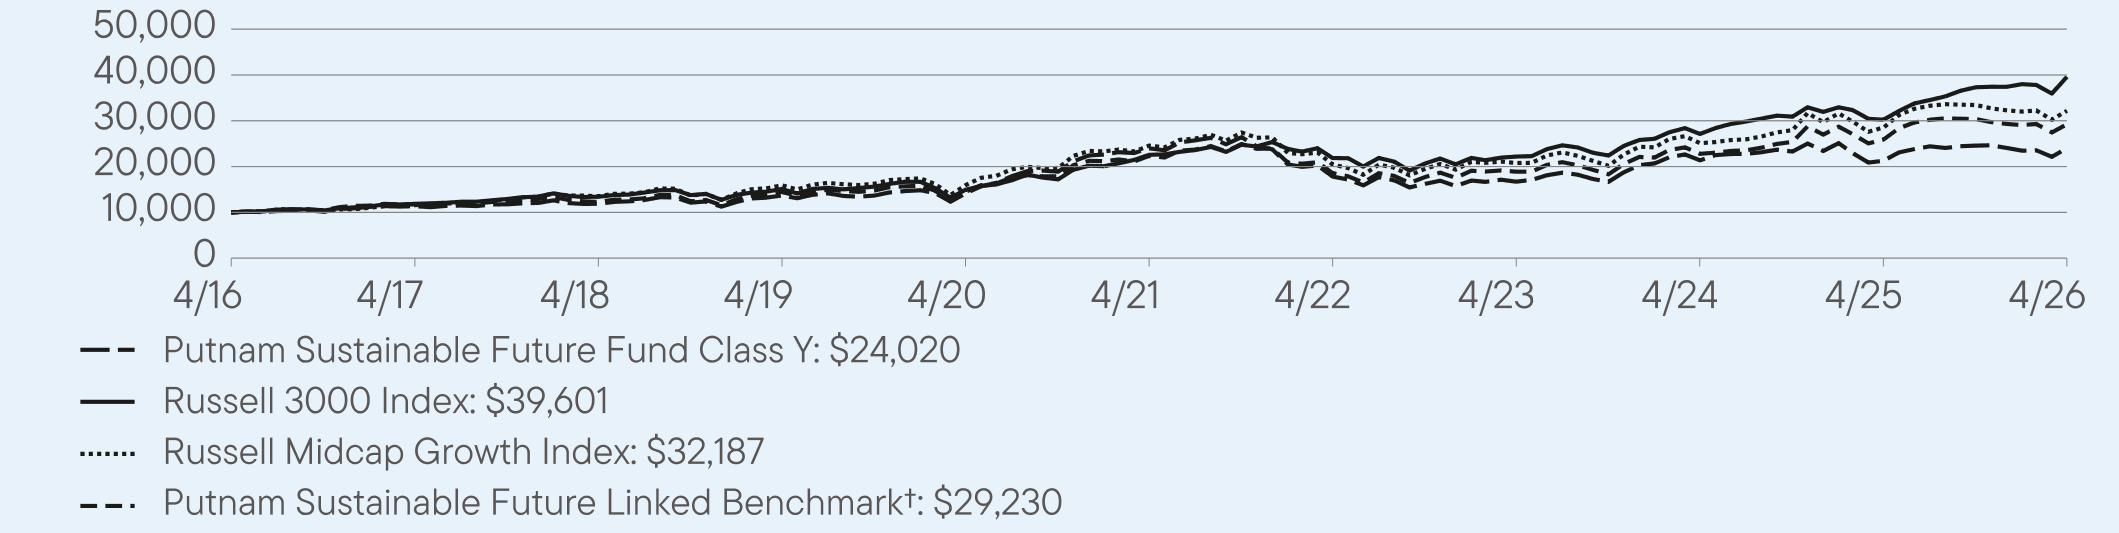
For the twelve months ended April 30, 2026, Class Y shares of Putnam Sustainable Future Fund returned 12.87%. The Fund compares its performance to the Russell Midcap Growth Index and the Putnam Sustainable Future Linked Benchmark†, which both returned 12.86% for the same period.
PERFORMANCE HIGHLIGHTS
|
Top contributors to performance:
|
|
|
↑
|
Out-of-benchmark position in Planet Labs, a satellite imagery company.
|
|
↑
|
Out-of-benchmark position in GE Vernova, a global energy technology company.
|
|
↑
|
Overweight position in Vertiv, which specializes in digital infrastructure.
|
|
Top detractors from performance:
|
|
|
↓
|
Not owning Comfort Systems, an HVAC company.
|
|
↓
|
Not owning Monolithic Power Systems, a semiconductor company.
|
|
↓
|
Overweight position in Sprouts Farmers Market, a supermarket chain.
|
AVERAGE ANNUAL TOTAL RETURNS (%) Period Ended April 30, 2026
|
|
1 Year
|
5 Year
|
10 Year
|
|
Class Y
|
12.87
|
0.03
|
9.16
|
|
Russell 3000 Index
|
31.01
|
11.91
|
14.75
|
|
Russell Midcap Growth Index
|
12.86
|
5.54
|
12.40
|
|
Putnam Sustainable Future Linked Benchmark†
|
12.86
|
5.54
|
11.32
|
For current month-end performance, please call Franklin Templeton at (800) 225-1581 or visit
https://www.franklintempleton.com/investments/options/mutual-funds.
https://www.franklintempleton.com/investments/options/mutual-funds.
Important data provider notices and terms available at www.franklintempletondatasources.com.
KEY FUND STATISTICS (as of April 30, 2026)
|
Total Net Assets
|
$327,366,016
|
|
Total Number of Portfolio Holdings (excludes derivatives, except purchased options, if any)
|
70
|
|
Total Management Fee Paid
|
$1,904,775
|
|
Portfolio Turnover Rate
|
59%
|
WHAT DID THE FUND INVEST IN? (as of April 30, 2026)
Portfolio Composition* (% of Total Investments)

HOW HAS THE FUND CHANGED?
Effective September 1, 2025, the Fund’s investment goal was revised to read: “The Fund seeks capital appreciation.”
Effective January 1, 2026, the portfolio managers for the Fund are Stephanie Dobson and Rob Forker.
Putnam Investment Management, LLC, the investment manager of the Fund, has recommended, and the Fund’s Board of Trustees has approved, the merger of the Fund with and into Putnam U.S. Research Fund. The merger is expected to be completed in the third quarter of 2026.
This is a summary of certain changes to the Fund since May 1, 2025. For more complete information, you may review the Fund’s current prospectus and any applicable supplements and the Fund’s next prospectus, which we expect to be available by September 1, 2026, at https://www.franklintempleton.com/regulatory-fund-documents or upon request at (800) 225-1581 or
funddocuments@putnam.com.
funddocuments@putnam.com.
| [1] |
|
||
| [2] |
|
||
| [3] |
|
||
| [4] |
|
||
| [5] |
|
||
| [6] |
|
||
| [7] |
|
||
| [8] |
|
||
| [9] |
|
||
| [10] |
|