The bar chart and the performance table below provide some indication of the risks of investing in the Fund by showing changes in the Fund's performance from year to year for the past ten calendar years and by showing how the Fund's average annual returns for 1, 5 and 10 years and since the Fund's inception compare with those of a broad measure of market performance. The Fund's past performance (before and after taxes) is not necessarily an indication of how the Fund will perform in the future. For current performance information, please call 1-800-DIAL-SEI.
|
|
Best Quarter: 21.52% (6/30/2020) Worst Quarter: -24.11% (3/31/2020) The Fund's Class F total return (pre-tax) from January 1, 2026 to March 31, 2026 was -2.71%. |
||||||
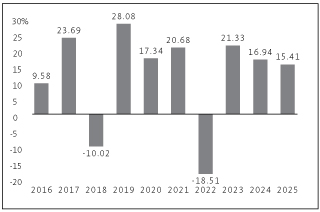
Best Quarter: 21.52% (6/30/2020)
Worst Quarter: -24.11% (3/31/2020)
The Fund's Class F total return (pre-tax) from January 1, 2026 to March 31, 2026 was -2.71%
This table compares the Fund's average annual total returns to those of the S&P 500 Index (a broad-based securities market index), and two additional indexes with characteristics relevant to the Fund's investment strategy. The Fund's additional indexes are the Russell 3000 Index and the MSCI All Country World Index. In prior years, the Fund also compared its performance to a blended benchmark composed of the Russell 3000 and the MSCI ACWI ex USA Index weighted 80%/20%.
After-tax returns are calculated using the historical highest individual federal marginal income tax rates and do not reflect the impact of state and local taxes. Your actual after-tax returns will depend on your tax situation and may differ from those shown. After-tax returns shown are not relevant to investors who hold their Fund shares through tax-deferred arrangements, such as 401(k) plans or individual retirement accounts.
|
Catholic Values Equity Fund — Class F |
1 Year |
5 Years |
10 Years |
Since Inception (04/30/2015) |
|||||||||||||||
|
Return Before Taxes |
15.41 |
% |
10.00 |
% |
11.43 |
% |
9.98 |
% |
|||||||||||
|
Return After Taxes on Distributions |
13.59 |
% |
8.12 |
% |
10.11 |
% |
8.74 |
% |
|||||||||||
|
Return After Taxes on Distributions and Sale of Fund Shares |
10.29 |
% |
7.49 |
% |
9.13 |
% |
7.91 |
% |
|||||||||||
|
S&P 500 Index Return (reflects no deduction for fees, expenses or taxes) |
17.88 |
% |
14.42 |
% |
14.82 |
% |
13.76 |
% |
|||||||||||
|
Russell 3000 Index Return (reflects no deduction for fees, expenses or taxes) |
17.15 |
% |
13.15 |
% |
14.29 |
% |
13.13 |
% |
|||||||||||
|
MSCI All Country World Index Return (reflects no deduction for fees, expenses or taxes) |
22.34 |
% |
11.19 |
% |
11.72 |
% |
10.16 |
% |
|||||||||||
The bar chart and the performance table below provide some indication of the risks of investing in the Fund by showing changes in the Fund's performance from year to year for the past ten calendar years and by showing how the Fund's average annual returns for 1, 5 and 10 years and since the Fund's inception compare with those of a broad measure of market performance. The Fund's past performance (before and after taxes) is not necessarily an indication of how the Fund will perform in the future. For current performance information, please call 1-800-DIAL-SEI.
|
|
Best Quarter: 6.96% (12/31/2023) Worst Quarter: -6.22% (3/31/2022) The Fund's Class F total return (pre-tax) from January 1, 2026 to March 31, 2026 was -0.12%. |
||||||
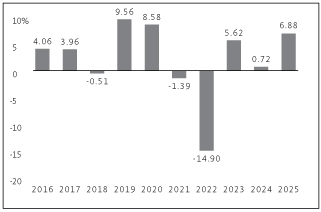
| Best Quarter: 6.96% (12/31/2023) Worst Quarter: -6.22% (3/31/2022) The Fund's Class F total return (pre-tax) from January 1, 2026 to March 31, 2026 was -0.12% |
After-tax returns are calculated using the historical highest individual federal marginal income tax rates and do not reflect the impact of state and local taxes. Your actual after-tax returns will depend on your tax situation and may differ from those shown. After-tax returns shown are not relevant to investors who hold their Fund shares through tax-deferred arrangements, such as 401(k) plans or individual retirement accounts.
|
Catholic Values Fixed Income Fund — Class F |
1 Year |
5 Years |
10 Years |
Since Inception (04/30/2015) |
|||||||||||||||
|
Return Before Taxes |
6.88 |
% |
-0.93 |
% |
2.02 |
% |
1.77 |
% |
|||||||||||
|
Return After Taxes on Distributions |
5.26 |
% |
-2.14 |
% |
0.75 |
% |
0.53 |
% |
|||||||||||
|
Return After Taxes on Distributions and Sale of Fund Shares |
4.05 |
% |
-1.22 |
% |
1.01 |
% |
0.82 |
% |
|||||||||||
|
Bloomberg U.S. Aggregate Bond Index Return (reflects no deduction for fees, expenses or taxes) |
7.30 |
% |
-0.36 |
% |
2.01 |
% |
1.81 |
% |
|||||||||||
The bar chart and the performance table below provide some indication of the risks of investing in the Fund by showing changes in the Fund's performance from year to year for the past ten calendar years and by showing how the Fund's average annual returns for 1, 5 and 10 years and since the Fund's inception compare with those of a broad measure of market performance. The Fund's past performance (before and after taxes) is not necessarily an indication of how the Fund will perform in the future. For current performance information, please call 1-800-DIAL-SEI.
|
|
Best Quarter: 21.46% (6/30/2020) Worst Quarter: -24.09% (3/31/2020) The Fund's Class Y total return (pre-tax) from January 1, 2026 to March 31, 2026 was -2.66%. |
||||||
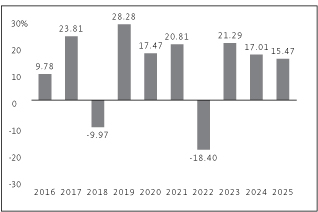
Best Quarter: 21.46% (6/30/2020)
Worst Quarter: -24.09% (3/31/2020)
The Fund's Class Y total return (pre-tax) from January 1, 2026 to March 31, 2026 was -2.66%.
This table compares the Fund's average annual total returns to those of the S&P 500 Index (a broad-based securities market index), and two additional indexes with characteristics relevant to the Fund's investment strategy. The Fund's additional indexes are the Russell 3000 Index and the MSCI All Country World Index. In prior years, the Fund also compared its performance to a blended benchmark composed of the Russell 3000 and the MSCI ACWI ex USA Index weighted 80%/20%.
After-tax returns are calculated using the historical highest individual federal marginal income tax rates and do not reflect the impact of state and local taxes. Your actual after-tax returns will depend on your tax situation and may differ from those shown. After-tax returns shown are not relevant to investors who hold their Fund shares through tax-deferred arrangements, such as 401(k) plans or individual retirement accounts.
|
Catholic Values Equity Fund — Class Y |
1 Year |
5 Years |
10 Years |
Since Inception (05/29/2015) |
|||||||||||||||
|
Return Before Taxes |
15.47 |
% |
10.07 |
% |
11.54 |
% |
10.11 |
% |
|||||||||||
|
Return After Taxes on Distributions |
13.64 |
% |
8.17 |
% |
10.18 |
% |
8.83 |
% |
|||||||||||
|
Return After Taxes on Distributions and Sale of Fund Shares |
10.34 |
% |
7.54 |
% |
9.21 |
% |
8.01 |
% |
|||||||||||
|
S&P 500 Index Return (reflects no deduction for fees, expenses or taxes) |
17.88 |
% |
14.42 |
% |
14.82 |
% |
13.73 |
% |
|||||||||||
|
Russell 3000 Index Return (reflects no deduction for fees, expenses or taxes) |
17.15 |
% |
13.15 |
% |
14.29 |
% |
13.09 |
% |
|||||||||||
|
MSCI All Country World Index Return (reflects no deduction for fees, expenses or taxes) |
22.34 |
% |
11.19 |
% |
11.72 |
% |
10.25 |
% |
|||||||||||
The bar chart and the performance table below provide some indication of the risks of investing in the Fund by showing changes in the Fund's performance from year to year for the past ten calendar years and by showing how the Fund's average annual returns for 1, 5 and 10 years and since the Fund's inception compare with those of a broad measure of market performance. The Fund's past performance (before and after taxes) is not necessarily an indication of how the Fund will perform in the future. For current performance information, please call 1-800-DIAL-SEI.
|
|
Best Quarter: 7.11% (12/31/2023) Worst Quarter: -6.22% (3/31/2022) The Fund's Class Y total return (pre-tax) from January 1, 2026 to March 31, 2026 was 0.13%. |
||||||
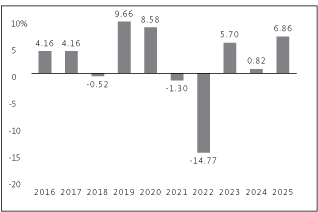
| Best Quarter: 7.11% (12/31/2023) Worst Quarter: -6.22% (3/31/2022) The Fund's Class Y total return (pre-tax) from January 1, 2026 to March 31, 2026 was 0.13%. |
After-tax returns are calculated using the historical highest individual federal marginal income tax rates and do not reflect the impact of state and local taxes. Your actual after-tax returns will depend on your tax situation and may differ from those shown. After-tax returns shown are not relevant to investors who hold their Fund shares through tax-deferred arrangements, such as 401(k) plans or individual retirement accounts.
|
Catholic Values Fixed Income Fund — Class Y |
1 Year |
5 Years |
10 Years |
Since Inception (05/29/2015) |
|||||||||||||||
|
Return Before Taxes |
6.86 |
% |
-0.85 |
% |
2.10 |
% |
1.91 |
% |
|||||||||||
|
Return After Taxes on Distributions |
5.19 |
% |
-2.09 |
% |
0.79 |
% |
0.63 |
% |
|||||||||||
|
Return After Taxes on Distributions and Sale of Fund Shares |
4.04 |
% |
-1.17 |
% |
1.05 |
% |
0.91 |
% |
|||||||||||
|
Bloomberg U.S. Aggregate Bond Index Return (reflects no deduction for fees, expenses or taxes) |
7.30 |
% |
-0.36 |
% |
2.01 |
% |
1.85 |
% |
|||||||||||