Long-term capital appreciation.
This table describes the fees and expenses that you may pay if you buy, hold, and sell Fund shares. You may pay other fees, such as brokerage commissions and other fees to financial intermediaries, which are not reflected in this table and examples below.
|
(expenses that you pay each year as a percentage of the value of your investment) |
Class Y Shares |
||||||
|
Management Fees |
0.45 |
% |
|||||
|
Distribution (12b-1) Fees |
None |
||||||
|
Other Expenses |
0.37 |
% |
|||||
|
Total Annual Fund Operating Expenses |
0.82 |
%* |
|||||
* Expenses have been restated to reflect current expenses. Consequently, the Fund's total Annual Fund Operating Expenses will differ from the numbers shown in the Fund's financial statements (or the "Financial Highlights" section in the prospectus).
This Example is intended to help you compare the cost of investing in the Fund with the cost of investing in other mutual funds. The Example assumes that you invest $10,000 in the Fund for the time periods indicated and then redeem or hold all of your shares at the end of those periods. The Example also assumes that your investment has a 5% return each year and that the Fund's operating expenses remain the same.
|
1 Year |
3 Years |
5 Years |
10 Years |
||||||||||||||||
|
Catholic Values Equity Fund — Class Y Shares |
$ |
84 |
$ |
262 |
$ |
455 |
$ |
1,014 |
|||||||||||
|
1 Year |
3 Years |
5 Years |
10 Years |
||||||||||||||||
|
Catholic Values Equity Fund — Class Y Shares |
$ |
84 |
$ |
262 |
$ |
455 |
$ |
1,014 |
|||||||||||
The Fund pays transaction costs, such as commissions, when it buys and sells securities (or "turns over" its portfolio). A higher portfolio turnover rate may indicate higher transaction costs and may result in higher taxes when Fund shares are held in a taxable account. These costs, which are not reflected in annual Fund operating expenses or in the Example, affect the Fund's performance. During the most recent fiscal year, the Fund's portfolio turnover rate was 21% of the average value of its portfolio.
Under normal market conditions, at least 80% of the Fund's net assets (plus the amount of any borrowings for investment purposes) will be invested in a diversified portfolio of common stocks of companies that the Fund's portfolio managers believe have long-term growth potential.
The Fund seeks to make investment decisions consistent with the principles of the Catholic Church with respect to a range of social and moral concerns that may include: protecting human life; promoting human dignity; reducing arms production; pursuing economic justice; protecting the environment, and encouraging corporate responsibility. This will be accomplished through the reliance on the principles contained in the United States Conference of Catholic Bishops' (USCCB) Socially Responsible Investing Guidelines (Guidelines). Potential investments for the Fund are first selected for financial soundness and then evaluated according to the Fund's social criteria. The Fund's investment adviser, SEI Investments Management Corporation (SIMC, or the Adviser), has retained a third party environmental, social, and governance research firm to compile a list of restricted securities, using principles contained in the Guidelines, in which the Fund will not be permitted to invest. The Fund will not invest in issuers identified through this process. SIMC reserves the right to modify the criteria from time to time to maintain alignment with evolving Catholic social and moral positions.
The Fund invests in common stocks and other equity securities, which may include preferred stocks, warrants, participation notes and depositary receipts. The Fund invests primarily in securities of domestic companies, but may also, to a lesser extent, invest in securities of foreign companies, which may include companies in emerging markets. The Fund generally invests in larger companies, although it may purchase securities of companies of any size, including small companies. The Fund may invest in exchange-traded funds (ETFs) or equity swaps to obtain exposure to the equity market during high volume periods of investment into the Fund.
SIMC directly manages a portion of the Fund's assets and seeks to enhance performance and reduce market risk. With the remaining assets, the Fund uses a multi-manager approach and strategically allocates the Fund's assets among multiple sub-advisers (each, a Sub-Adviser and collectively, the Sub-Advisers). The allocation is made based on the Adviser's desire to achieve performance objectives while keeping appropriate balance among differing investment styles and philosophies offered by the Sub-Advisers, including growth-oriented, value-oriented, stability-oriented, momentum-oriented, quality-oriented and/or blended approaches to selecting investments. Growth-oriented managers generally select stocks they believe have attractive growth and appreciation potential in light of such characteristics as revenue and earnings growth, expectations from professional financial research analysts and momentum, while stability-oriented managers generally select stocks they believe have sustainable competitive advantages, less economic sensitivity and/or less volatility, and value-oriented managers generally select stocks they believe are attractively valued in light of fundamental characteristics such as assets, capital structure, earnings, and/or cash flows. Quality-oriented managers generally identify businesses that possess quality management teams, favorable industry dynamics and attractive or improving financials and seek to invest in companies that are trading at meaningful discounts relative to intrinsic value by identifying such companies before quality is evident in their financials. Momentum-oriented managers generally select securities that are rising in value and that they believe will continue to rise and sell such investments when they have peaked.
The Fund implements its views on the Guidelines through SIMC's direct investments and a designated Sub-Adviser that acts as an overlay manager. The overlay manager only implements the portfolio recommendations of the other Sub-Advisers, not SIMC. The Sub-Advisers, other than the overlay manager,
provide a model portfolio to the Fund on an ongoing basis that represents their recommendations as to the securities to be purchased, sold or retained by the Fund. The overlay manager constructs a portfolio for the Fund that represents the aggregation of the model portfolios, with the weighting of each Sub-Adviser's model in the total portfolio determined by the Adviser. The overlay manager implements the portfolio consistent with that represented by the aggregation of the model portfolios, but also has the authority to vary from such aggregation: (i) to conform the Fund's securities transactions by avoiding issuers identified as not aligning with the Guidelines; and (ii) to favor, consistent with the Guidelines, securities of companies that are more highly ranked with respect to environmental, social and governance ("ESG") criteria (e.g., company business models, corporate governance policies, relationships with stakeholders, and history of controversies) than other companies in the Fund's portfolio. With respect to the portion of the Fund directly managed by SIMC, in addition to applying the relevant Guidelines, SIMC integrates ESG considerations into portfolio construction through a risk-based framework. This approach evaluates issuer-level ESG risks using third-party data, including ESG Key Issue scores, and incorporates these into a proprietary optimization process. ESG risks that are assessed as insufficiently compensated are penalized within the portfolio construction process, influencing position sizing and security selection. The portfolio is constructed by balancing expected returns, traditional risk factors, and mispriced ESG risks, while maintaining a constraint that the Fund's overall ESG score is equal to or higher than that of the benchmark.
The Fund may sell a security when it becomes substantially overvalued or is experiencing deteriorating fundamentals as a result of changes in portfolio strategy or to help the overlay manager meet the Fund's investment strategies.
The bar chart and the performance table below provide some indication of the risks of investing in the Fund by showing changes in the Fund's performance from year to year for the past ten calendar years and by showing how the Fund's average annual returns for 1, 5 and 10 years and since the Fund's inception compare with those of a broad measure of market performance. The Fund's past performance (before and after taxes) is not necessarily an indication of how the Fund will perform in the future. For current performance information, please call 1-800-DIAL-SEI.
|
|
Best Quarter: 21.46% (6/30/2020) Worst Quarter: -24.09% (3/31/2020) The Fund's Class Y total return (pre-tax) from January 1, 2026 to March 31, 2026 was -2.66%. |
||||||
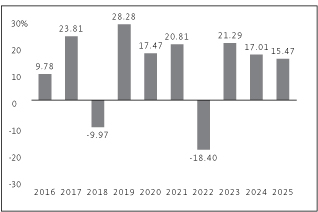
Best Quarter: 21.46% (6/30/2020)
Worst Quarter: -24.09% (3/31/2020)
The Fund's Class Y total return (pre-tax) from January 1, 2026 to March 31, 2026 was -2.66%.
This table compares the Fund's average annual total returns to those of the S&P 500 Index (a broad-based securities market index), and two additional indexes with characteristics relevant to the Fund's investment strategy. The Fund's additional indexes are the Russell 3000 Index and the MSCI All Country World Index. In prior years, the Fund also compared its performance to a blended benchmark composed of the Russell 3000 and the MSCI ACWI ex USA Index weighted 80%/20%.
After-tax returns are calculated using the historical highest individual federal marginal income tax rates and do not reflect the impact of state and local taxes. Your actual after-tax returns will depend on your tax situation and may differ from those shown. After-tax returns shown are not relevant to investors who hold their Fund shares through tax-deferred arrangements, such as 401(k) plans or individual retirement accounts.
|
Catholic Values Equity Fund — Class Y |
1 Year |
5 Years |
10 Years |
Since Inception (05/29/2015) |
|||||||||||||||
|
Return Before Taxes |
15.47 |
% |
10.07 |
% |
11.54 |
% |
10.11 |
% |
|||||||||||
|
Return After Taxes on Distributions |
13.64 |
% |
8.17 |
% |
10.18 |
% |
8.83 |
% |
|||||||||||
|
Return After Taxes on Distributions and Sale of Fund Shares |
10.34 |
% |
7.54 |
% |
9.21 |
% |
8.01 |
% |
|||||||||||
|
S&P 500 Index Return (reflects no deduction for fees, expenses or taxes) |
17.88 |
% |
14.42 |
% |
14.82 |
% |
13.73 |
% |
|||||||||||
|
Russell 3000 Index Return (reflects no deduction for fees, expenses or taxes) |
17.15 |
% |
13.15 |
% |
14.29 |
% |
13.09 |
% |
|||||||||||
|
MSCI All Country World Index Return (reflects no deduction for fees, expenses or taxes) |
22.34 |
% |
11.19 |
% |
11.72 |
% |
10.25 |
% |
|||||||||||