Pay vs Performance Disclosure - USD ($)
Apr. 30, 2026
Apr. 30, 2025
Apr. 30, 2024
Apr. 30, 2023
Apr. 30, 2022
PAY VERSUS PERFORMANCE
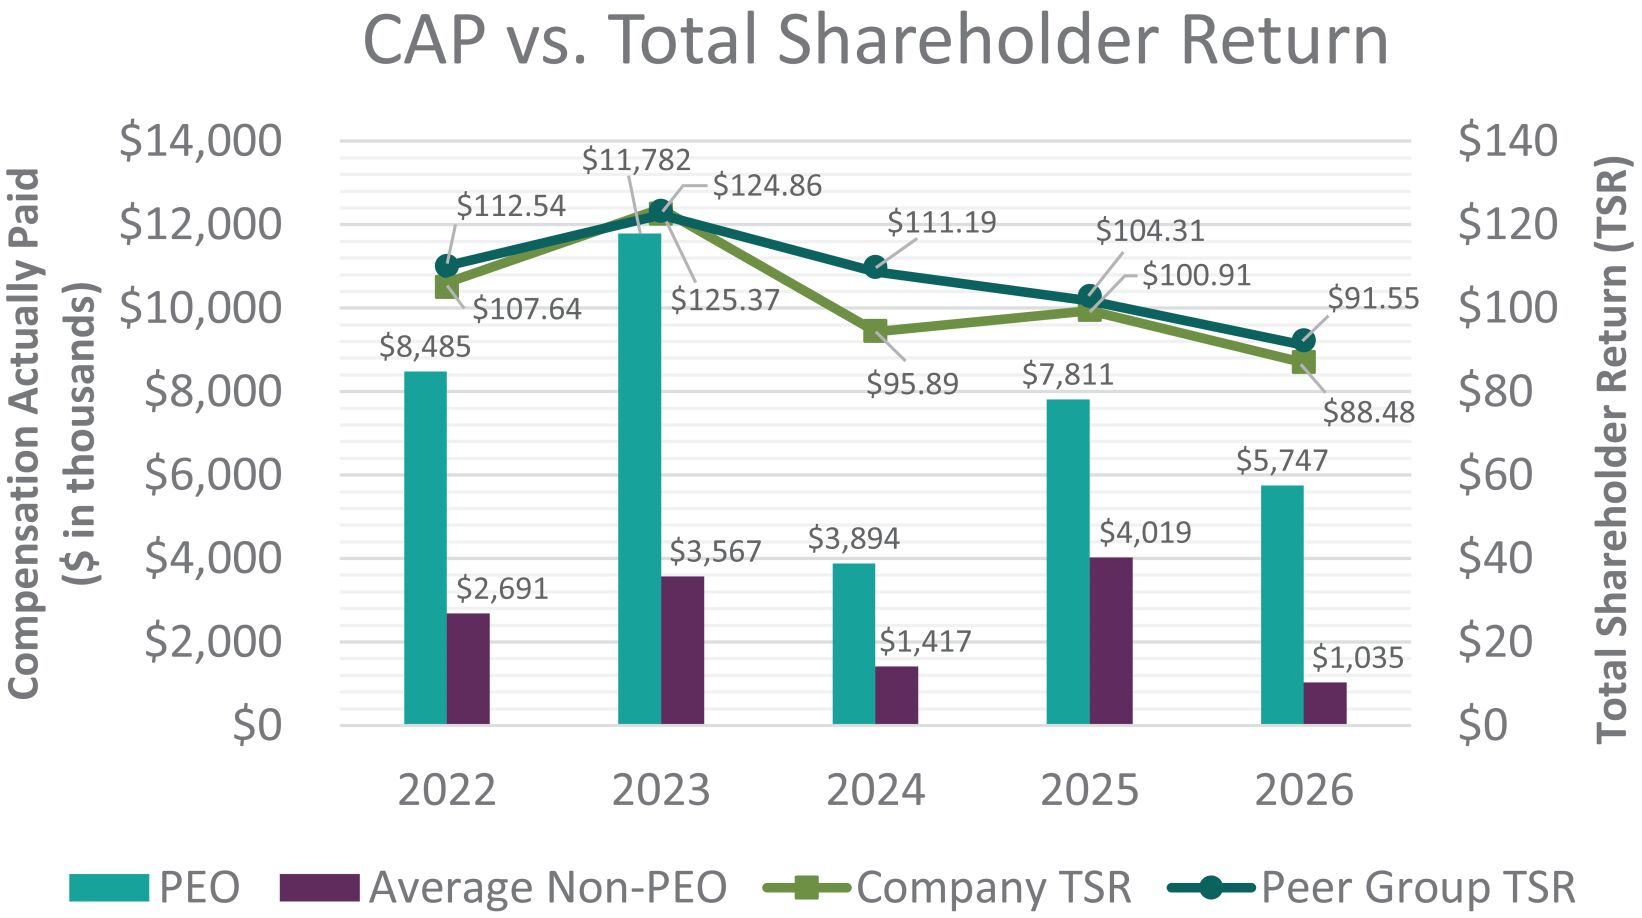
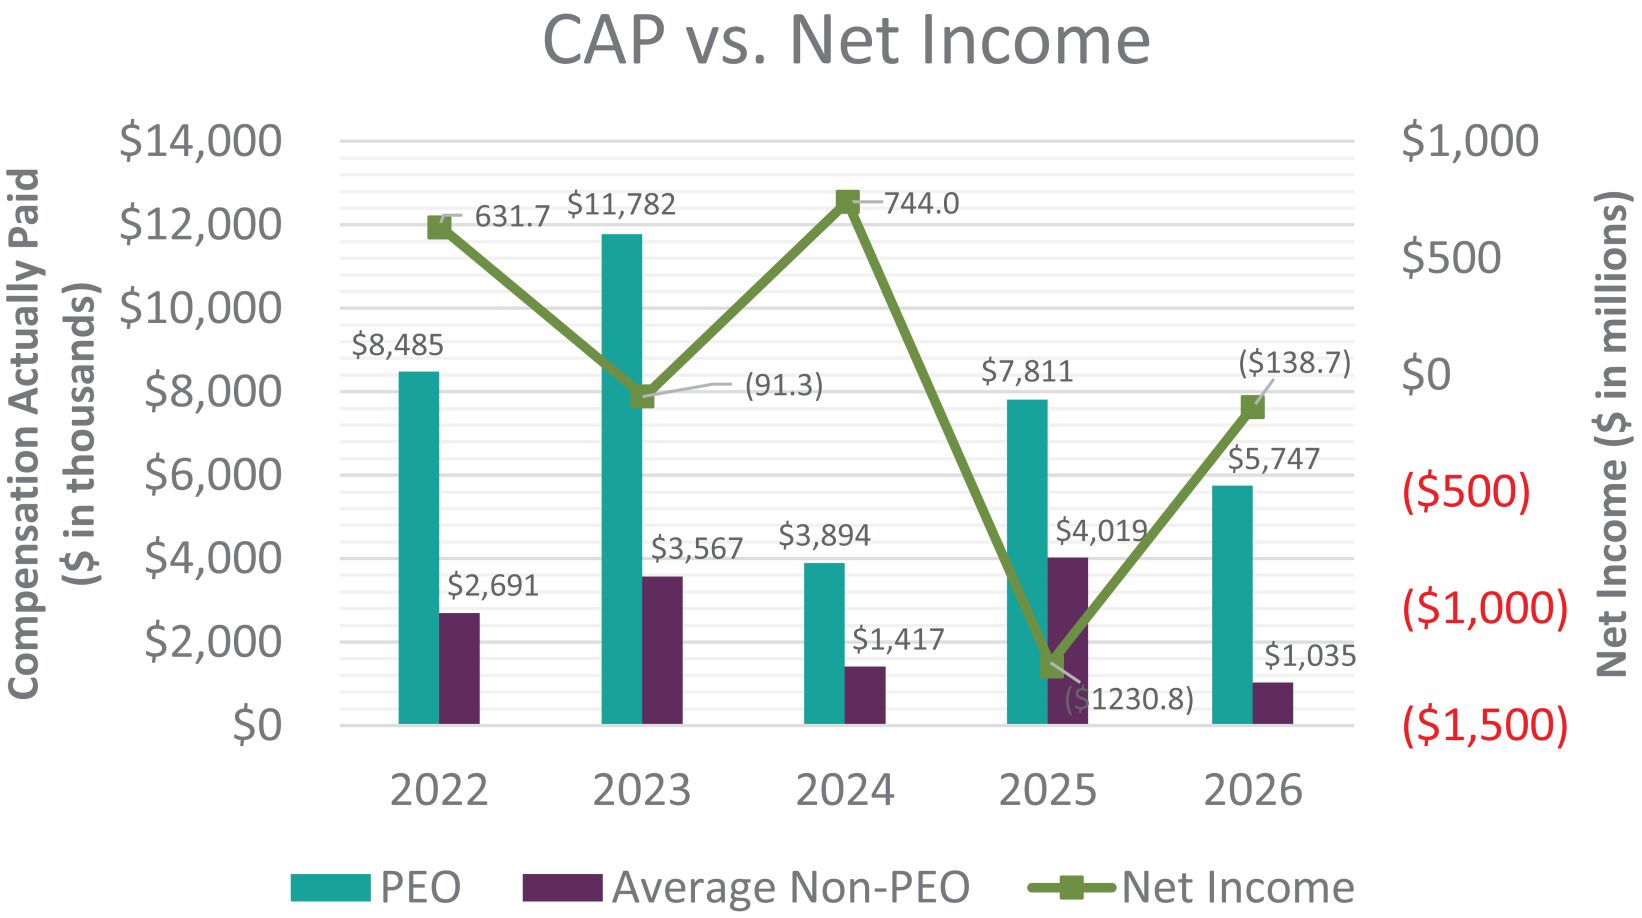
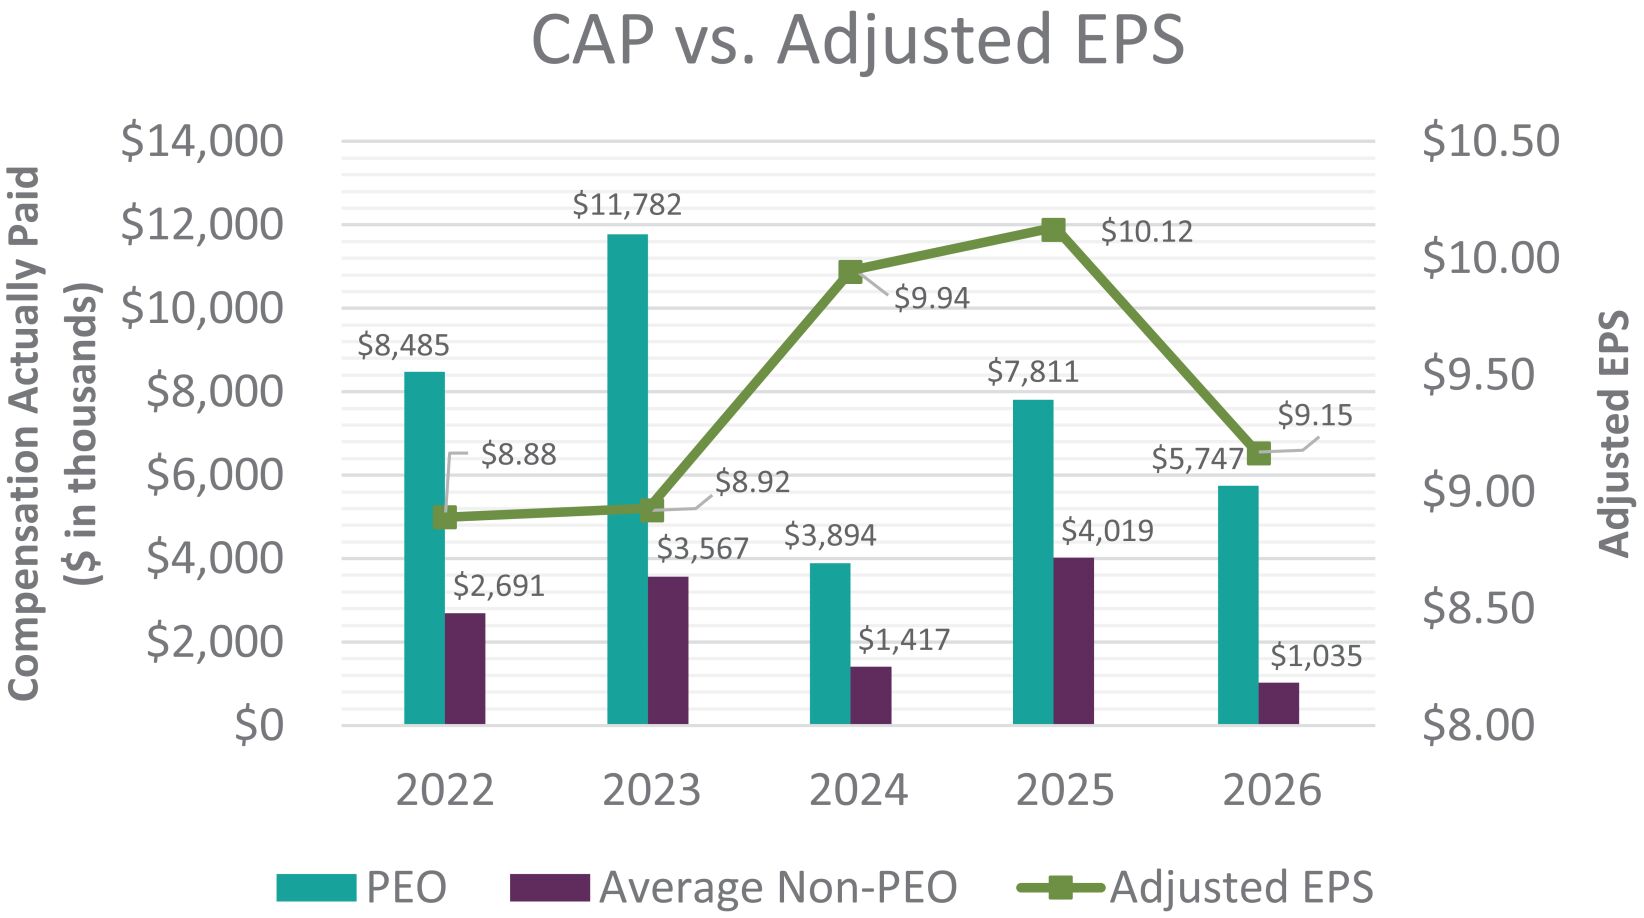
The SEC requires us to disclose the following pay versus performance information. The table below provides information concerning the relationship between compensation actually paid to Named Executive Officers, calculated in accordance with SEC rules, and Company performance for fiscal years 2026, 2025, 2024, 2023, and 2022.
(a) |
(b) |
(c) |
(d) |
(e) |
(f) |
(g) |
(h) |
(i) | ||||||||||||||||||||||||||||||||
Value of Initial Fixed $100 |
||||||||||||||||||||||||||||||||||||||||
Fiscal Year |
Summary Compensation Table Total for PEO ($) |
Compensation Actually Paid to PEO ($) (1) (2) |
Average Summary Compensation Table Total for Non-PEO Named Executive Officers ($) |
Average Compensation Actually Paid to Non-PEO Named Executive Officers ($) (1) (3) |
Total Shareholder Return ($) |
Peer Group Total Shareholder Return ($) (4) |
Net Income (Loss) ($ Millions) (5) |
Adjusted EPS ($) (6) | ||||||||||||||||||||||||||||||||
2026 |
10,935,216 | 5,746,789 | 3,388,075 | 1,035,439 | 88.48 | 91.55 | (138.7 | ) | 9.15 | |||||||||||||||||||||||||||||||
2025 |
10,976,383 | 7,810,695 | 4,570,585 | 4,019,357 | 100.91 | 104.31 | (1,230.8 | ) | 10.12 | |||||||||||||||||||||||||||||||
2024 |
10,367,569 | 3,893,704 | 3,161,327 | 1,416,797 | 95.89 | 111.19 | 744.0 | 9.94 | ||||||||||||||||||||||||||||||||
2023 |
11,348,537 | 11,781,764 | 3,088,211 | 3,566,854 | 124.86 | 125.37 | (91.3 | ) | 8.92 | |||||||||||||||||||||||||||||||
2022 |
8,511,639 | 8,485,002 | 2,883,391 | 2,690,945 | 107.64 | 112.54 | 631.7 | 8.88 | ||||||||||||||||||||||||||||||||
| (1) | Mark Smucker served as our principal executive officer (“PEO”) for 2022, 2023, 2024, 2025, and 2026. Our non-PEO Named Executive Officers (“NEOs”) included Tucker Marshall, John Brase, Jeannette Knudsen, and Richard Smucker for 2022, and Tucker Marshall, John Brase, Jeannette Knudsen, and Jill Penrose for 2023, 2024, and 2025, and Tucker Marshall, John Brase, Robert Ferguson, Jeannette Knudsen, and Jill Penrose for 2026. |
| (2) | Compensation Actually Paid to our PEO reflects the following adjustments from Total Compensation reported in the Summary Compensation Table: |
PEO |
2026 |
2025 |
2024 |
2023 |
2022 | ||||||||||||||||||||
Summary Compensation Table (“SCT”) Total for PEO (Column (b)) |
10,935,216 | 10,976,383 | 10,367,569 | 11,348,537 | 8,511,639 | ||||||||||||||||||||
Less: Stock Award Values Reported in SCT |
(6,274,438 | ) | (6,549,243 | ) | (5,188,571 | ) | (5,014,262 | ) | (4,143,838 | ) | |||||||||||||||
Less: Option Award Values Reported in SCT |
— | — | (1,297,115 | ) | (1,253,526 | ) | (1,381,245 | ) | |||||||||||||||||
Plus: Fair Value of Outstanding Unvested Equity Awards Granted in the Covered Year |
6,346,952 | 6,602,624 | 4,287,020 | 7,679,823 | 5,925,060 | ||||||||||||||||||||
Change in Fair Value of Outstanding Unvested Equity Awards from Prior Years |
(3,436,952 | ) | (2,079,119 | ) | (4,341,705 | ) | 575,031 | (1,311,156 | ) | ||||||||||||||||
Change in Fair Value of Equity Awards from Prior Years that Vested in the Covered Year |
(1,246,849 | ) | (186,038 | ) | (141,039 | ) | (819,058 | ) | 226,270 | ||||||||||||||||
Less: Fair Value of Equity Awards from Prior Years that failed to vest in the Covered Year |
— | — | — | — | — | ||||||||||||||||||||
Plus: Dollar Value of Dividends Paid on Equity Awards in the Covered Year |
282,479 | 280,291 | 207,545 | 323,409 | 279,441 | ||||||||||||||||||||
Change in Fair Value for Equity Award Modifications |
— | — | — | — | — | ||||||||||||||||||||
Less: Aggregate Change in Actuarial Present Value of Pension Benefits |
(859,619 | ) | (1,234,203 | ) | — | (1,160,679 | ) | — | |||||||||||||||||
Plus: Service Cost of Pension Benefits |
— | — | — | 102,489 | 378,831 | ||||||||||||||||||||
Plus: Prior Service Cost of Pension Benefits |
— | — | — | — | — | ||||||||||||||||||||
Compensation Actually Paid to PEO (Column (c)) |
5,746,789 |
7,810,695 |
3,893,704 |
11,781,764 |
8,485,002 |
||||||||||||||||||||
| (3) | Average Compensation Actually Paid to our non-PEO NEOs reflects the following adjustments from Total Compensation reported in the Summary Compensation Table: |
Average for Non-PEO NEOs |
2026 |
2025 |
2024 |
2023 |
2022 |
|||||||||||||||
Average SCT Total for Non-PEOs (Column (d)) |
3,388,075 | 4,570,585 | 3,161,327 | 3,088,211 | 2,883,391 | |||||||||||||||
Less: Stock Award Values Reported in SCT |
(1,629,475 | ) | (3,302,319 | ) | (1,288,159 | ) | (1,205,149 | ) | (1,110,969 | ) | ||||||||||
Less: Option Award Values Reported in SCT |
— | — | (322,017 | ) | (301,271 | ) | (370,309 | ) | ||||||||||||
Plus: Fair Value of Outstanding Unvested Equity Awards Granted in the Covered Year |
1,226,257 | 3,328,374 | 1,064,327 | 1,845,789 | 1,498,861 | |||||||||||||||
Change in Fair Value of Outstanding Unvested Equity Awards from Prior Years |
(871,447 | ) | (506,378 | ) | (1,228,516 | ) | 125,057 | (255,680 | ) | |||||||||||
Change in Fair Value of Equity Awards from Prior Years that Vested in the Covered Year |
(207,581 | ) | (147,696 | ) | (26,990 | ) | (25,573 | ) | 26,629 | |||||||||||
Less: Fair Value of Equity Awards from Prior Years that failed to vest in the Covered Year |
— | — | — | — | — | |||||||||||||||
Less: Fair Value of Equity Awards forfeited during the Covered Year |
(936,067 | ) | — | — | — | — | ||||||||||||||
Plus: Dollar Value of Dividends Paid on Equity Awards in the Covered Year |
69,117 | 78,927 | 56,825 | 39,790 | 19,022 | |||||||||||||||
Change in Fair Value for Equity Award Modifications |
— | — | — | — | — | |||||||||||||||
Less: Aggregate Change in Actuarial Present Value of Pension Benefits |
(3,440 | ) | (2,136 | ) | — | — | — | |||||||||||||
Plus: Service Cost of Pension Benefits |
— | — | — | — | — | |||||||||||||||
Plus: Prior Service Cost of Pension Benefits |
— | — | — | — | — | |||||||||||||||
Compensation Actually Paid to Non-PEO (Column (e)) |
1,035,439 |
4,019,357 |
1,416,797 |
3,566,854 |
2,690,945 |
|||||||||||||||
| (4) | Represents the cumulative total shareholder return of the S&P Packaged Foods & Meats, which we consider to be our peer group for purposes of the performance graph included in our Annual Report on Form 10-K. |
| (5) | The fiscal year 2023 net loss includes the loss on the divestiture of certain pet food brands. The fiscal year 2025 net loss includes the impairment charges related to the goodwill of the Sweet Baked Snacks reporting unit, the impairment charges related to the Hostess brand indefinite-lived trademark, and the loss on the divestitures of certain Sweet Baked Snacks value brands and the Voortman business. The fiscal year 2026 net loss includes the impairment charge related to the goodwill of the Sweet Baked Snacks reporting unit, the impairment charge related to the Hostess brand indefinite-lived trademark, and the unanticipated impacts of tariffs. For further information, please see the Consolidated Financial Statements in our Annual Report on Form 10-K. |
| (6) | For information regarding the calculation of Adjusted Earnings per Share, please see the Compensation Discussion and Analysis section in this Proxy Statement. |
10-K.
| (2) | Compensation Actually Paid to our PEO reflects the following adjustments from Total Compensation reported in the Summary Compensation Table: |
PEO |
2026 |
2025 |
2024 |
2023 |
2022 | ||||||||||||||||||||
Summary Compensation Table (“SCT”) Total for PEO (Column (b)) |
10,935,216 | 10,976,383 | 10,367,569 | 11,348,537 | 8,511,639 | ||||||||||||||||||||
Less: Stock Award Values Reported in SCT |
(6,274,438 | ) | (6,549,243 | ) | (5,188,571 | ) | (5,014,262 | ) | (4,143,838 | ) | |||||||||||||||
Less: Option Award Values Reported in SCT |
— | — | (1,297,115 | ) | (1,253,526 | ) | (1,381,245 | ) | |||||||||||||||||
Plus: Fair Value of Outstanding Unvested Equity Awards Granted in the Covered Year |
6,346,952 | 6,602,624 | 4,287,020 | 7,679,823 | 5,925,060 | ||||||||||||||||||||
Change in Fair Value of Outstanding Unvested Equity Awards from Prior Years |
(3,436,952 | ) | (2,079,119 | ) | (4,341,705 | ) | 575,031 | (1,311,156 | ) | ||||||||||||||||
Change in Fair Value of Equity Awards from Prior Years that Vested in the Covered Year |
(1,246,849 | ) | (186,038 | ) | (141,039 | ) | (819,058 | ) | 226,270 | ||||||||||||||||
Less: Fair Value of Equity Awards from Prior Years that failed to vest in the Covered Year |
— | — | — | — | — | ||||||||||||||||||||
Plus: Dollar Value of Dividends Paid on Equity Awards in the Covered Year |
282,479 | 280,291 | 207,545 | 323,409 | 279,441 | ||||||||||||||||||||
Change in Fair Value for Equity Award Modifications |
— | — | — | — | — | ||||||||||||||||||||
Less: Aggregate Change in Actuarial Present Value of Pension Benefits |
(859,619 | ) | (1,234,203 | ) | — | (1,160,679 | ) | — | |||||||||||||||||
Plus: Service Cost of Pension Benefits |
— | — | — | 102,489 | 378,831 | ||||||||||||||||||||
Plus: Prior Service Cost of Pension Benefits |
— | — | — | — | — | ||||||||||||||||||||
Compensation Actually Paid to PEO (Column (c)) |
5,746,789 |
7,810,695 |
3,893,704 |
11,781,764 |
8,485,002 |
||||||||||||||||||||
| (3) | Average Compensation Actually Paid to our non-PEO NEOs reflects the following adjustments from Total Compensation reported in the Summary Compensation Table: |
Average for Non-PEO NEOs |
2026 |
2025 |
2024 |
2023 |
2022 |
|||||||||||||||
Average SCT Total for Non-PEOs (Column (d)) |
3,388,075 | 4,570,585 | 3,161,327 | 3,088,211 | 2,883,391 | |||||||||||||||
Less: Stock Award Values Reported in SCT |
(1,629,475 | ) | (3,302,319 | ) | (1,288,159 | ) | (1,205,149 | ) | (1,110,969 | ) | ||||||||||
Less: Option Award Values Reported in SCT |
— | — | (322,017 | ) | (301,271 | ) | (370,309 | ) | ||||||||||||
Plus: Fair Value of Outstanding Unvested Equity Awards Granted in the Covered Year |
1,226,257 | 3,328,374 | 1,064,327 | 1,845,789 | 1,498,861 | |||||||||||||||
Change in Fair Value of Outstanding Unvested Equity Awards from Prior Years |
(871,447 | ) | (506,378 | ) | (1,228,516 | ) | 125,057 | (255,680 | ) | |||||||||||
Change in Fair Value of Equity Awards from Prior Years that Vested in the Covered Year |
(207,581 | ) | (147,696 | ) | (26,990 | ) | (25,573 | ) | 26,629 | |||||||||||
Less: Fair Value of Equity Awards from Prior Years that failed to vest in the Covered Year |
— | — | — | — | — | |||||||||||||||
Less: Fair Value of Equity Awards forfeited during the Covered Year |
(936,067 | ) | — | — | — | — | ||||||||||||||
Plus: Dollar Value of Dividends Paid on Equity Awards in the Covered Year |
69,117 | 78,927 | 56,825 | 39,790 | 19,022 | |||||||||||||||
Change in Fair Value for Equity Award Modifications |
— | — | — | — | — | |||||||||||||||
Less: Aggregate Change in Actuarial Present Value of Pension Benefits |
(3,440 | ) | (2,136 | ) | — | — | — | |||||||||||||
Plus: Service Cost of Pension Benefits |
— | — | — | — | — | |||||||||||||||
Plus: Prior Service Cost of Pension Benefits |
— | — | — | — | — | |||||||||||||||
Compensation Actually Paid to Non-PEO (Column (e)) |
1,035,439 |
4,019,357 |
1,416,797 |
3,566,854 |
2,690,945 |
|||||||||||||||
Tabular List of Financial Performance Measures
The following represent the most important financial performance measures used to link compensation actually paid to Company performance. Please see the Compensation Discussion and Analysis section in this Proxy Statement for further details.
 |
Adjusted Earnings per Share |
|
|
Adjusted Operating Income |
|
|
Net Sales |
|
|
Free Cash Flow |